-
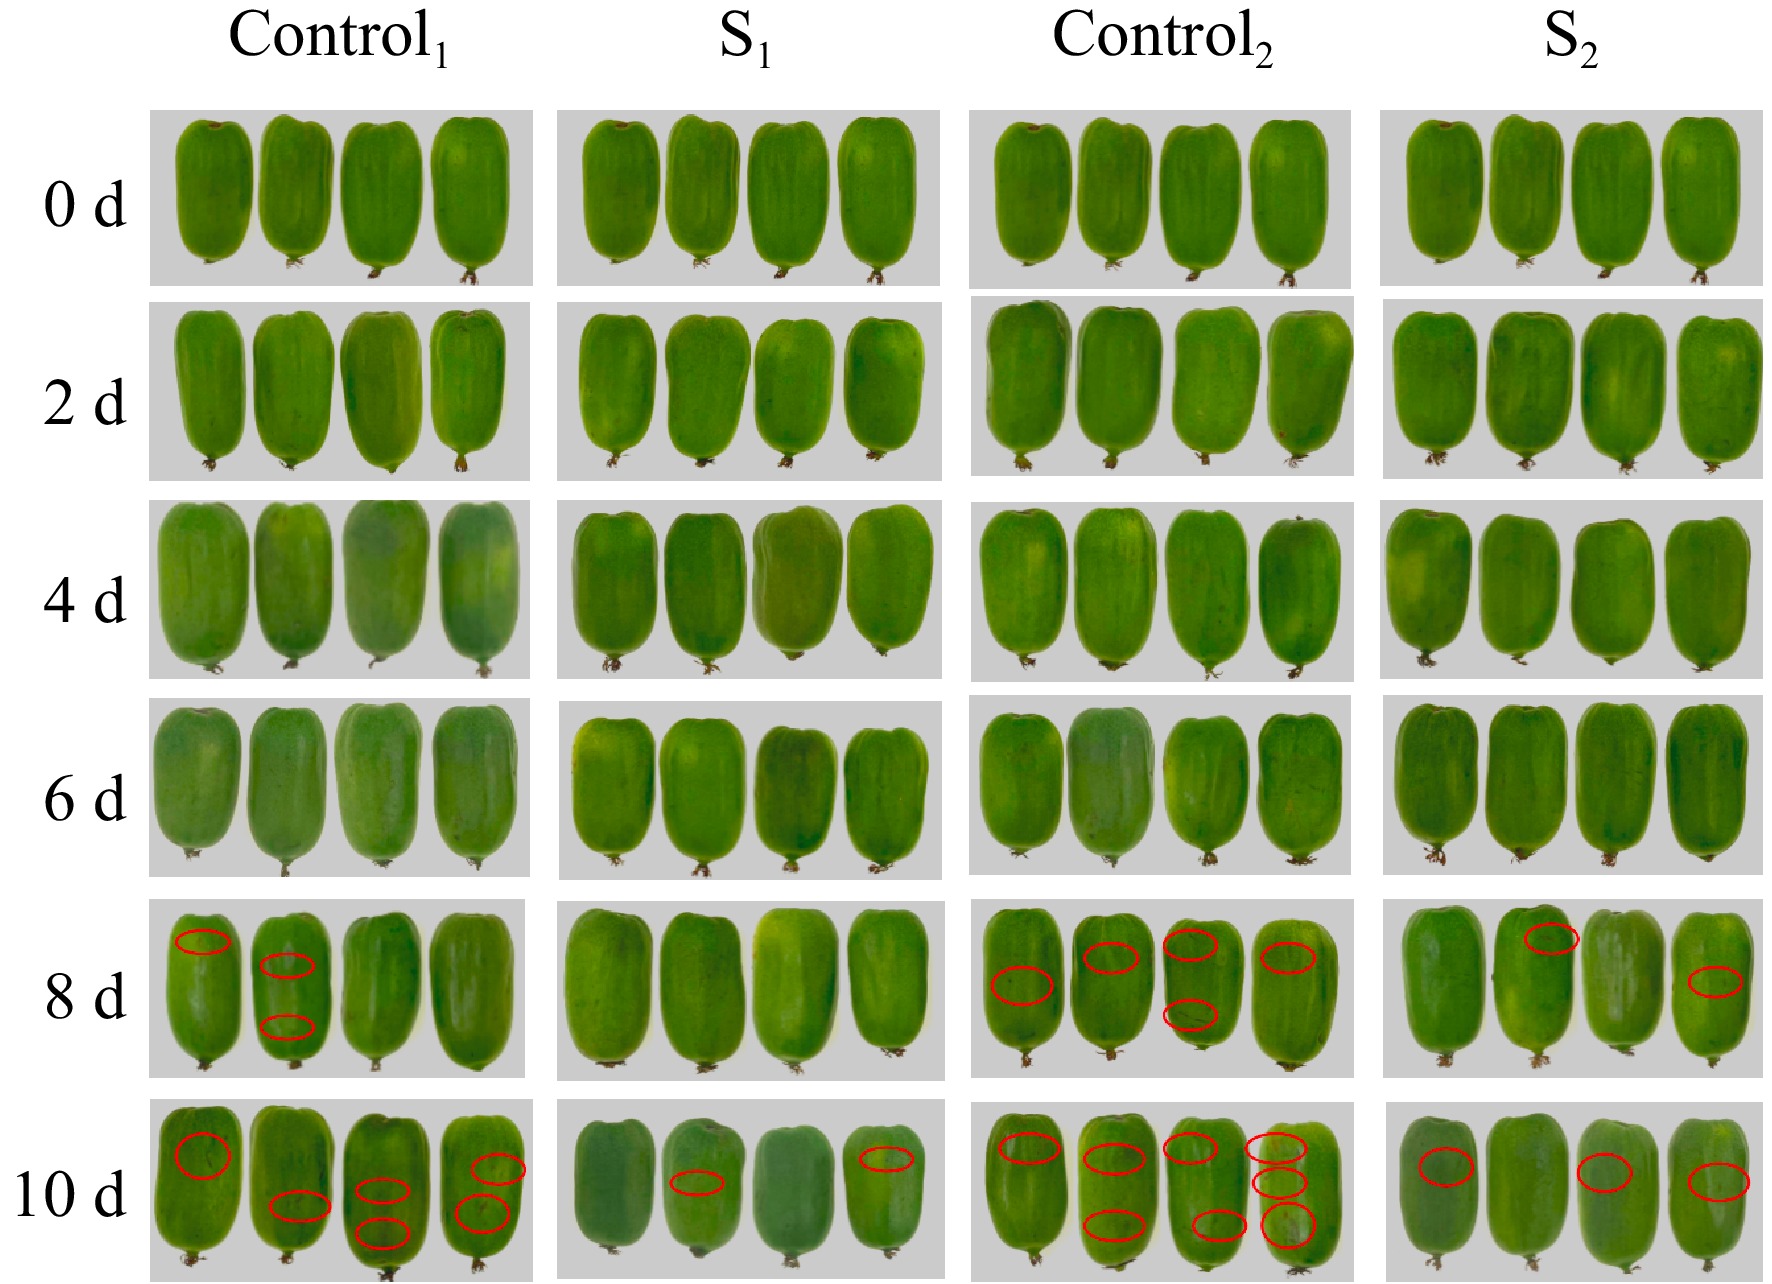
Figure 1.
Effect of 0–10 d water loss treatment on appearance quality of Actinidia arguta.
-
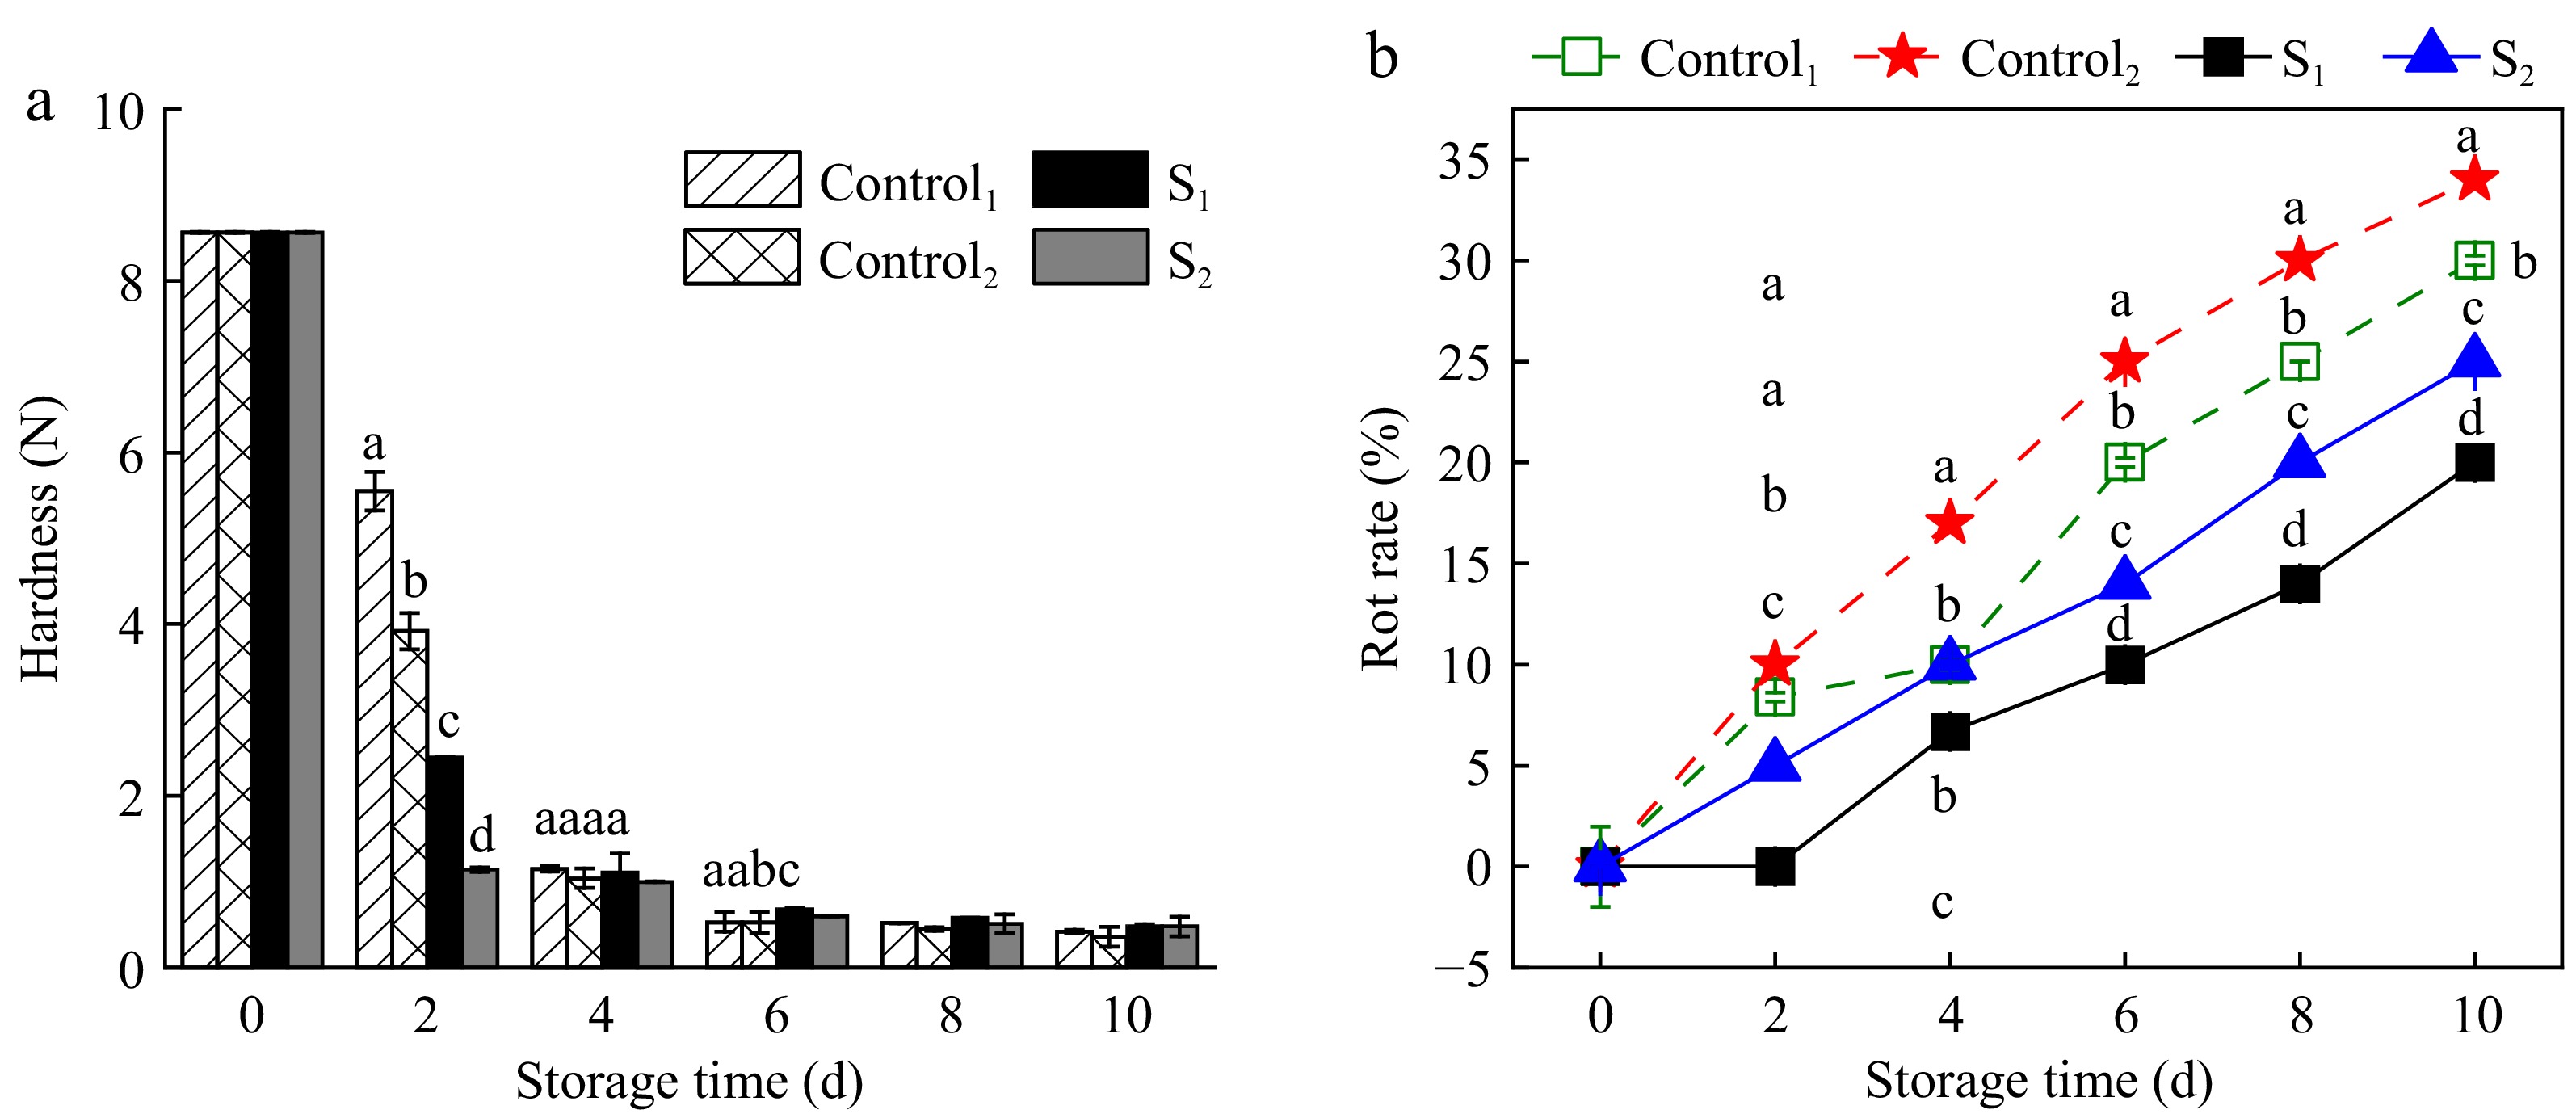
Figure 2.
Effect of water loss treatment on (a) hardness and (b) decay rate of Actinidia arguta. The mean values were compared using Duncan's multiple range test at a significance of p < 0.05.
-
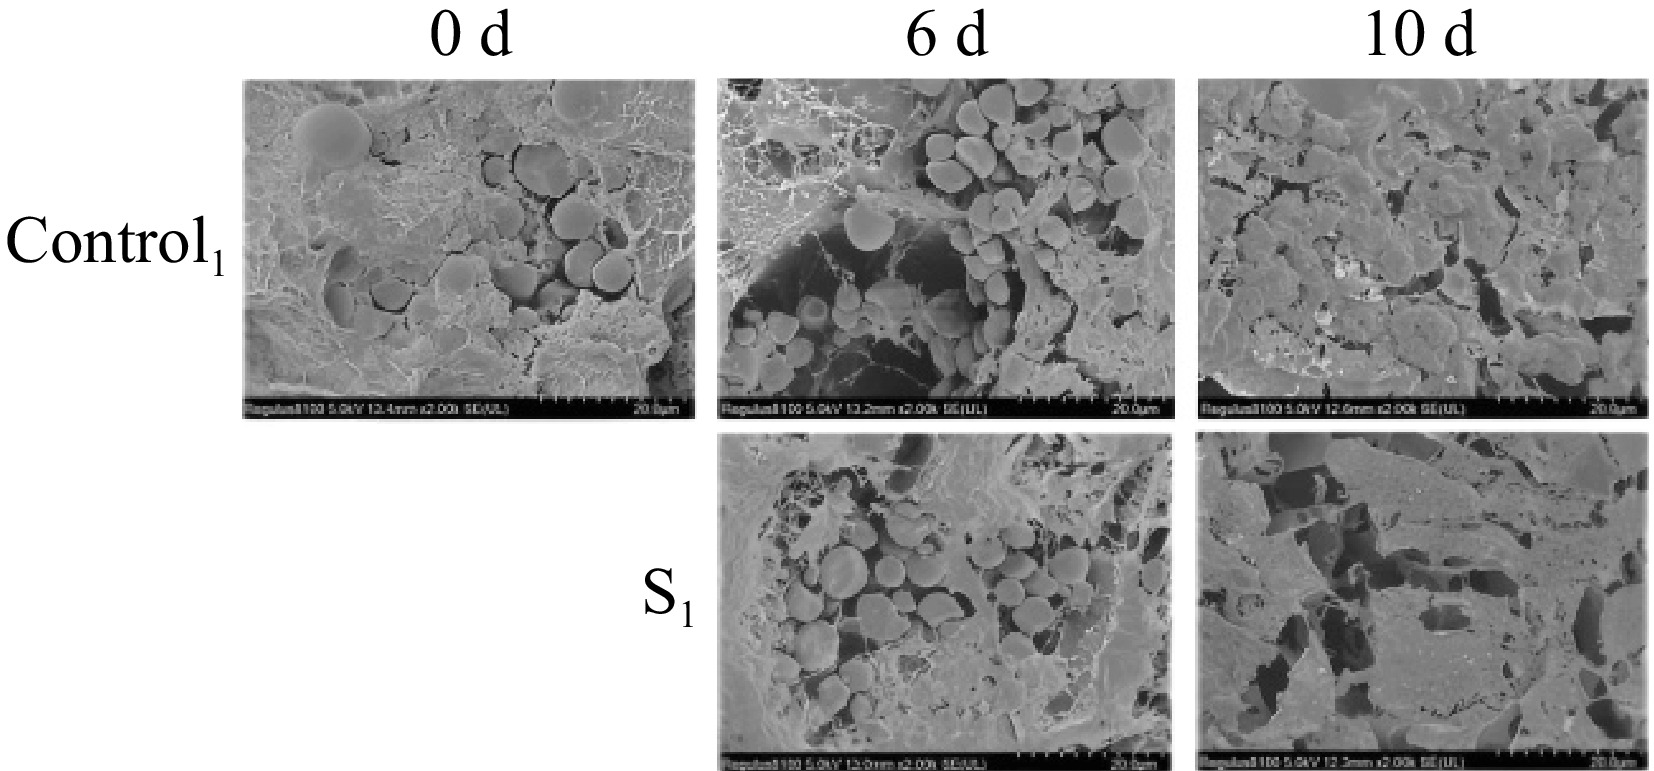
Figure 3.
Morphological observation and comparison of postharvest Actinidia arguta by water loss treatment under SEM in 0, 6, and 10 d control group and treatment group S1.
-
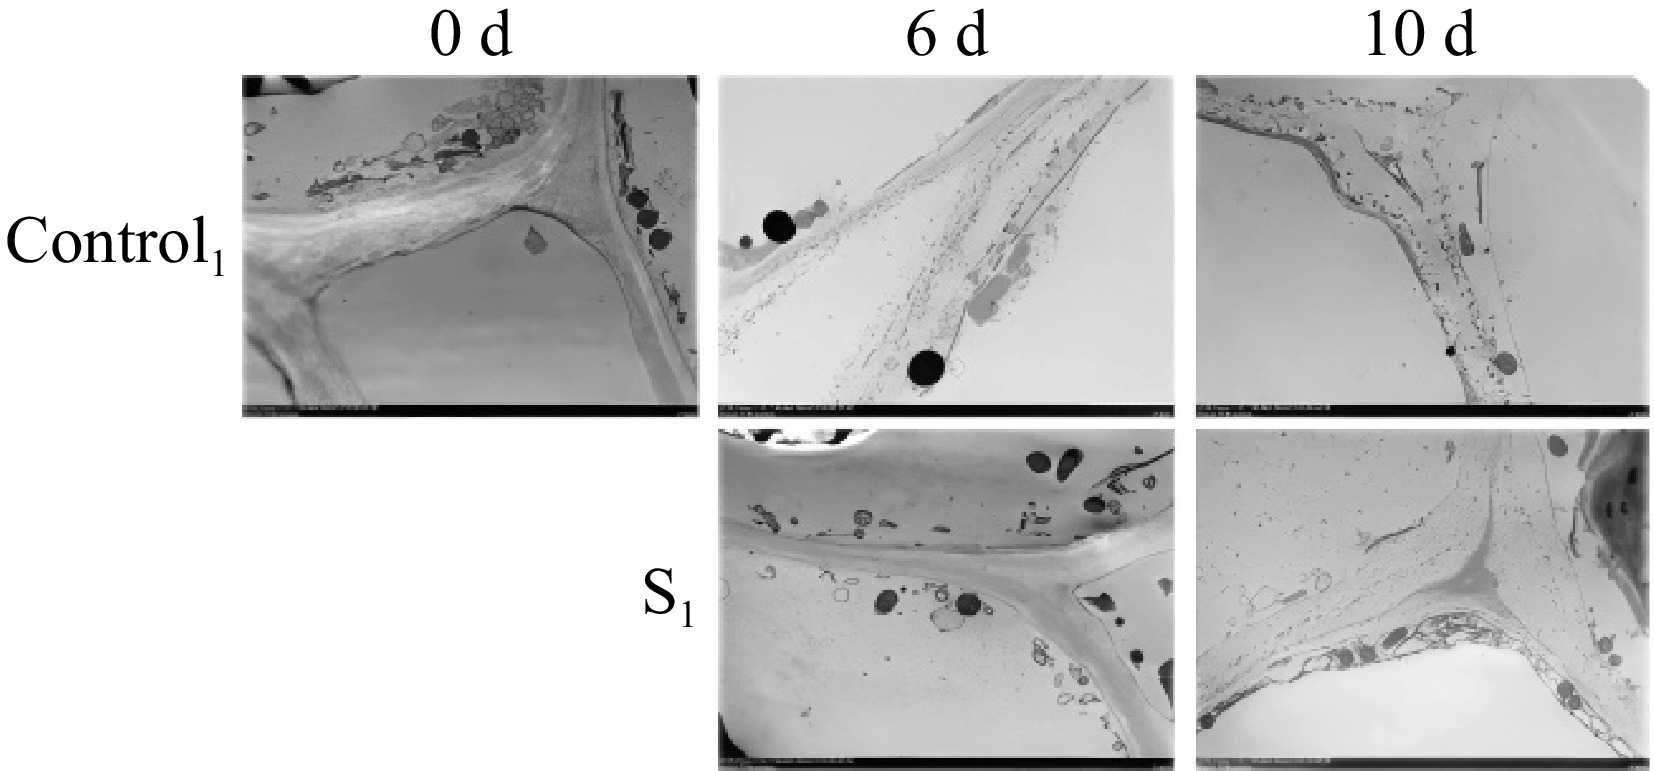
Figure 4.
Observation and comparison of postharvest morphology of Actinidia arguta fruit under TEM after water loss treatment in 0, 6, and 10 d control group and treatment group S1.
-
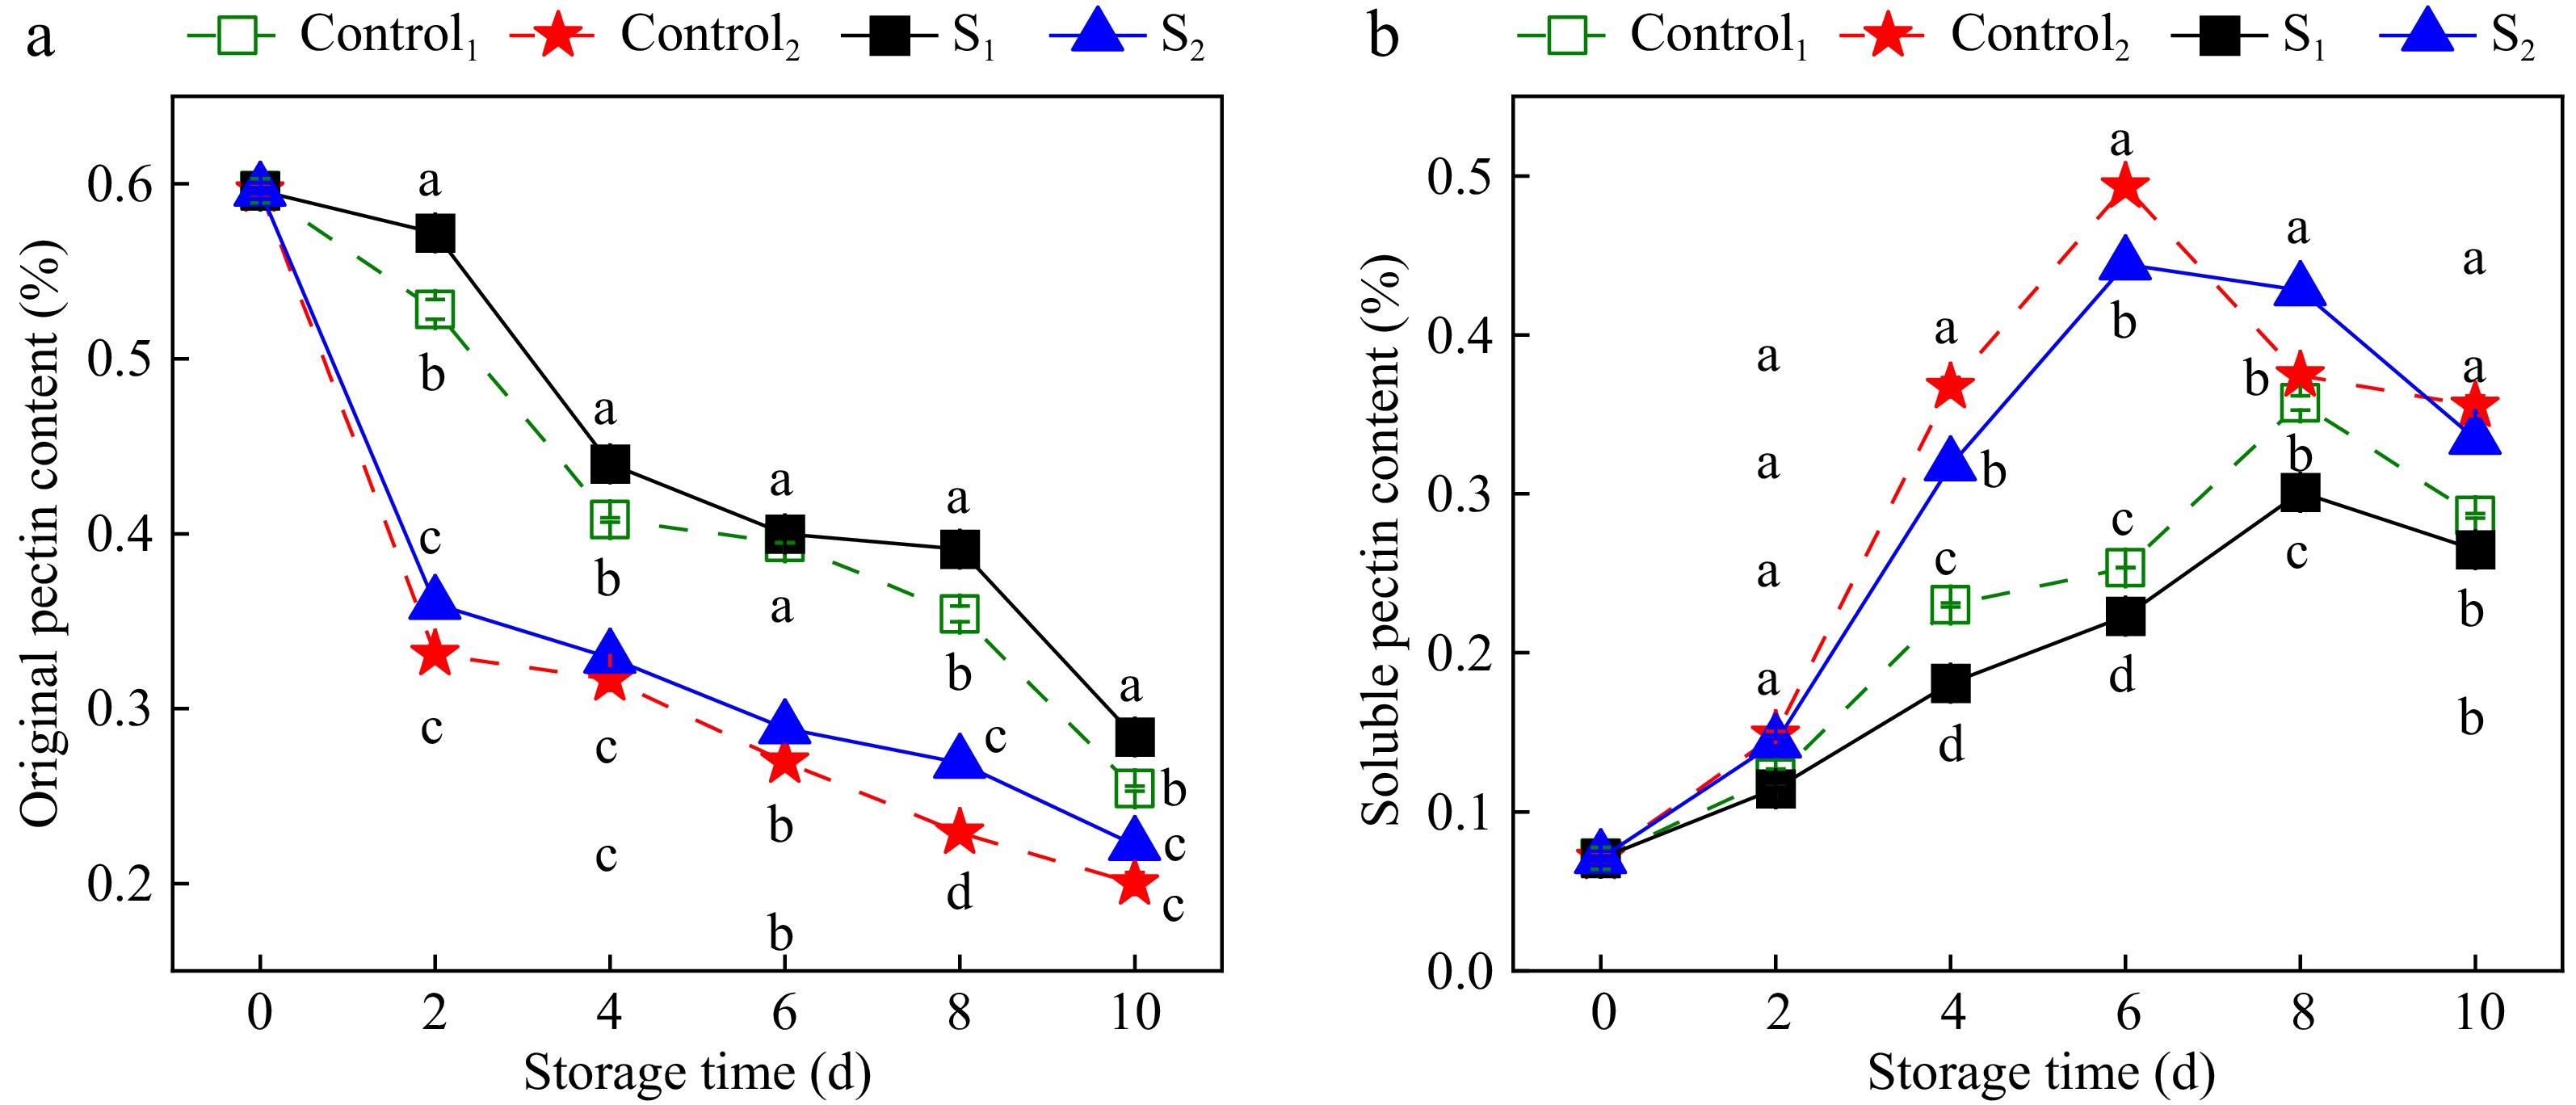
Figure 5.
Effect of water loss treatment on insouble pectin and soluble pectin of Actinidia arguta. The mean values were compared using Duncan's multiple range test at a significance of p < 0.05.
-
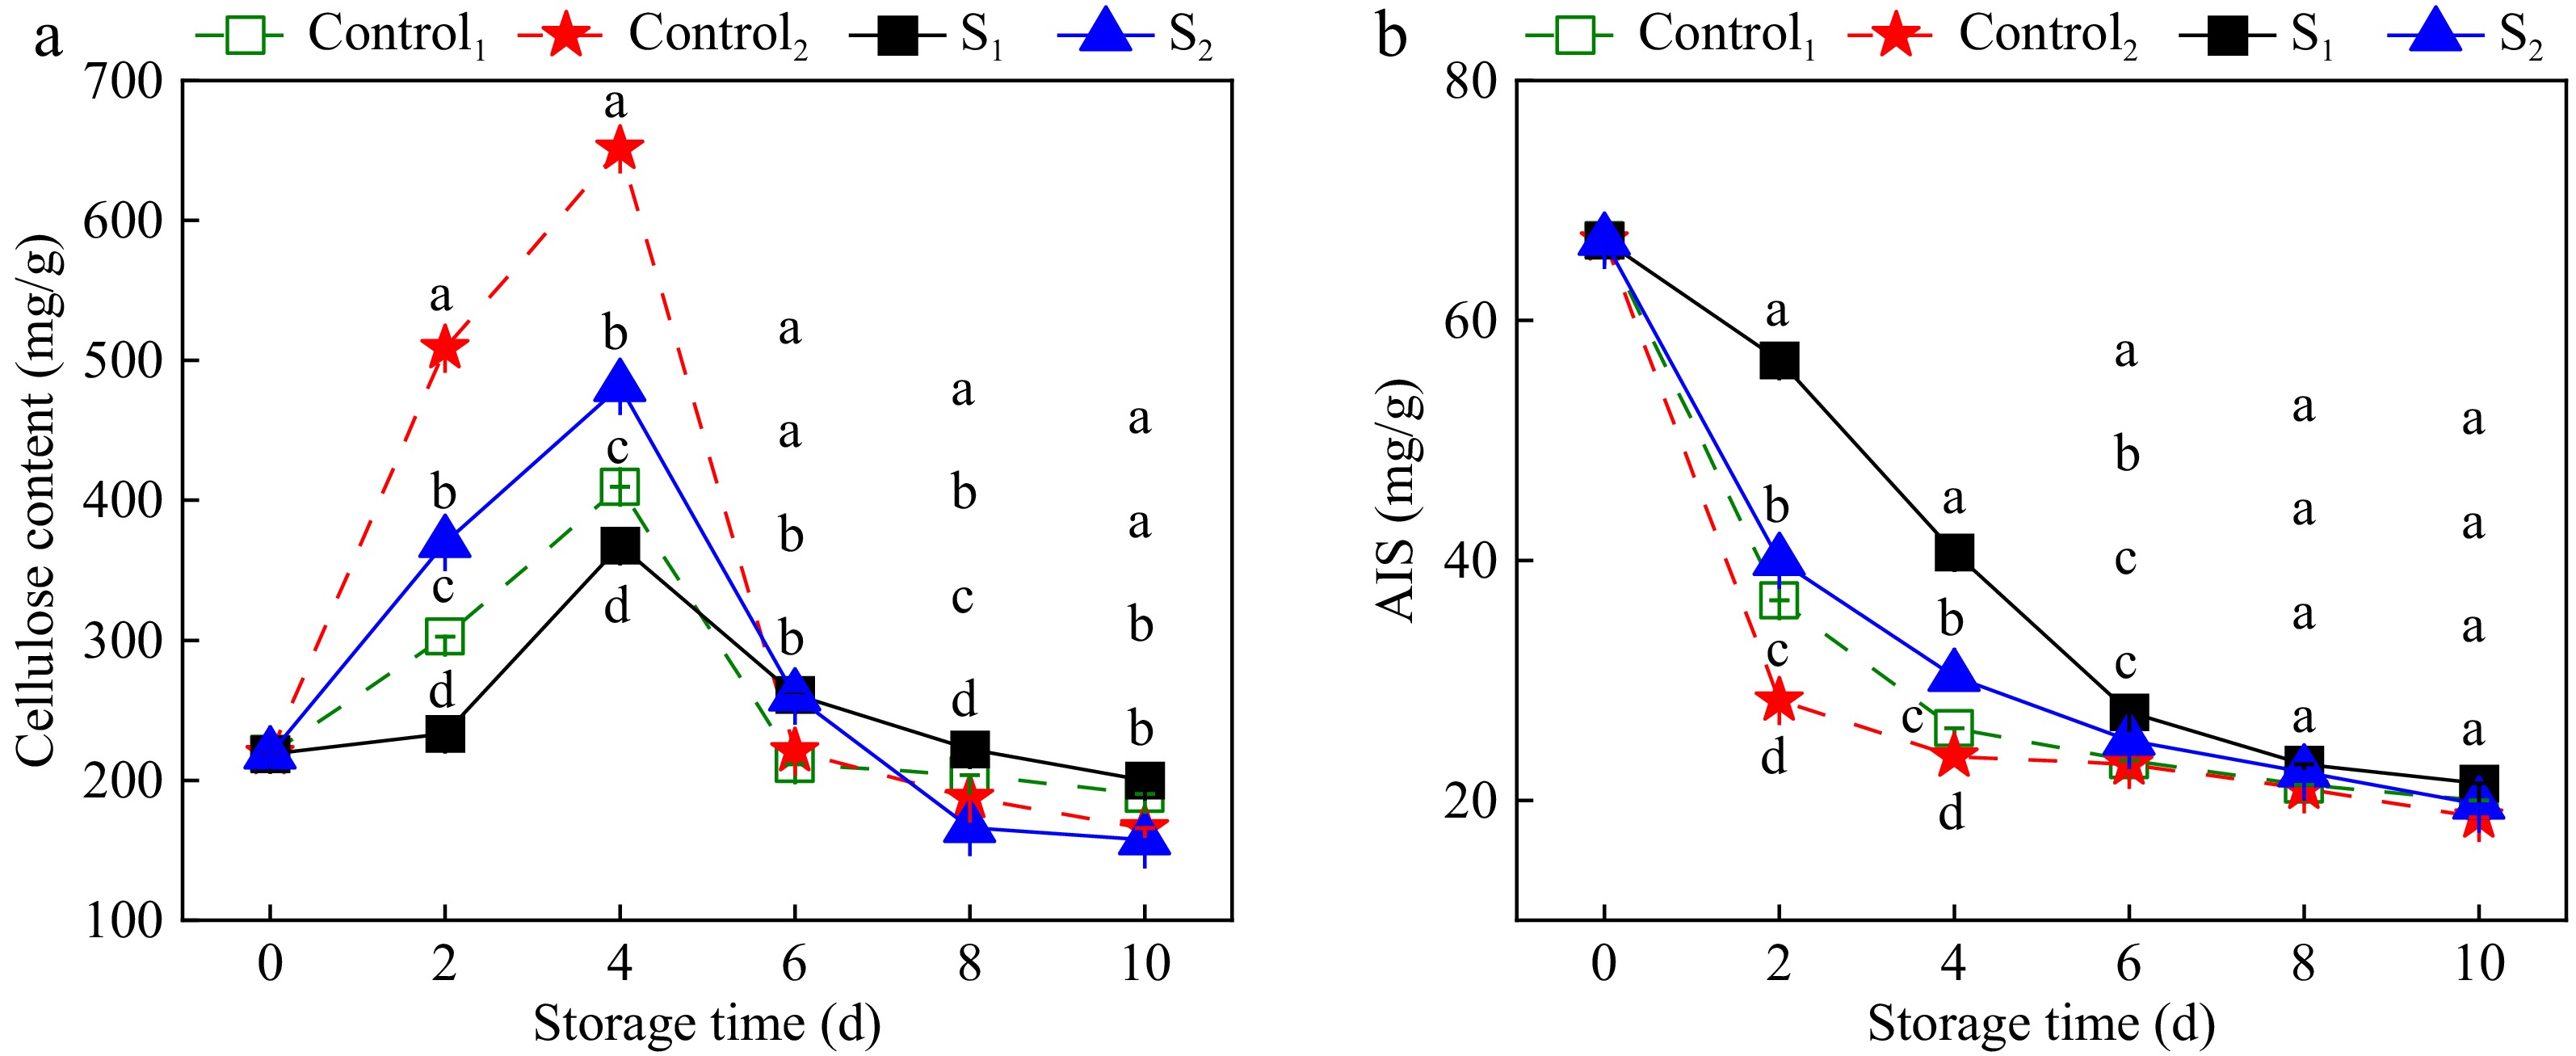
Figure 6.
Effect of water loss treatment on cellulose and AIS in Actinidia arguta. The mean values were compared using Duncan's multiple range test at a significance of p < 0.05.
-
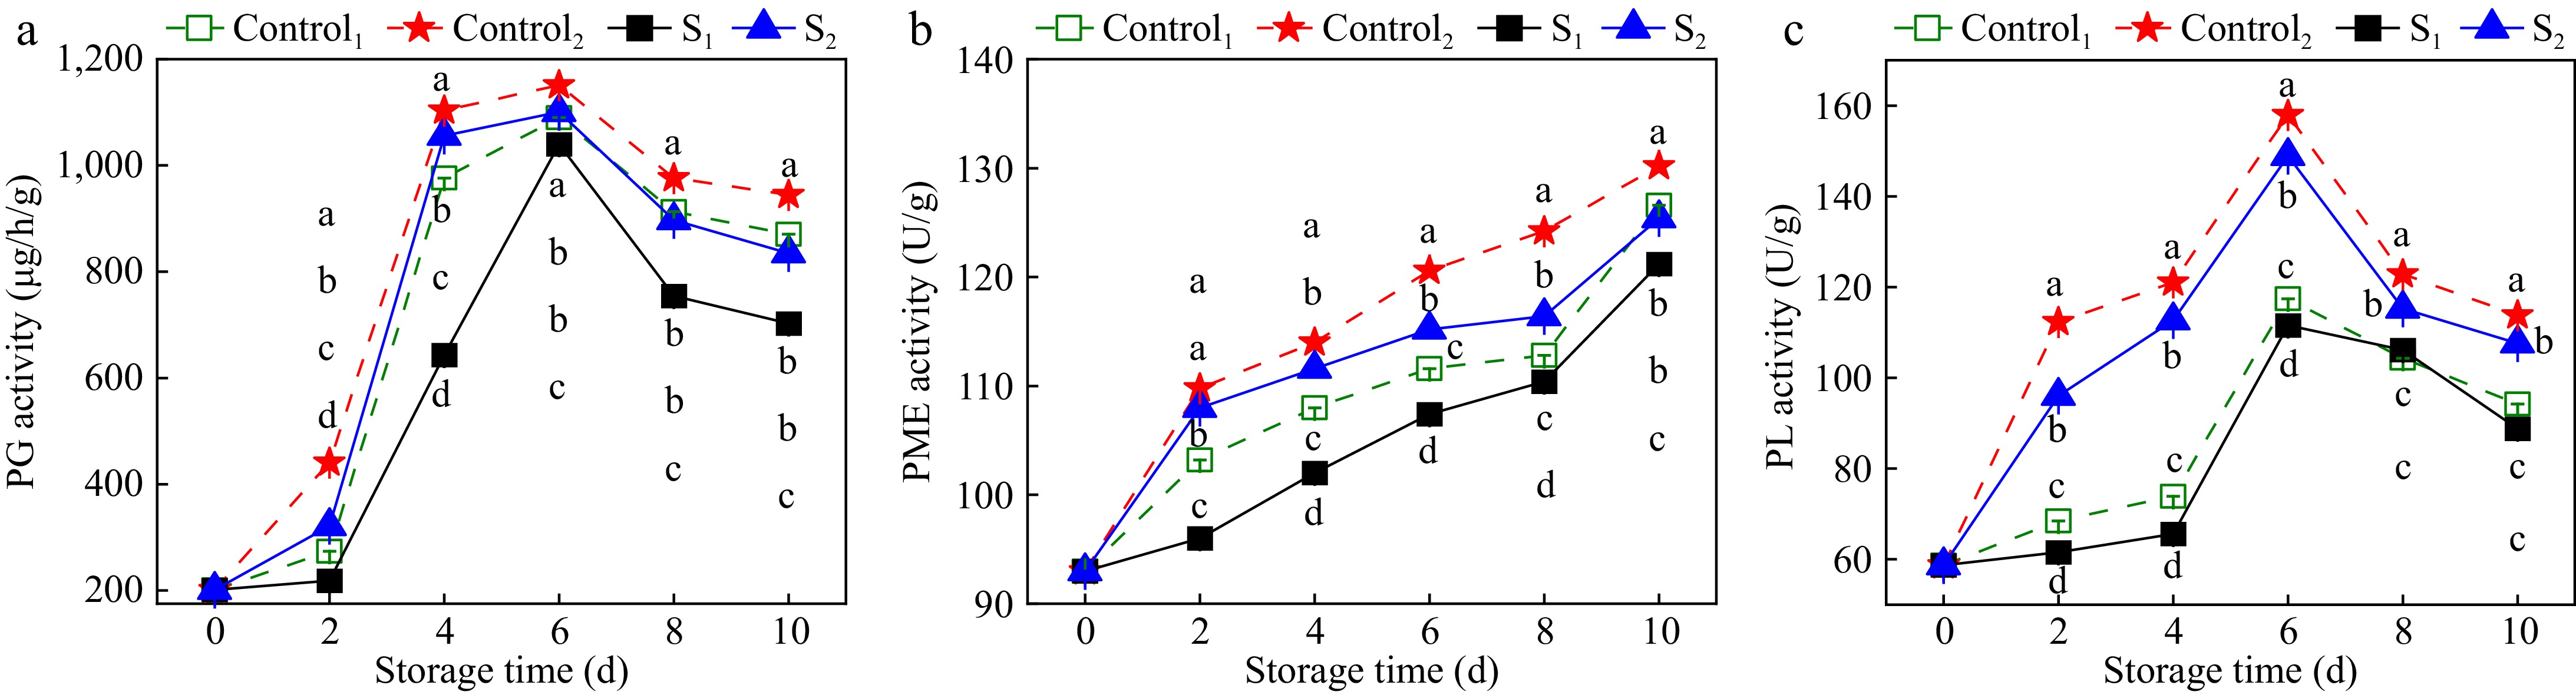
Figure 7.
Effects of water loss treatment on the activities of (a) PG, (b) PME, and (c) PL enzymes in Actinidia arguta. The mean values were compared using Duncan's multiple range test at a significance of p < 0.05.
-
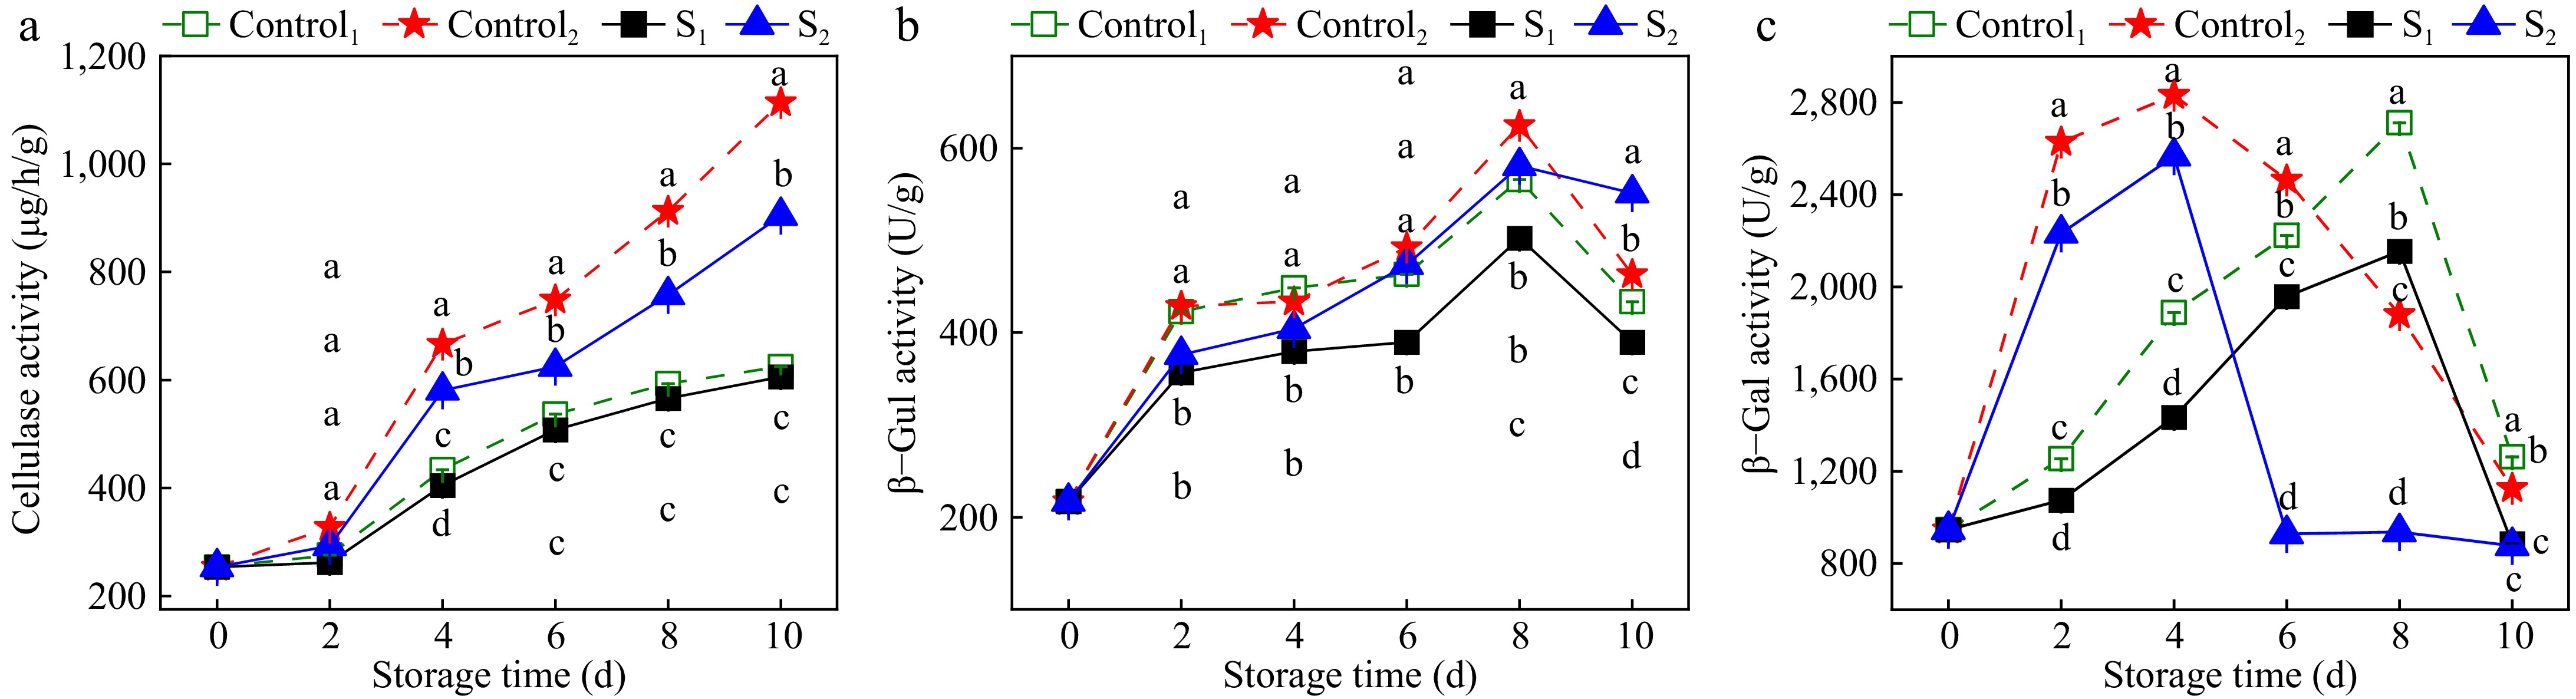
Figure 8.
Effects of water loss treatment on (a) CX, (b) β-Gul, and (c) β-Gal enzyme activities in Actinidia arguta. The mean values were compared using Duncan's multiple range test at a significance of p < 0.05.
-
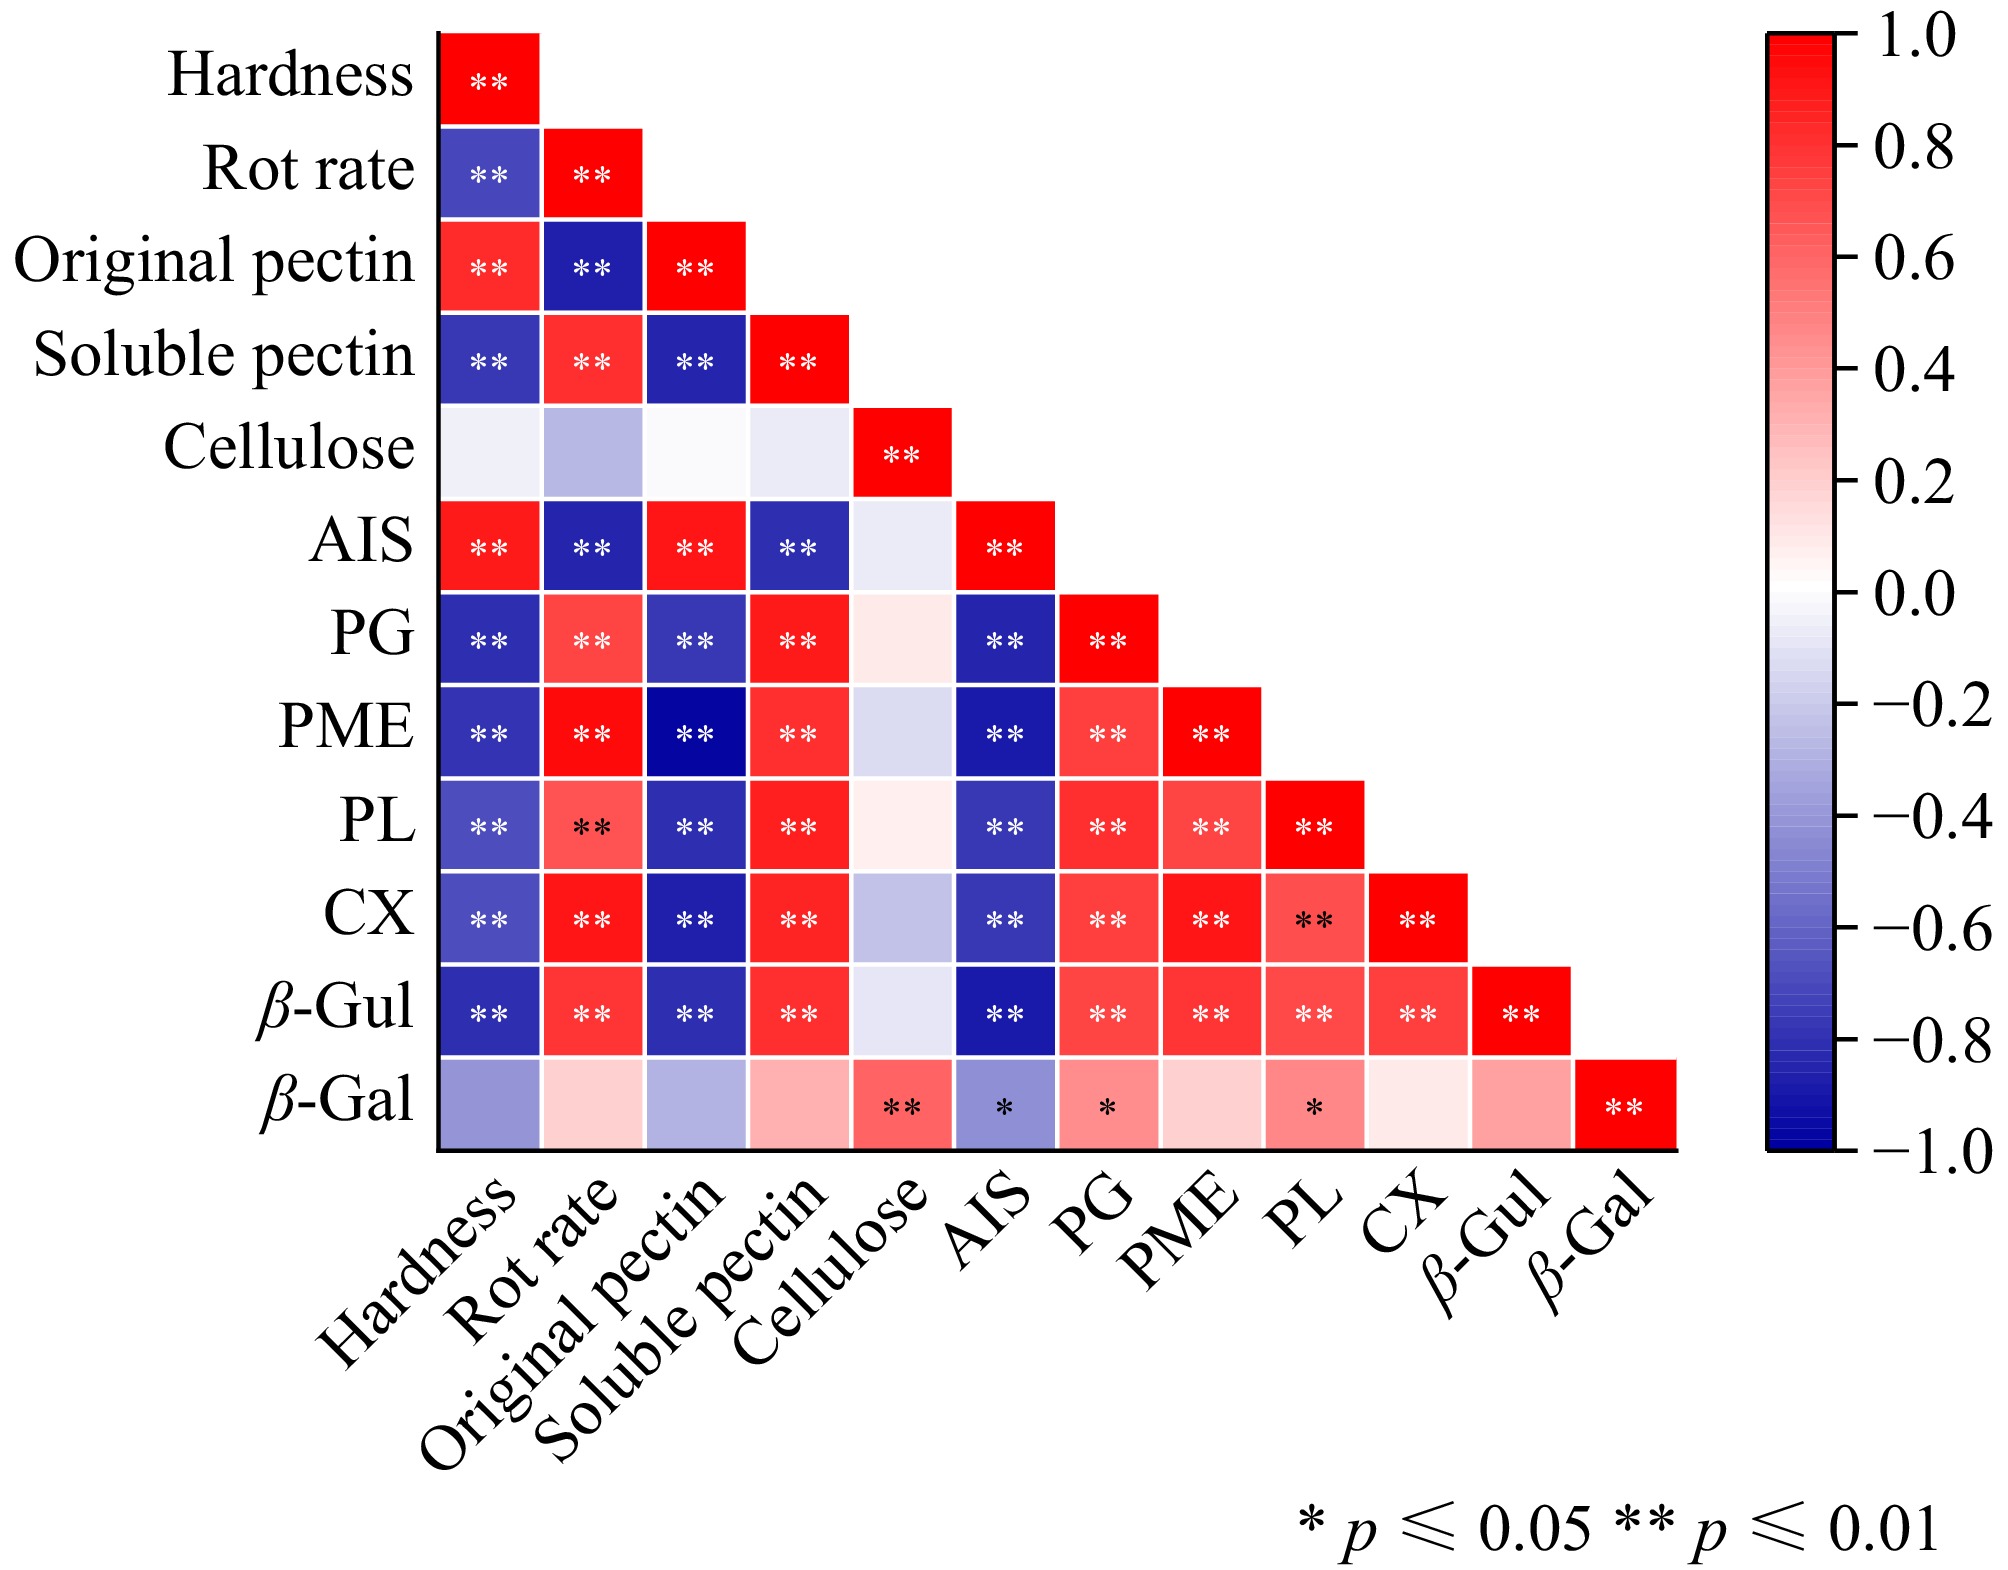
Figure 9.
Pearson's correlation analysis. * represent significant correlations at p ≤ 0.05, and ** represent significant correlations at p ≤ 0.01. Shades of red represent various degrees of positive correlations and shades of blue indicate various degrees of negative correlations as indicated in the scale bar on the right of the heat map.
-
Processing code Control1 Control2 S1 S2 Treatment method Without losing water.
The simulated vibration
time is 5 minWithout losing water.
The simulated vibration
time is 10 minWater loss of 4%.
The simulated vibration
time is 5 minWater loss of 4%.
The simulated vibration
time is 10 minTable 1.
Comparison table of treatment methods.
Figures
(9)
Tables
(1)