-
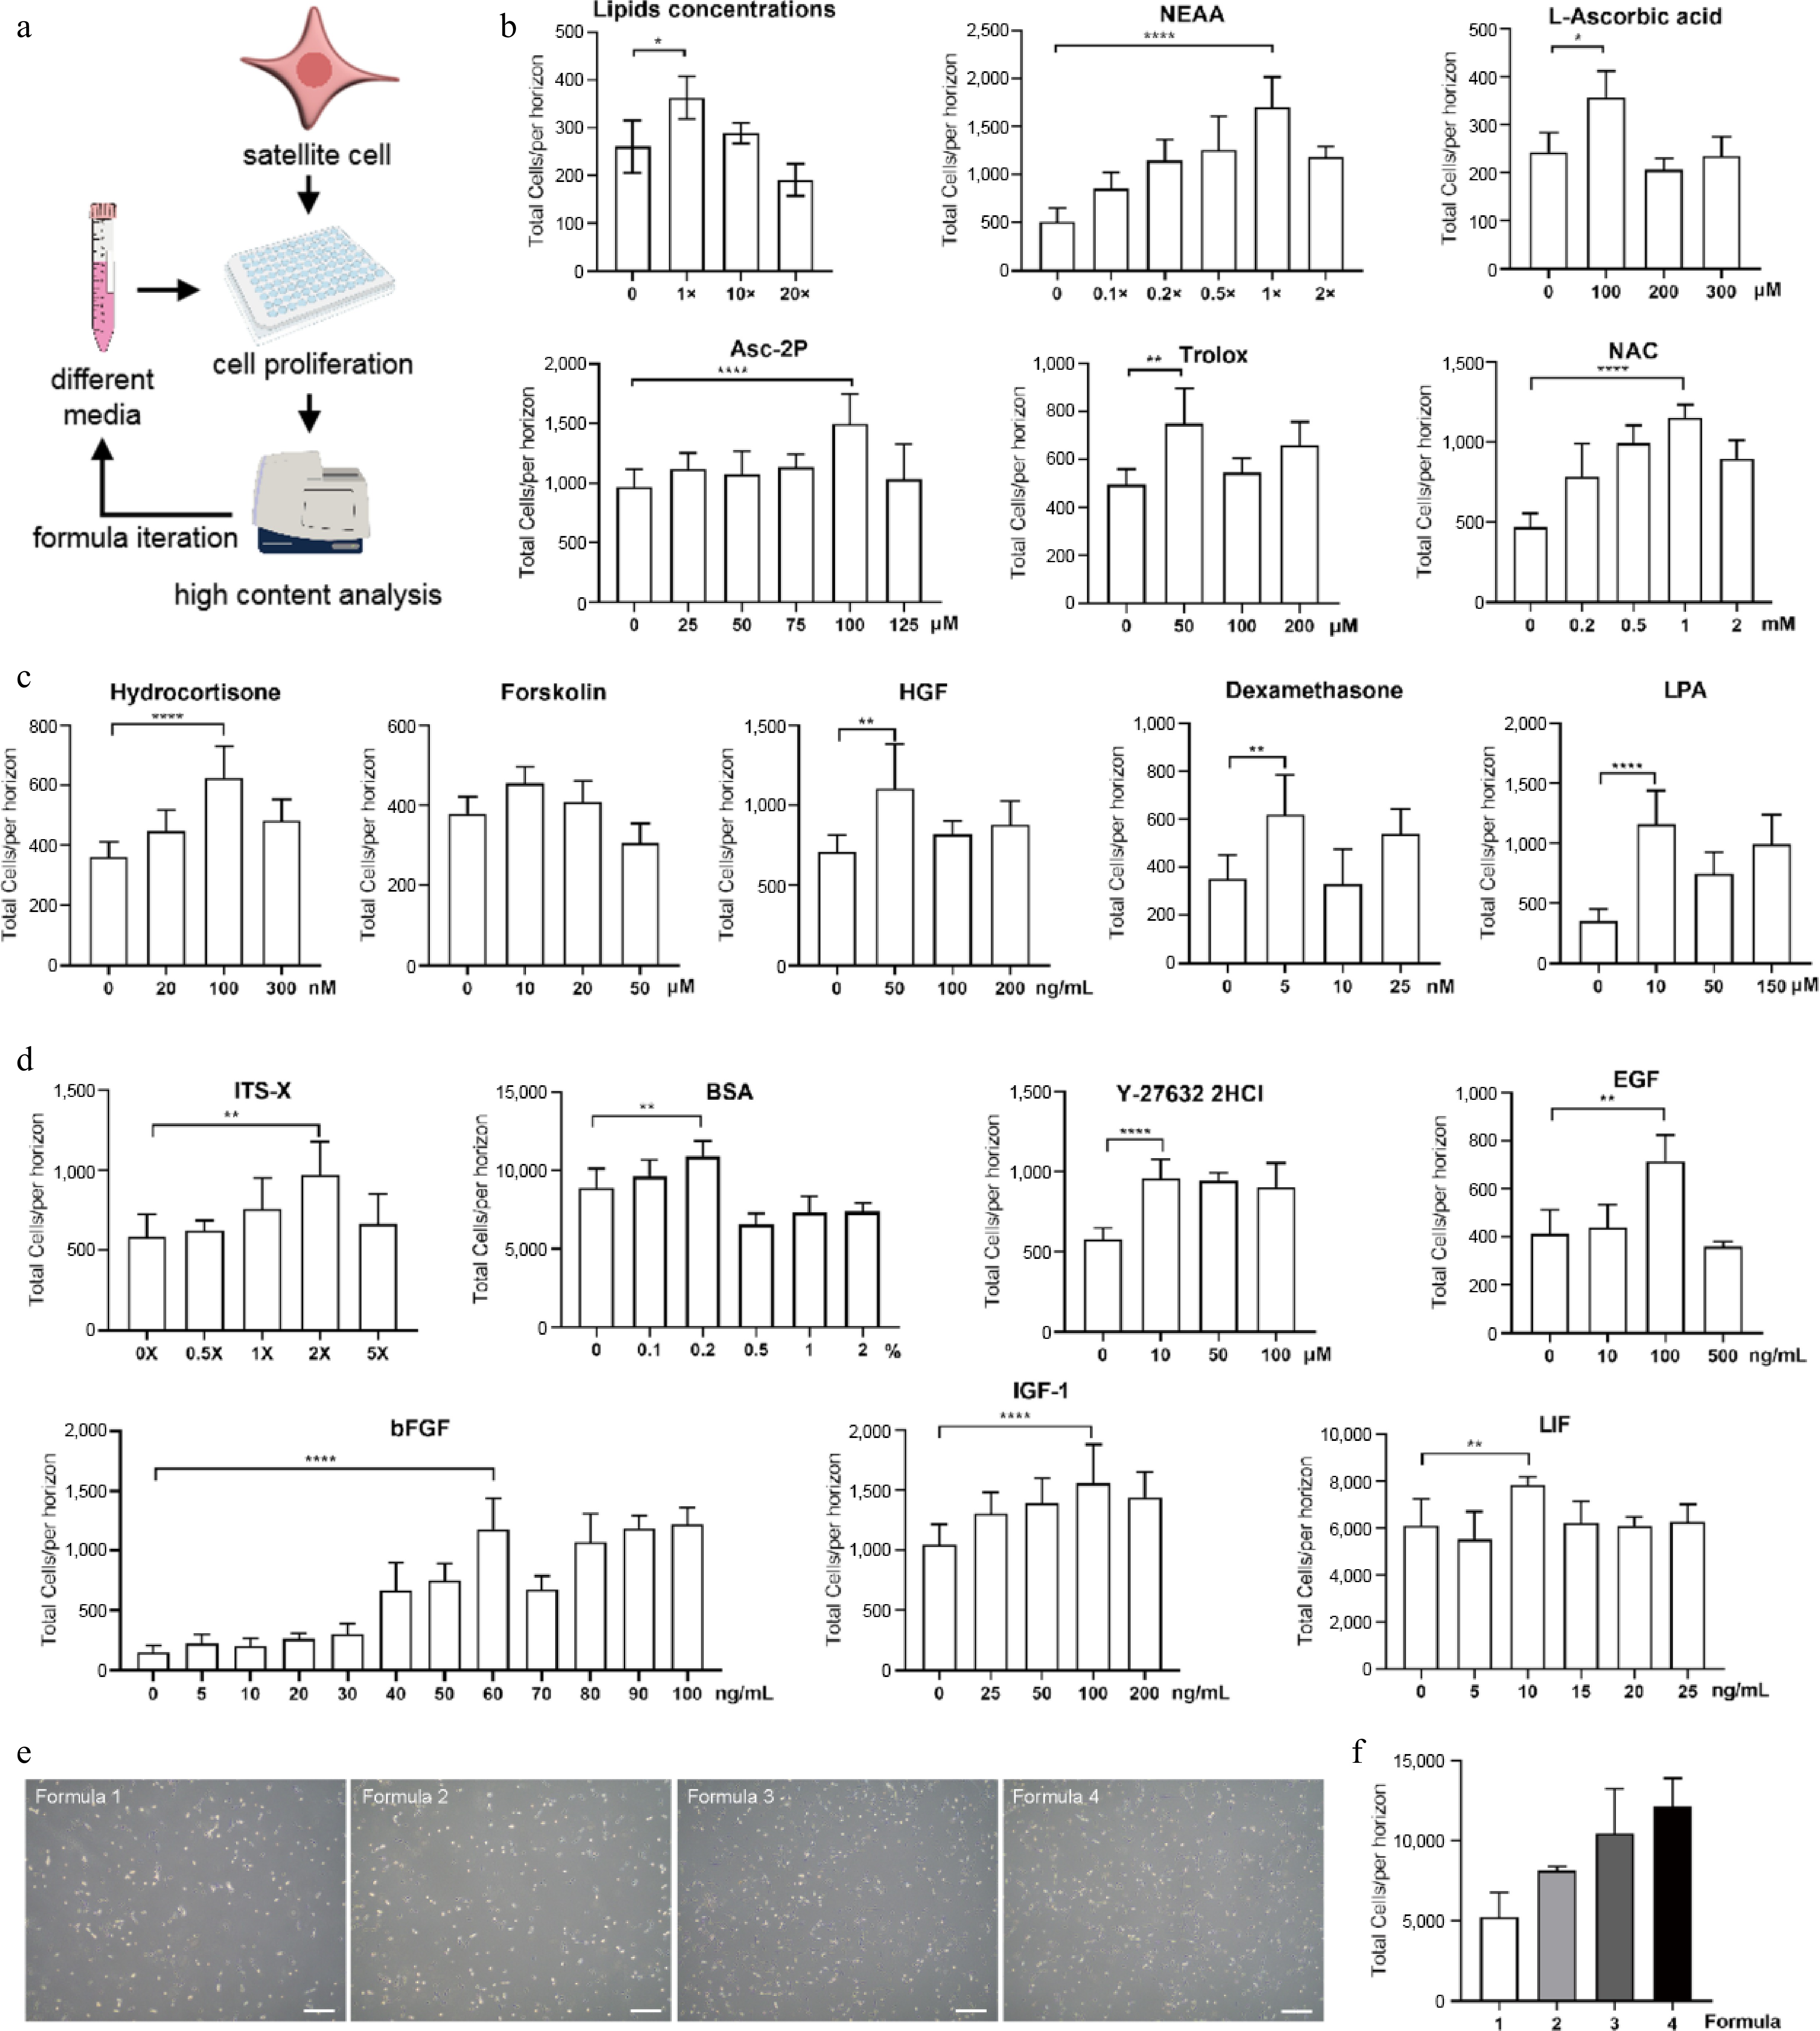
Figure 1.
Construction of serum-free proliferation medium for porcine SCs. (a) Schematic overview of medium formula iteration. (b) Effects of different supplements on cell growth with varied concentrations in Formula 2. (c) Effects of different factors on cell growth with varied concentrations in Formula 3. (d) Optimization of concentrations of factors used in Formula 1 to yield Formula 4. (e) Bright-field images of SCs cultivated by different media at day 3. Scale bars, 500 μm. (f) The effect on cell growth of different media. Mean ± SD from at least three independent experiments. Significance was analyzed by one-way ANOVA. * p < 0.05, ** p < 0.01, *** p < 0.001, **** p < 0.0001, ns, not significant (p > 0.05).
-
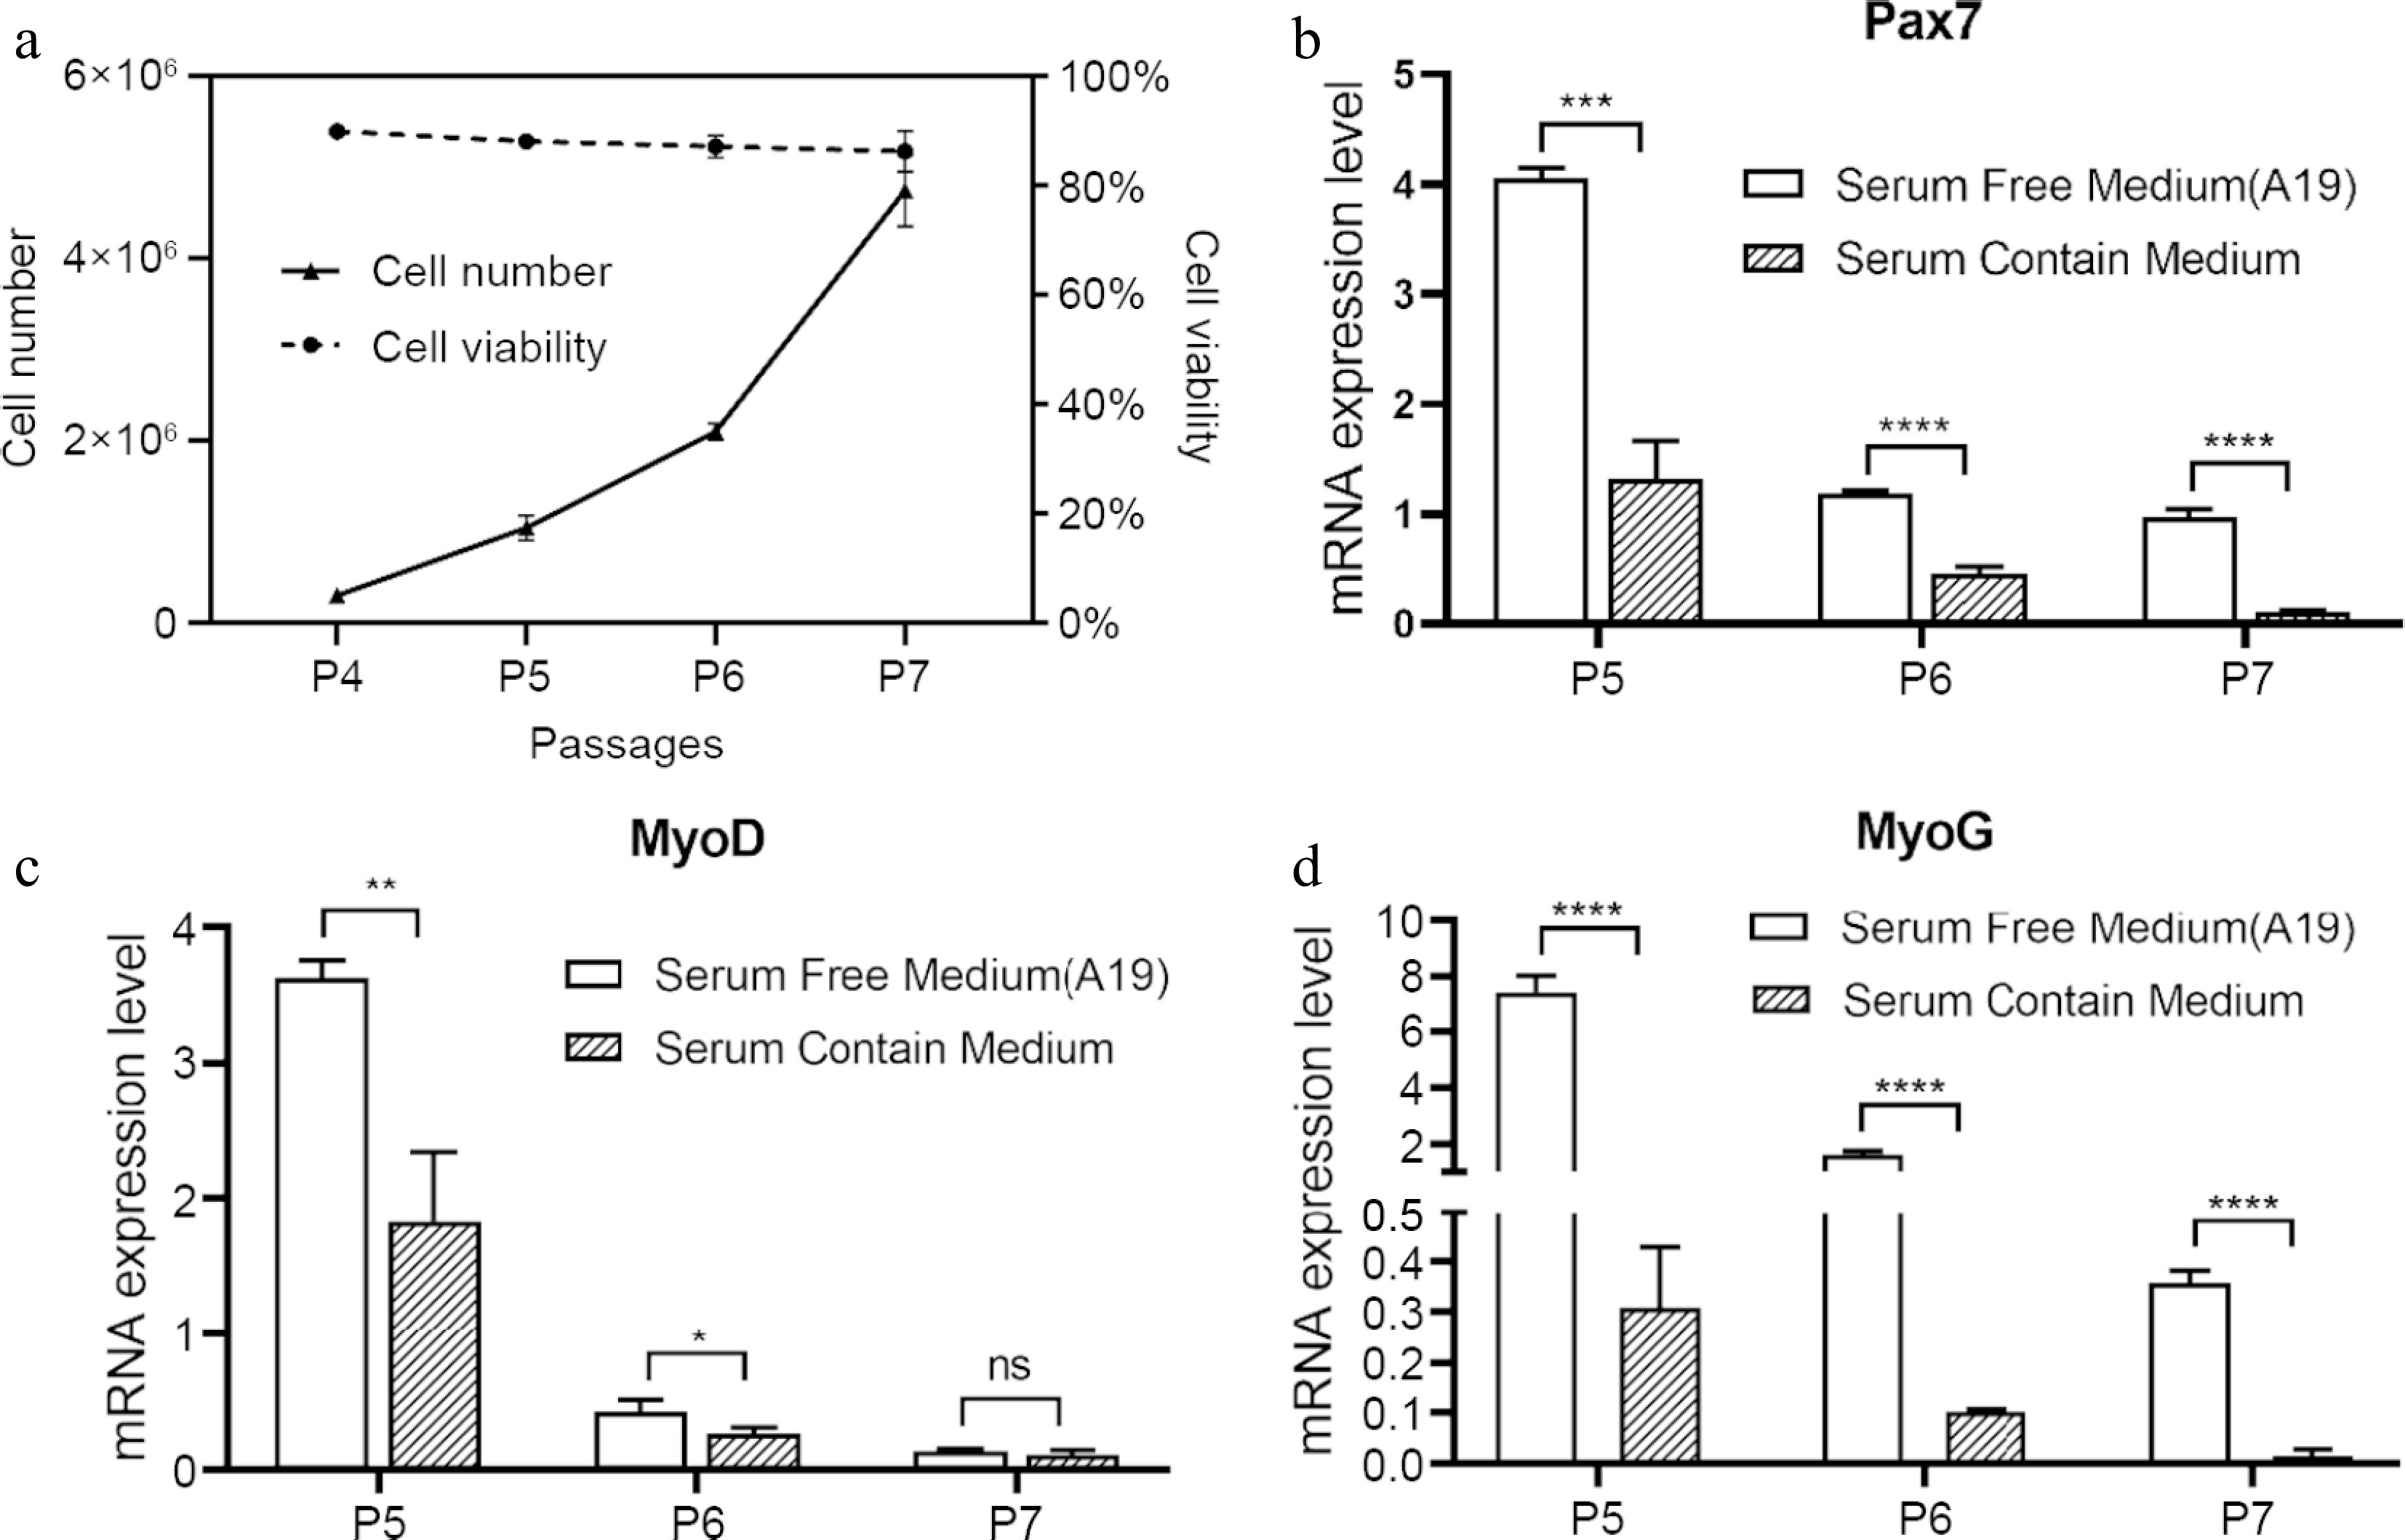
Figure 2.
Proliferation and gene expression of SCs in serum-free proliferation medium. (a) Cell number and viability of SCs cultured in serum-free medium (A19) during passage 4 (P4) to P7. (b)−(d) Real-time PCR quantification of PAX7, MYOD, and MYOG for SCs. Mean ± SD from at least three independent experiments. Significance was analyzed by two-tailed Student's t-test. * p < 0.05, ** p < 0.01, *** p < 0.001, **** p < 0.0001, ns, not significant (p > 0.05).
-
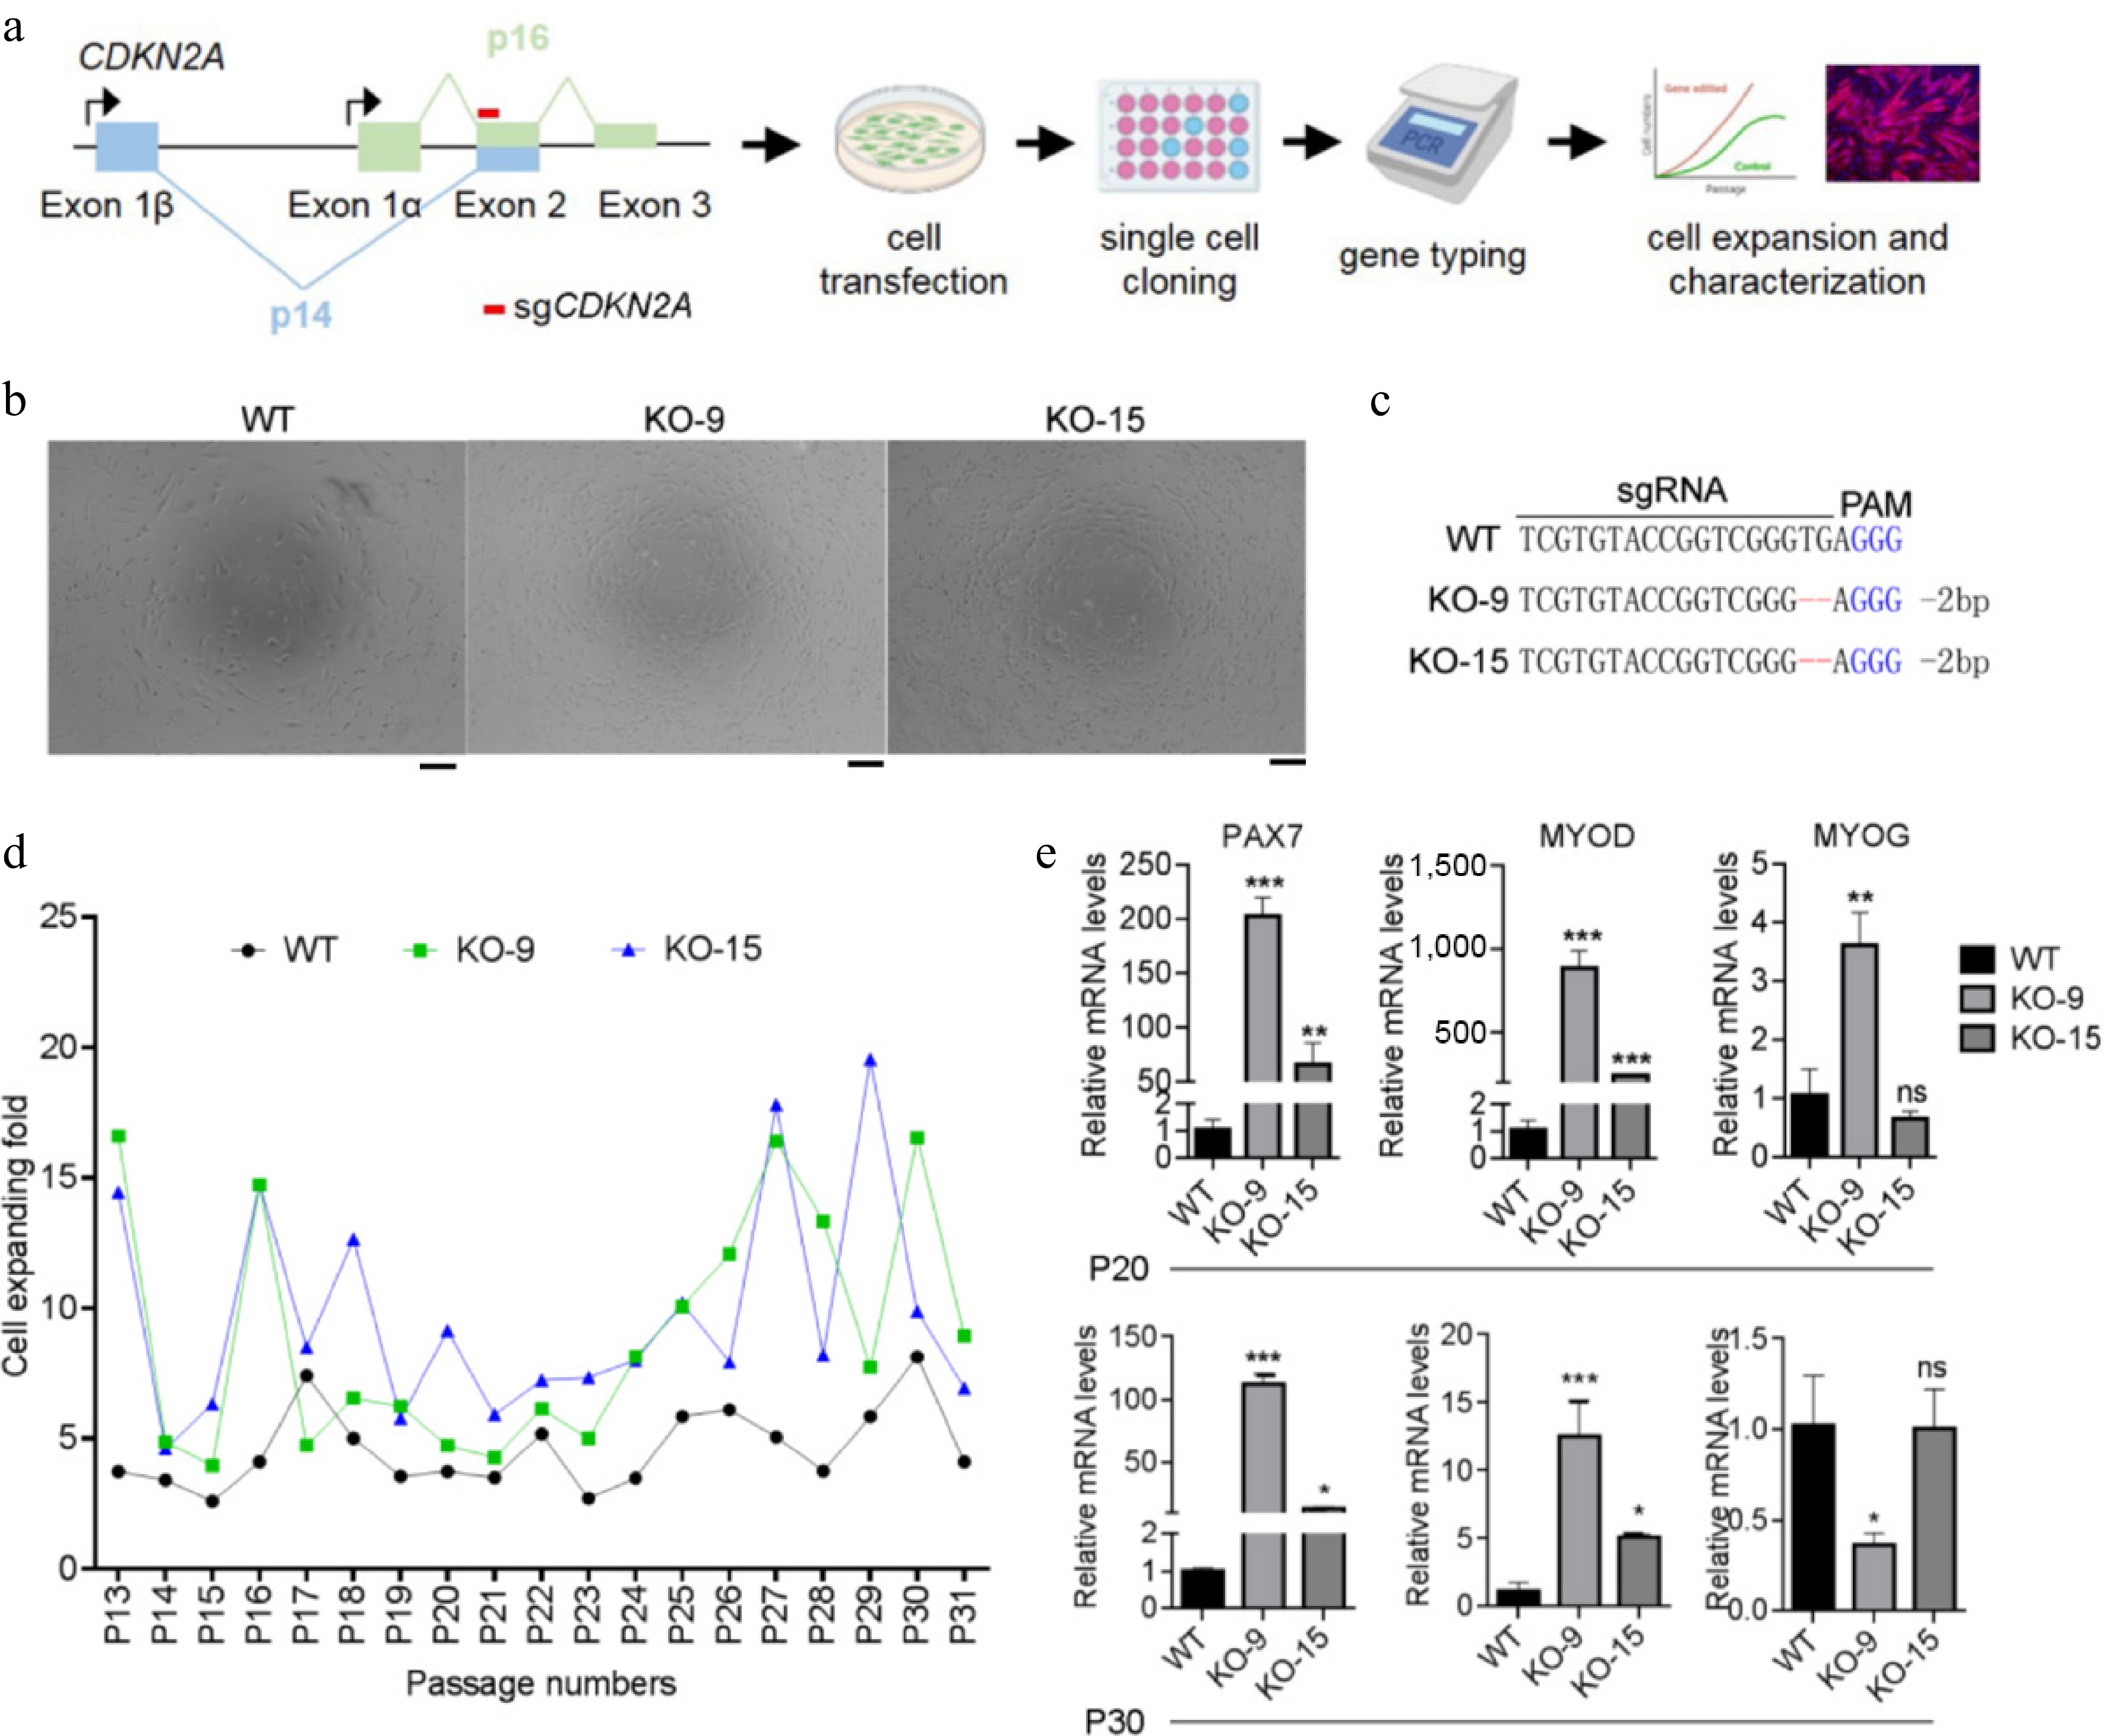
Figure 3.
Generating CDKN2A−/− SCs under serum condition. (a) Flowchart of experimental design for CDKN2A knockout, cell genotyping, and characterization of porcine SCs. (b) Microscopic images of CDKN2A+/+ (WT) and CDKN2A−/− (KO-9 and KO-15) SCs under bright field. Scale bar, 100 μm. (c) Sequencing data of CDKN2A mutations induced by CRISPR/Cas9 in SC clones. Deletions are indicated by dashes, and PAM is shown in blue. (d) Cell expanding folds of SCs during long-term expansion. (e) Expression by qPCR of PAX7, MYOD, and MYOG of SCs at P20 and P30. Mean ± SD from three independent experiments. Significance was analyzed by one-way ANOVA. * p < 0.05, ** p < 0.01, *** p < 0.001, ns, not significant (p > 0.05), compared with WT groups.
-
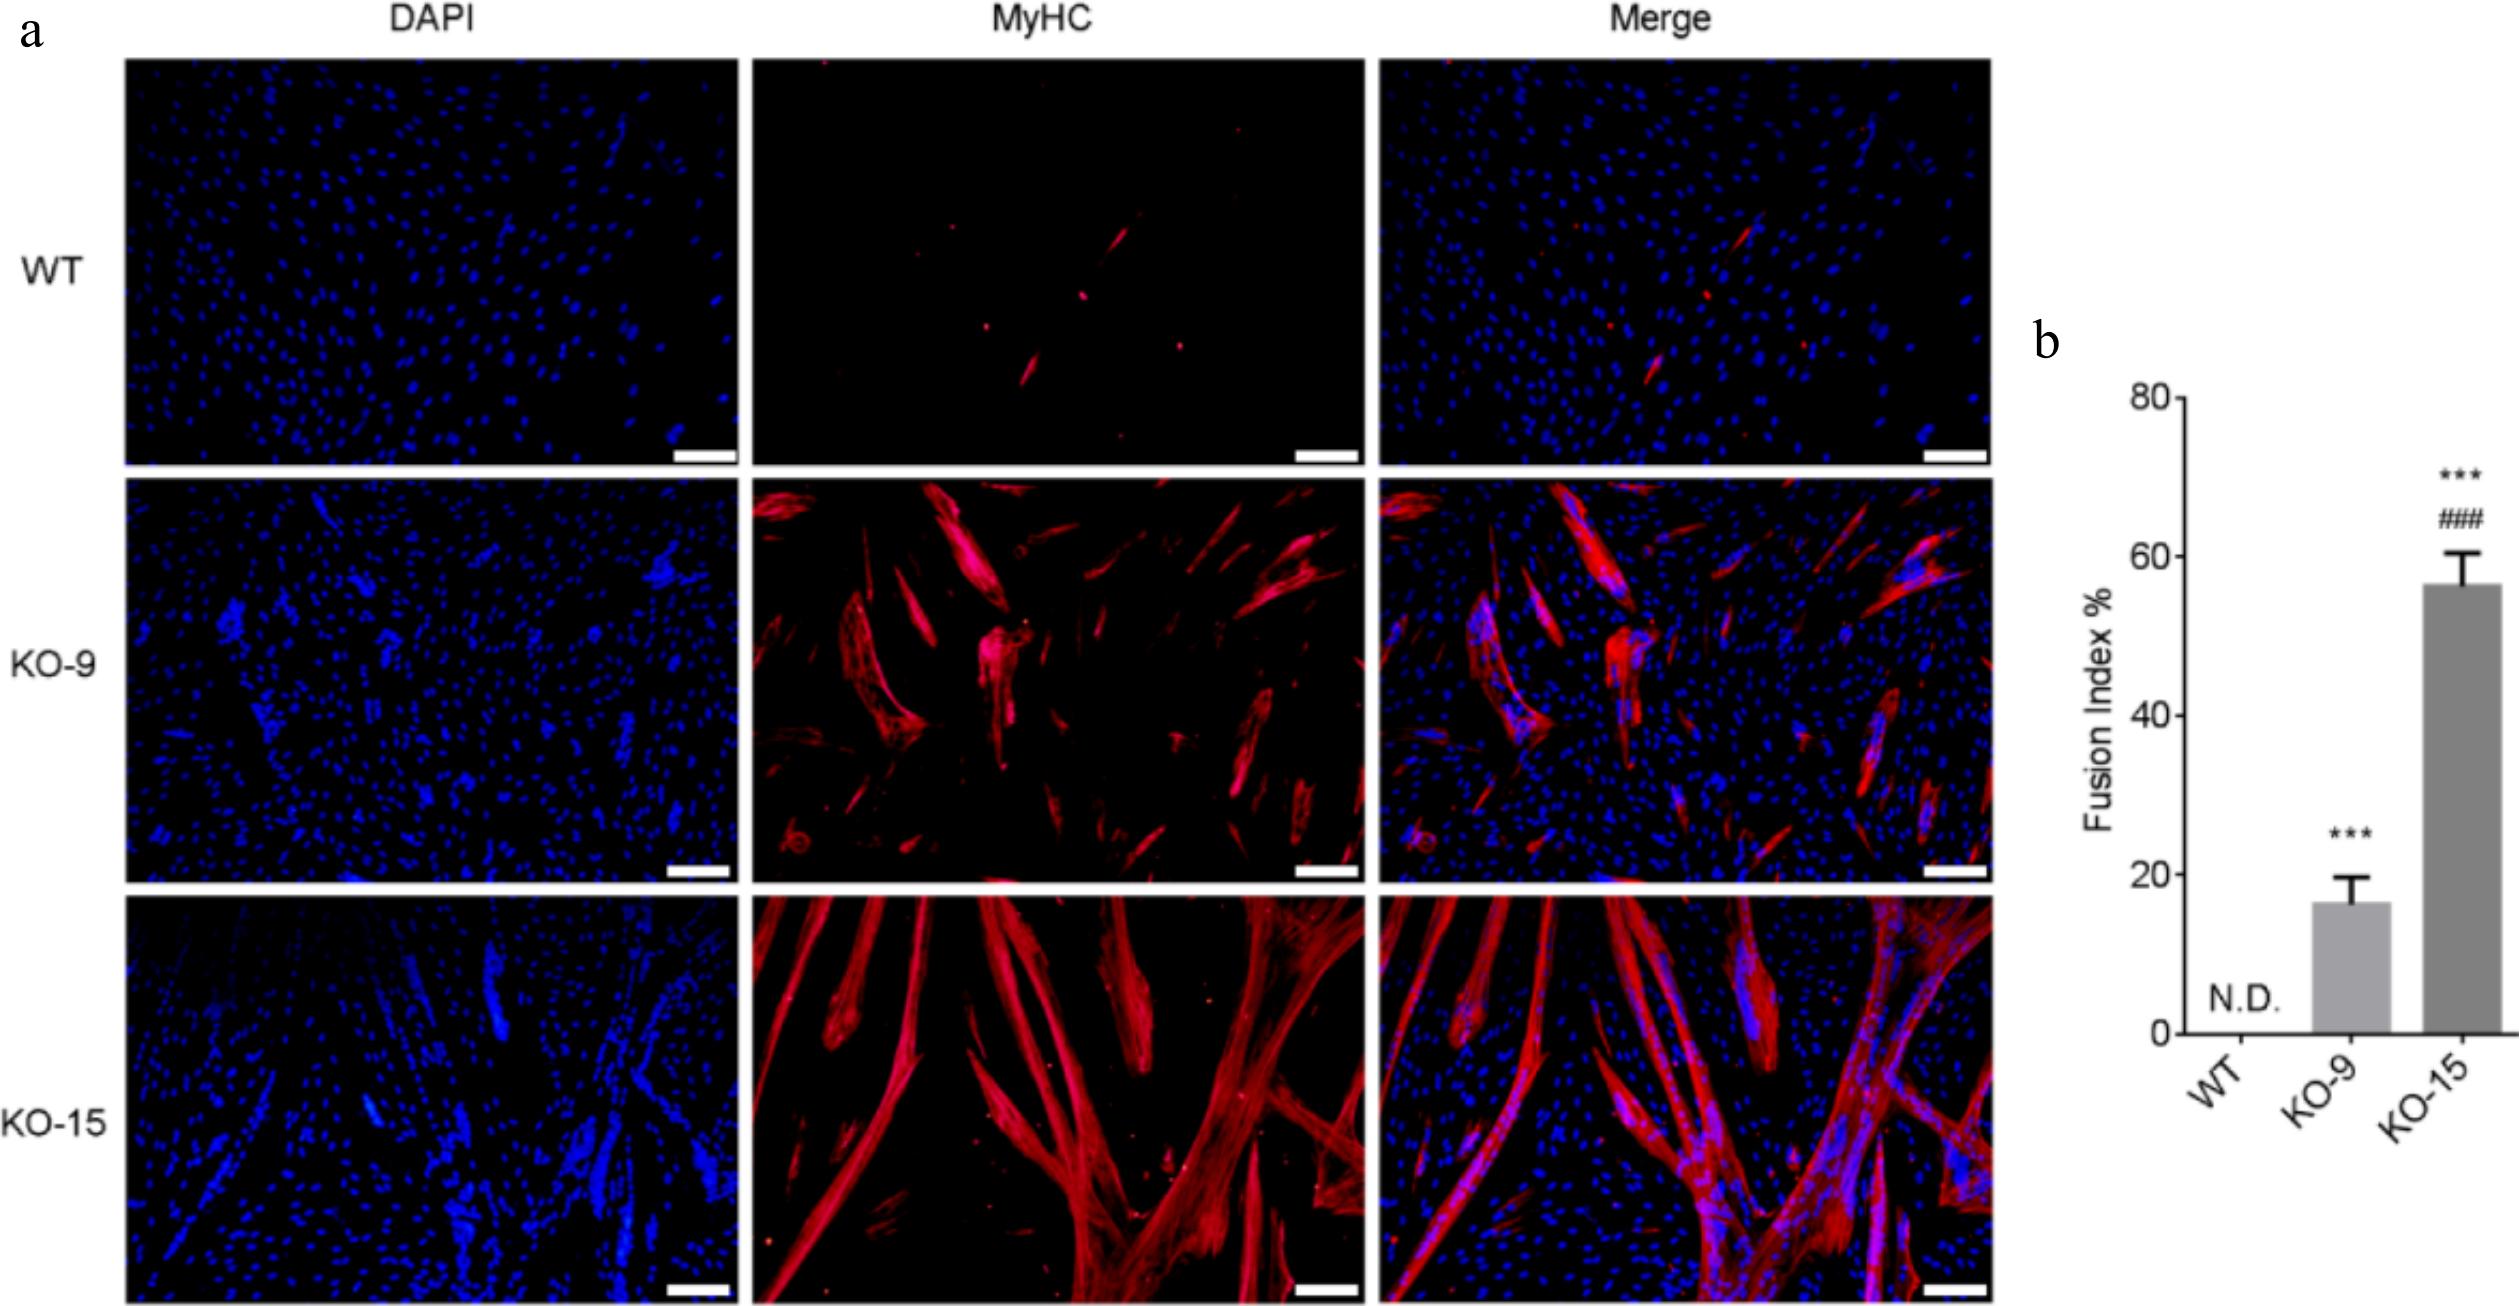
Figure 4.
Differentiation capacity of CDKN2A−/− SCs under serum condition. (a) Immunofluorescence staining of MyHC (red) and nucleus (blue) in differentiated WT and KO cells. Scale bar, 100 μm. (b) The fusion index was calculated as the percentage of myotubes with more than three nuclei. Mean ± SD from three independent experiments. Significance was analyzed by one-way ANOVA. *** p < 0.001, compared with WT group. ### p <0.001, compared with KO-9 group.
-
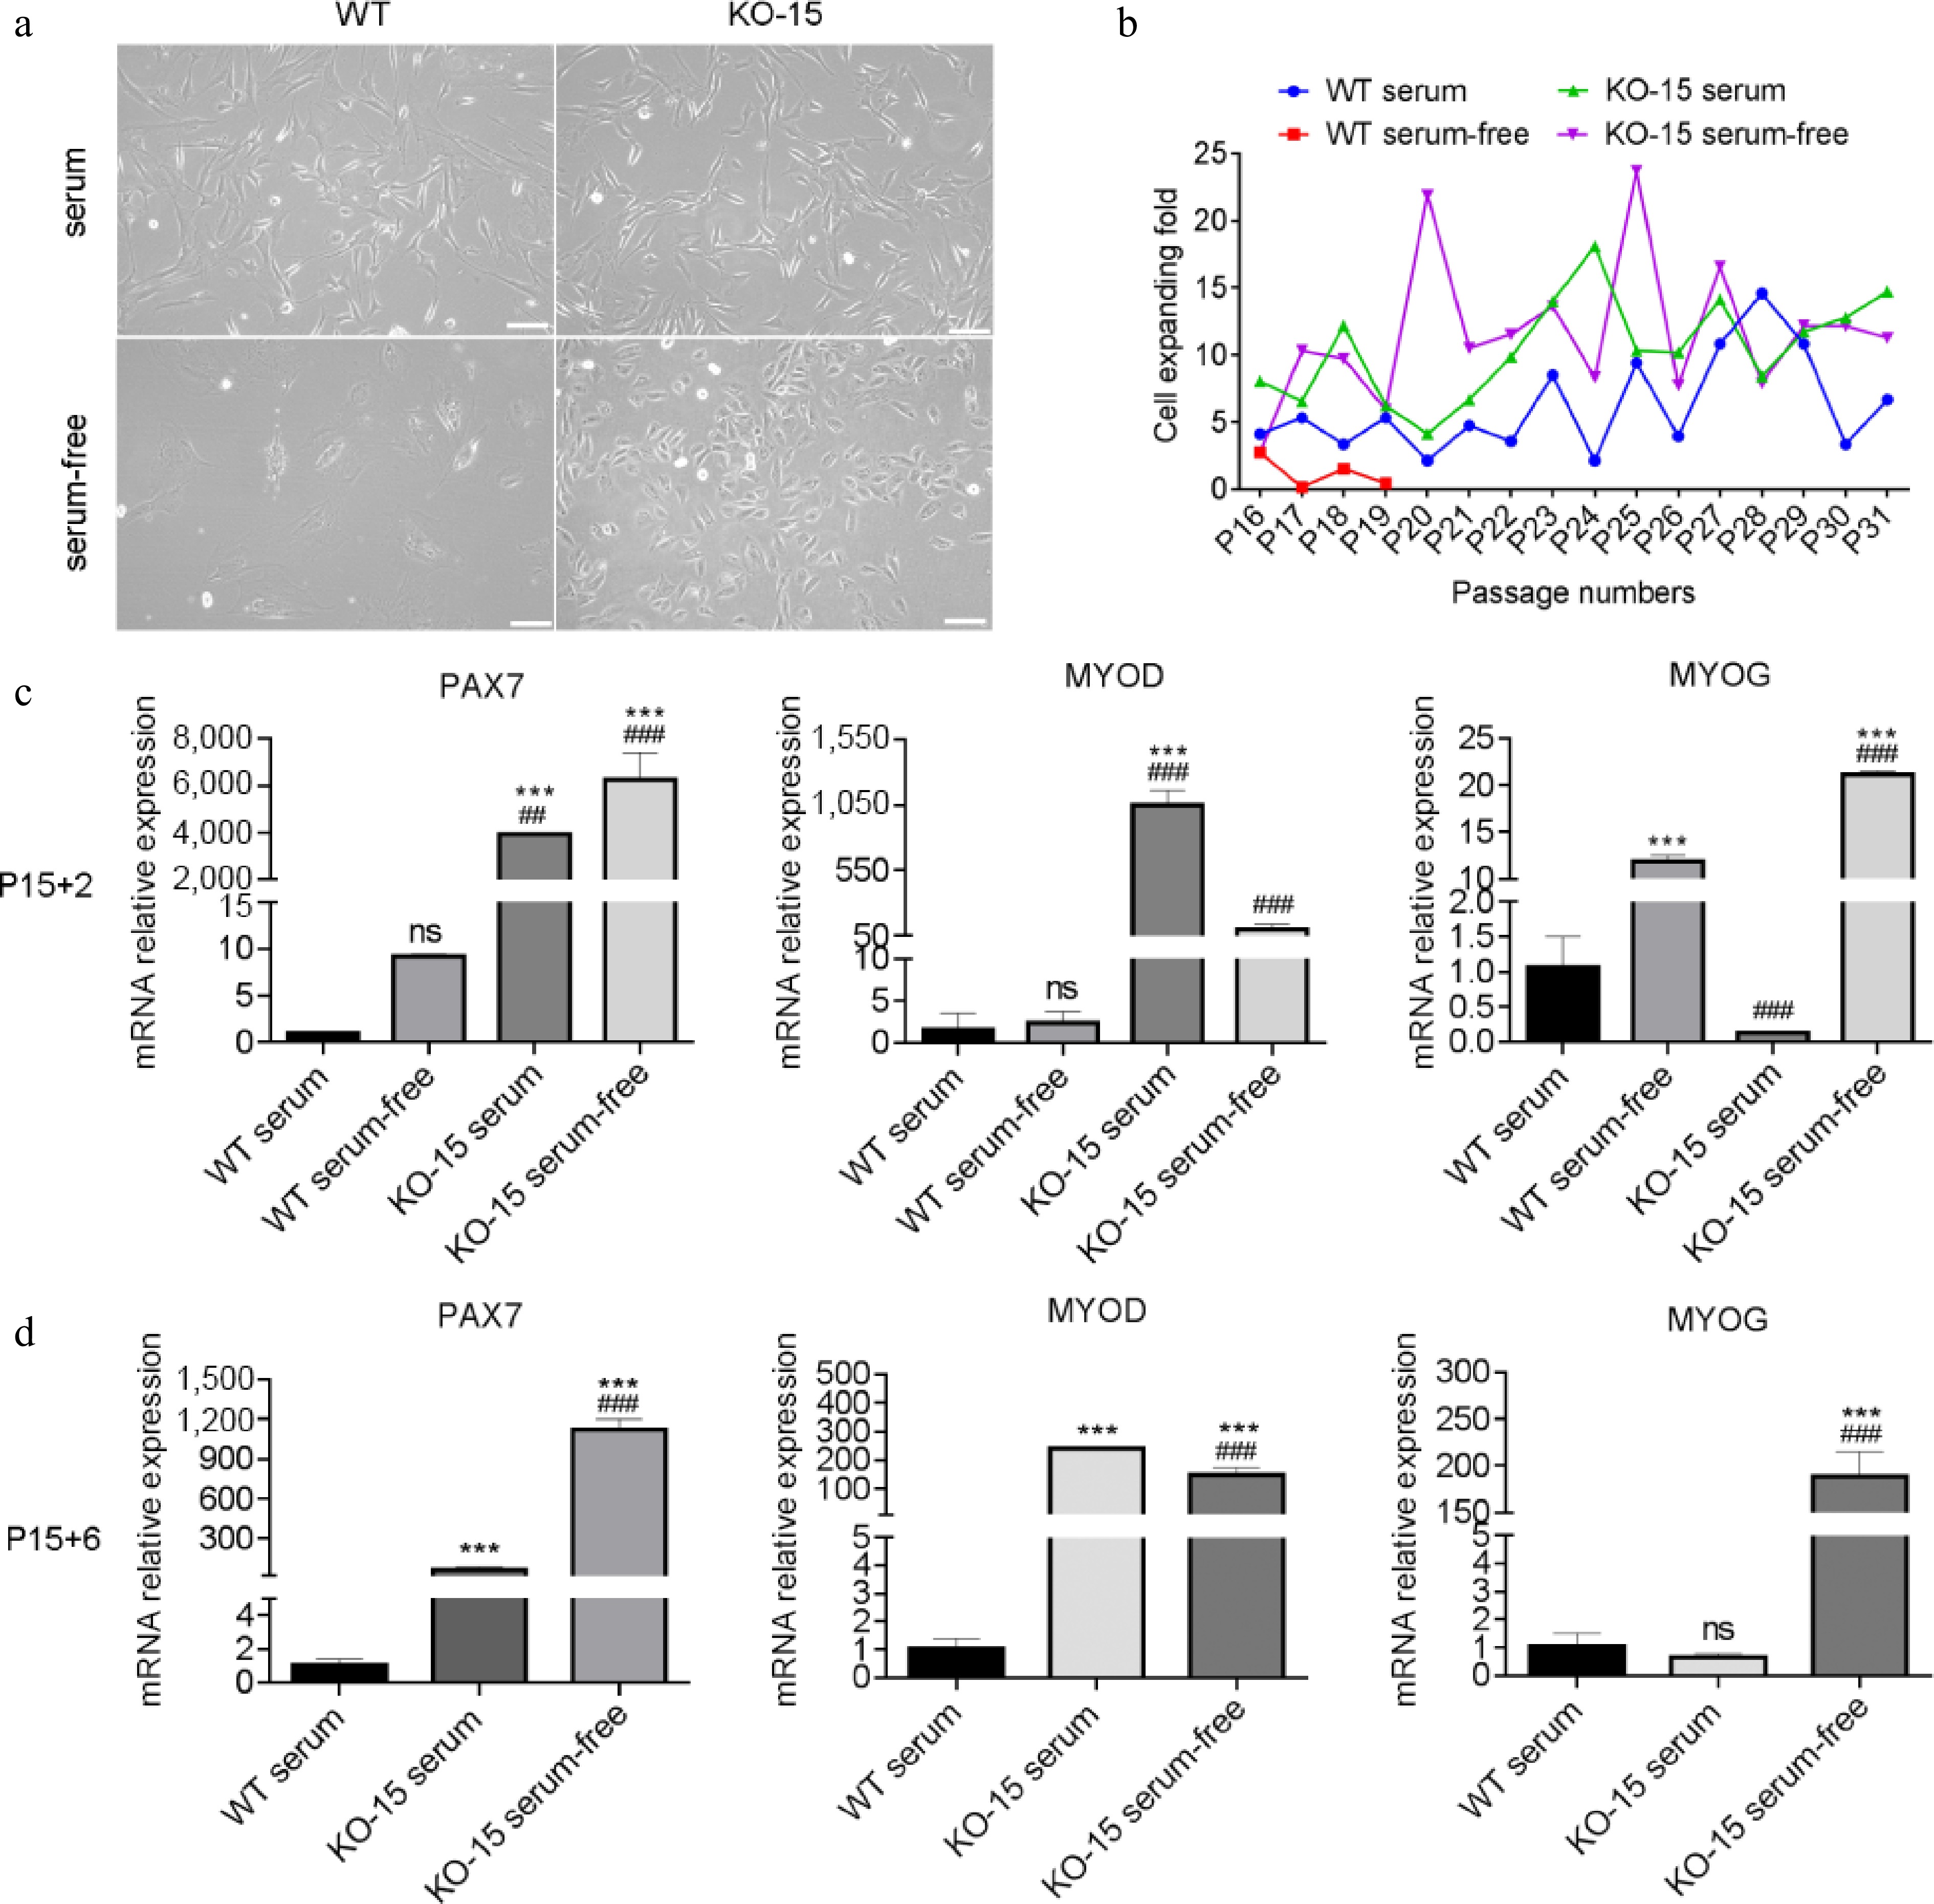
Figure 5.
Characterization of CDKN2A−/− SCs in serum-free condition. (a) Microscopic images of WT and KO-15 SCs under bright field. Scale bar, 100 μm. (b) Cell expanding folds of SCs under serum and serum-free conditions. (c), (d) Expression by qPCR of PAX7, MYOD, and MYOG of SCs at P15 + 2 and P15 + 6. '+X' indicates the cultivated passages in serum-free condition. Mean ± SD from three independent experiments. Significance was analyzed by (c) two-way ANOVA, and (d) one-way ANOVA . *** p < 0.001, compared with WT group. ## p <0.01, ### p <0.001, compared with KO-9 group, ns, not significant (p > 0.05).
-
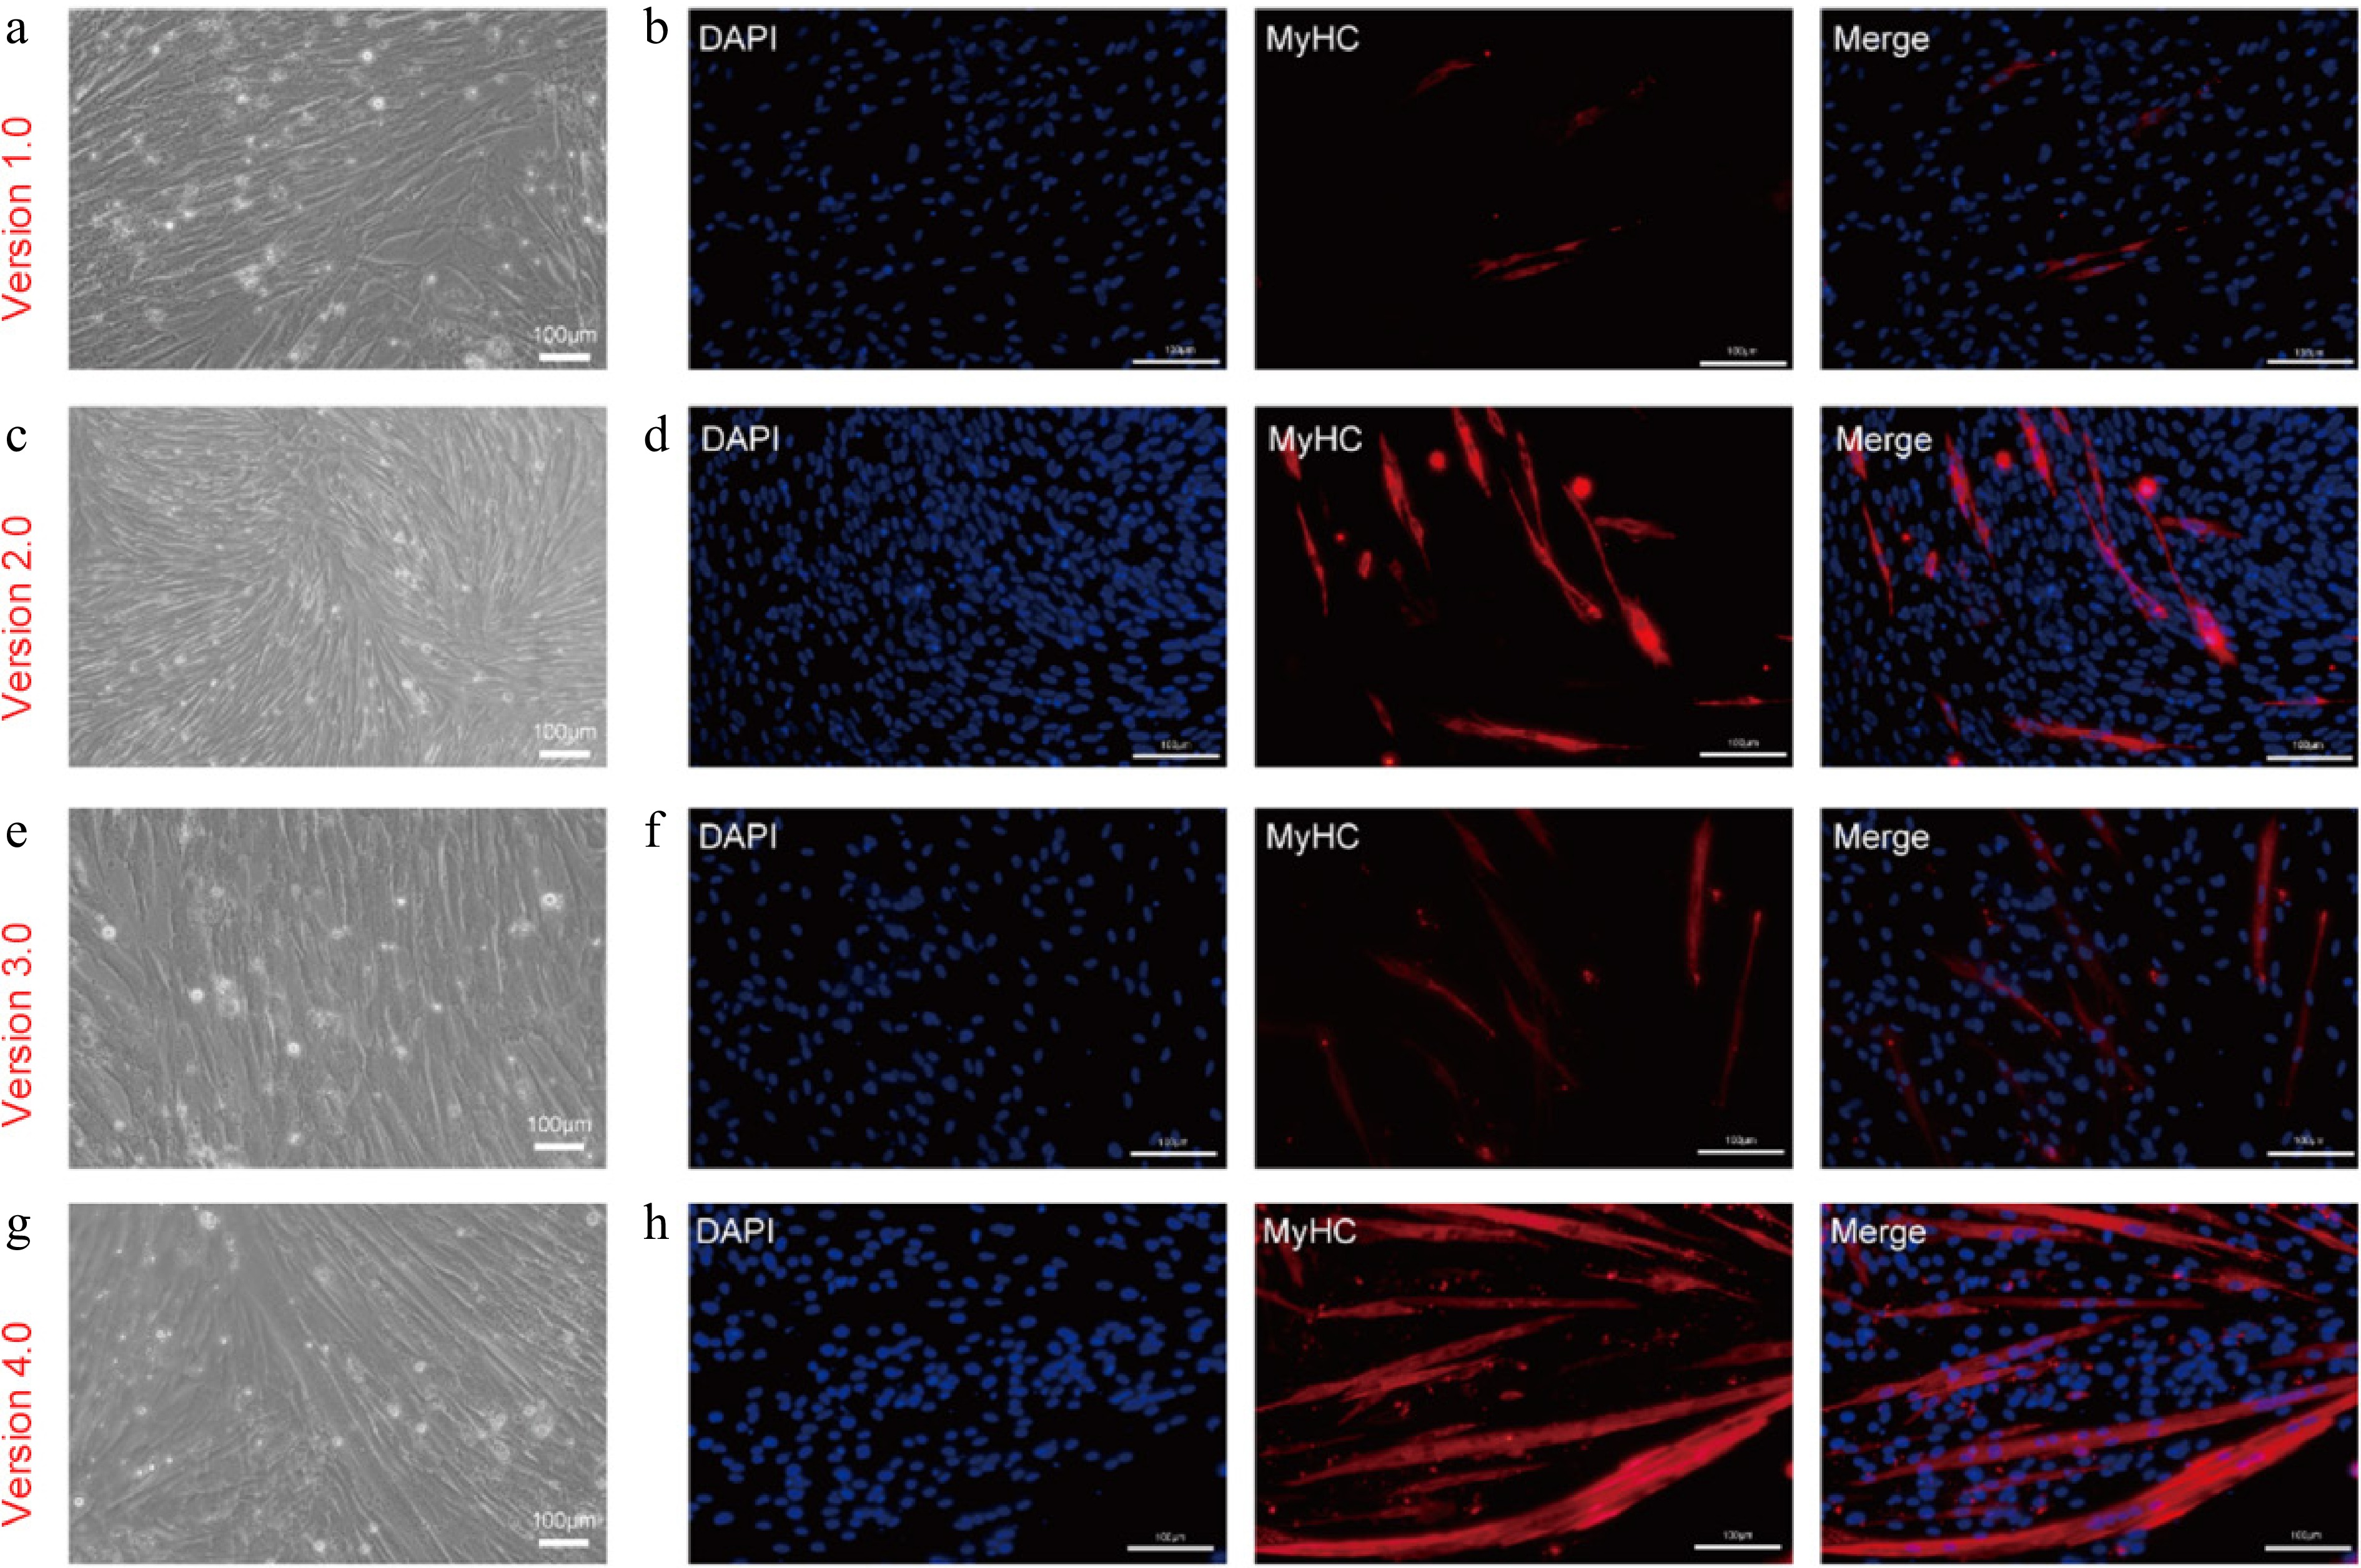
Figure 6.
Myogenic differentiation of CDKN2A−/− SCs in serum-free condition. (a), (c), (e), (g) Bright-field images, and (b), (d), (f), (h) immunofluorescent staining of KO-15 MuSCs induced by different serum-free differentiation media at day 4: (a), (b) serum-free myogenic differentiation medium (Version 1.0). (c), (d) Serum-free adipogenic differentiation medium (Version 2.0). (e), (f) Modified serum-free myogenic differentiation medium with 10 ng/mL insulin (Version 3.0). (g), (h) Modified serum-free adipogenic differentiation medium without dexamethasone, 3-isobutyl-1-methylxanthine and rosiglitazone (Version 4.0). Scale bars, 100 μm.
-
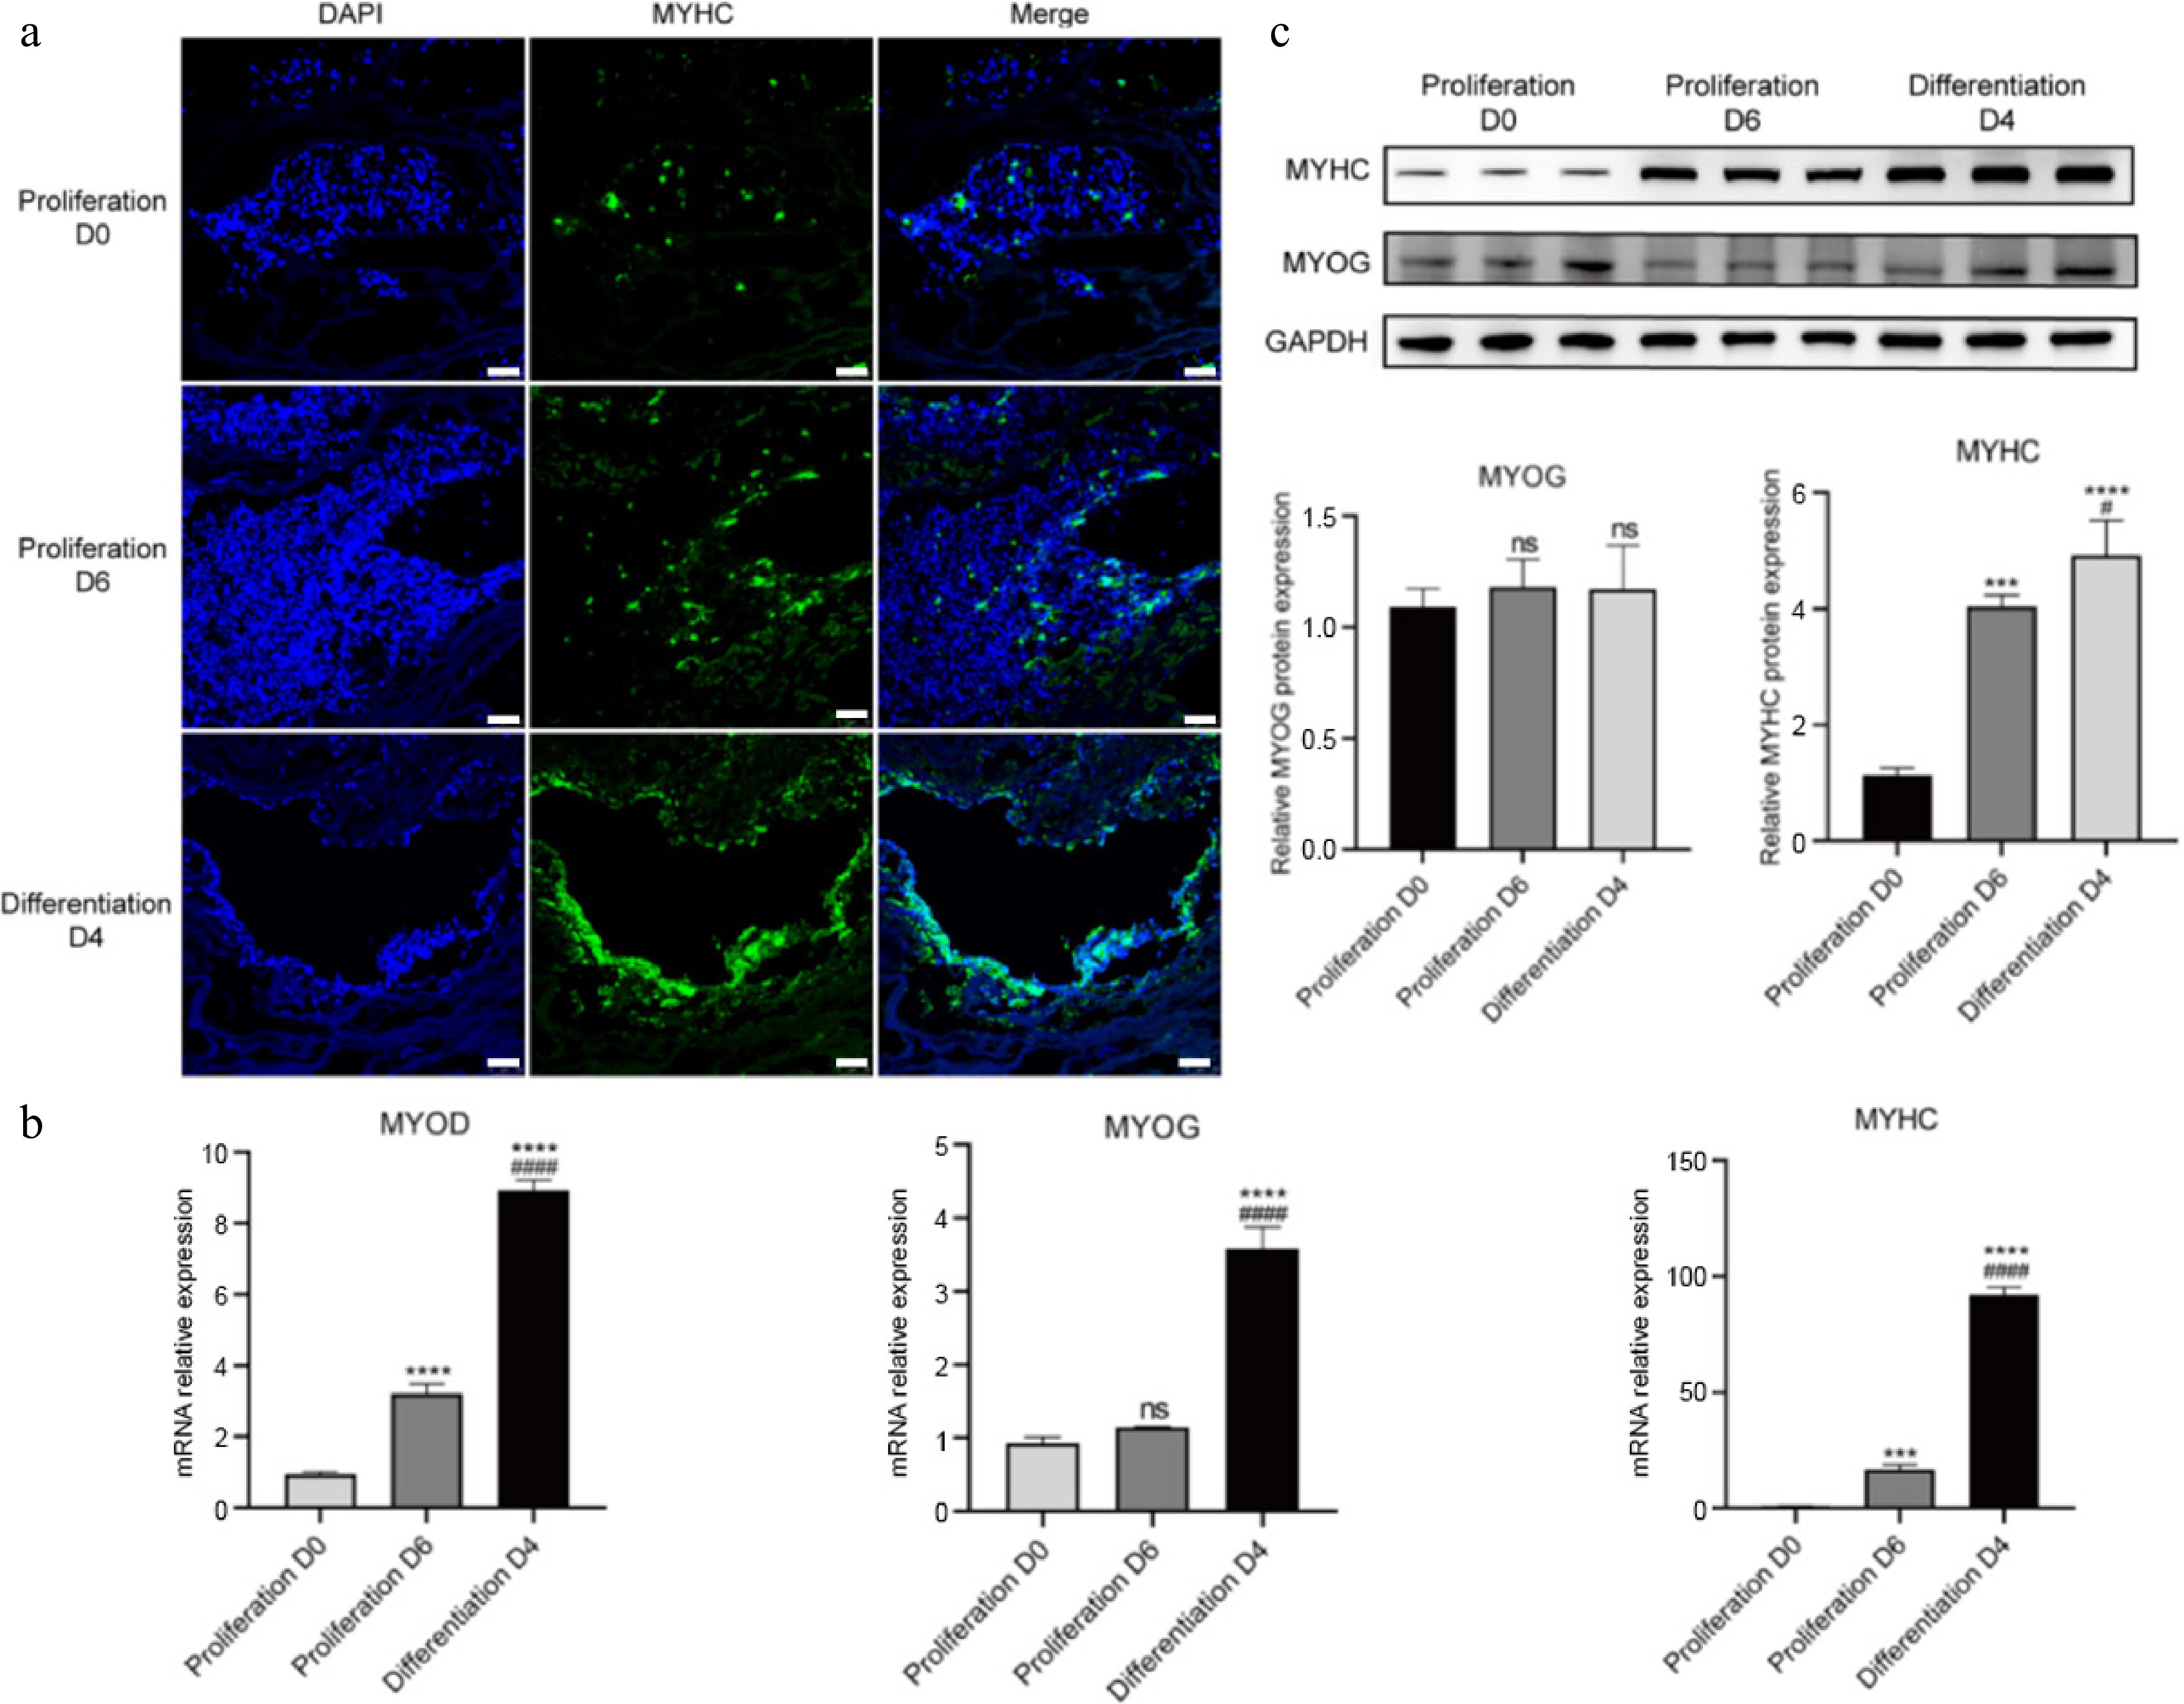
Figure 7.
3D culture of CDKN2A−/− SCs in peanut wire-drawing protein scaffolds. (a) Immunofluorescence staining of MYHC (green) and nucleus (blue) in proliferation and differentiation process. Scale bar, 25 μm. (b) Real-time qPCR quantification of MYOD, MYOG, and MYHC. (c) Protein expression of MYOG and MYHC examined by western blot and quantitative results analyzed by ImageJ. Mean ± SD from at least three independent experiments. Significance was analyzed by one-way ANOVA. *** p < 0.001, **** p < 0.0001, compared with proliferation D0 group; # p < 0.05, #### p < 0.0001, compared with proliferation D6 group, ns, not significant (p > 0.05).
-
Formula 4 (A19) Formula 3 Formula 2 Formula 1 Basal media DMEM/F12 Basal media DMEM/F12 ITS-X 1 × Lipids concentration 1 × Hydrocortisone 100 nM ITS-X 2 × BFGF 10 ng/mL NEAA 1 × Forskolin 10 μM BFGF 60 ng/mL BSA 0.1% L-Ascorbic acid 100 μM HGF 50 ng/mL BSA 0.2% Y-27632 2HCl 10 μM Asc-2P 100 μM Dexamethasone 5 nM Y-27632 2HCl 10 μM EGF 100 ng/mL Trolox 50 μM LPA 10 μM EGF 100 ng/mL IGF-1 25 ng/mL NAC 1 mM IGF-1 100 ng/mL LIF 10 ng/mL LIF 10 ng/mL Table 1.
The development of serum-free proliferation medium.
Figures
(7)
Tables
(1)