-
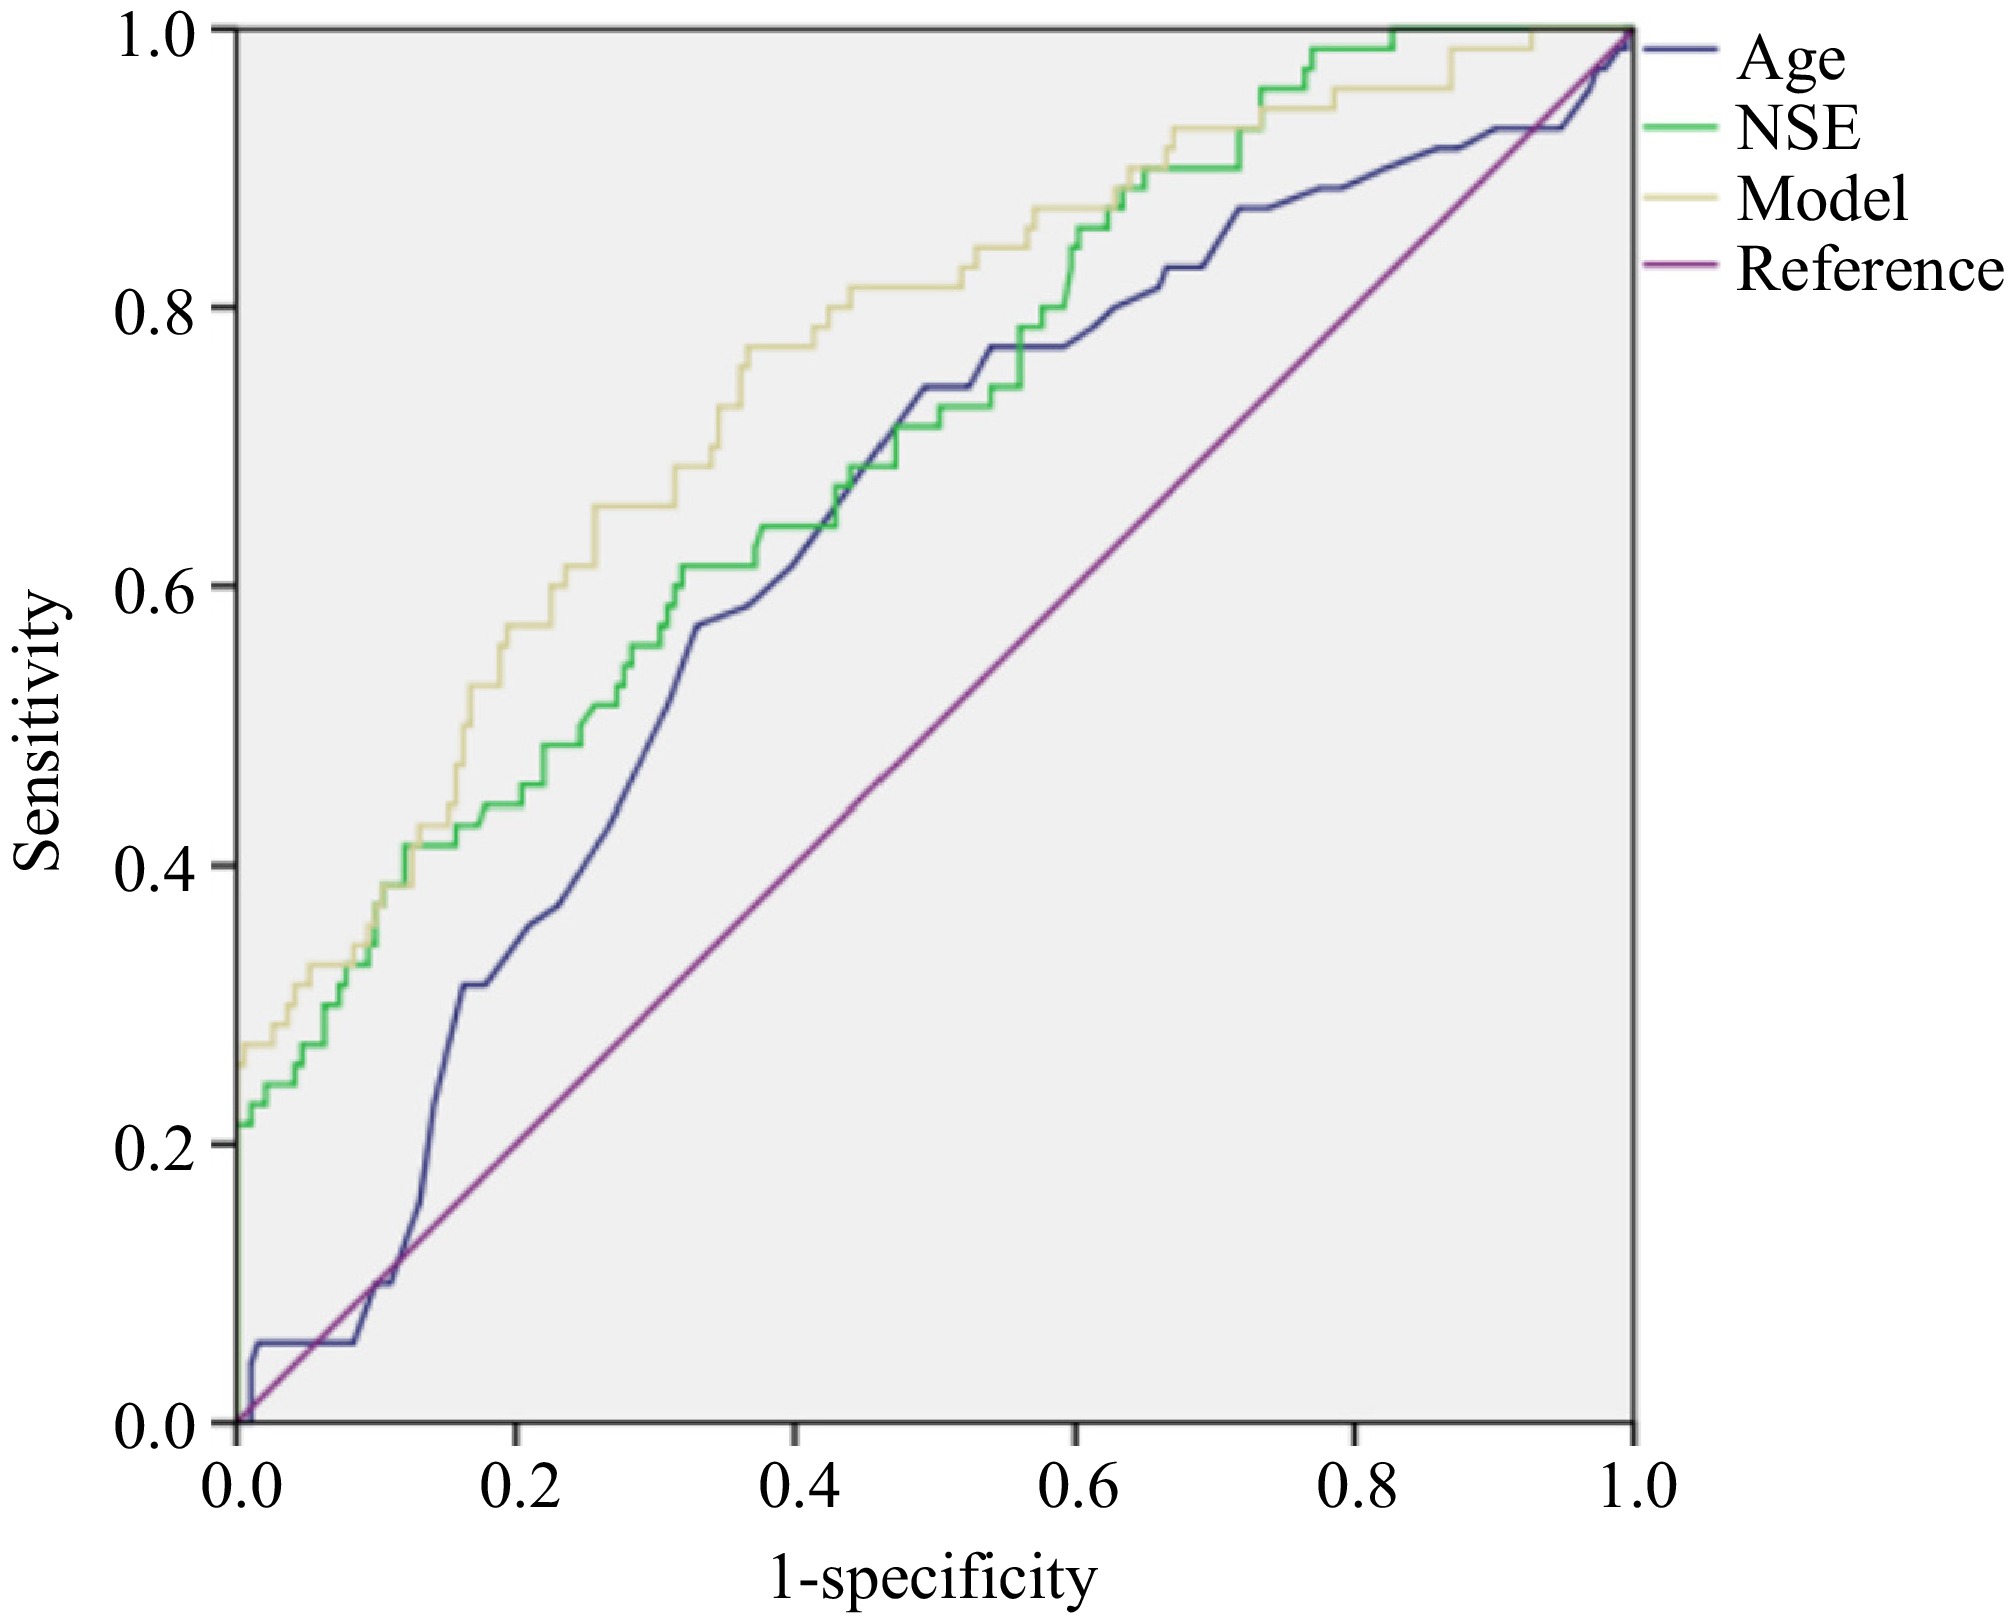
Figure 1.
ROC curves of age, NSE, and combined model to predict grade of rNETs.
-
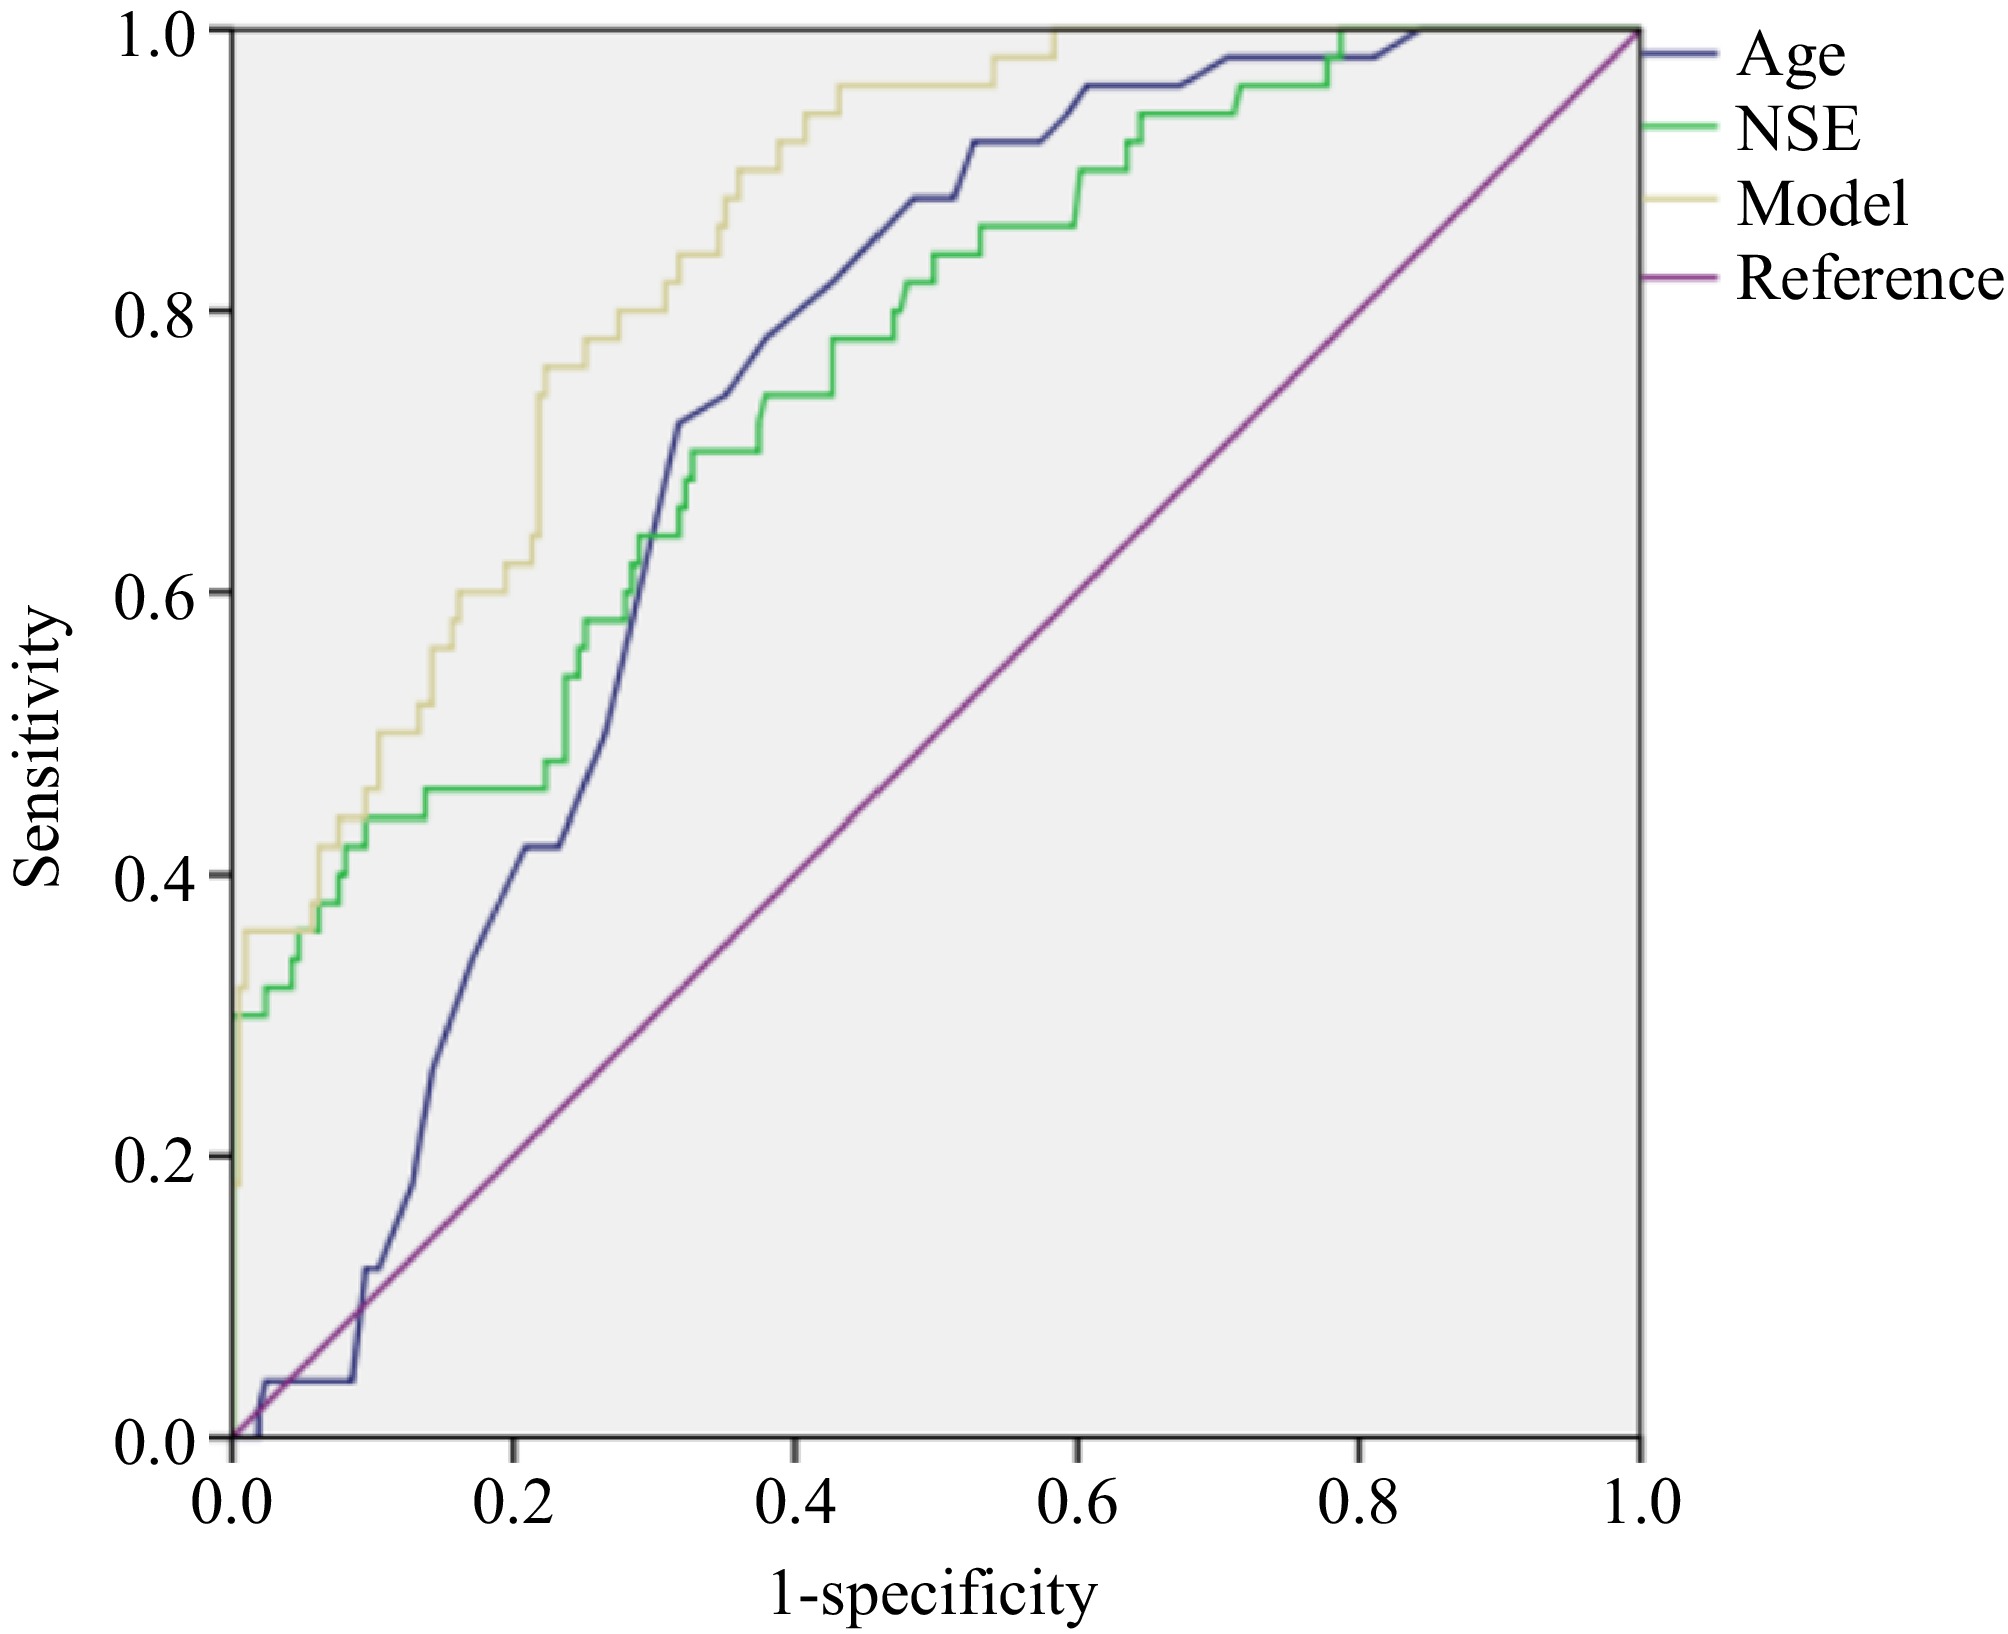
Figure 2.
ROC curves of age, NSE, and combined model to predict metastasis of rNETs.
-
G1 G2/G3 p Sex (male/female) 121/70 31/39 0.006 Age (years) 50.46 ± 11.56 55.03 ± 11.39 0.005 CEA 1.78 (1.19, 2.48) 2.68 (1.35, 4.52) 0.154 CA19-9 10.15 (6.53, 13.47) 11.98 (7.17, 18.05) 0.289 NSE 15.87 (11.48, 19.75) 21.24 (16.49, 45.46) <0.001 Table 1.
Characteristics of rNETs patients with different pathological grade.
-
Without metastasis With metastasis p Sex (male/female) 130/81 22/28 0.023 Age (years) 50.11 ± 11.99 58.32 ± 7.13 < 0.001 CEA 1.76 (1.17, 2.55) 2.78 (1.38, 5.21) 0.011 CA19-9 10.17 (6.53, 13.47) 12.00 (7.17, 25.25) 0.551 NSE 16.07 (11.74, 19.91) 20.45 (16.13, 46.07) < 0.001 Table 2.
Characteristics of rNETs patients with or without metastasis.
-
rNETs Index Sensitivity Specificity AUC 95% CI of AUC Cut-off
valueGrade Age 0.743 0.508 0.626 [0.550, 0.702] 51.500 NSE 0.614 0.681 0.708 [0.638, 0.779] 17.950 Model 0.771 0.634 0.756 [0.689, 0.823] 0.211 Metastasis Age 0.720 0.682 0.723 [0.658, 0.788] 55.500 NSE 0.700 0.673 0.757 [0.684, 0.830] 17.945 Model 0.900 0.640 0.847 [0.796, 0.899] 0.125 Table 3.
Results of ROCs to predict grade and metastasis of rNETs.
Figures
(2)
Tables
(3)