-
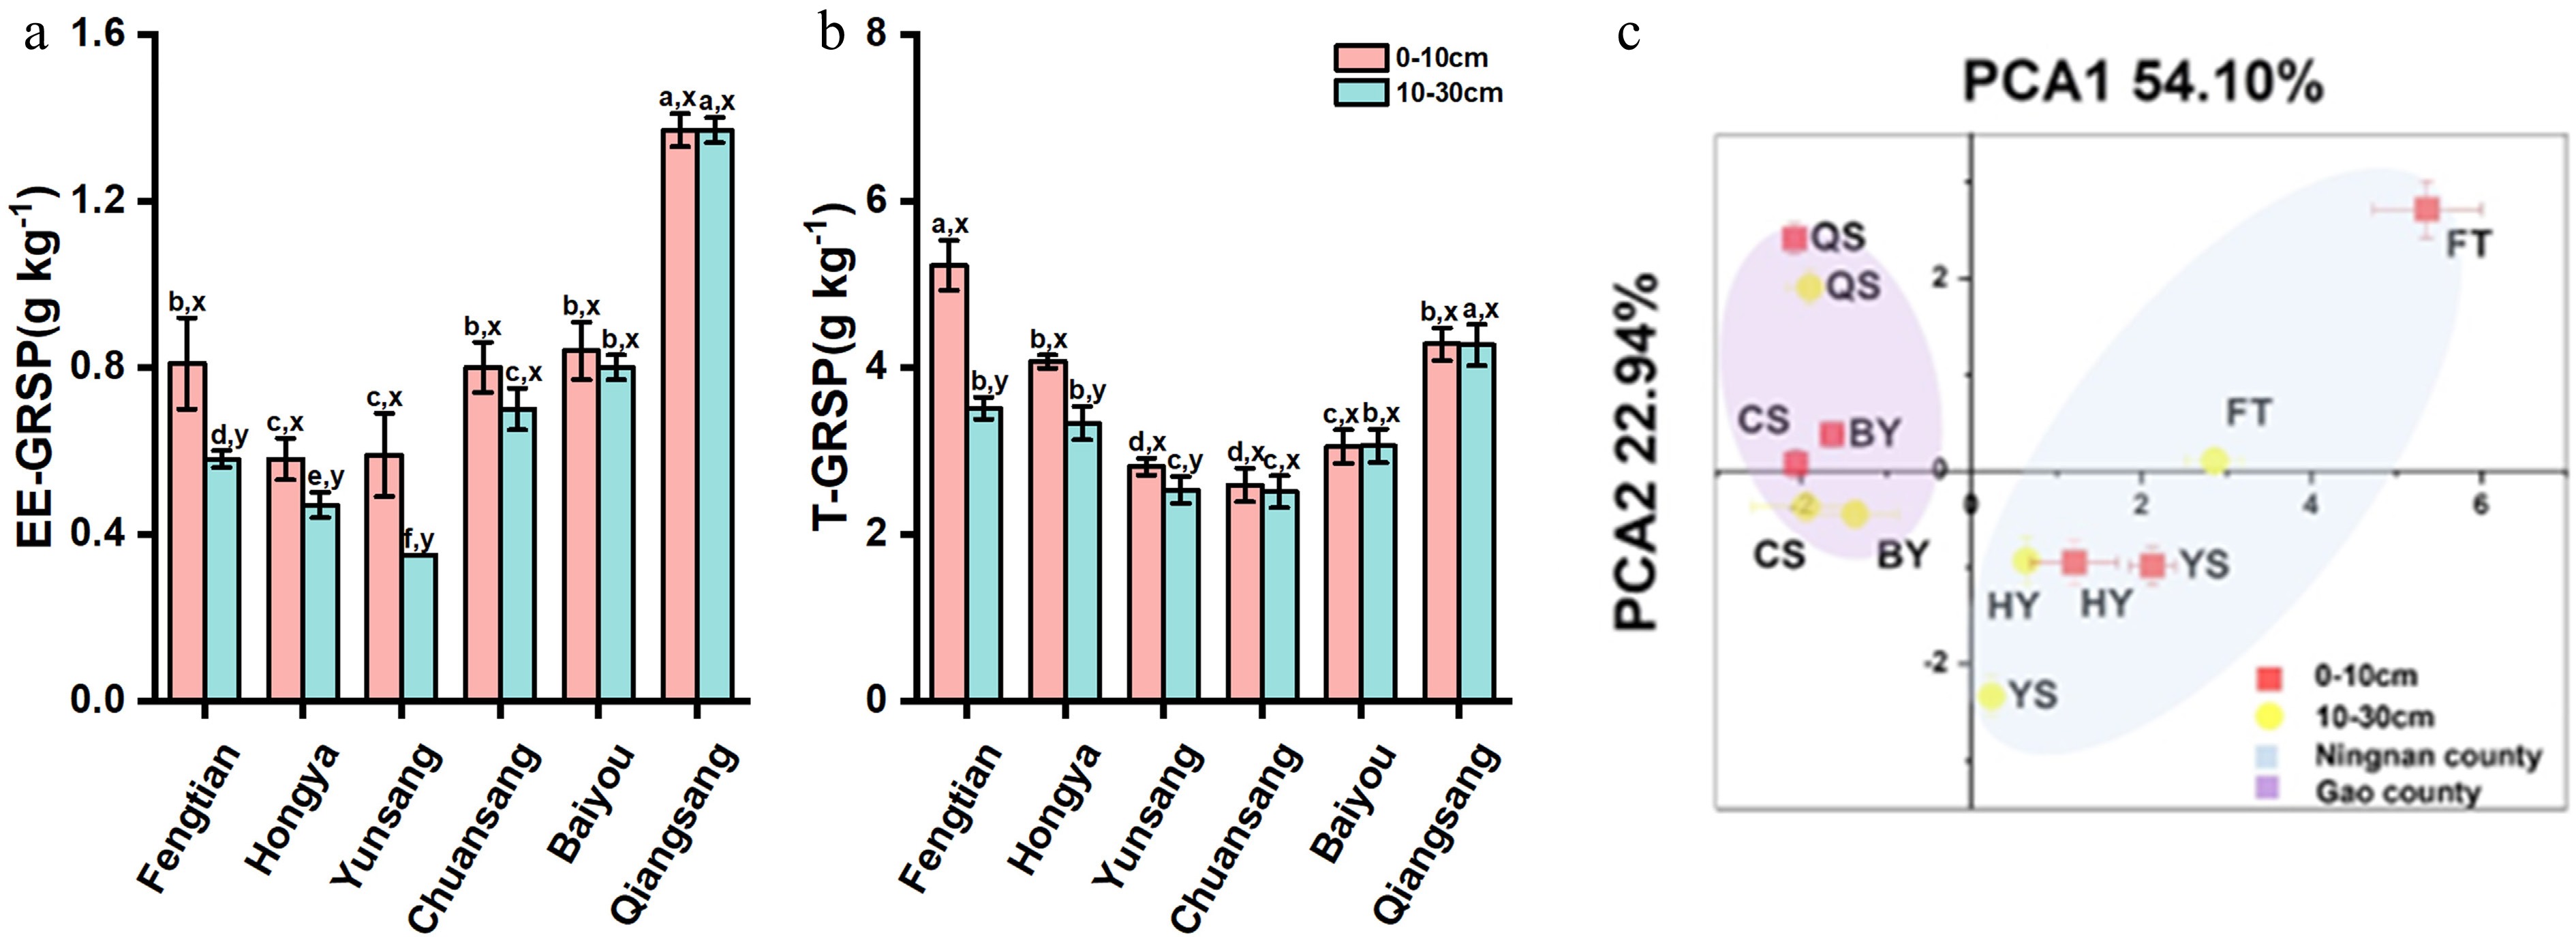
Figure 1.
(a) Variations of easily-extractable glomalin-related soil protein (EE-GRSP), and (b) total GRSP (T-GRSP) between different varieties of mulberry orchids across two soil layers. (c) Soil fertility index load chart in the rhizosphere soil of different varieties mulberry across two soil layers from Gao County and Ningnan County, Sichuan Province, China. Data (means ± SE, n = 3) followed by different letters (a, b, c, d) indicate significant differences among mulberry varieties within the same soil layer (p < 0.05) and different lowercase (x, y) means significant differences between different soil layers in mulberry fields of the same variety (p < 0.05). FT: FengTian; HY: HongYa; YS: YunSang; CS: ChuanSang; BY: BaiYou; QS: QiangSang.
-
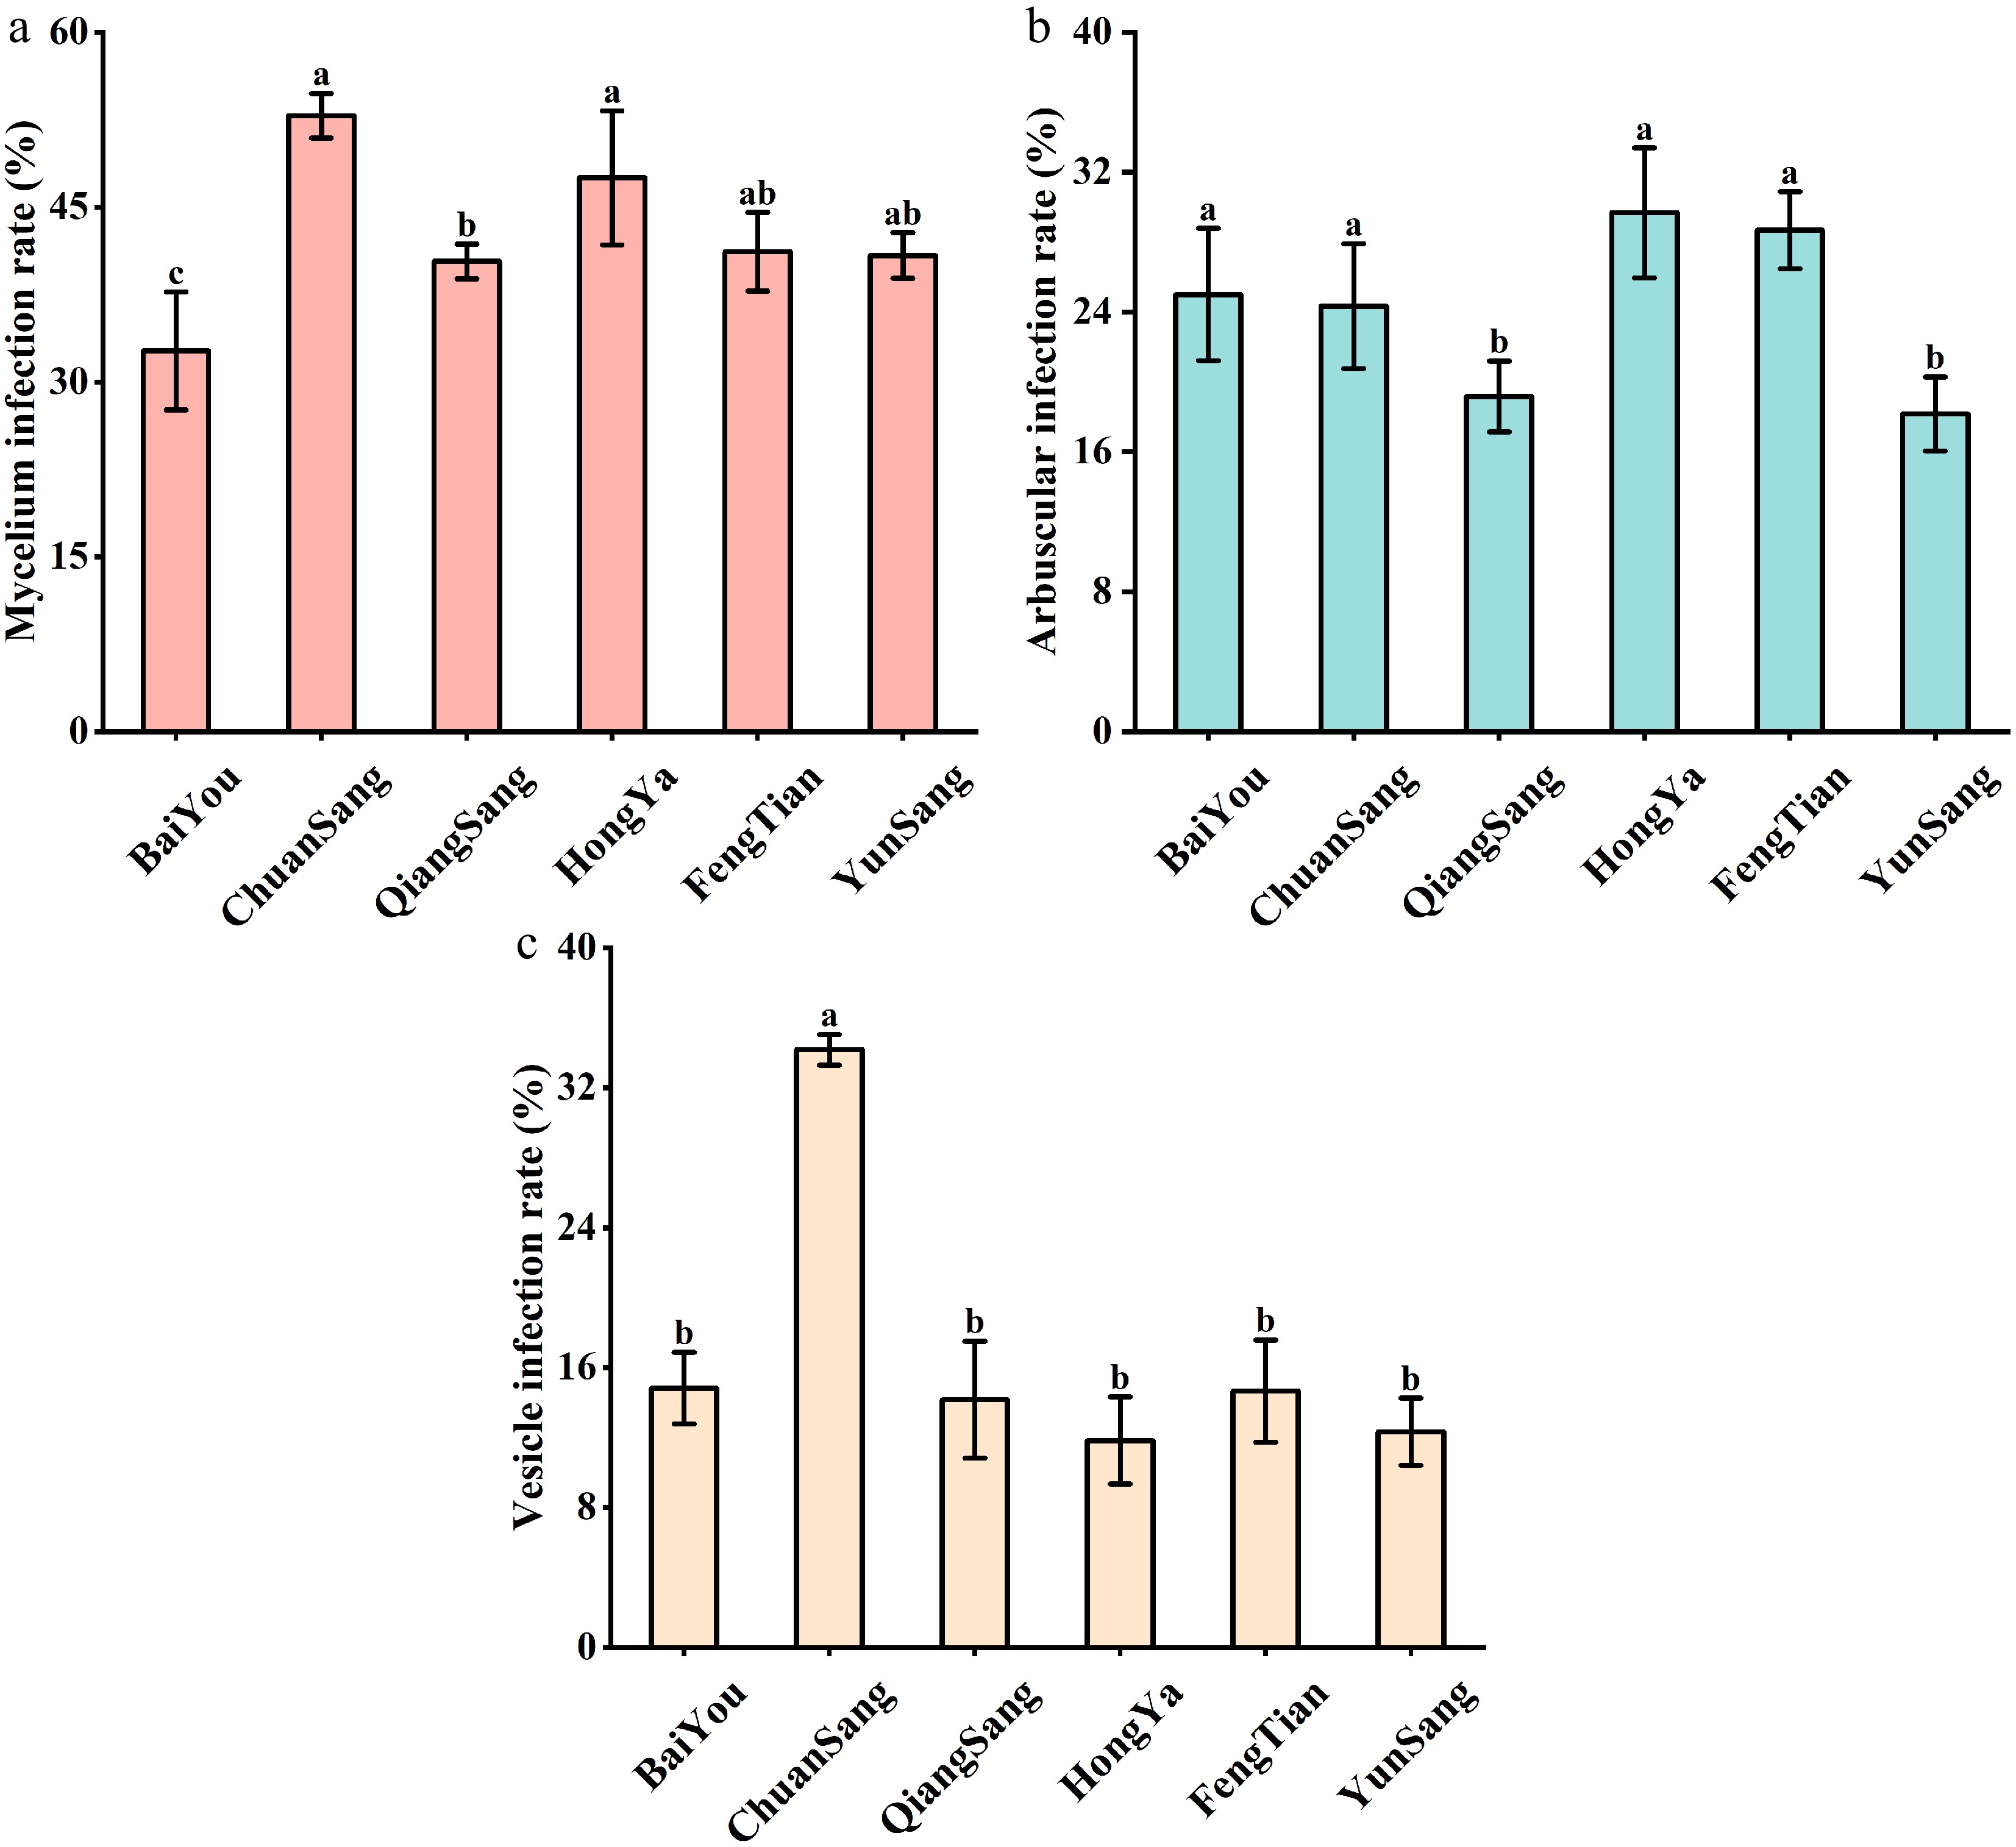
Figure 2.
Variations in observed (a) mycelium colonization, (b) arbuscular colonization, and (c) vesicle colonization in different cultivars of mulberry orchards. Data (means ± SE, n = 3) followed by different letters (a, b, c, d) indicate significant differences among mulberry varieties (P < 0.05).
-
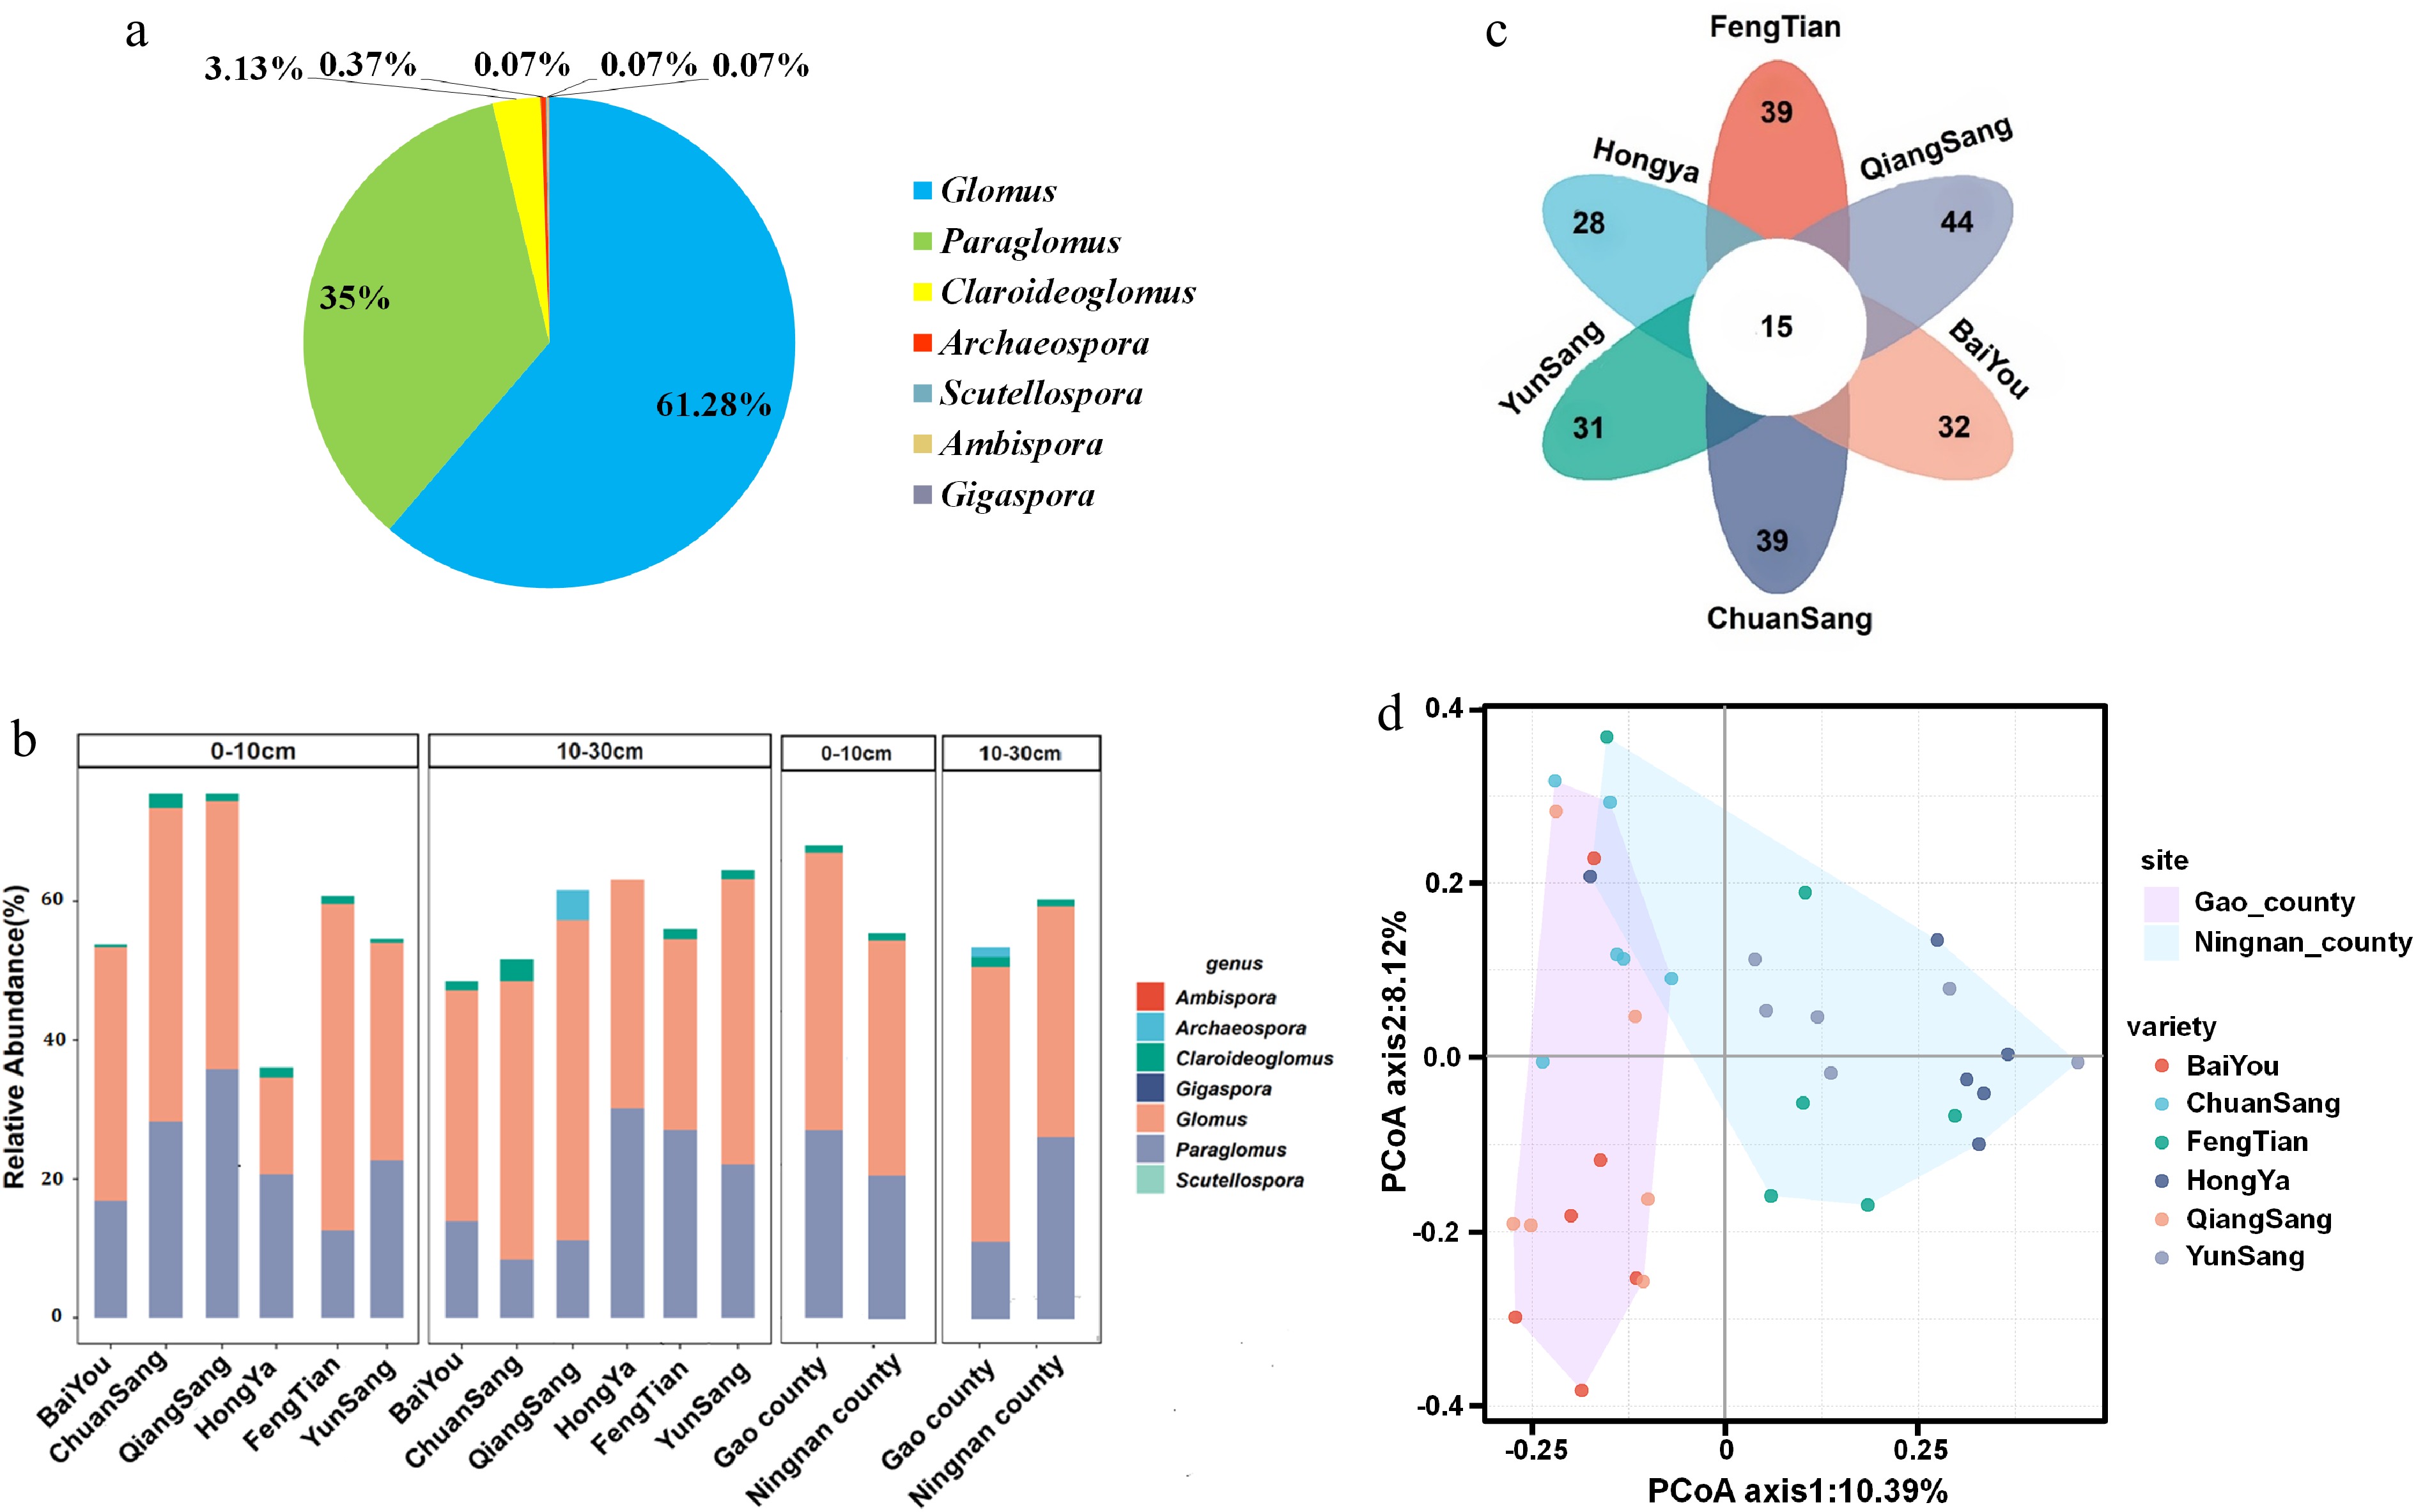
Figure 3.
(a) Composition of AMF communities in the rhizosphere soil of mulberry from Gao and Ningnan Counties, Sichuan Province. (b) Relative abundances of AMF genus in the rhizosphere soil of mulberry across two soil layers from Gao and Ningnan Counties, Sichuan Province. (c) Numbers of the Virtual taxa species in the rhizosphere soil of six different varieties mulberry. (d) Principal coordinate analysis (PCoA) based on OTUs results showing community dissimilarities between different mulberry varieties.
-
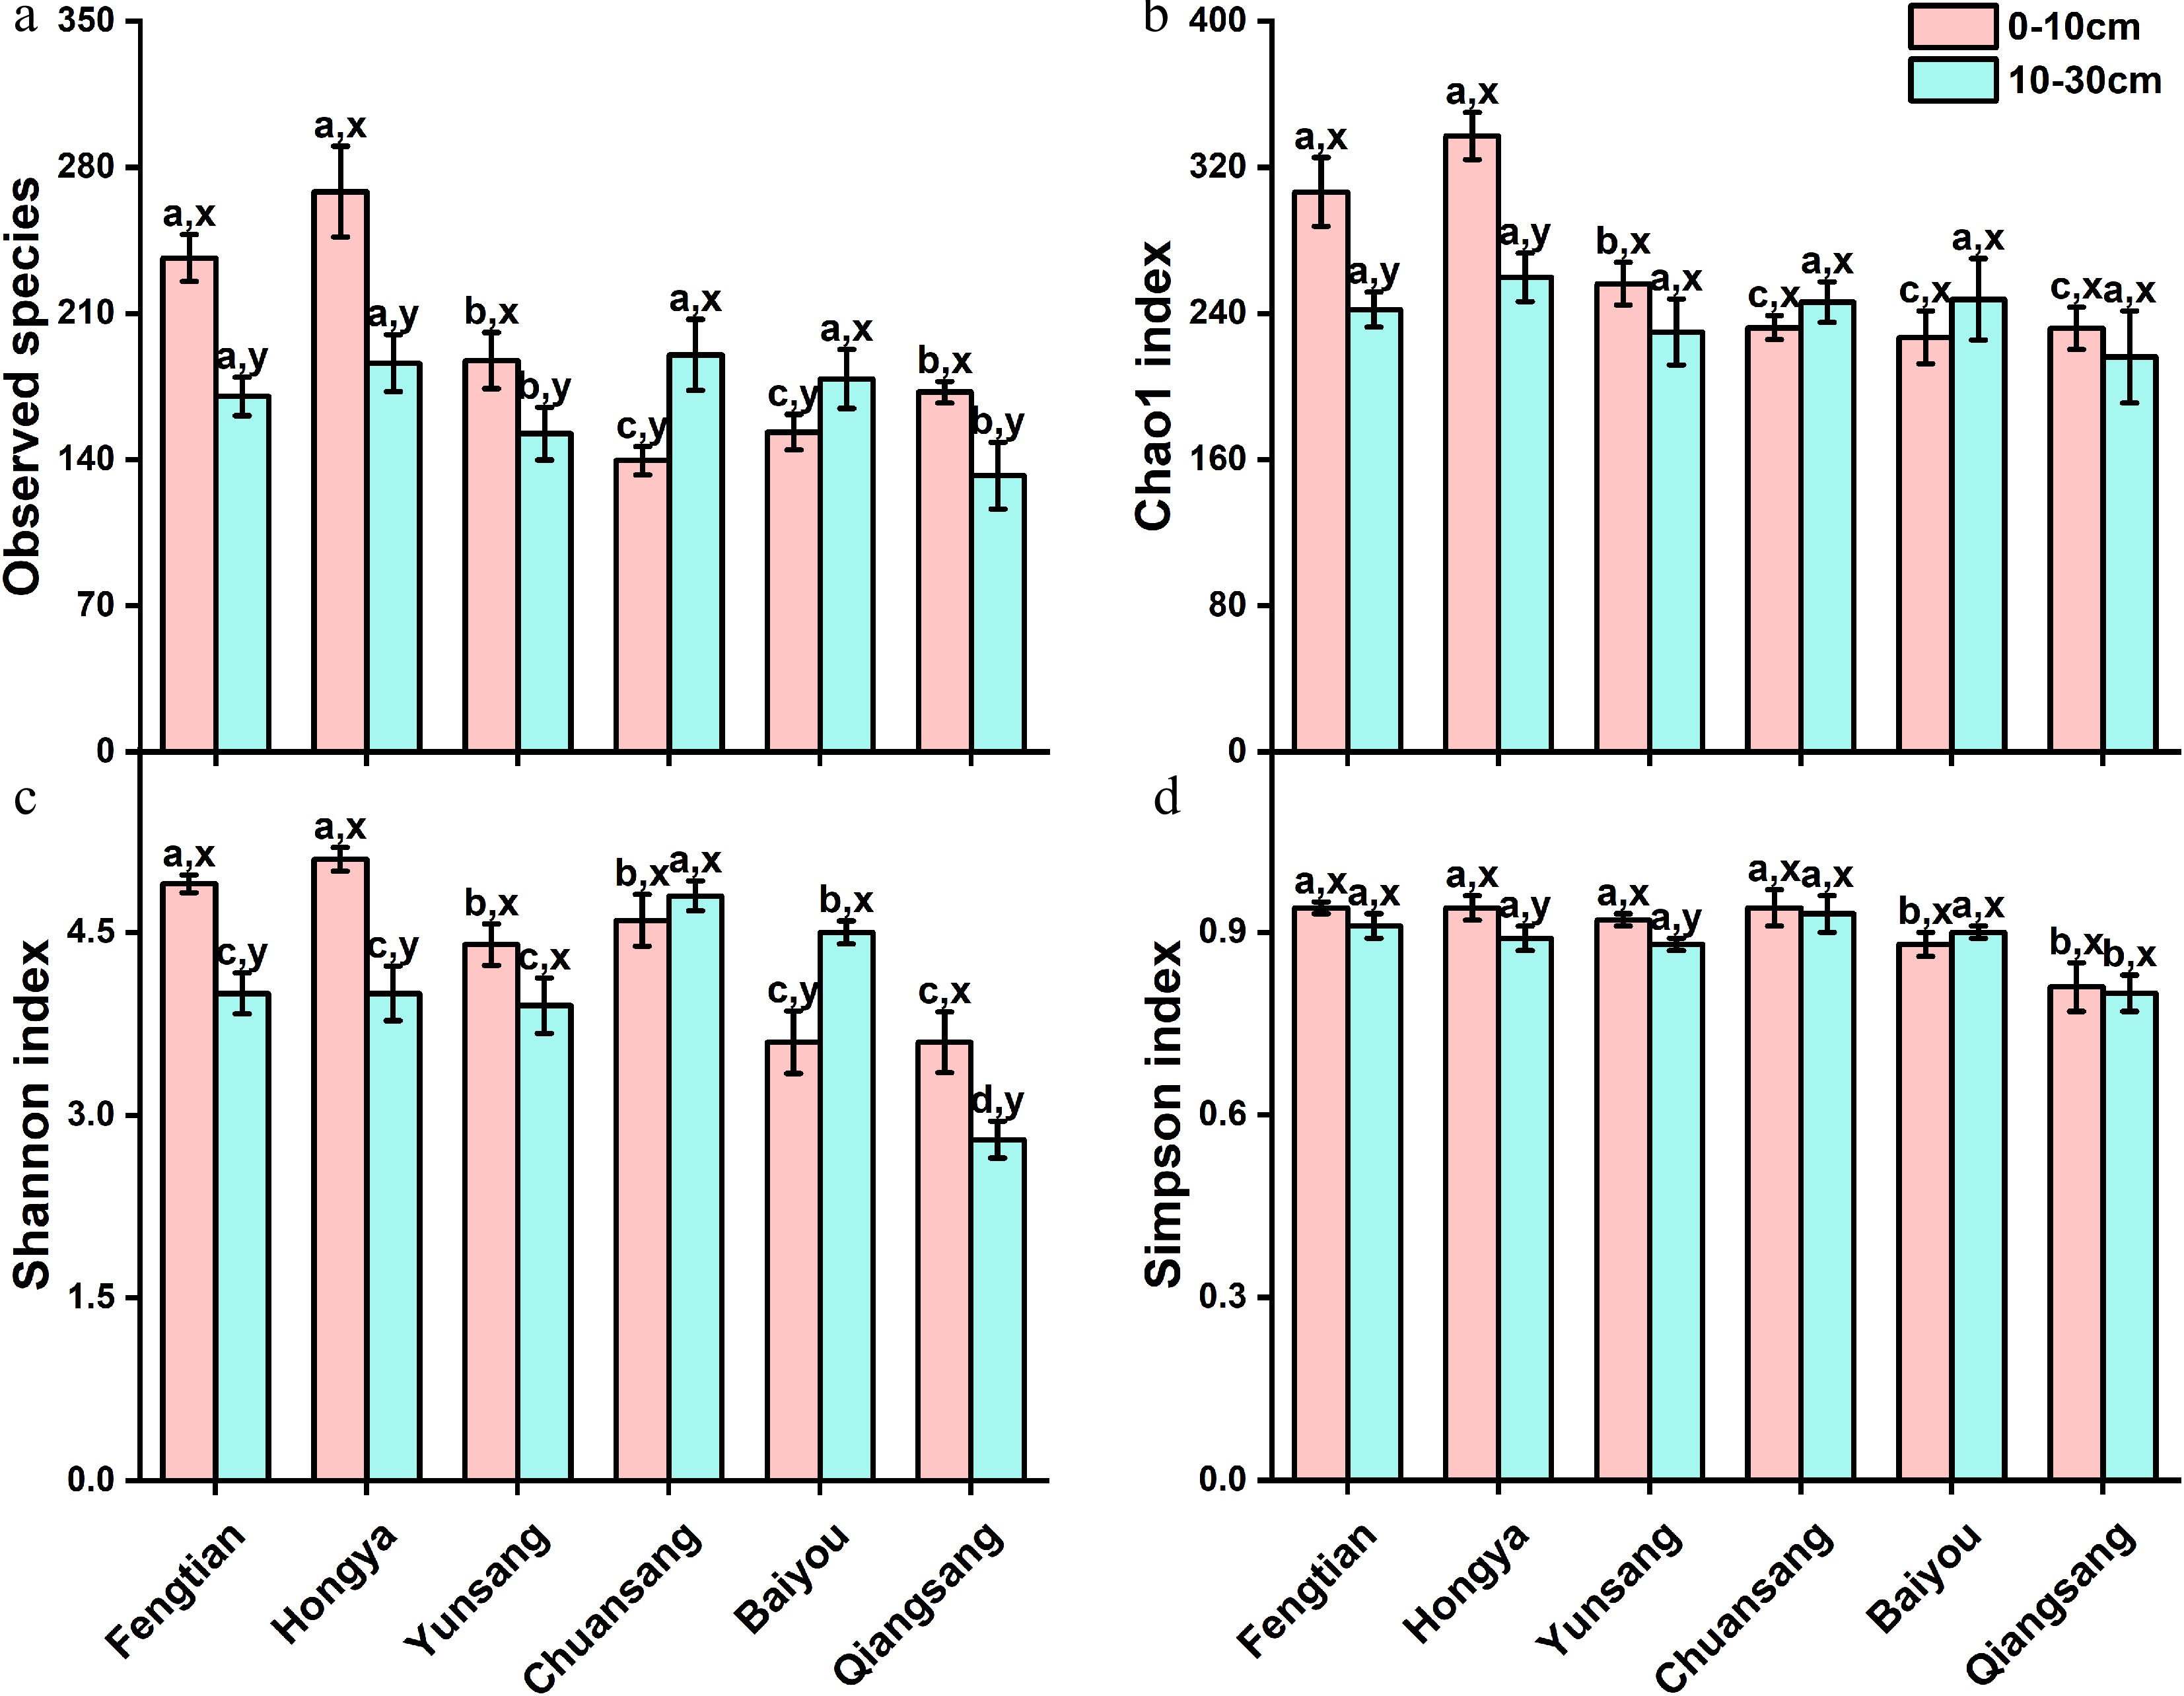
Figure 4.
Alpha diversity indices, (a) Chao 1, (b) observed species, (c) Simpson, and (d) Shannon of AMF in the rhizosphere soil of mulberry across two soil layers from Gao and Ningnan counties, Sichuan Province. Data (means ± SE, n = 3) followed by different letters (a, b, c, d) indicate significant differences among mulberry varieties within the same soil layer (p < 0.05) and different lowercase (x, y) means significant differences between different soil layers in mulberry fields of the same variety (p < 0.05).
-
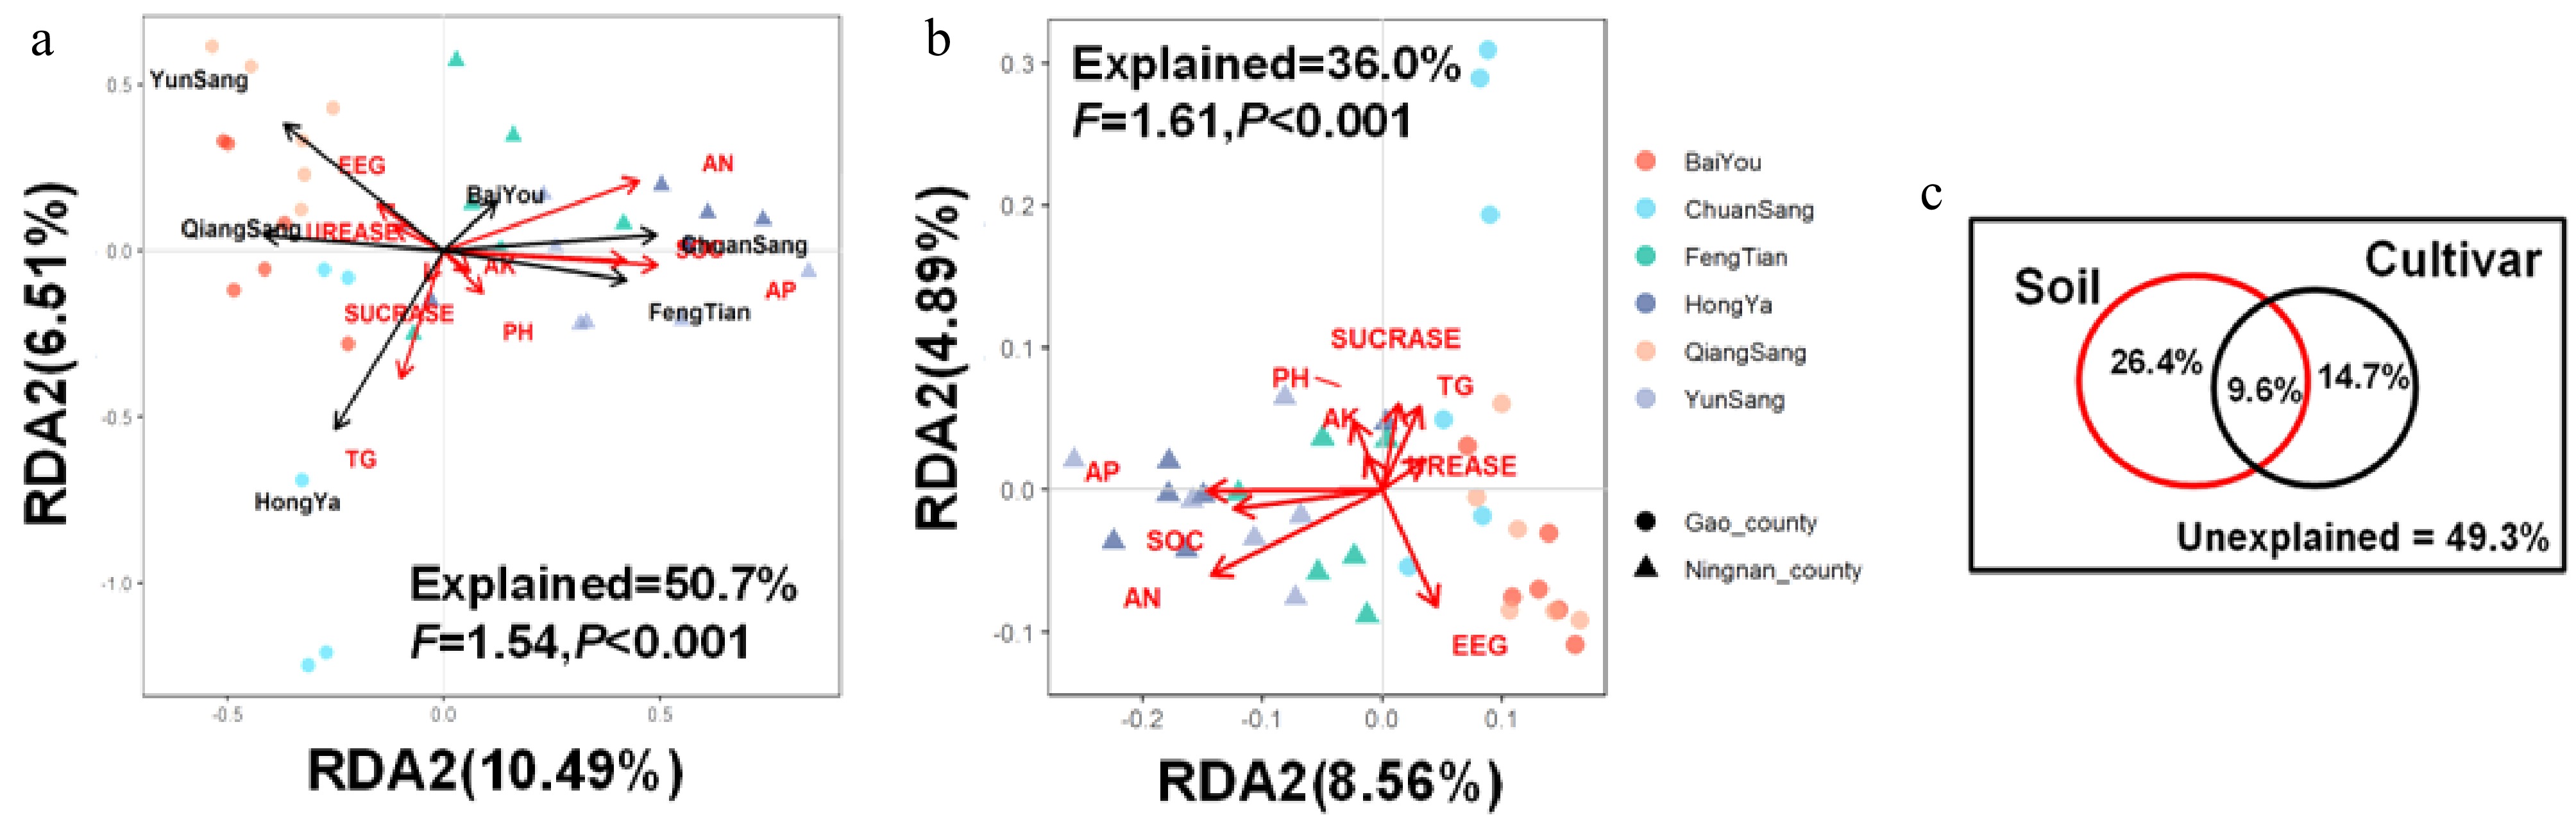
Figure 5.
Hellinger transformation-based redundancy analysis (tbRDA) of AMF abundance with (a), (b) soil properties, and (c) variation partitioning.
-
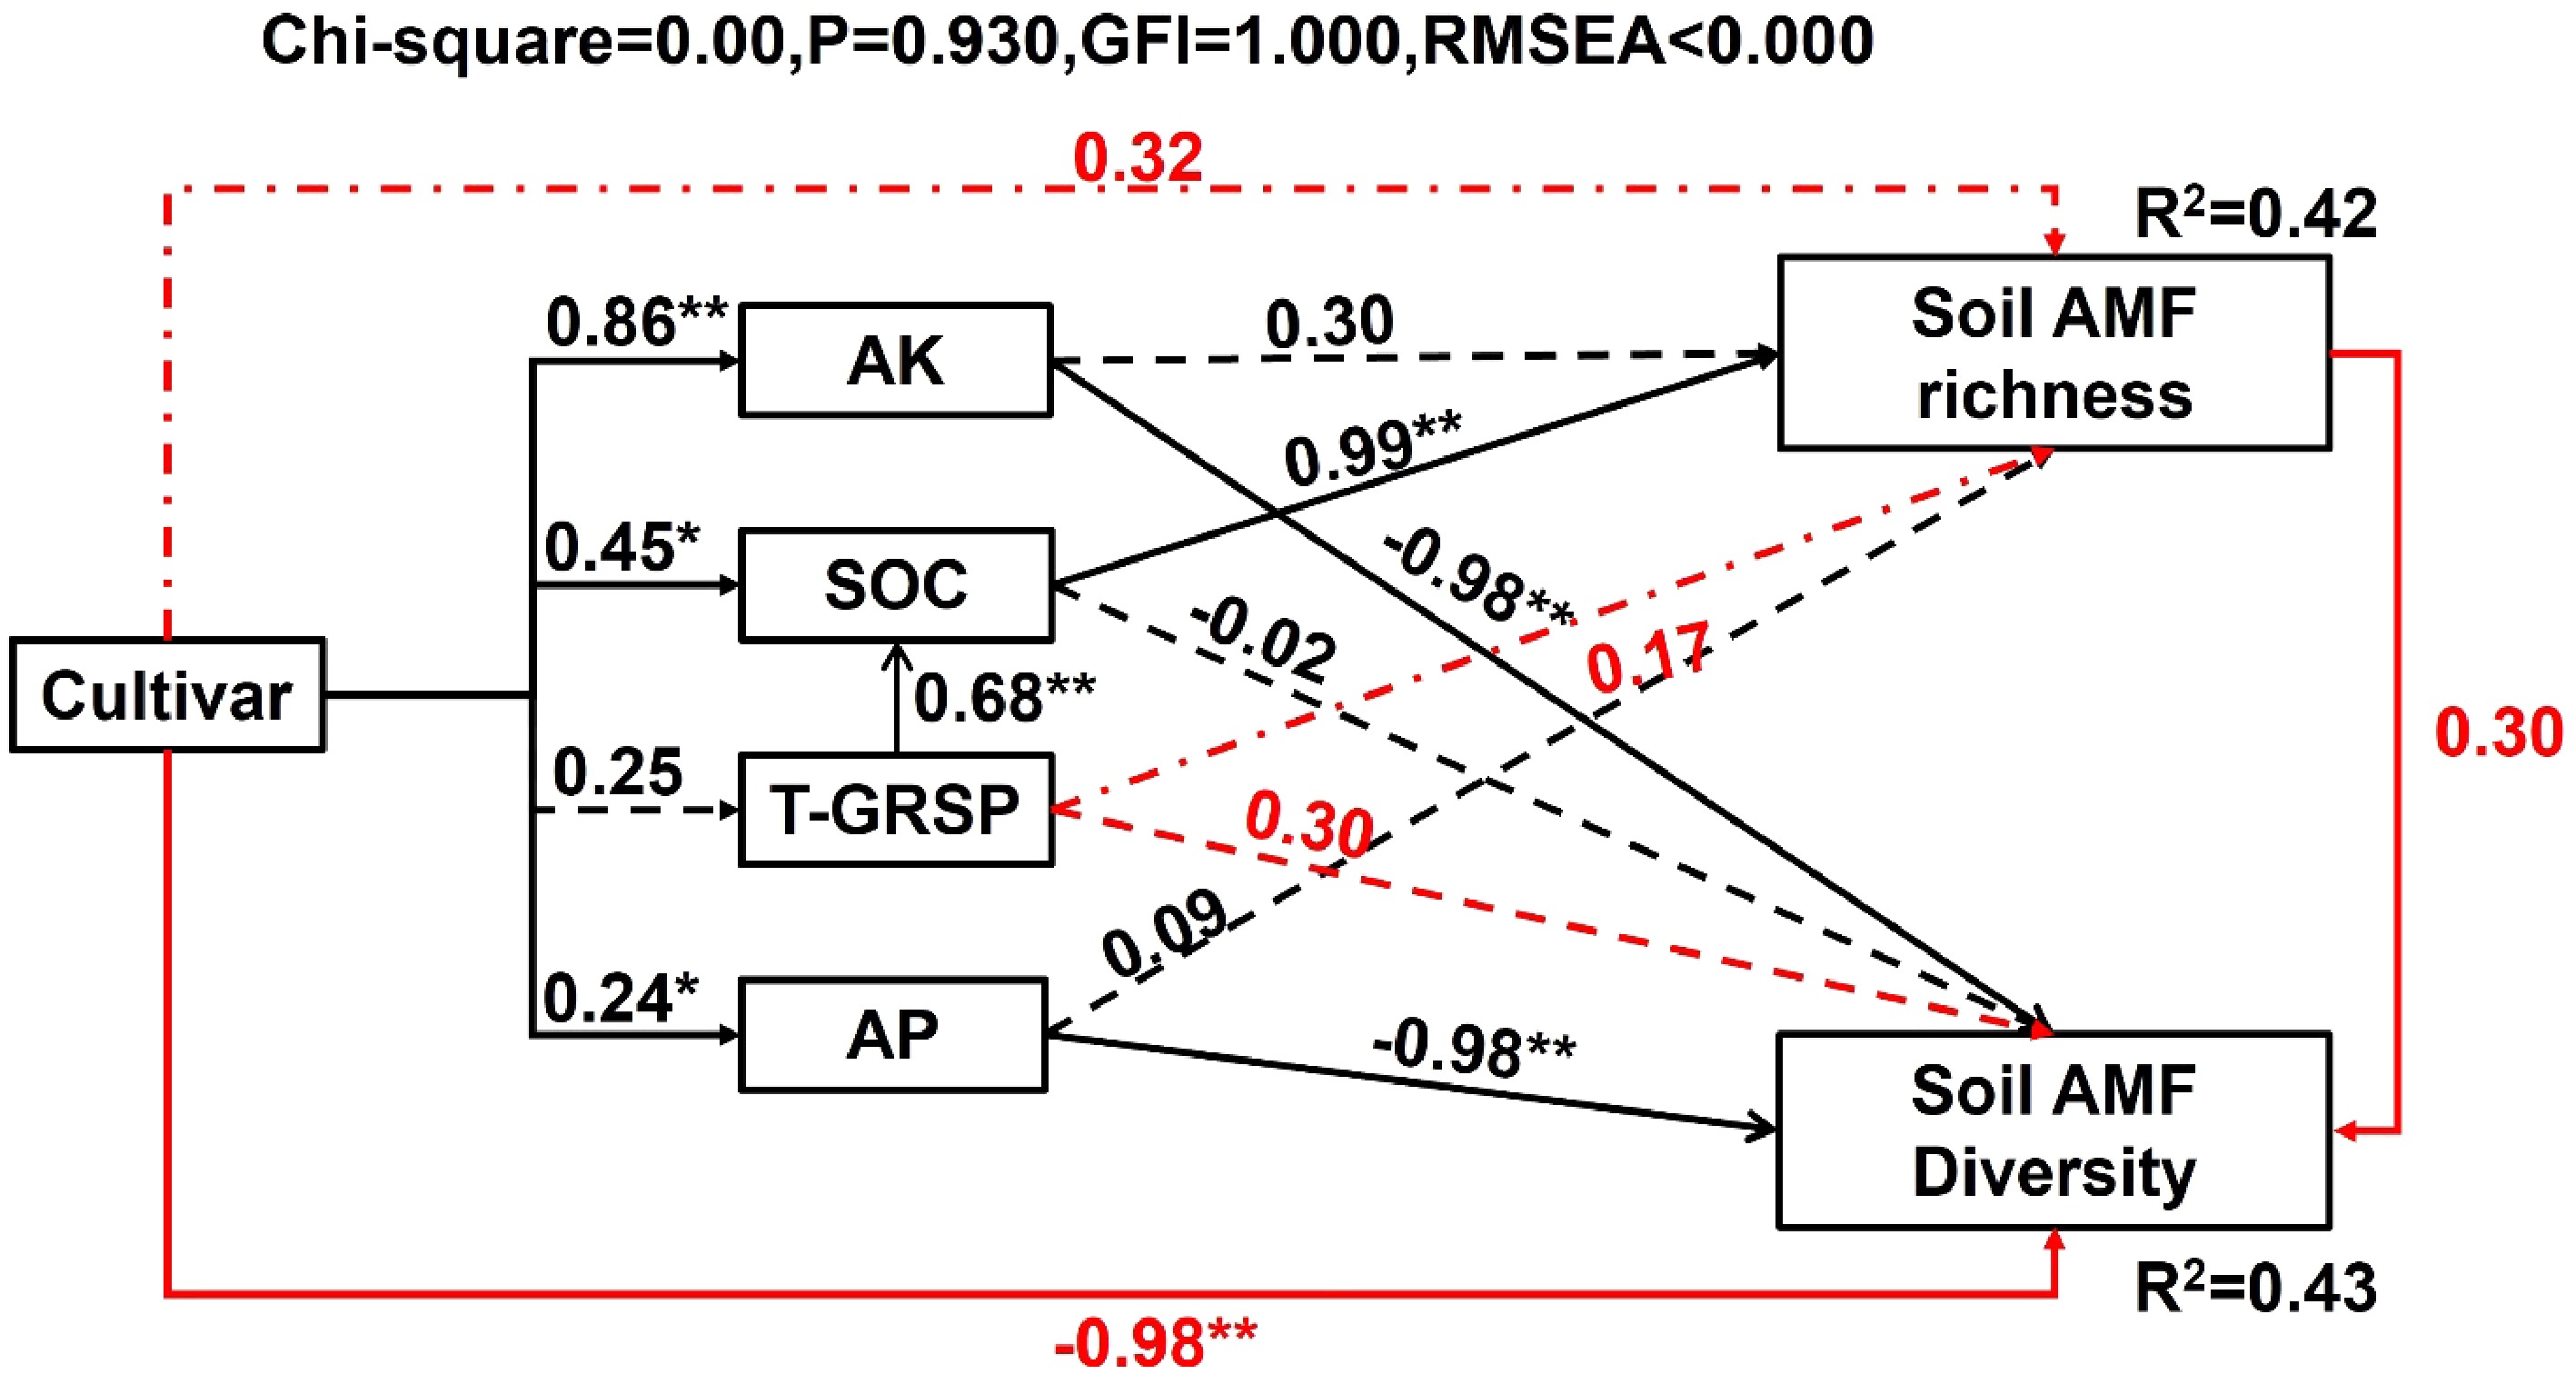
Figure 6.
Structural equation model (SEM) showing direct and indirect effects of cultivar and AP, AK, SOC, and T-GRSP on AMF richness and diversity. The solid lines indicate significant effect; dashed lines indicate insignificant effect. The black and red lines indicate direct and indirect effect, respectively. The number on each line indicate path coefficients; and R2 values represent the proportion of variance explained for AMF richness and diversity (n = 36).
-
Varieties Location Taxonomic group BaiYou Gao County Morus alba L. ChuanSang 98-1 Gao County Morus alba L. QiangSang 1 Gao County Morus multicaulis Perr. HongYa Ningnan County Morus multicaulis Perr. YunSang 1 Ningnan County Morus multicaulis Perr. FengTian 5 Ningnan County Morus multicaulis Perr. 


Table 1.
Basic information of six mulberry varieties in Sichuan Province, southwest China.
-
Variables Soil depth (cm) Gao County Ningnan County F p BaiYou ChuanSang 98-1 QiangSang 1 FengTian 5 HongYa YunSang 1 pH 0−10 5.3 ± 0.2b, y 5.5 ± 0.1b, x 4.9 ± 0.2b, x 7.2 ± 0.2a, x 7.4 ± 0.2a, x 7.2 ± 0.2a, x 97.60 < 0.001 10−30 6.3 ± 0.1b, x 5.4 ± 0.2c, x 5.0 ± 0.2c, x 7.4 ± 0.3a, x 6.9 ± 0.2a, x 6.7 ± 0.2a, y 145.16 < 0.001 SOC (g/kg) 0−10 9.7 ± 0.1e, x 8.0 ± 0.6f, x 17.5 ± 0.7b, x 118.7 ± 28.6a, x 10.5 ± 0.1d, x 14.3 ± 0.1c, x 41.95 < 0.001 10−30 9.3 ± 0.2c, x 7.1 ± 0.2c, y 15.4 ± 0.3b, y 69.6 ± 10.9a, y 7.8 ± 0.3d, y 6.9 ± 0.2d, y 93.88 < 0.001 AN (mg/kg) 0−10 123.0 ± 3.7a, x 136.0 ± 11.0a, x 115.7 ± 3.0b, x 88.5 ± 5.9d, x 104.2 ± 6.5c, x 84.3 ± 12.5d, x 15.89 < 0.001 10−30 83.0 ± 4.7b, y 107.5 ± 10.6a, y 63.6 ± 6.1b, y 79.8 ± 11.4b, x 52.5 ± 15.4c, y 38.3 ± 10.3c, y 14.55 < 0.001 AP (mg/kg) 0−10 62.2 ± 4.5d, x 136.1 ± 14.6c, x 25.9 ± 2.6e, x 170.9 ± 16.4a, x 166.0 ± 8.3c, x 257.8 ± 11.2b, x 227.76 < 0.001 10−30 32.7 ± 2.0d, y 112.2 ± 2.7b, y 16.7 ± 3.1e, y 95.5 ± 5.3a, y 50.7 ± 1.6c, y 25.9 ± 3.3d, y 785.51 < 0.001 AK (mg/kg) 0−10 47.7 ± 2.1d, x 37.7 ± 0.6e, x 52.3 ± 1.5d, x 179.7 ± 7.5a, x 102.0 ± 2.0c, x 115.3 ± 2.1b, x 741.98 < 0.001 10−30 40.0 ± 1.0e, y 34.7 ± 1.5f, y 46.3 ± 1.5d, y 126.5 ± 2.6a, y 82.3 ± 0.6c, y 94.7 ± 2.1b, y 1371.3 < 0.001 Sucrase (mg/g/h) 0−10 0.41 ± 0.10c, x 0.15 ± 0.16d, x 0.11 ± 0.00d, x 2.55 ± 0.21a, x 1.53 ± 0.30b, x 2.81 ± 0.42a, x 30.94 < 0.001 10−30 0.10 ± 0.08c, y 0.05 ± 0.00c, y 0.06 ± 0.01c, y 1.58 ± 0.23a, y 1.38 ± 0.06a, x 0.80 ± 0.06b, y 48.96 < 0.001 Urease (mg/g/h) 0−10 0.05 ± 0.00c, x 0.04 ± 0.00d, x 0.03 ± 0.00d, x 0.14 ± 0.00b, x 0.14 ± 0.00b, x 0.20 ± 0.00a, x 87.63 < 0.001 10−30 0.04 ± 0.00d, x 0.04 ± 0.00d, x 0.04 ± 0.00d, x 0.12 ± 0.01a, y 0.08 ± 0.01b, y 0.06 ± 0.01c, y 92.78 < 0.001 Values are the means ± SE, n = 3. Different lowercase letters (a, b, c, d) mean significant differences among mulberry varieties within the same soil layer (p < 0.05) and different lowercase letters (x, y) mean significant differences between different soil layers in mulberry fields of the same variety (p < 0.05). Table 2.
Variations in soil chemical properties and enzymatic activities within the rhizosphere of different varieties mulberry across two soil layers.
-
Group F model R2 Padj QiangSang 1 BaiYou 1.94 0.16 0.045 ChuanSang 98-1 2.00 0.17 0.075 HongYa 2.55 0.20 0.015 YunSang 1 2.31 0.19 0.045 FengTian 5 2.26 0.18 0.045 BaiYou ChuanSang 98-1 1.88 0.16 0.18 HongYa 2.75 0.22 0.03 YunSang 1 2.44 0.20 0.015 FengTian 5 2.21 0.18 0.105 ChuanSang 98-1 HongYa 2.26 0.18 0.195 YunSang 1 2.10 0.17 0.045 FengTian 5 2.14 0.18 0.21 HongYa YunSang 1 1.12 0.10 1 FengTian 5 1.43 0.13 1 YunSang 1 FengTian 5 1.62 0.14 0.165 Table 3.
PERMANOVA statistical results of AMF communities among six mulberry varieties.
-
Explaining variable RDA model explained By variety and soil R2 = 0.507 By soil R2 = 0.350 Variance F Pr (> F) Variance F Pr (> F) Variety 0.115 1.25 0.006 − − − AK 0.019 1.05 0.34 0.037 1.94 0.003 T-GRSP 0.020 1.09 0.28 0.032 1.67 0.003 Urease 0.023 1.27 0.07 0.023 1.18 0.147 AP 0.016 0.85 0.85 0.031 1.63 0.004 EE-GRSP 0.018 0.95 0.60 0.024 1.24 0.100 SOC 0.021 1.13 0.22 0.027 1.38 0.023 pH 0.022 1.19 0.14 0.021 1.08 0.292 Sucrase 0.020 1.11 0.24 0.020 1.02 0.401 AN 0.022 1.17 0.14 0.021 1.10 0.233 Table 4.
Monte Carlo permutation tests were used to detect the variance explained by varieties and soil properties.
Figures
(6)
Tables
(4)