-
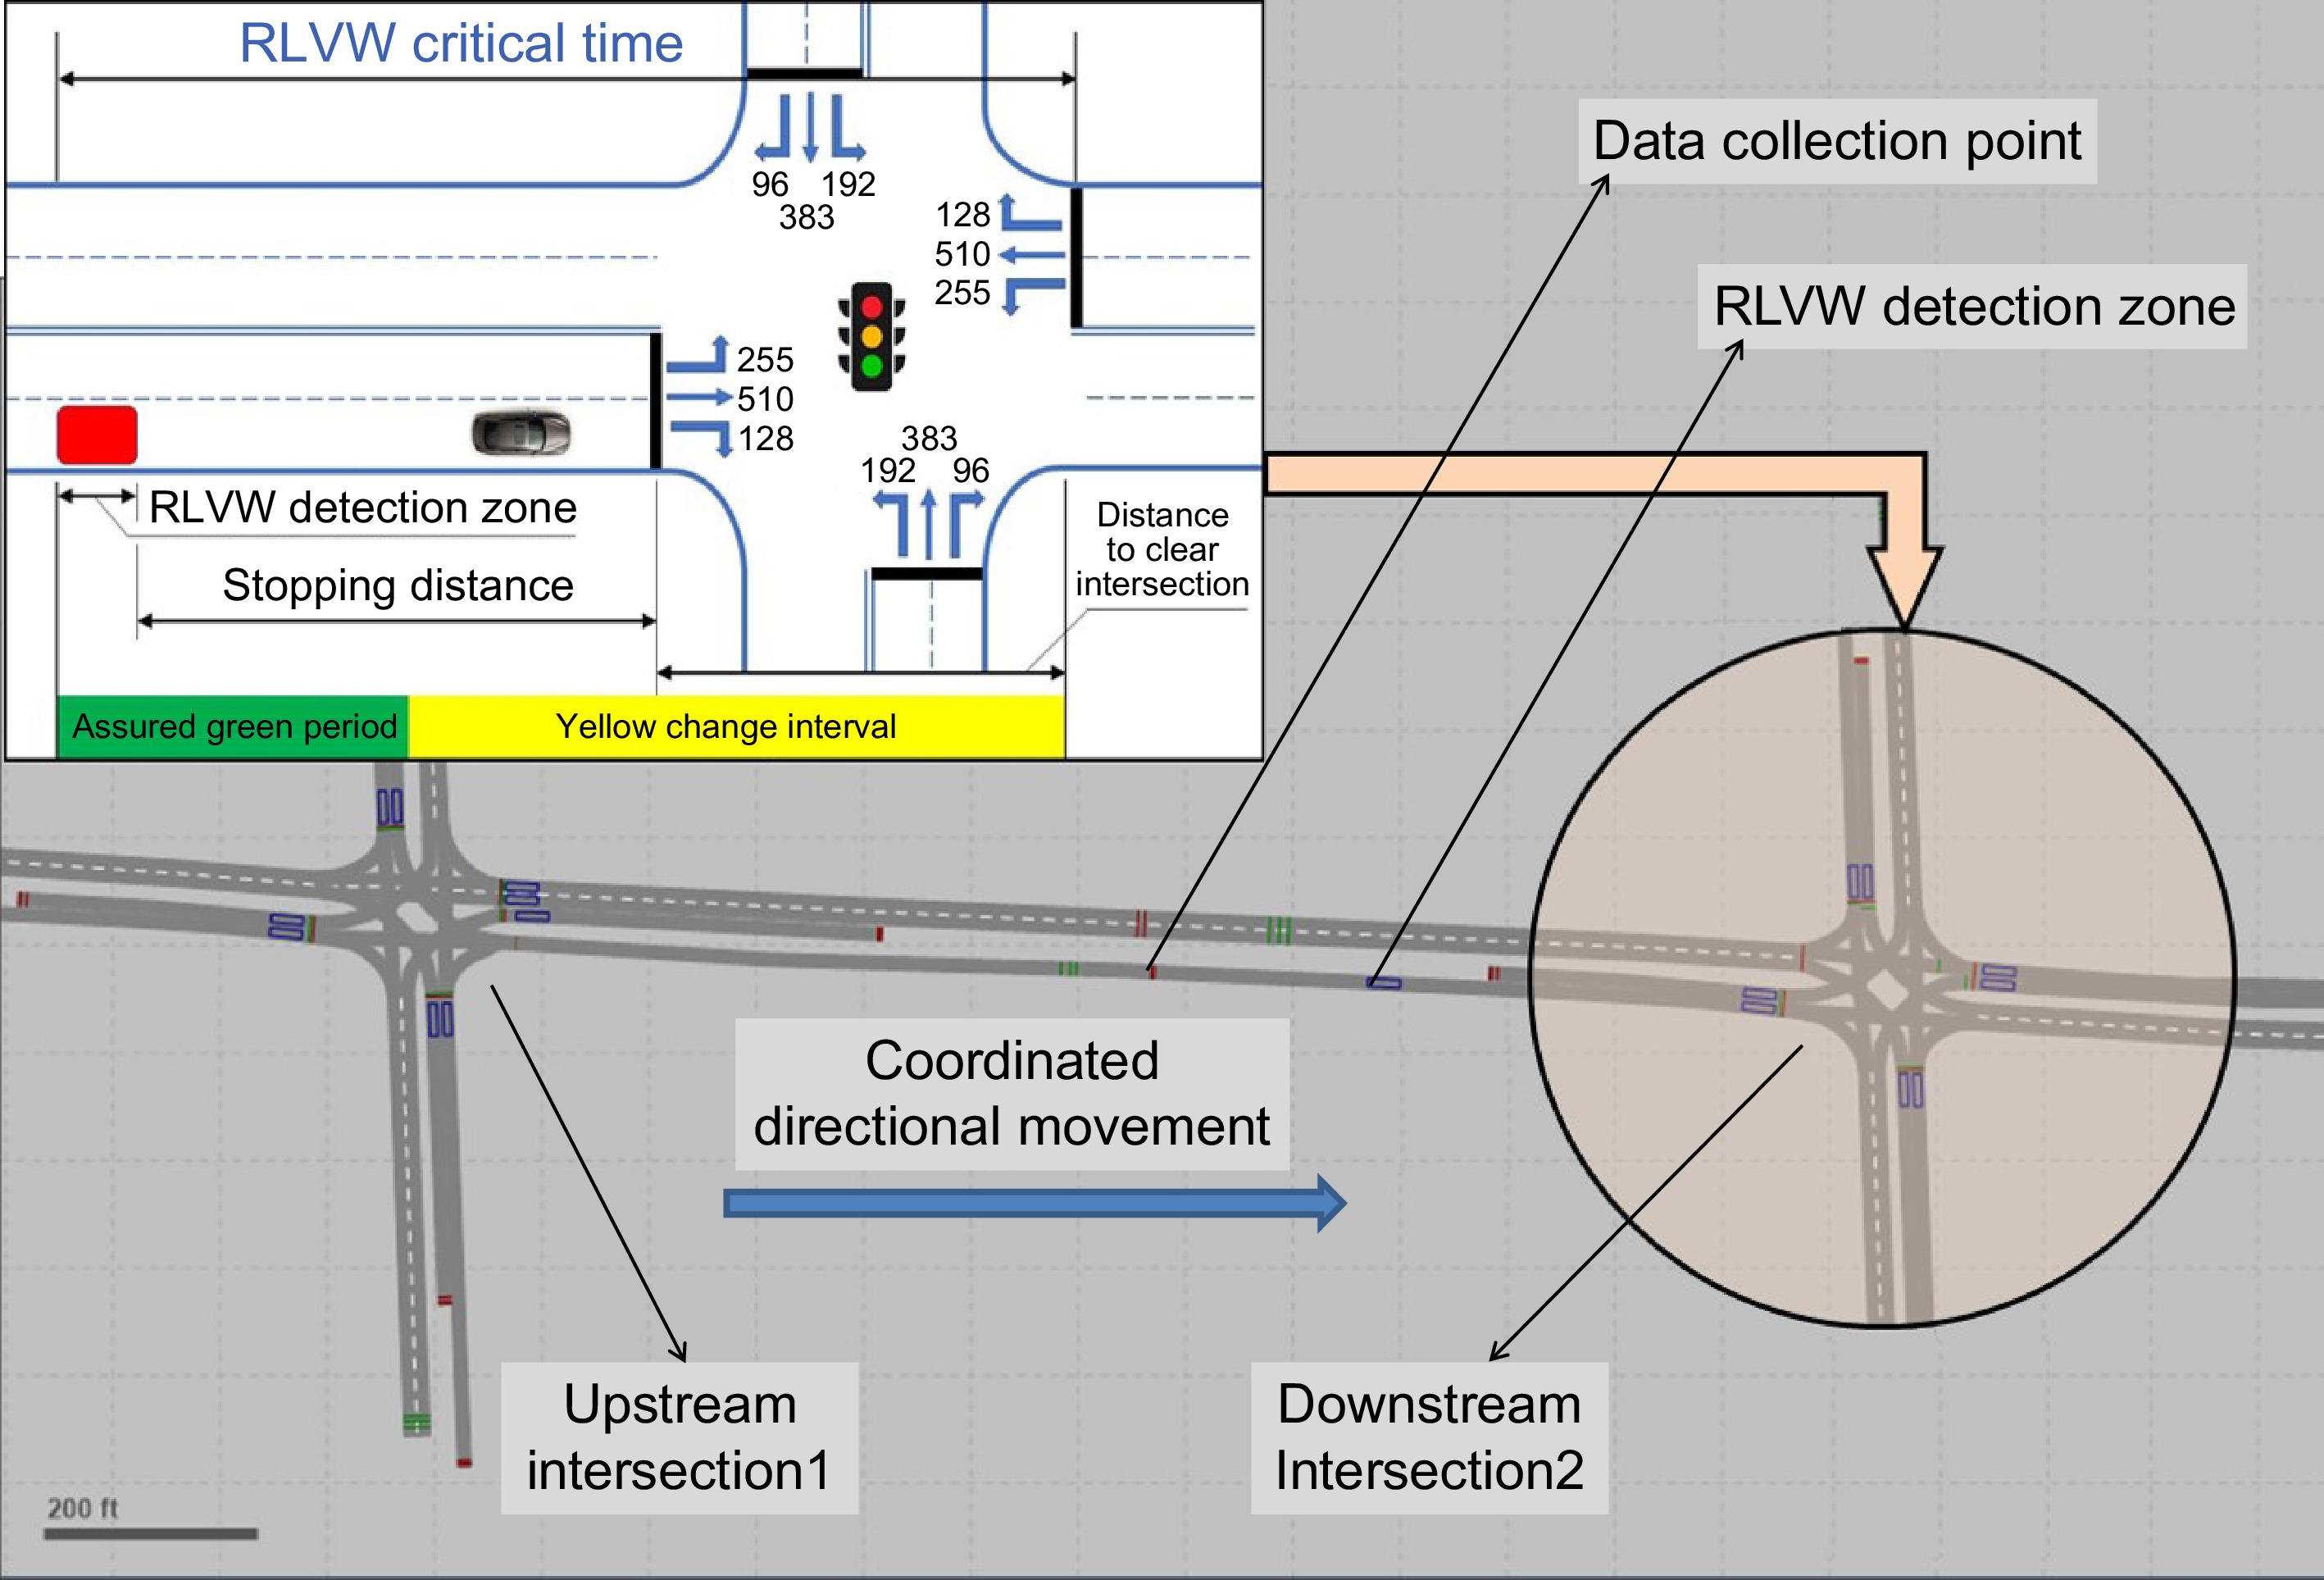
Figure 1.
Case study coordinated signalized intersections.
-
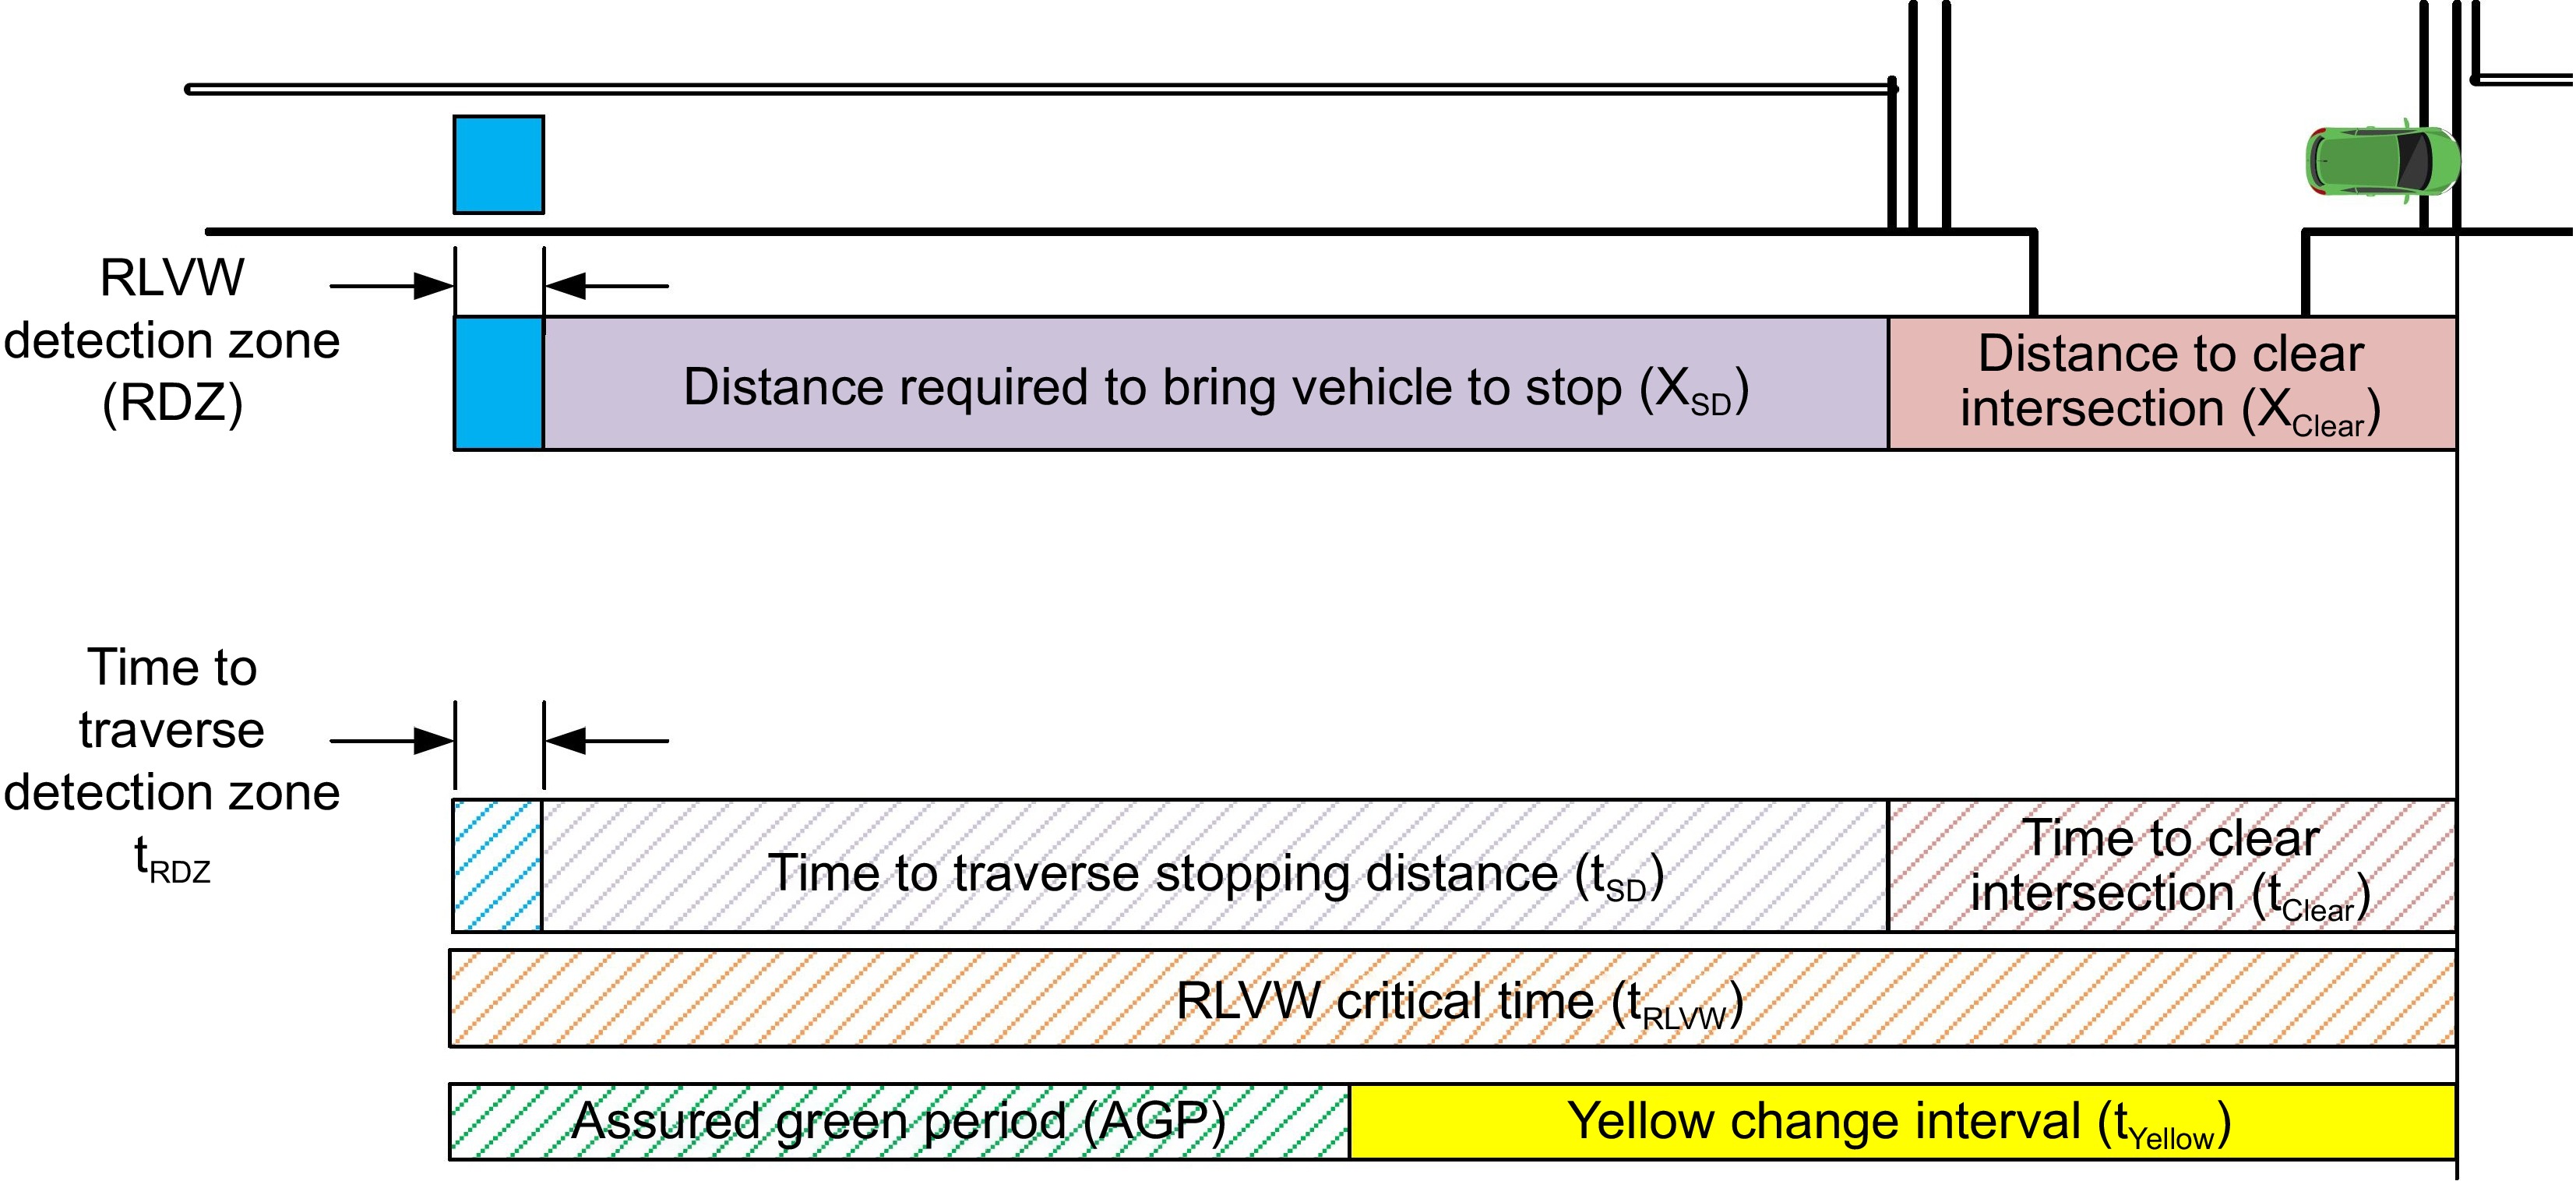
Figure 2.
AGP concept for the RLVW design[1].
-
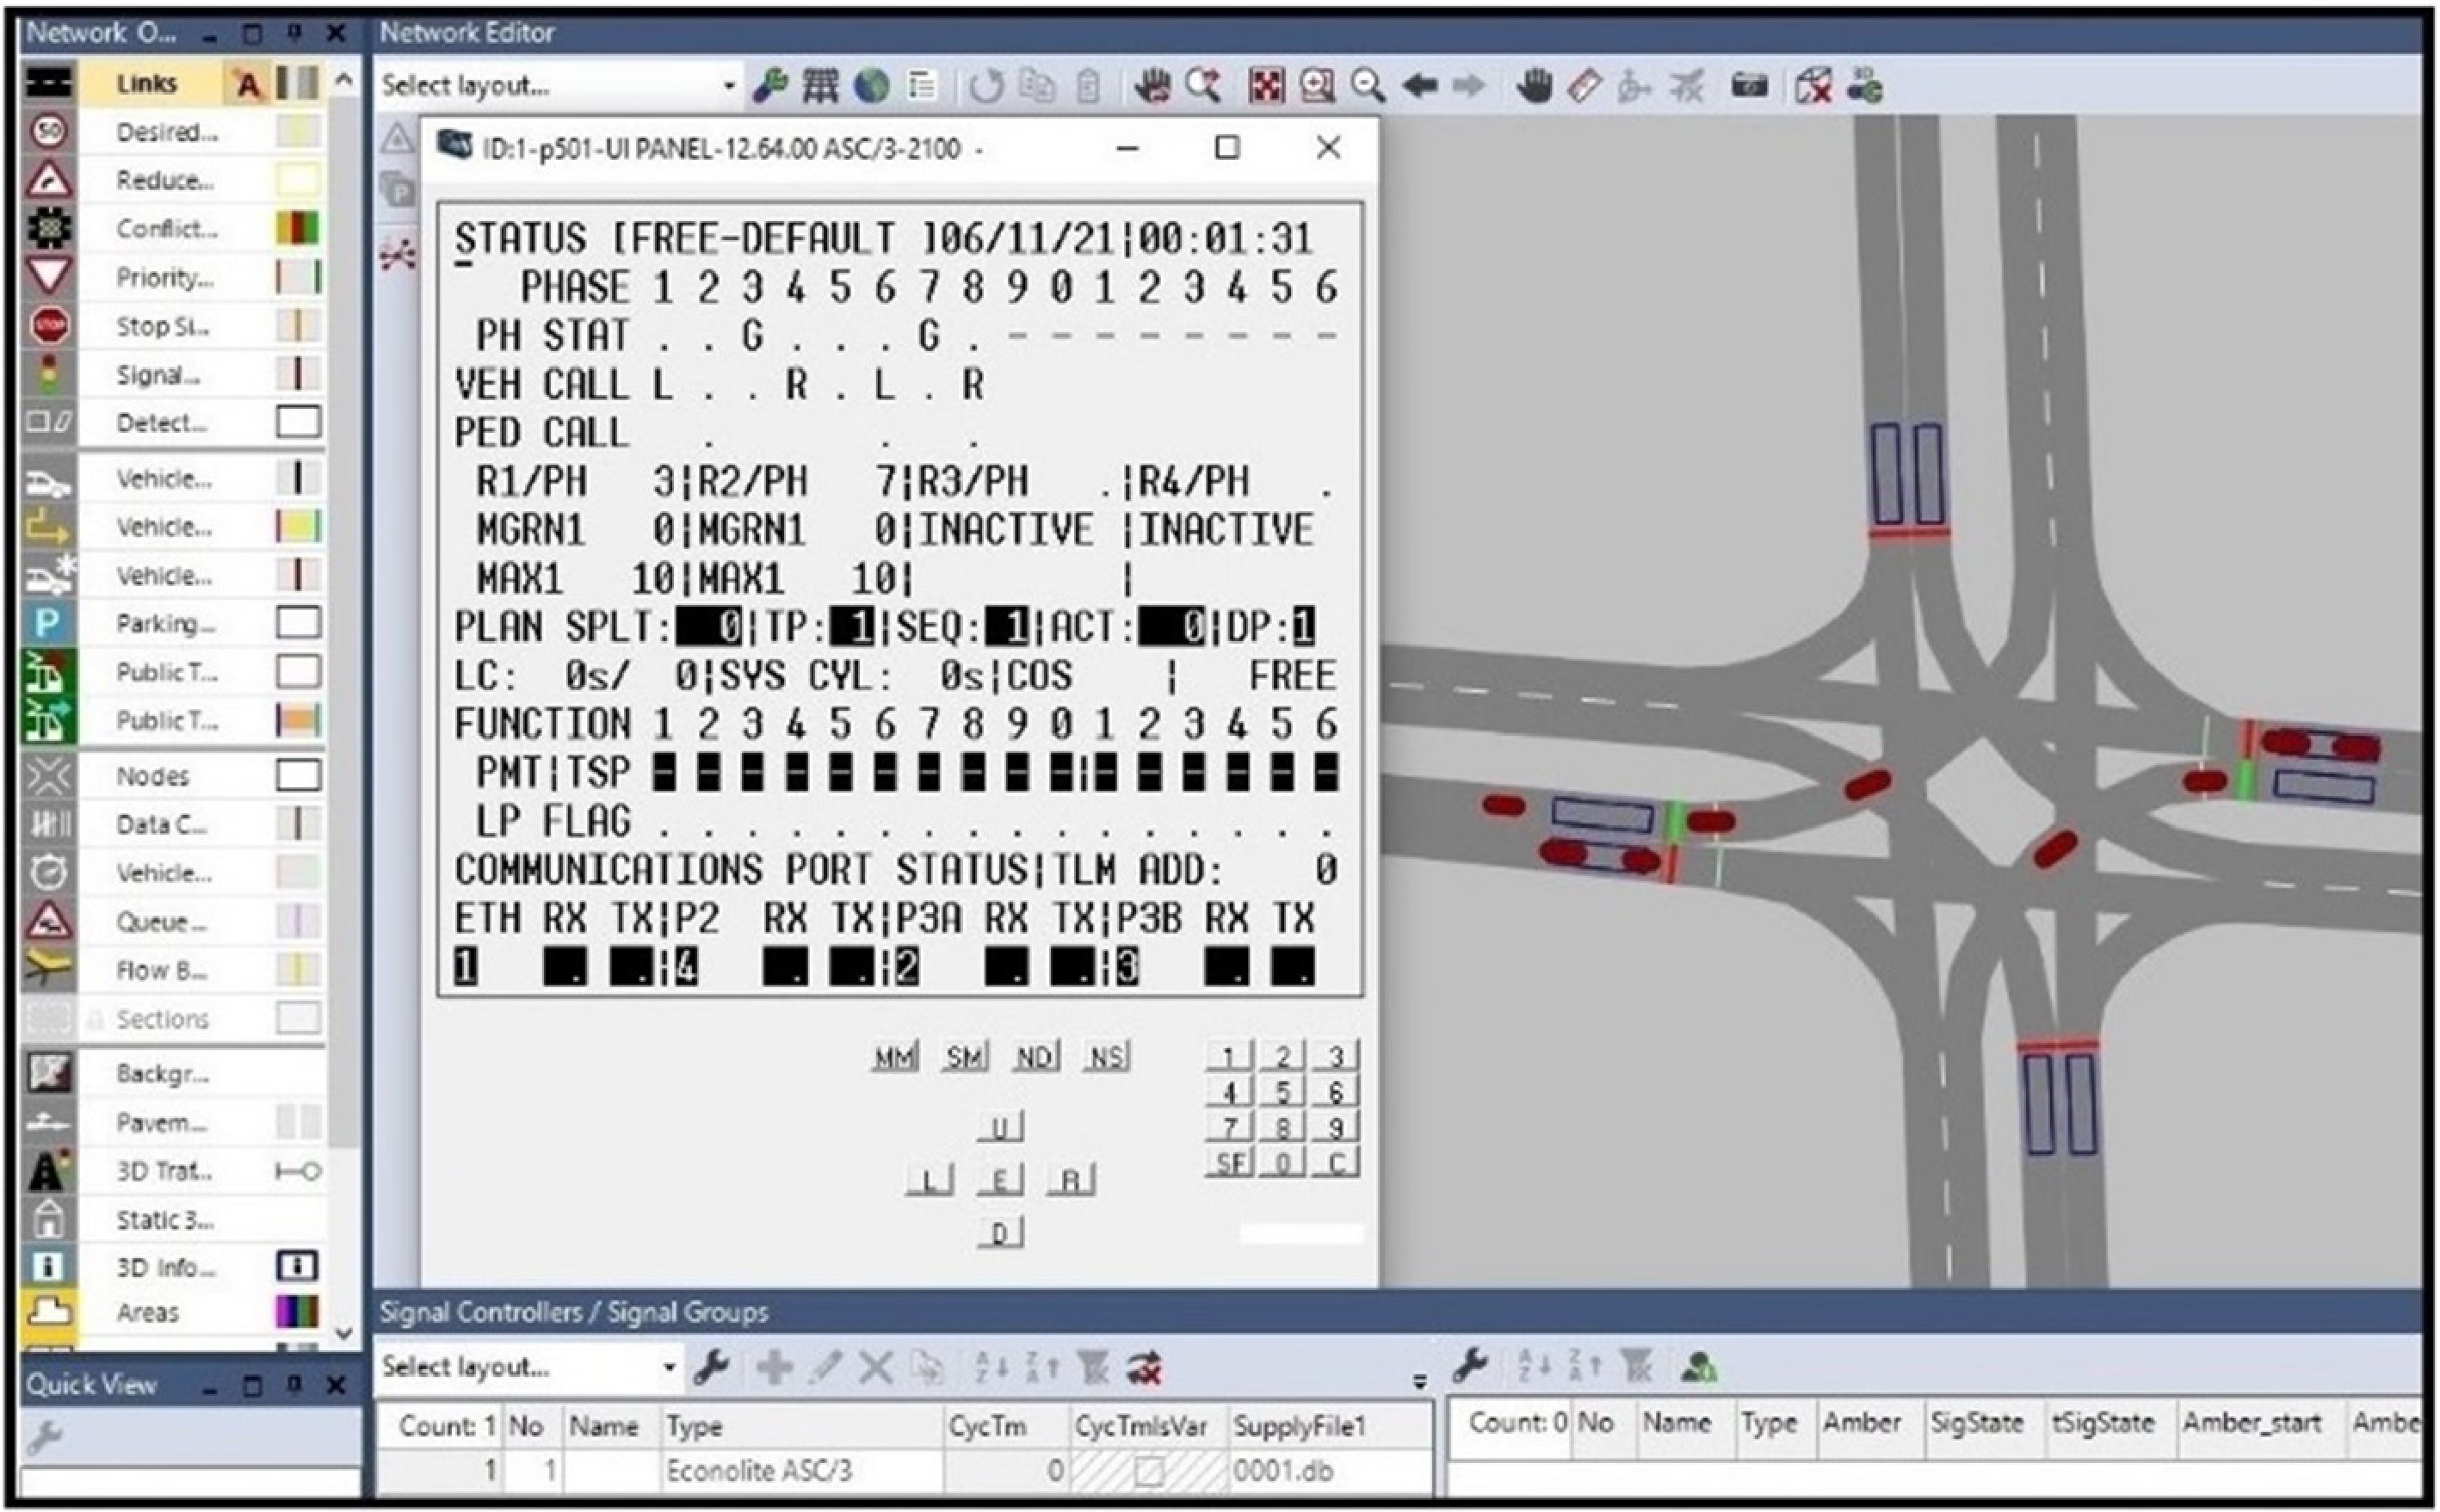
Figure 3.
Software-in-the-loop simulation.
-
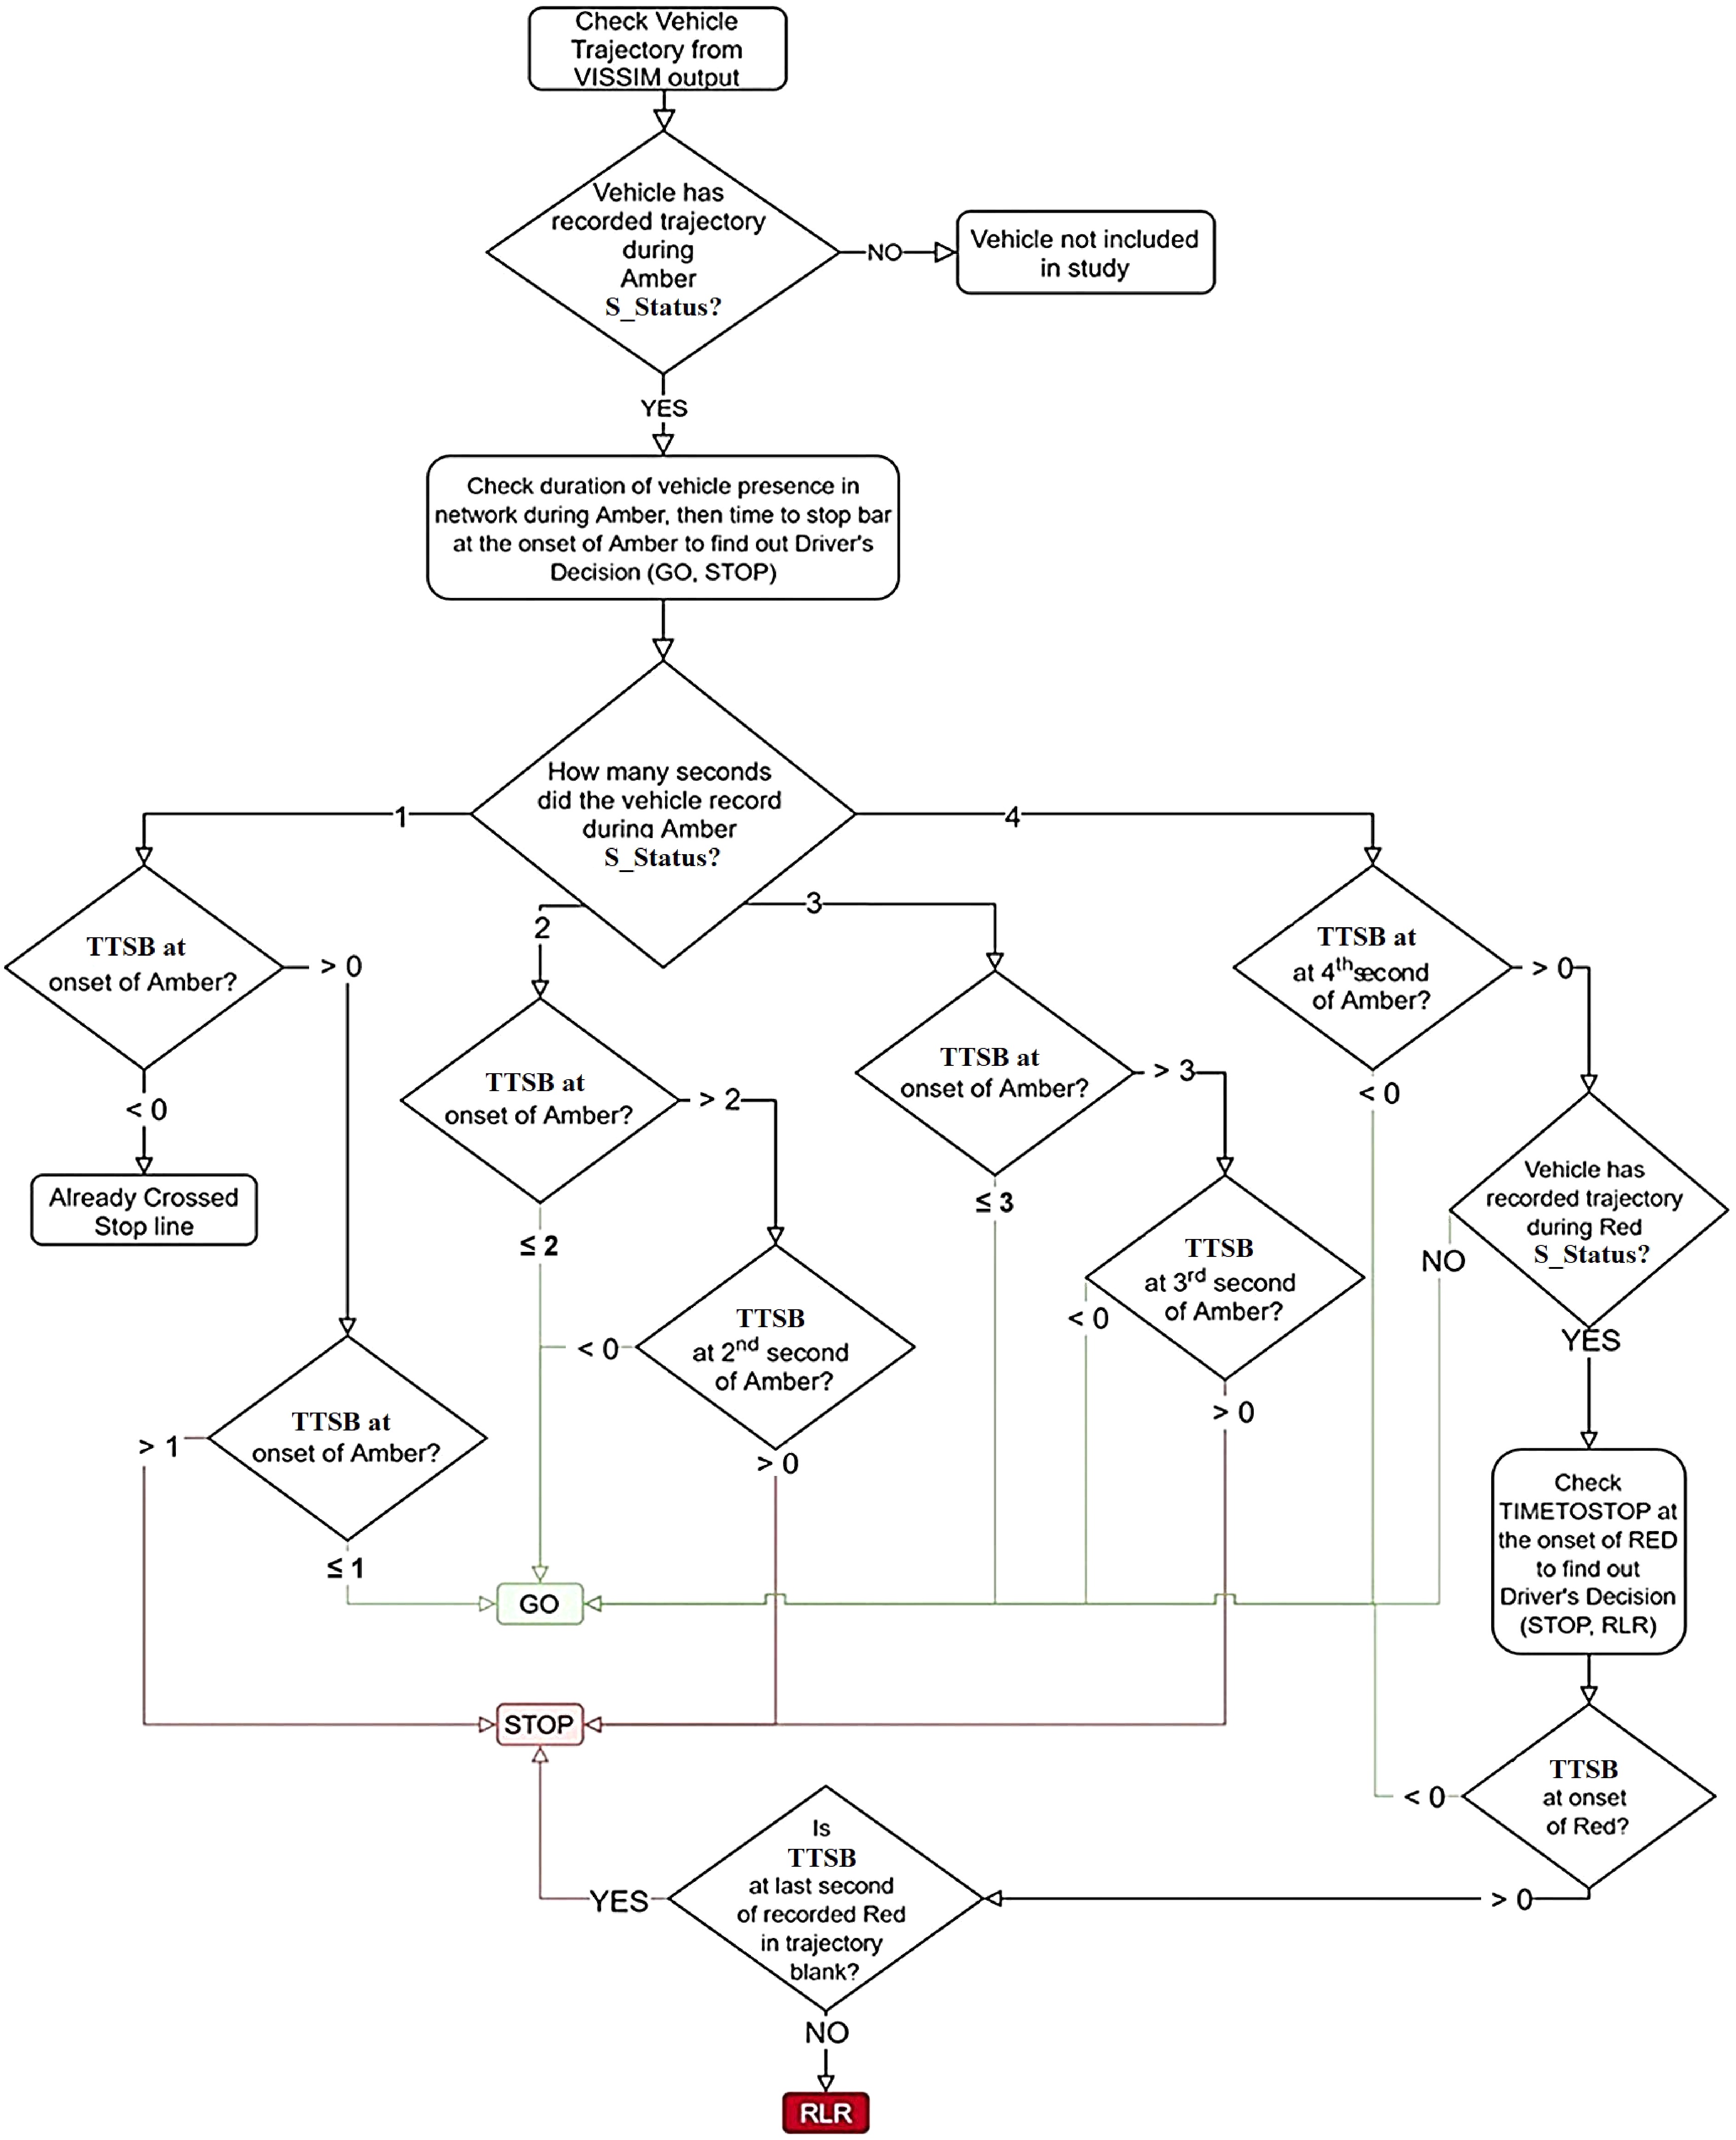
Figure 4.
Vehicle trajectories analysis.
-
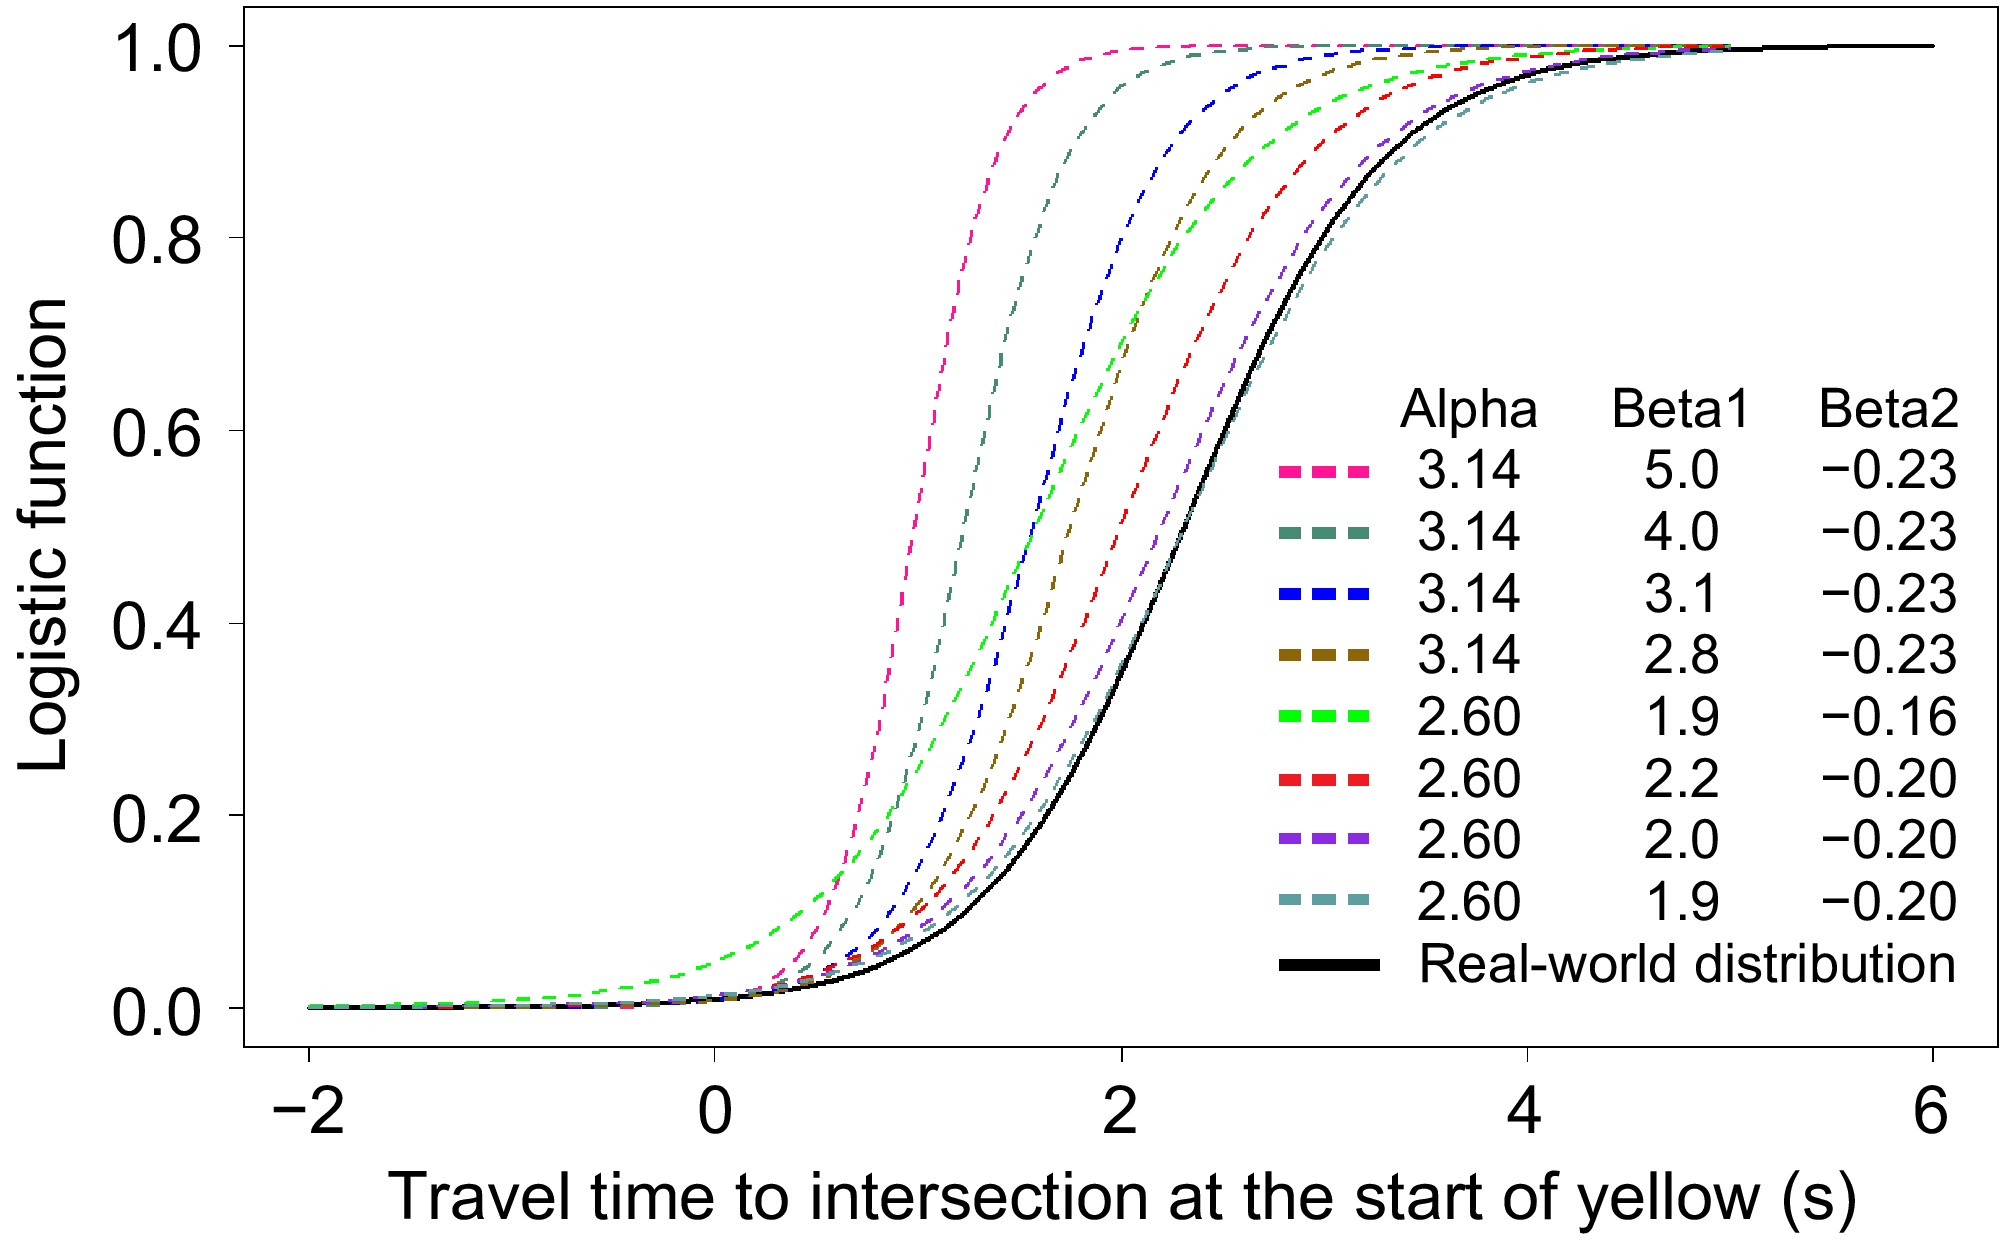
Figure 5.
Stop-go probability distribution of VISSIM vs Gates et al.[26].
-
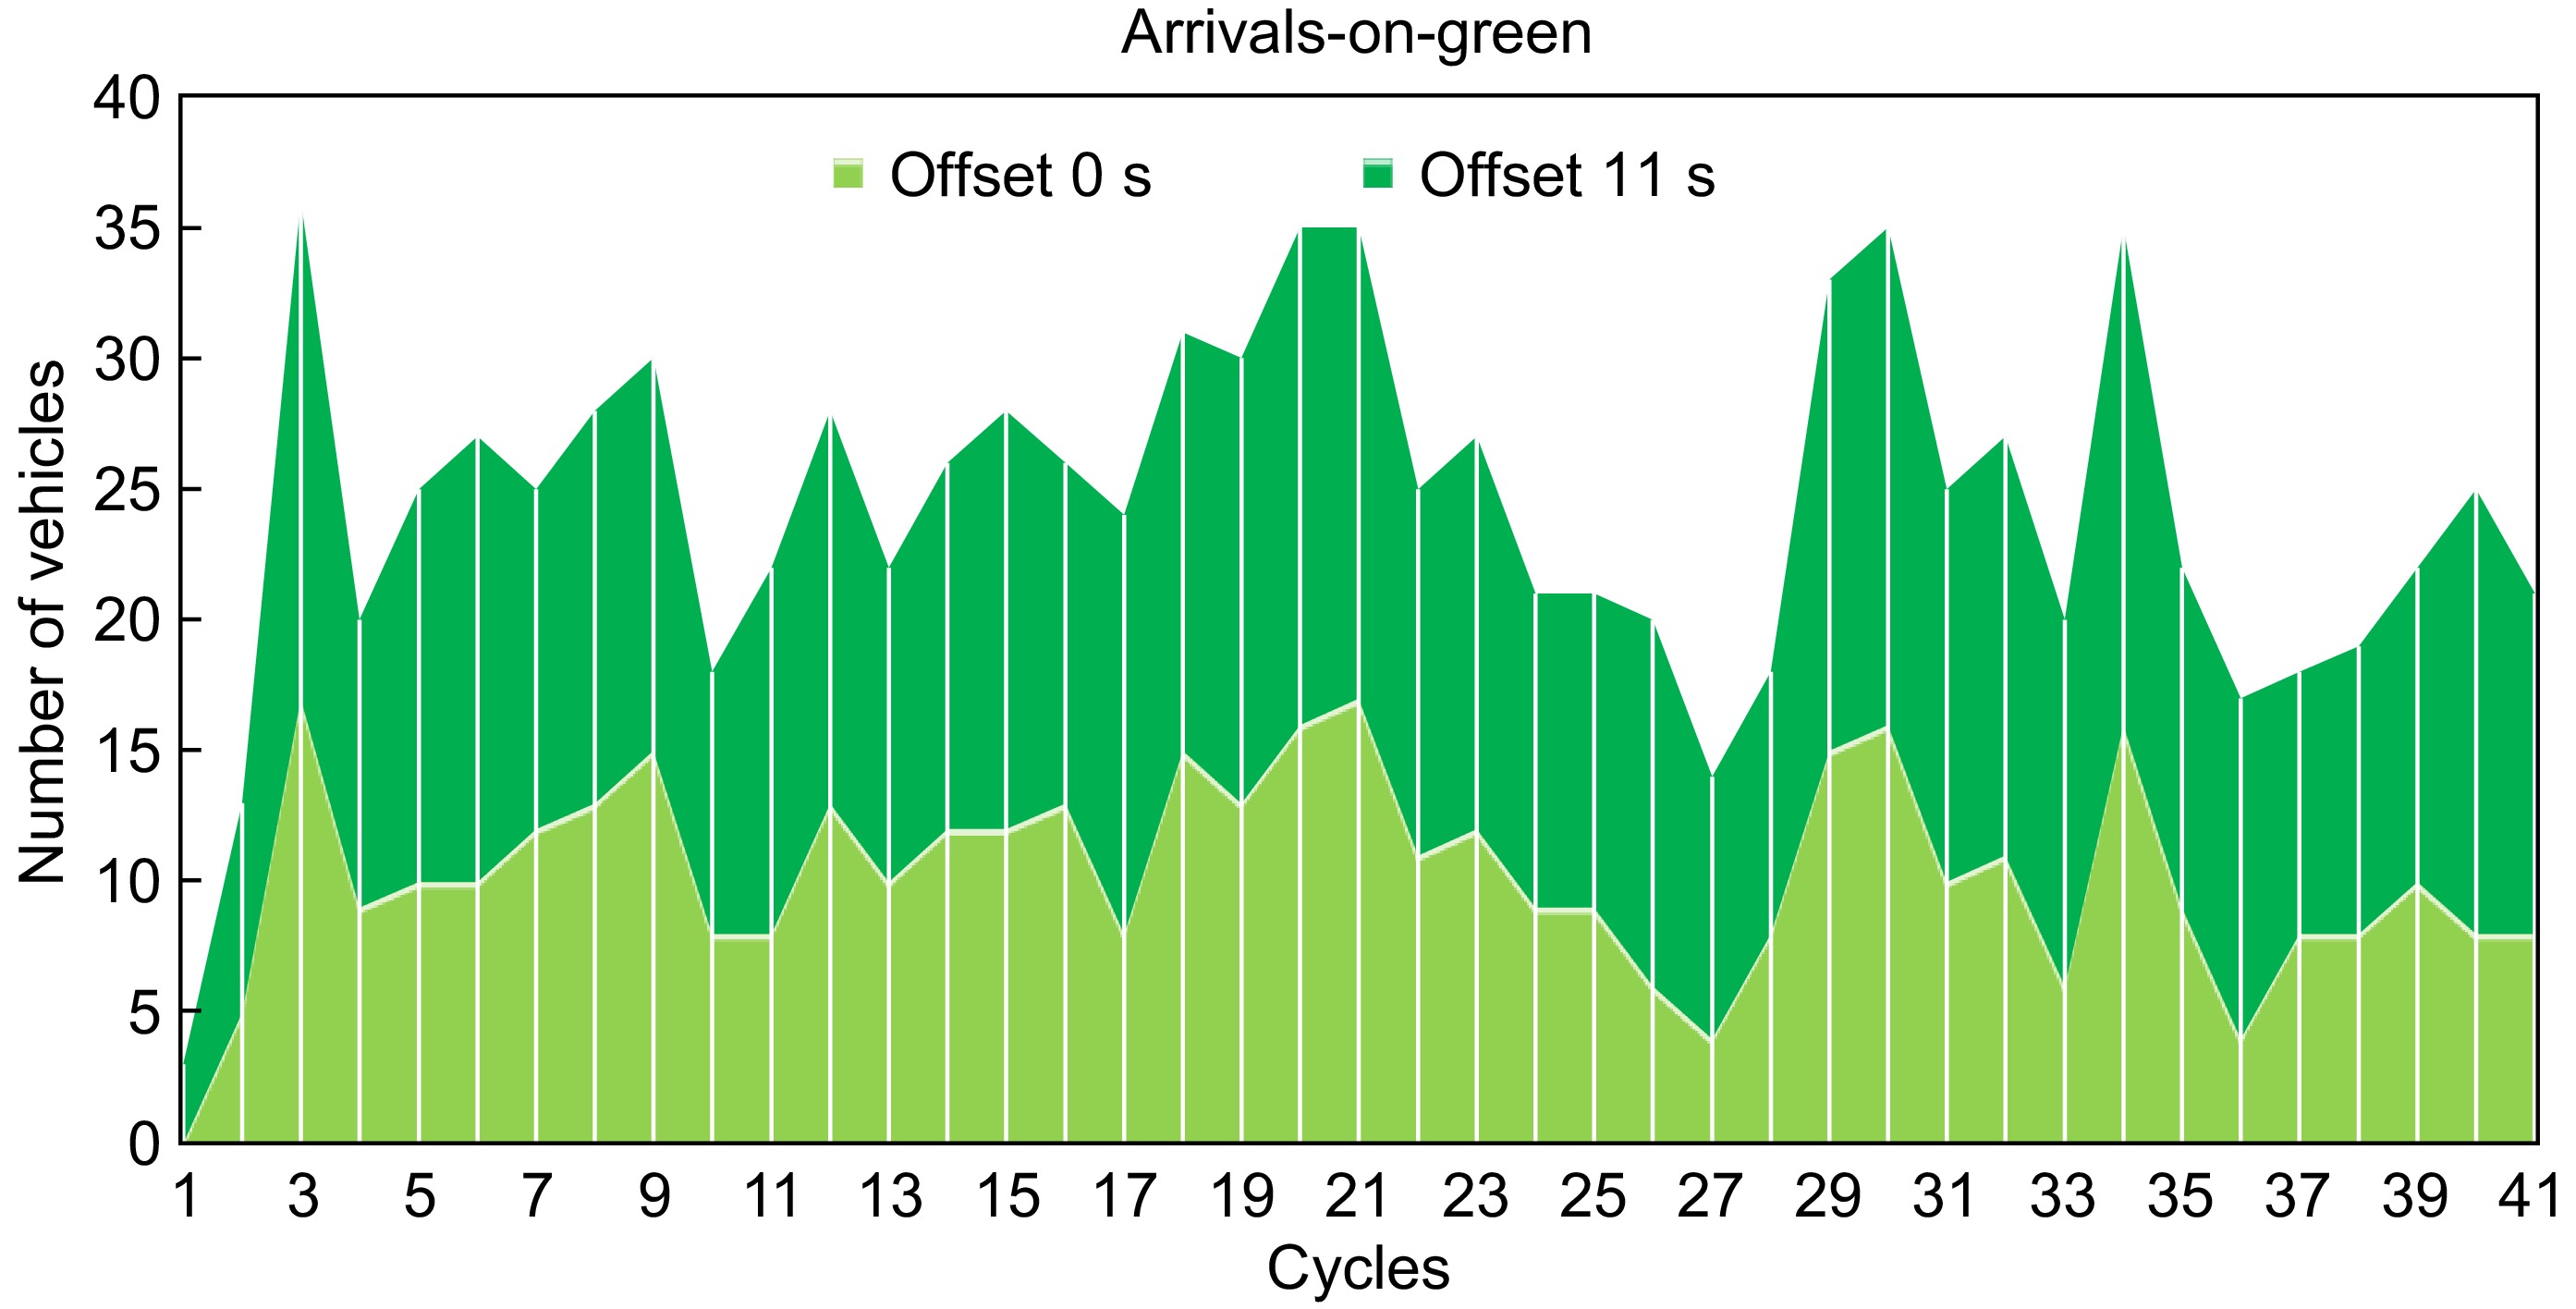
Figure 6.
Vehicle arrivals on green.
-
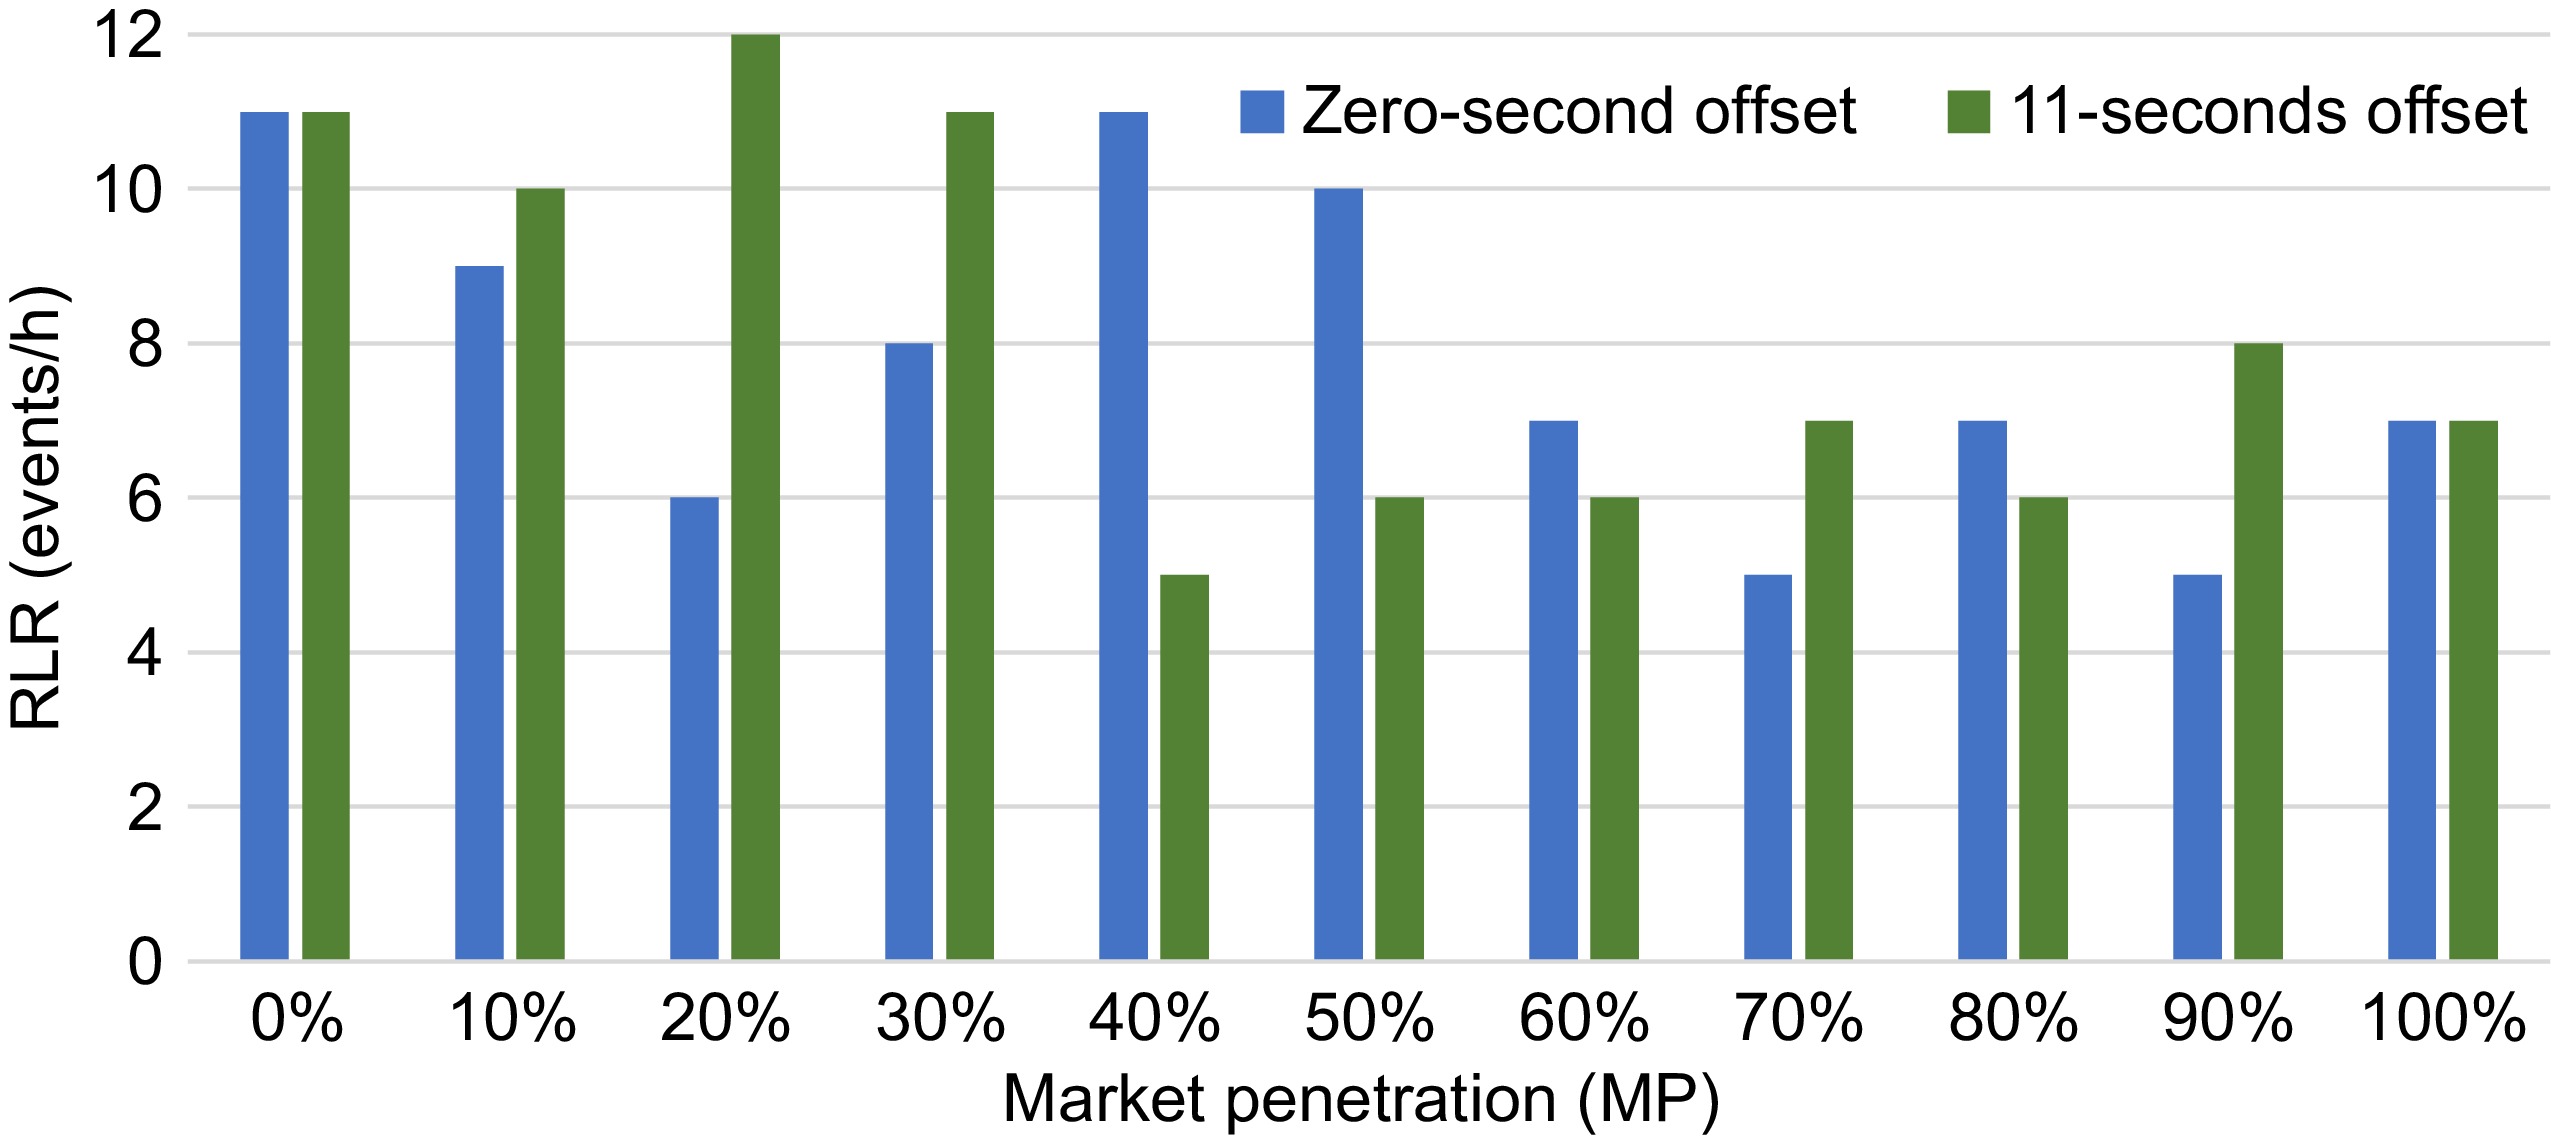
Figure 7.
Red-Light Running events without AGP.
-
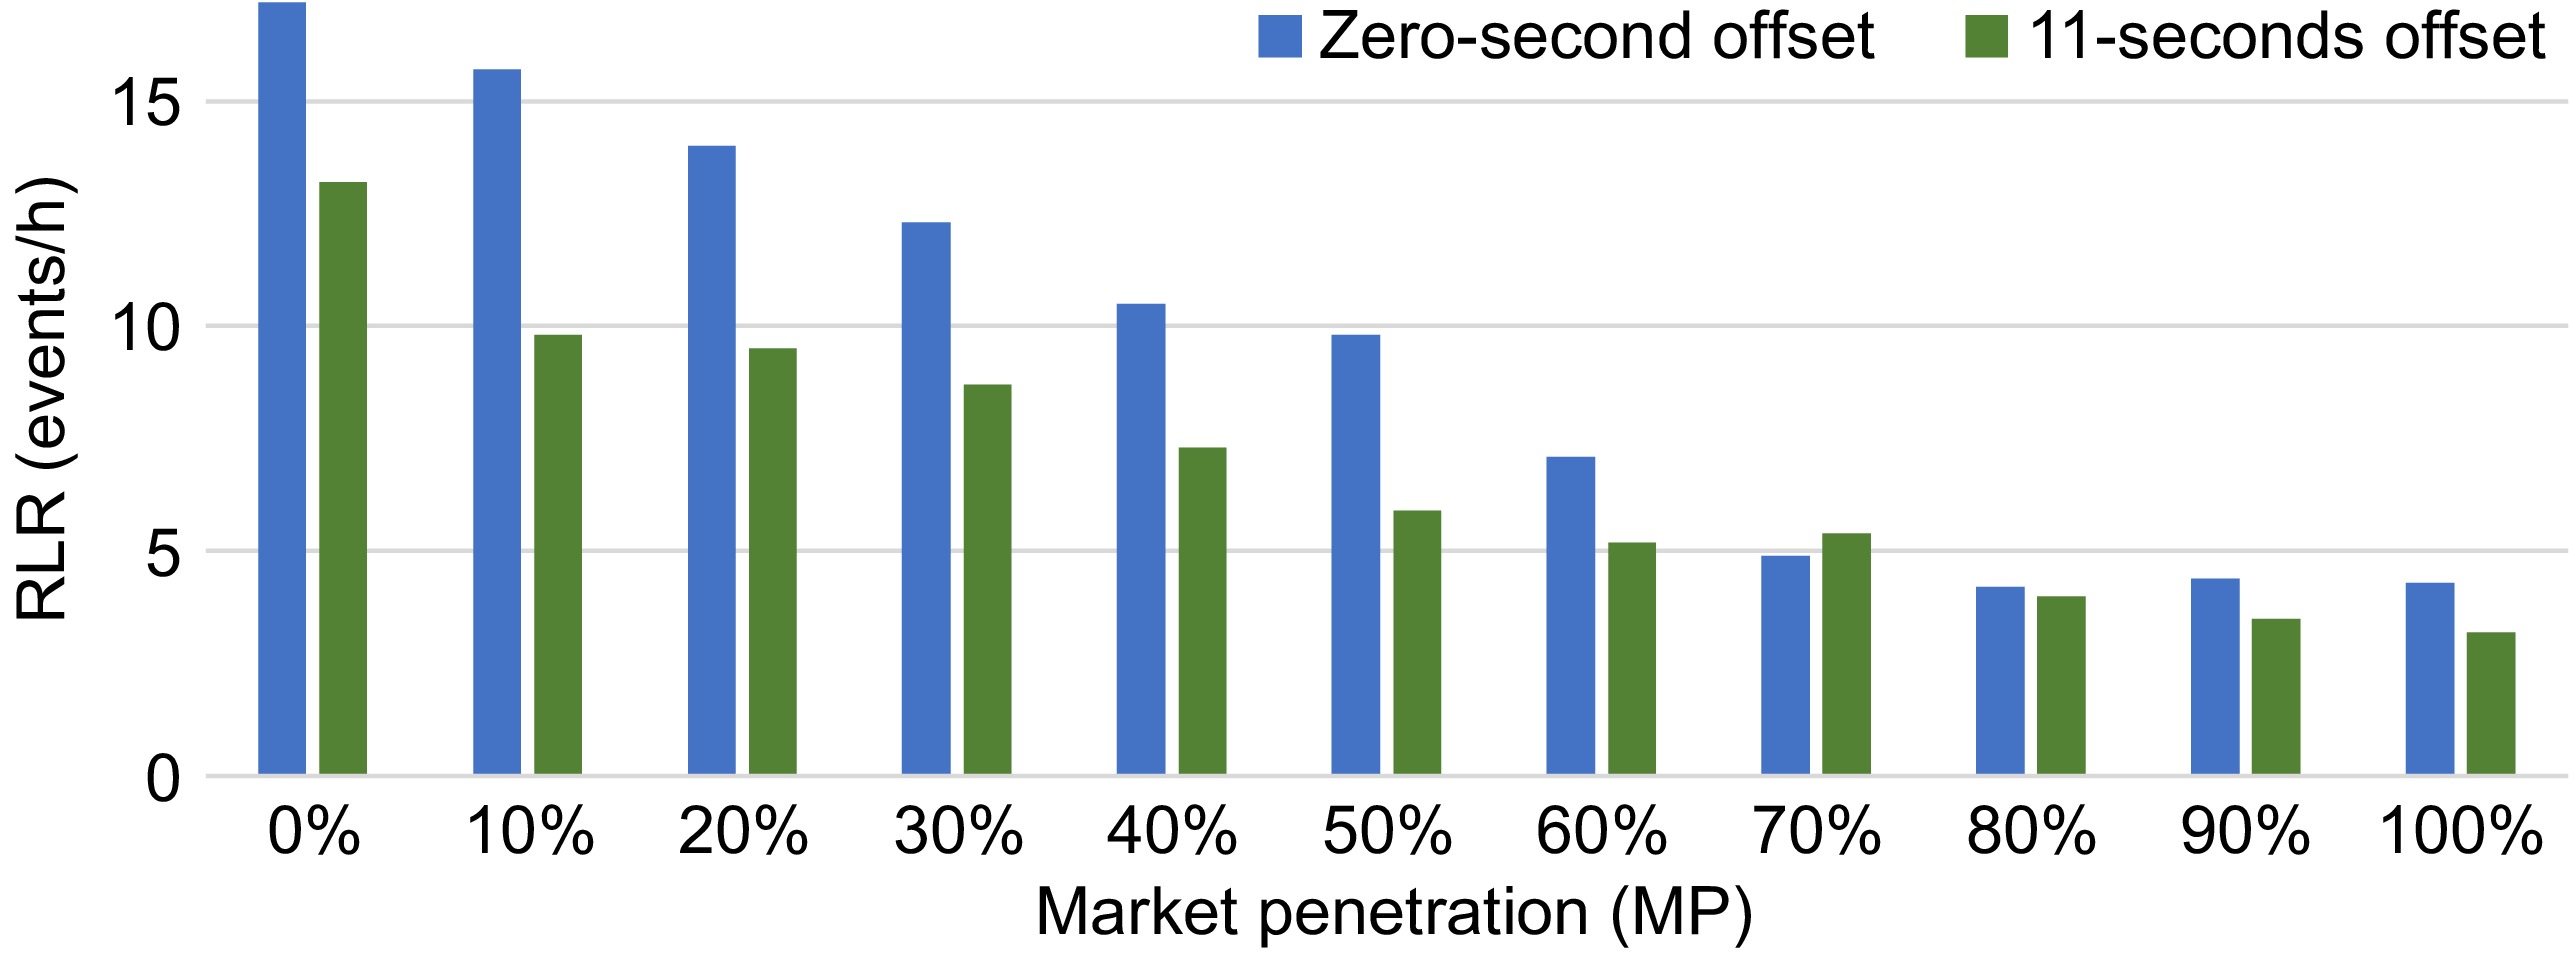
Figure 8.
Red-Light Running events with AGP.
-
CV MP Stopped delay (s/veh) Stops per vehicle (mean) Approach delay (s/veh) 0% 24.2 0.7 31.8 10% 24.7 0.8 33.0 20% 24.2 0.8 32.8 30% 24.8 0.8 33.7 40% 24.6 0.8 34.0 50% 25.4 0.8 35.0 60% 25.1 0.8 35.0 70% 25.5 0.8 36.0 80% 25.0 0.8 35.4 90% 25.7 0.8 36.4 100% 25.5 0.8 36.4 Table 1.
Simulation output with zero-second offset.
-
CV MP Stopped delay (s/veh) Stops per vehicle (mean) Approach delay (s/veh) 0% 23.0 0.7 30.6 10% 23.1 0.8 31.2 20% 23.5 0.8 32.0 30% 23.8 0.8 32.6 40% 23.8 0.8 33.0 50% 24.3 0.8 34.0 60% 24.4 0.8 34.2 70% 25.1 0.8 35.3 80% 25.1 0.8 35.8 90% 25.1 0.8 36.0 100% 25.1 0.7 36.1 Table 2.
Simulation output with 11-s offset.
-
CV MP Stopped delay (s/veh) Stops per vehicle (mean) Approach delay (s/veh) 0% 26.5 0.9 37.3 10% 26.6 0.9 37.5 20% 26.6 0.9 37.5 30% 27.0 0.9 38.1 40% 26.9 0.9 38.9 50% 27.1 0.9 37.9 60% 27.4 0.9 38.5 70% 27.0 0.9 38.1 80% 27.4 0.9 38.5 90% 27.6 0.9 39.1 100% 27.8 0.9 38.9 Table 3.
Simulation output with a zero-second offset.
-
CV MP Stopped delay (s/veh) Stops per vehicle (mean) Approach delay (s/veh) 0% 17.9 0.7 30.6 10% 17.9 0.7 32.2 20% 18.0 0.7 30.6 30% 18.1 0.7 32.6 40% 18.4 0.7 31.2 50% 18.4 0.7 32.3 60% 19.3 0.7 30.4 70% 19.3 0.7 32.6 80% 19.6 0.7 32.4 90% 19.7 0.7 30.6 100% 19.8 0.8 31.6 Table 4.
Simulation output with 11-s offset.
Figures
(8)
Tables
(4)