


-
Connected Vehicle (CV) applications were developed to provide significant safety and mobility improvements to transportation systems while minimizing environmental impacts. In recent years, these CV-based applications have moved beyond conceptual designs and into real-world deployments. A notable example is the Red-Light Violation Warning (RLVW) system, which utilizes Vehicle-to-Infrastructure (V2I) communication at traffic signals. The RLVW aims to address Red-Light Running (RLR) incidents and associated crashes by enhancing driver awareness as they approach intersections. A critical requirement for the effective operation of the RLVW system is acquiring the status of the traffic signal phase and duration which can be challenging under actuated operations.
Actuated traffic signals, which adjust the signal phases based on real-time traffic demand, present a challenge to RLVW applications due to the lack of certainty in the actuated green phase interval. To address this issue, the Institute of Transportation Engineers (ITE), in collaboration with the US Department of Transportation (USDOT) published the Connected Intersection (CI) implementation guide and identified the need for an Assured Green Period (AGP) to provide certainty regarding the end of the green phase[1]. The AGP is a specified portion of the green light duration for through traffic that, when combined with the yellow interval, ensures vehicles can accurately predict when the green phase will end. The factors that impact the AGP formulation include the 85th percentile speed and providing adequate stopping distance to approaching CVs. This combination of the AGP and the yellow interval helps reduce the likelihood of red-light violations by equipped vehicles[1].
Aside from the uncertainties associated with the actuated traffic signals on the functioning of the RLVW, traffic signal coordination can impact the percentage of arrivals on green and thus the red-light violation and the performance of RLVW. Traffic signal coordination is a method used to synchronize the signal timing of multiple signalized intersections to improve the traffic operations of one or more directional movements for highways with closely spaced intersections[2]. A recent case study by Arafat et al. has quantified the benefits of RLVW under semi-actuated signal controller operations at an isolated intersection using a hardware-in-the-loop simulation[3]. It was evident from the results that although the technology provided noteworthy safety improvements, the implementation of AGP could have adverse impacts on the delay, especially at isolated signalized intersections. There is a gap in the literature in evaluating the RLVW under coordinated-actuated traffic signal operations. The main goal of this paper is to evaluate the performance of the RLVW under coordinated-actuated operations and to assess the AGP method to mitigate the uncertainty mentioned above.
Microscopic simulation is an effective tool for testing and evaluating emerging vehicle technologies[4]. In this study, the simulation platform interfaces with Econolite ASC/3 signal controller software through a Software-in-the-Loop Simulation (SILS) setup. The study analyzes the mobility benefits of RLVW using mobility performance measures generated by the simulation model. At the same time, the vehicle trajectories are assessed to evaluate the safety impacts of the CV technology using the Surrogate Safety Assessment Model (SSAM)[5−7].
-
The majority of RLR violations occur due to the presence of dilemma zones at signalized intersections where drivers encounter a sudden signal change from green to yellow and are required to decide whether to stop or go through the intersection. Based on how fast motorists are traveling and their location upstream of the traffic signal, sometimes this decision becomes challenging and leads to an RLR violation or a hard stop at the intersection. Elmitiny et al. used a video-based system to analyze drivers' behavior related to stop-go decisions and RLR violations at the onset of yellow at a high-speed signalized intersection. The researchers collected traffic parameters and applied classification tree models to further analyze this drivers' behavior. The study results showed that variables such as vehicle location and speed were the most significant predictors for both the stop-go probability decision and RLR violation. In addition, the study concluded that the tree models were helpful in analyzing the drivers' stop-go probability and RLR with respect to various traffic conditions[8].
Several potential methods have been proposed in the literature that significantly reduce the number of RLR events, such as yellow timing adjustments and automated enforcement. For instance, Retting et al. conducted a before and after study to evaluate the impacts of the yellow change intervals and automated red-light enforcement on the RLR violations at two traffic signals[9]. It was evident from the results that adjusting the yellow change intervals reduced the number of RLR violations by 36% while enforcing the red-light cameras achieved 96% beyond the levels achieved by the longer yellow timing.
Awadallah proposed a theoretical approach for reducing RLR crashes by assisting drivers in deciding where to stop at the onset of the yellow interval, and when to proceed to cross the intersection[10]. The proposed approach involves delineating a yellow transverse line at the calculated decision line as well as enforcing a traffic regulation that forces drivers to stop if such a line is not crossed at the onset of the yellow signal indication. In addition, the study proposed a traffic ordinance to 'yield before go' to vehicles within the intersection at the onset of green. Although the study provided theoretical evidence for reducing RLR crashes, the statistical evaluation of the results is limited because such traffic ordinances have not been implemented in the real world yet.
Martinez & Porter investigated the benefits of RLR cameras and photo enforcement program implementation in reducing RLR events in Southeast Virginia[11]. The researchers collected data from 1,750 light cycles and found that red light running occurred at least once during 13% of these cycles. The results showed that variables such as RLR photo enforcement, drivers' age, traffic volumes, and driving without seat belts were highly correlated with RLR events, while the photo enforcement program effectively reduced the RLR significantly.
Most previous research efforts have mainly focused on driver-based or vehicle-based safety countermeasures to reduce RLR crashes. Some studies have also examined the relationship between traffic signal control and the frequency of RLR events. Li et al. identified a strong correlation between RLR frequency and the number of vehicles arriving during the signal yellow interval[12]. The study proposed a quantitative model for this correlation based on high-resolution traffic controllers and signal event data. In addition, the study implemented a Non-dominated Sorting Genetic Algorithm-II (NSGA-II) to estimate the trade-offs between traffic delays and reducing the RLR frequency. The results show that reducing the frequency of RLR without compromising traffic efficiency is possible. Similarly, Chen et al. identified the most influential factors that impact the frequency of RLR using high-resolution traffic controller data and signal event data[13]. The study results showed that RLR events were most likely to occur on weekdays during peak hours, high traffic volume, and longer signal cycles.
Red-Light Violation Warning application
-
The Red-Light Violation Warning (RLVW) is a Connected Vehicle safety application designed to decrease the occurrence of Red-Light Running (RLR) incidents and enhance safety at signalized intersections[14]. The application is particularly effective in reducing uncertainty in driver behavior, especially in the dilemma zone, by increasing driver awareness of the signal status at the intersection. This heightened awareness helps drivers make better decisions, ultimately reducing the likelihood of RLR. A critical component for the success of the RLVW system is the roadside equipment (RSE), which transmits Signal Phase and Timing (SPaT) data from the traffic signal controller to vehicles equipped with CV technology. The RLVW system on the Onboard Unit (OBU) uses this SPaT information, along with the vehicle's speed and distance to the intersection stop line to provide timely warnings. These warnings enable drivers to adjust their behavior to avoid a red-light violation.
Previous studies utilized a microscopic simulation environment to study the positive aspects of the RLVW technology[3]. The researchers used the platform named 'hardware-in-the-loop simulation (HILS)' which allows the software to be interfaced with a signal controller for a realistic assessment of the RLVW. The output vehicle trajectory files from the simulation were integrated with the SSAM to measure the safety performance. The results of this effort showed that 92% of the RLR events were eliminated by the application of the RLVW accompanied by the AGP. However, applying the AGP can increase the number of stops and approach delays. It should be noted that these results were collected at an isolated intersection.
Zhang et al. carried out a driving simulation study to examine the effectiveness of the RLVW system and understand drivers' decision-making processes at intersection dilemma zones under different weather conditions[15]. It was evident from the results that excluding the RLVW, drivers tend to use harder brakes and drive at lower speeds. However, after introducing the RLVW, drivers were able to respond faster and apply smoother brake reactions. In addition, the application showed a reduction of the RLR events under clear and foggy weather conditions. The study highlighted some of the essential design features of the RLVW system and showed significant benefits of RLVW, especially during adverse weather conditions. In an on-site evaluation experiment carried out by Park et al., the effectiveness of the RLVW system was evaluated by focusing on the vehicle's speed and location upstream of the traffic signal[16]. The data highlighted a noticeable reduction in RLR and a potential safety improvement.
As illustrated earlier, most existing RLVW systems assume high confidence in the signal phase and timing which can be vulnerable under actuated operations. In an attempt to provide reliable warnings to motorists, Dokur and Katkoori designed prediction algorithms that have the capability of detecting the current phase status at traffic signals and the likelihood of an RLR utilizing Dedicated Short-Range Communication (DSRC) Basic Safety Messages (BSMs)[17]. A second algorithm was implemented for providing the RLVW based on variables such as the stopping distance to the intersection, the time taken by the CV to reach the intersection, the vehicle's speed, and the remaining green time. In addition, CARLA simulator was used to validate the study results. The outcomes demonstrated that the current signal status was successfully predicted and the RLVW system was highly effective using BSMs. Although this work included high-quality prediction algorithms, it did not account for the driver behavior such as the probability of stopping on yellow, which plays a critical role in influencing RLR incidents.
Software-in-the-loop simulation
-
SILS involves integrating traffic simulation software with the software of an actual signal controller. SILS platforms enable the use of advanced signal timing and controller parameters, which are typically not supported by built-in Emulator-in-the-Loop (EILS) controllers. For example, VISSIM in collaboration with Econolite incorporated ASC/3 controller within the simulation software. These virtual controllers include several logic commands and use the same code as the ASC/3 hardware controllers, ensuring that their performance closely mirrors the field version. The tool is accompanied by a Data Manager that serves as a graphical interface for inputting signal timing plans and detector data. The systems also can process all internal data inputs and ensure that the signal control operations in the simulation remain consistent with those in an actual field. SILS has a user-friendly interface that mimics the physical display and keypad of the actual hardware controller[18,19].
Zlatkovic et al., explored the use of SILS for simulating transit signal priority (TSP) strategies[20]. Their comparison of simulation results with real-world conditions demonstrated the capability of SILS as a powerful tool for analyzing various TSP aspects. Previous efforts employed the SILS platform to simulate actuated traffic signal operations and controller parameters[21,22]. Their findings indicated that SILS could replicate the controller logic closely, reflecting real-world traffic signal operations.
-
The simulation is conducted using VISSIM Version 20 which is the most recent available version of the software at the time of writing this paper[23]. As depicted in Fig. 1, traffic demands were selected to resemble average traffic volumes for a base case scenario using v/c ratios calculated using the methodology outlined in the Traffic Signal Timing Manual below[24].
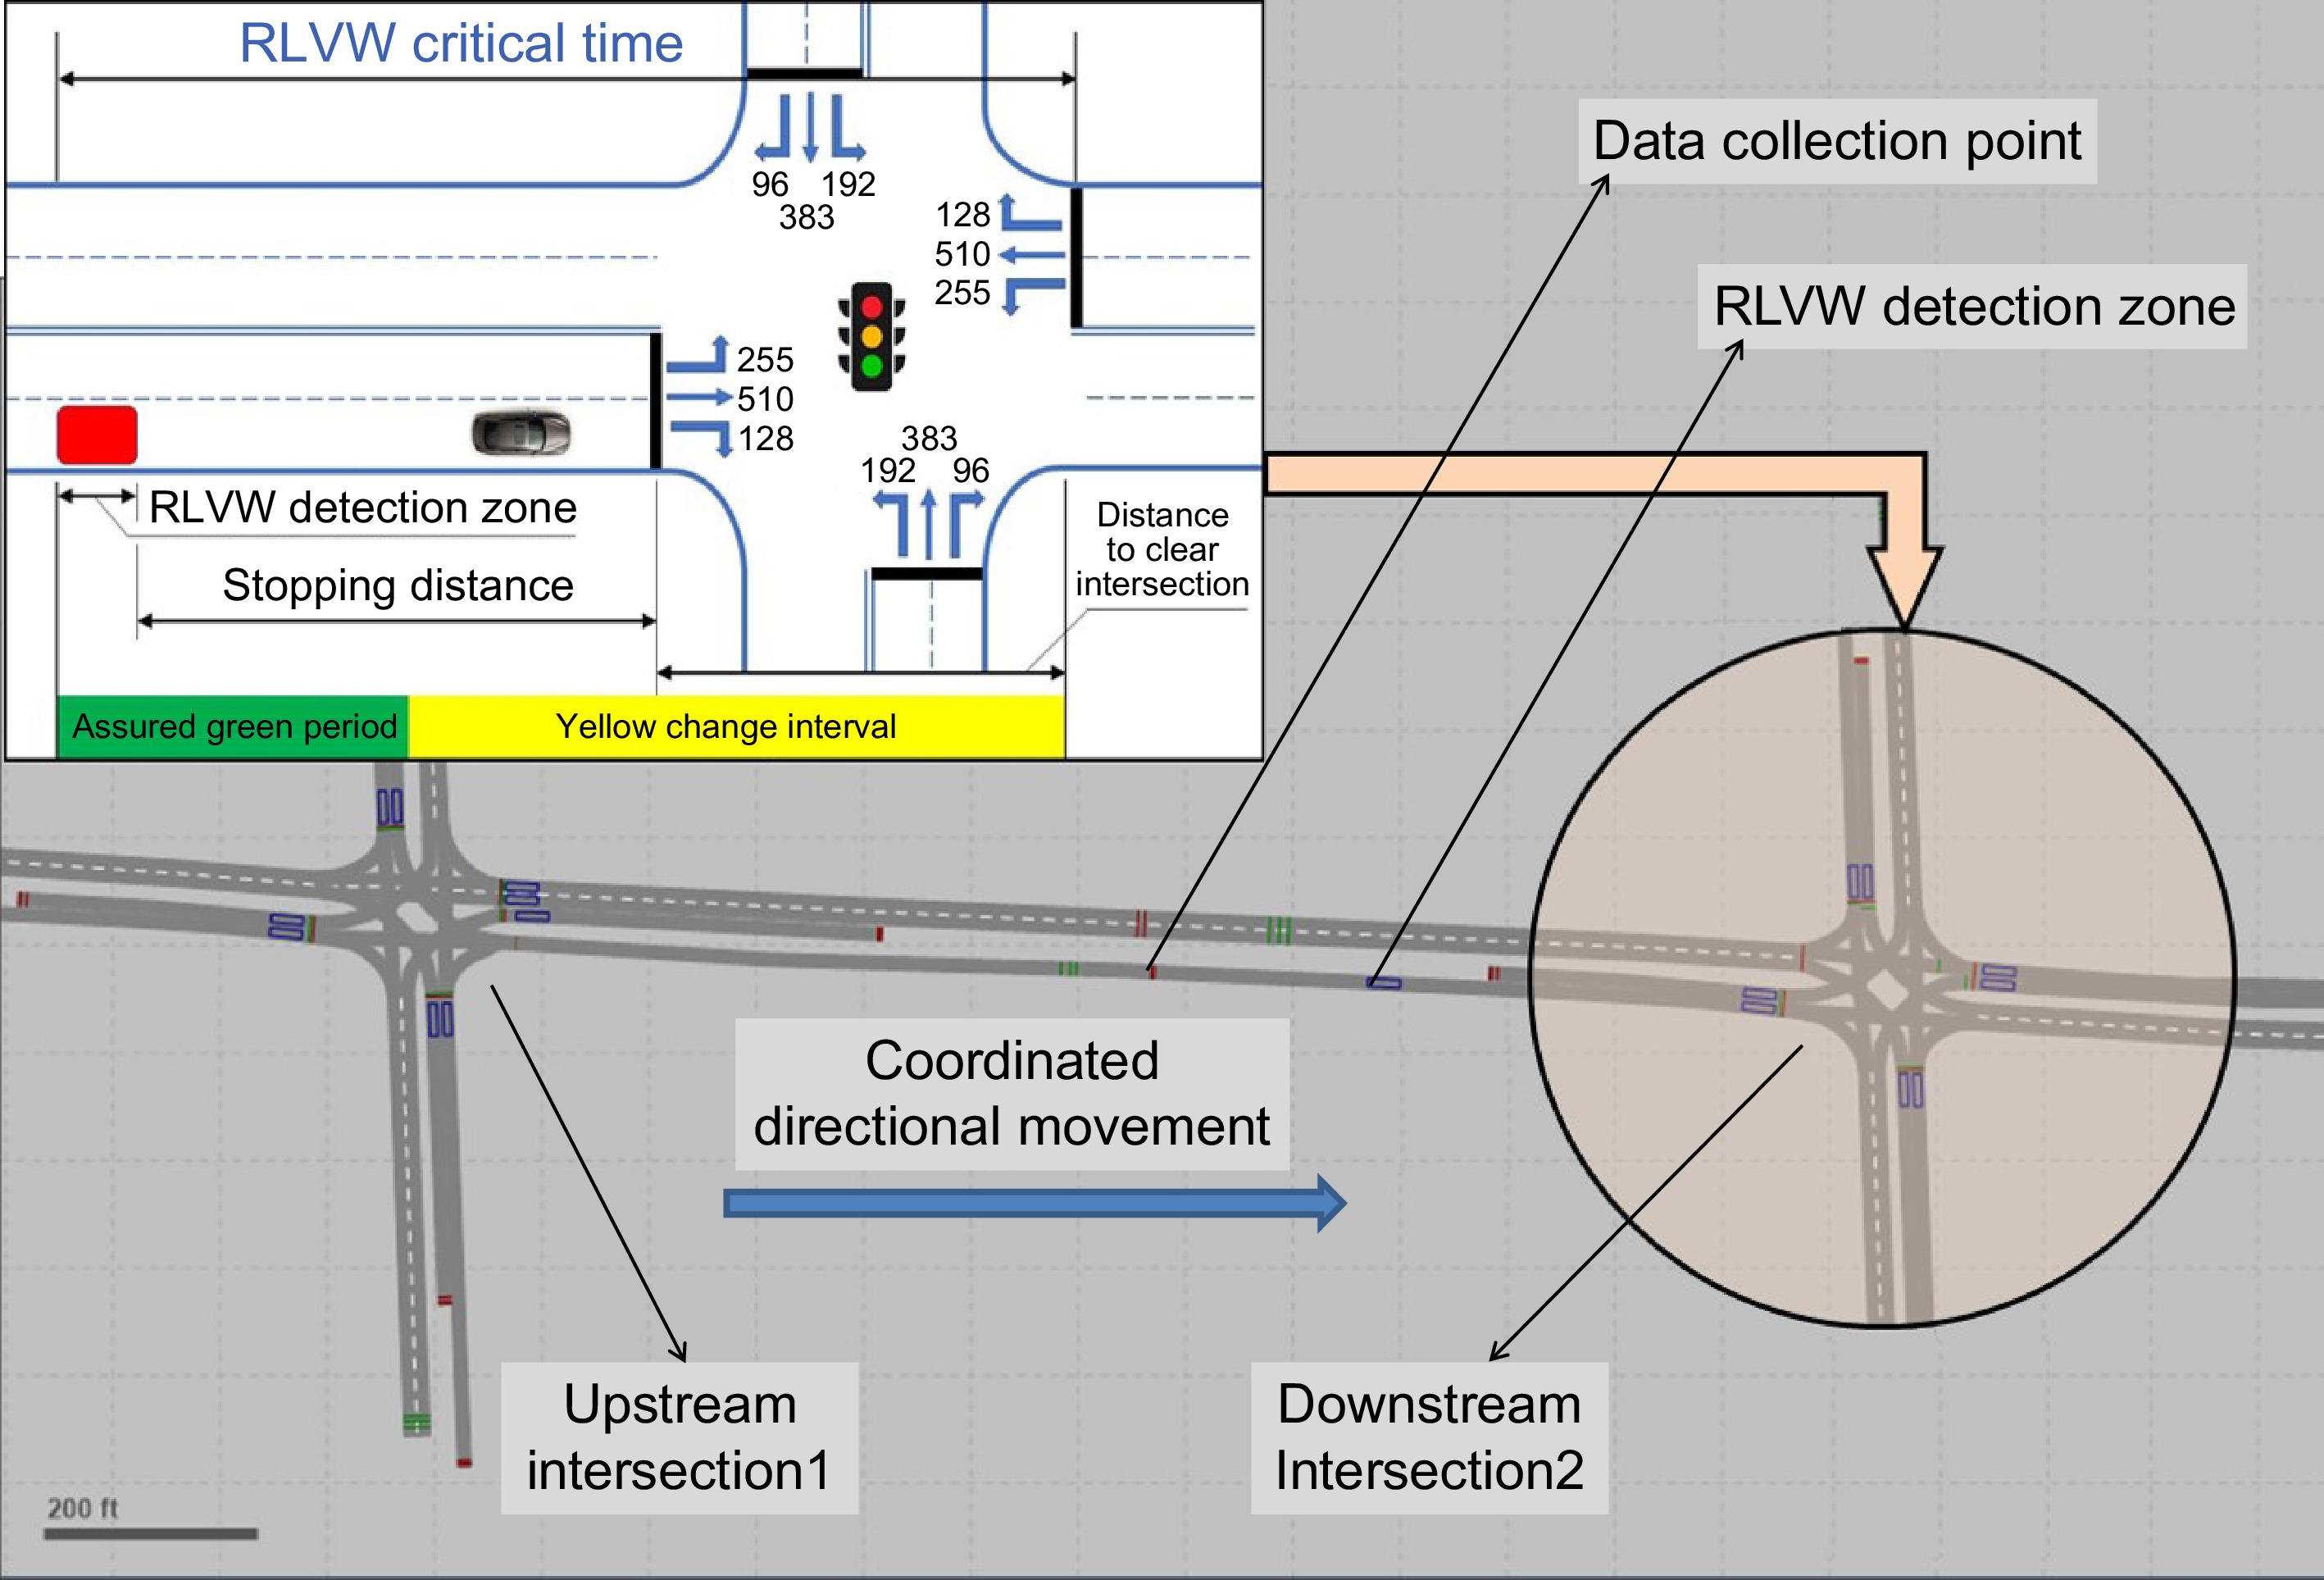
Figure 1.
Case study coordinated signalized intersections.
$ {\mathrm{Degree}}\; {\mathrm{of}}\; {\mathrm{saturation}}\; (x) = \dfrac{vC}{sg} $ (1) where, v = traffic volume of a given movement, S = saturation flow rate (veh/h), C = length of the signal cycle (s), and g = effective green duration (s)
Case study network
-
Two traffic signals were simulated in VISSIM, as illustrated in Fig. 1. The Assured Green Period (AGP) was incorporated into the simulation to address the lack of certainty in the green interval duration. As previously explained, the AGP is a designated portion of the green phase allocated for through traffic. When combined with the yellow phase duration, it provides a certain timestamp for the end of the green interval. Key parameters required to estimate the AGP include stopping distance, approach speed, and the clearance time for the intersection area. The 85th percentile speed was used for the purpose of this calculation since the majority of drivers fall within this speed[1].
The RLVW detection zone is defined as an area in the through lane where a vehicle is detected by roadside equipment through Vehicle-to-Infrastructure (V2I) communication to support the RLVW application. The location of the detection zone is set so that the distance from the stop line to the detection zone equals the full stopping distance. The signal controller shall set the minimum end time of the phase to the current time plus the AGP if a vehicle is identified in the RLVW detection zone and the related movement is in green without the movement being terminated yet. The controller gives an Assured Green End Time (AGET) that is equal to or greater than the phase's minimum end time if the Connected Intersection (CI) determines that a green phase is about to conclude. The AGET ensures that the RLVW application on the onboard equipment receives accurate Signal Phase and Timing (SPaT) messages, giving upstream vehicles sufficient stopping time.
As defined in the CI Implementation Guide Ballot[1], several parameters are required for the traffic signal controller RLVW design. Figure 2 shows the distance and time elements required for the calculation of the AGP to support the RLVW application.
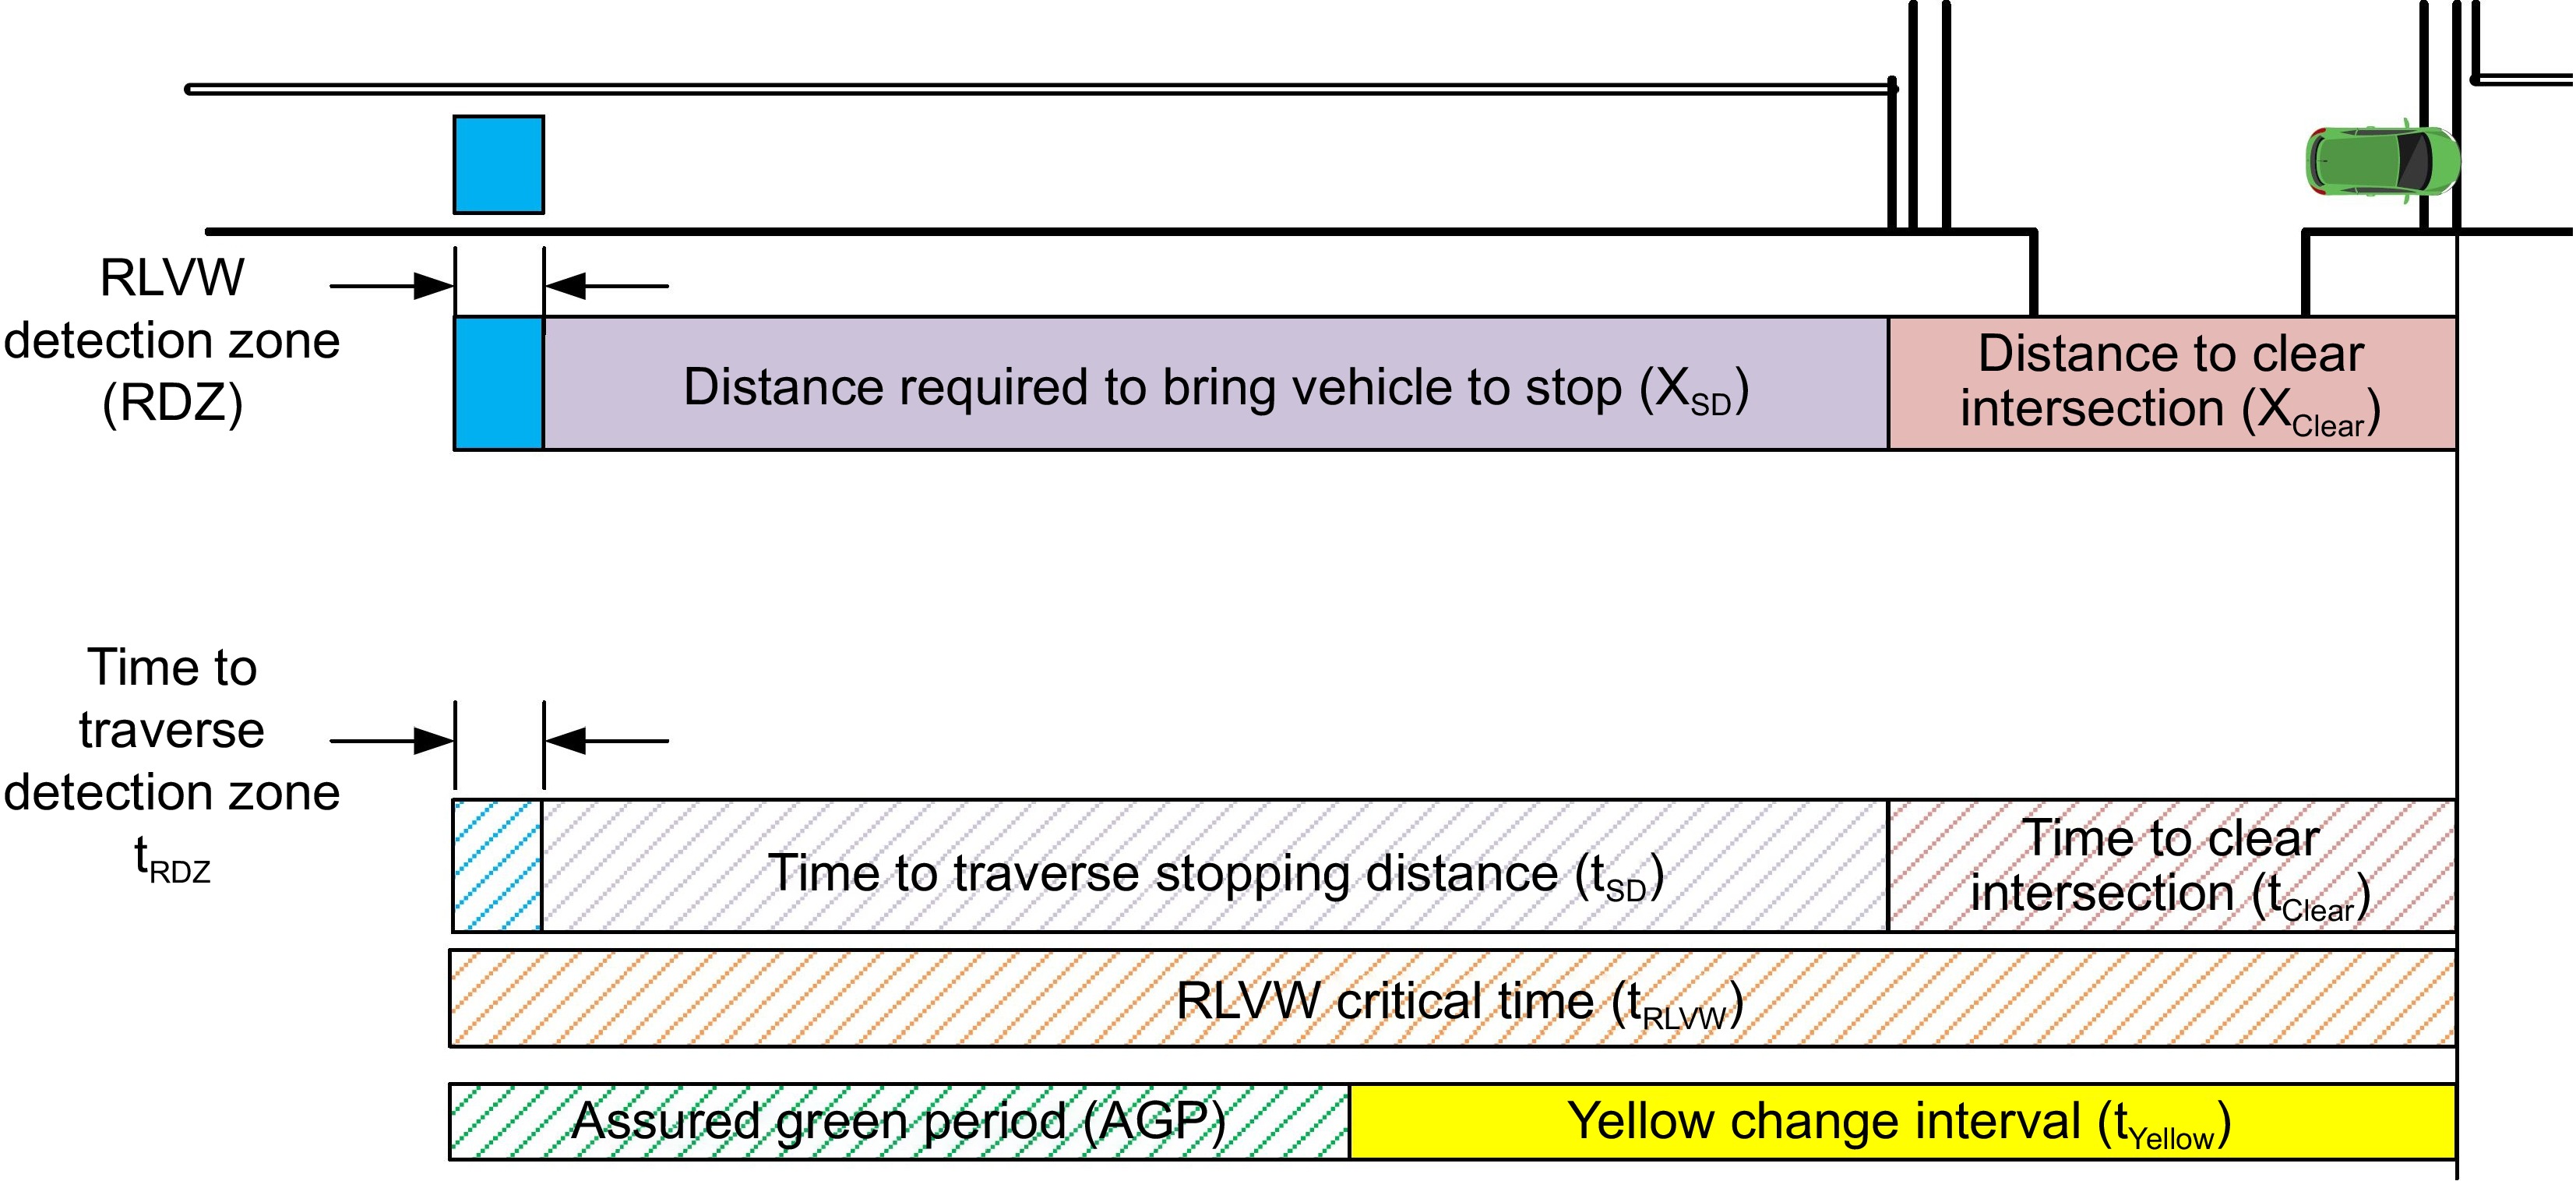
Figure 2.
AGP concept for the RLVW design[1].
As illustrated in Fig. 2, the distance to clear the intersection (xclear) is measured from the eastbound stop bar (i.e., ingress) to the end of the marked crosswalk (i.e., EB egress) and the time to clear the intersection (tclear) is calculated by dividing xclear by the approach speed (vapproach). The distance required to bring the vehicle to stop (xSD) is calculated using the basic kinematic equation and the time to traverse the stopping distance (tSD) is calculated by dividing xSD by the vapproach. The RLVW Detection Zone (RDZ) has a width equal to that of the through lane and a length equal to the time to detect vehicles (tRDZ) multiplied by the vapproach. The tRDZ is the time required to traverse the RLVW Detection Zone at the approach speed. In this study, 0.5 s is used to ensure that at least one BSM message from the CV's OBU will be received by the traffic signal controller. The RLVW Critical Time (tRLVW) is the summation of tclear, tSD, and tRDZ. The signal timing in this study has a cycle with yellow intervals duration of 4.0 s. As such, the precise boundary of the Yellow Change Interval (tyellow) is measured from the end of the marked crosswalk to 4 s upstream as shown in Fig. 2. In addition, the precise boundary of the AGP is measured by subtracting tyellow from the tRLVW.
The ideal offset is calculated using Eqn (2) and according to the Signal Timing Manual[2].
$ {\mathrm{t}}_{{\mathrm{ideal}}} = \dfrac{L}{{v}_{approach}}$ (2) where, tideal = ideal offset (calculated in seconds), L = distance between signalized intersections (measured in feet), and vapproach = 85th Percentile speed (ft/s)
As illustrated above, the RLVW and AGP interaction scenario for a CI under actuated control is summarized in the following steps:
• The CI infrastructure receives and calculates the necessary parameters for all through movements at the intersection, including vapproach, xSD, xclear, tRDZ, and AGP.
• As an RLVW-equipped CV approaches the CI, the OBU receives signal timing and roadway geometry data from the CI. At the same time, the OBU sends its location and other vehicle-related information to the CI.
• If the CI detects a vehicle within the RDZ, the movement is green, and the CI is not terminating the movement, it sets the minimum end time for the movement to the current time plus the AGP.
• When the CI determines that a green movement is about to terminate, it provides an AGET that is equal to or greater than the current minimum end time.
• After the CI provides the AGET, the RLVW application on the OBU may send advisories, warnings, or alerts to the driver.
SILS platform setup
-
The SILS utilized in this study integrates a traffic simulation model with ASC/3 controller developed by Econolite and merged within the VISSIM interface. Figure 3 illustrates the SILS setup within VISSIM and for more detailed SILS modeling, refer to Arafat M[25]. The traffic data exchange between each software occurs every simulation time step. As compared to real-world traffic operations, in VISSIM the traffic signals were modeled with loop detectors to enable vehicle presence and actuation. VISSIM then sends the calls from these virtual detectors to the Econolite controller to send the corresponding signal state back to VISSIM signal heads.
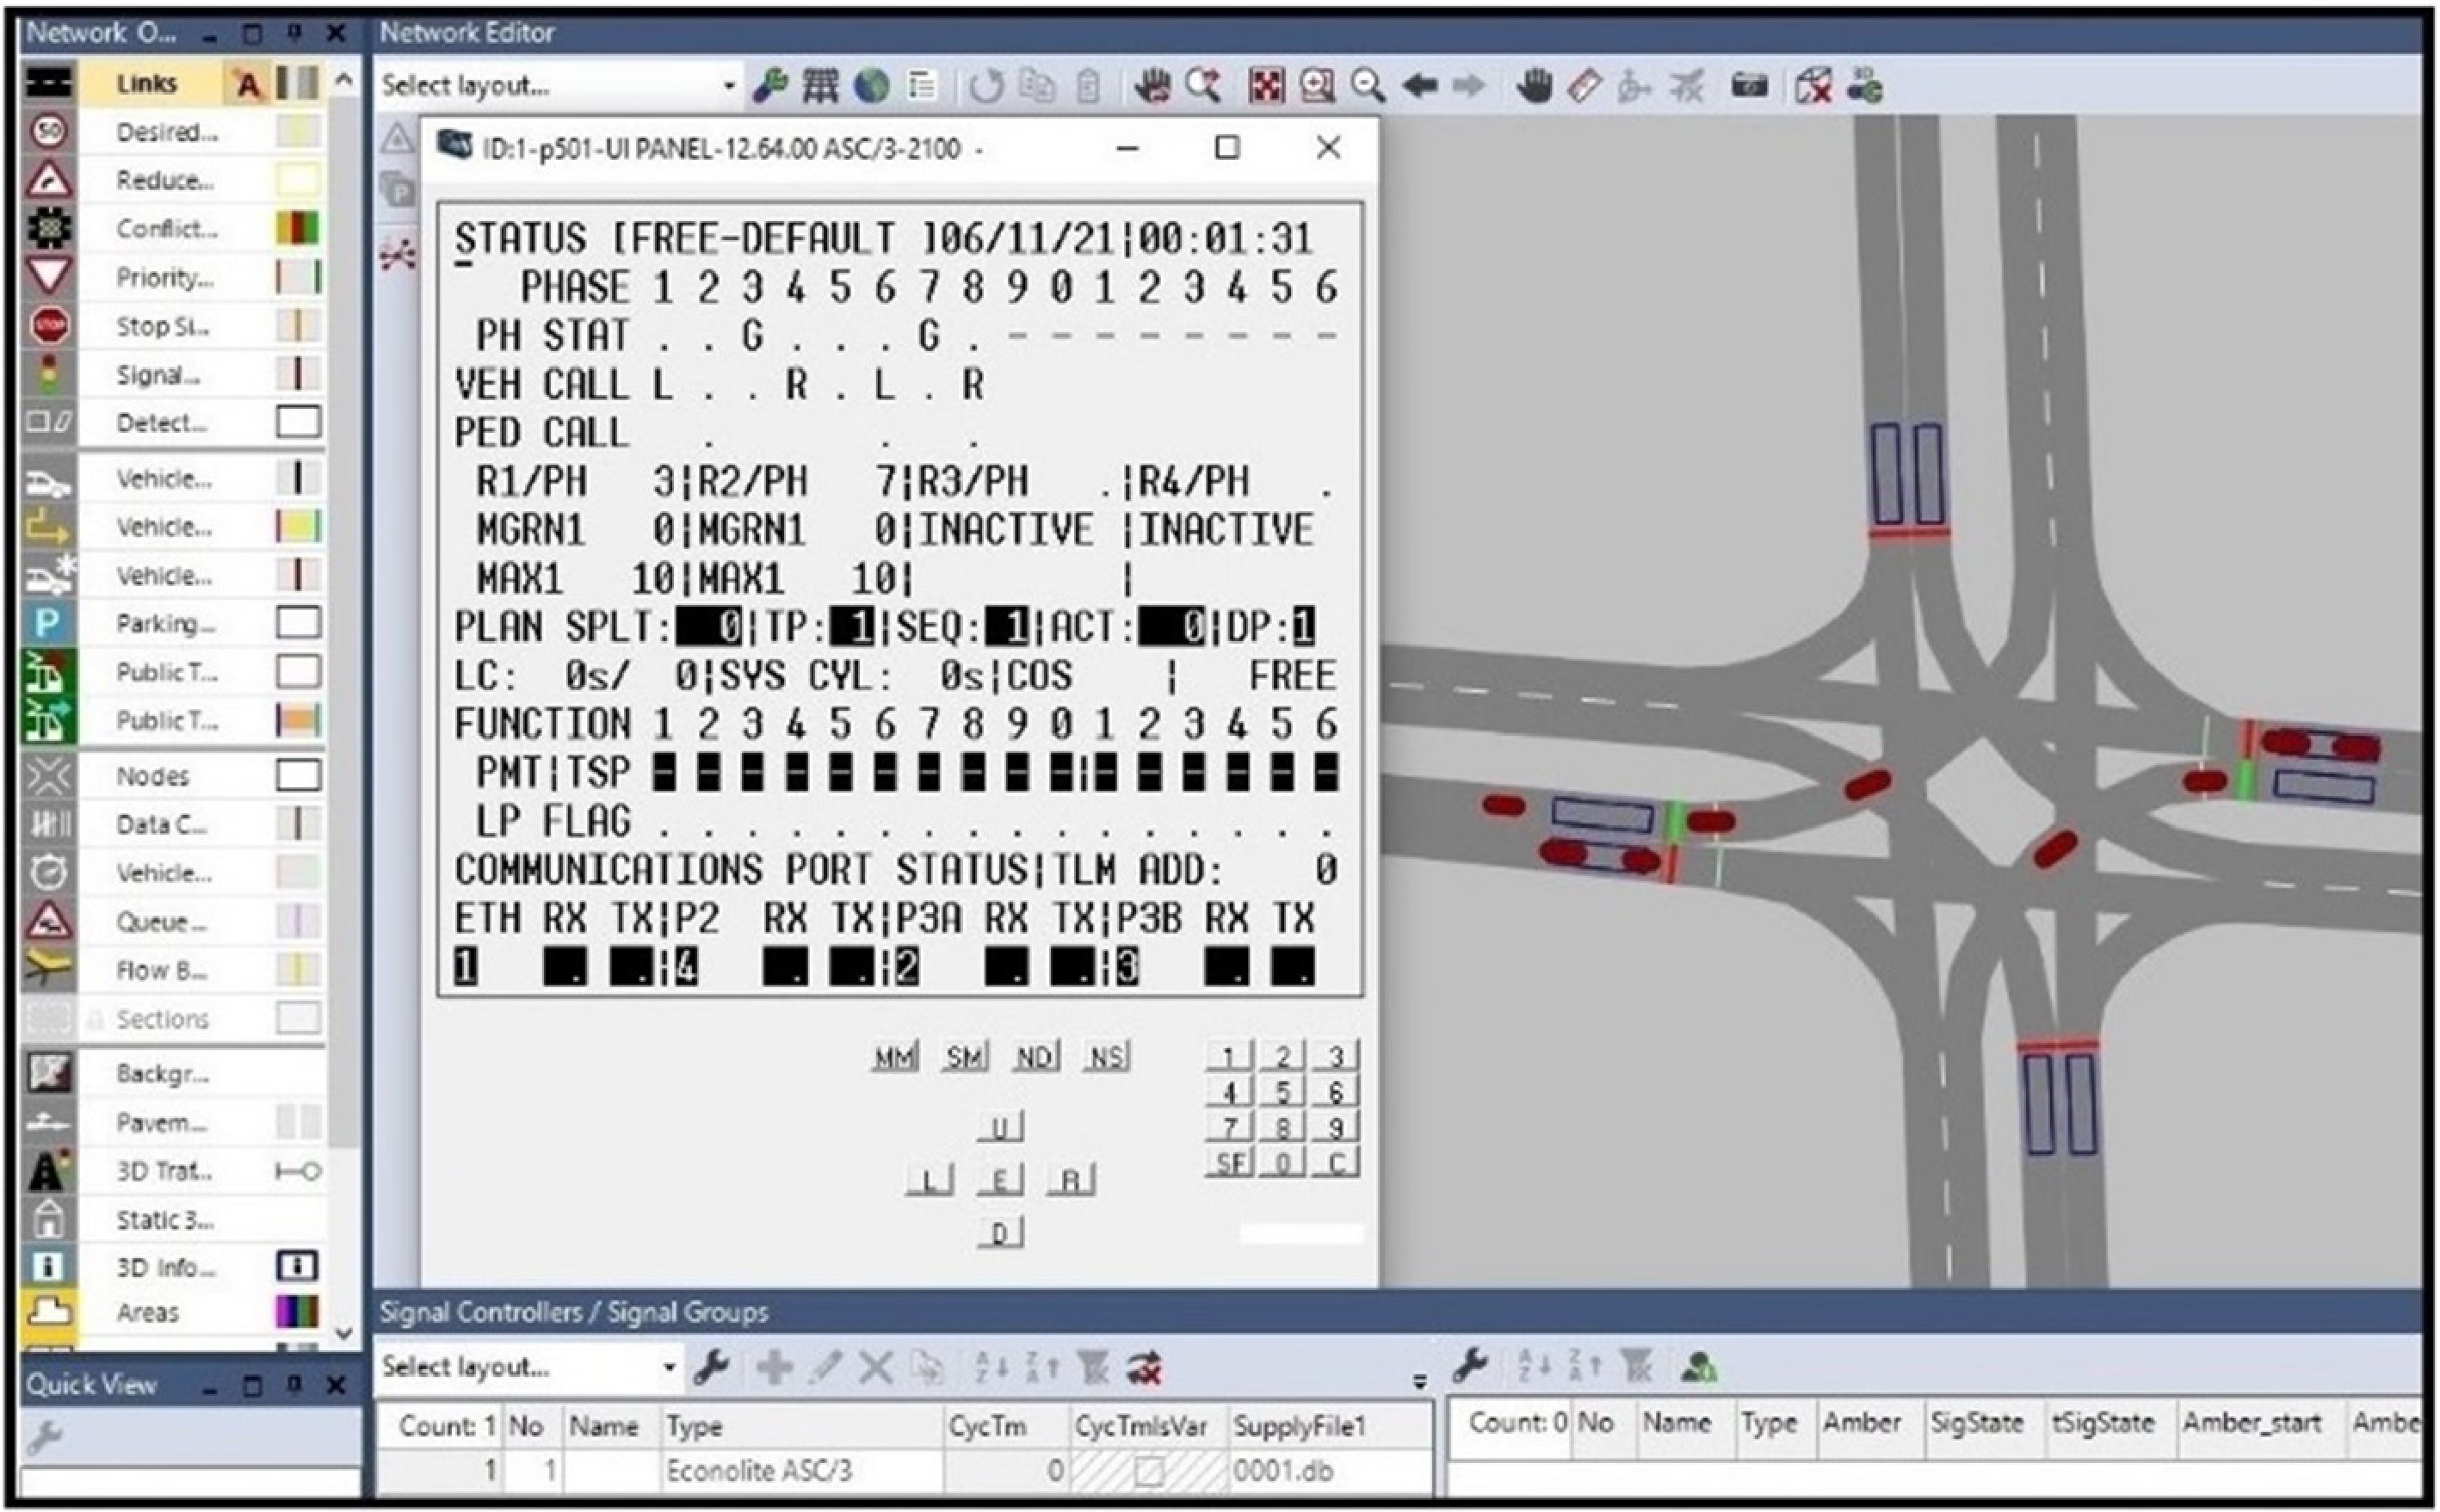
Figure 3.
Software-in-the-loop simulation.
Microscopic simulation network calibration
-
As referenced in the review of literature, drivers' behavior approaching traffic signals is a critical factor in modeling the RLVW application and significantly impacts the likelihood of red-light violations. This behavior largely depends on the drivers' decisions to stop or proceed during the yellow interval. This behavior is incorporated into VISSIM by the software developers using probability distributions utilizing default parameters. Thus, it is very important to ensure that these parameters are well-calibrated to reflect the actual motorists' driving habits.
When motorists approach a traffic signal, they tend to fall with a stop-go probability distribution that has been previously modeled in the academic literature. A previous study by Gates et al. provided the real-world stop-go probabilities for drivers at the onset of the yellow interval[26]. Vehicle trajectories obtained from VISSIM and logistic regression were used to replicate actual driver behavior developed by Gates et al.[26]. Hadi et al. developed a methodology for calibrating VISSIM models to simulate the RLVW application. A summary of this calibration process is provided below, and for more detailed information, refer to Hadi et al.[27].
The calibration process involved fine-tuning the parameters of a built-in distribution in VISSIM that models driver stop-go decisions at the start of the yellow interval using logistic regression. This function incorporates three parameters: Alpha (α), Beta1 (β1), and Beta2 (β2). The drivers' responses to the yellow light are determined by these three parameters, as well as the vehicle's speed (v) and the distance to the stop line (dx) at the onset of the yellow interval. The utilized probability function (p) is shown in Eqn (3).
$ p=\frac{1}{1+{e}^{-\alpha -{\beta }_{1}v-{\beta }_{2}dx}} $ (3) where, p = probability that a vehicle will stop at a yellow-light, α, β1, and β2 = logistic coefficients.
VISSIM uses the α, β1, and β2 parameters to model the driver's decision to stop or go when approaching the simulated traffic signals. These parameters are set in the simulation by default and require calibration to align with the real-world stop-go probability distributions mentioned above. Appiah et al.[28] recommended acceptable ranges for these parameters that were used during the calibration process. A logistic regression was performed using R software to identify the optimal combination of α, β1, and β2 that best replicated real-world driver behavior during the yellow interval. The goal of this calibration process is to minimize the errors between the simulation distribution and the actual motorist's behavior. For this purpose, the Sum of Squared Errors (SSE) was used which is the sum of the squared differences between each observation and its group's mean.
Quantifying red-light running in VISSIM
-
To quantify Red-Light Running (RLR) events, a spreadsheet was used to analyze vehicle trajectory data generated by VISSIM. This analysis determines the different decisions made by vehicles that include stop, go, RLR. Figure 4 provides a detailed flowchart of the analysis process.
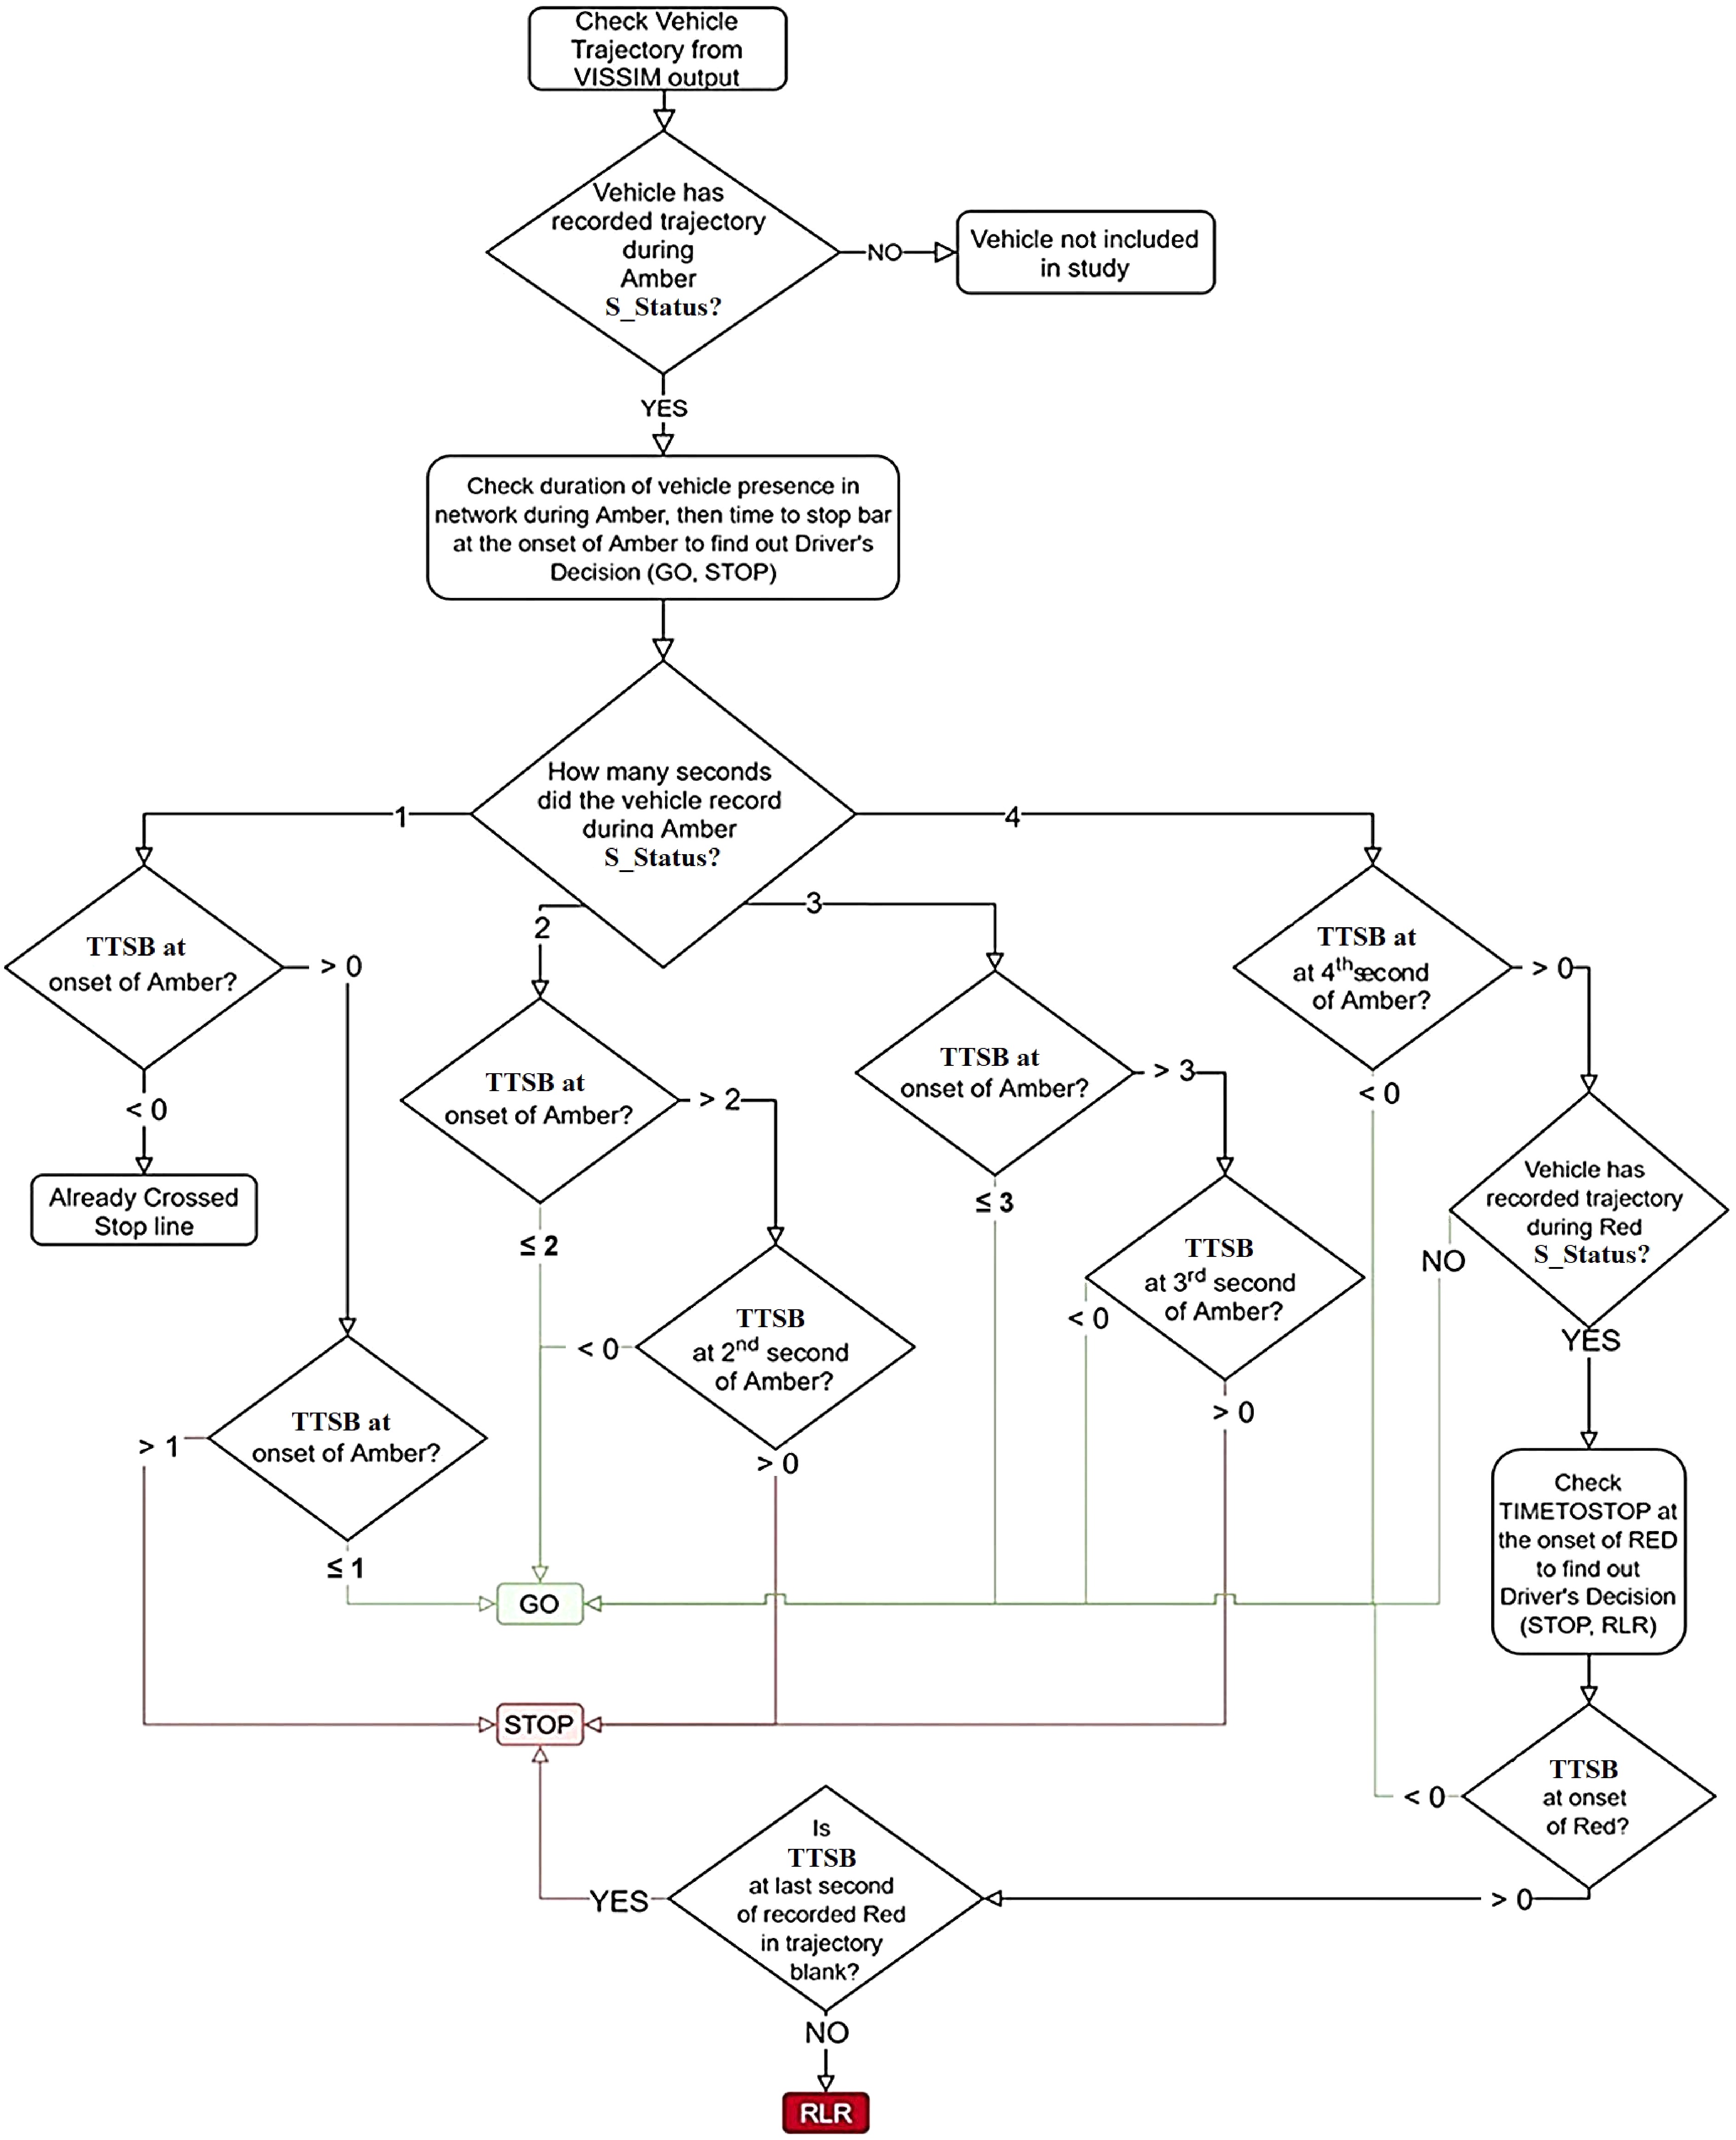
Figure 4.
Vehicle trajectories analysis.
The key metrics extracted for the analysis include the following:
• DTSB: The distance of the vehicle from the stop bar, measured in feet (ft).
• TTSB: The duration needed for a vehicle to arrive at the stop bar, measured in seconds (s).
• Speed (v): The speed of the vehicle, measured in miles per hour (mph).
• S_Status: The present state of the traffic signal phase (green, yellow, or red).
• TS_Status: The elapsed time in seconds for the current signal phase, measured in seconds (s).
For every simulation second, the simulation model was designed to record a vehicle's trajectory, capturing its speed and position on the link during any signal state. The modeled traffic signals in this study have a cycle that includes a yellow interval lasting 4.0 s. Typically, a vehicle records four trajectories during this interval. However, if a vehicle records only one, two, or three trajectories at the onset of the yellow signal, this suggests two possibilities: either the vehicle was close enough to the stop bar and made a Go decision (it would otherwise have recorded four trajectories if it had stopped), or the vehicle had just entered the simulation network within one, two, or three s remaining in the yellow interval and stopped.
Accordingly, the flowchart in Fig. 4 begins by determining whether the vehicle has recorded a trajectory during the yellow signal state. If no trajectory is recorded, the vehicle is excluded from the study, as it would have either crossed the intersection during the green signal state or arrived during the red signal state. For vehicles with recorded trajectories during the yellow interval, the next step involves checking the duration of the vehicle's presence on the link, behind the stop bar. Given the 4-s yellow interval, the following scenarios are possible:
(1) One recorded trajectory:
• If the Time to Stop Bar (TTSB) is negative, the vehicle has already crossed the stop bar during the last second of the green phase as the signal turns yellow. This vehicle is excluded from further analysis.
• If the TTSB is positive:
TTSB < 1 s: as mentioned above, this is a Go decision.
TTSB > 1 s: Stopped vehicle (i.e., the vehicle just entered the network during the last one second of the yellow interval).
(2) Two recorded trajectories:
• If TTSB ≤ 2 s: Go decision.
• If TTSB > 2 s, the second recorded trajectory is analyzed:
TTSB is negative: Go decision.
TTSB is positive: Stopped vehicle (i.e., the vehicle entered the network during the last two s of the yellow interval).
(3) Three recorded trajectories:
This scenario follows the same logic as the second scenario but with a TTSB of 3 s and the third recorded trajectory being analyzed.
(4) Four recorded trajectories:
• If TTSB is negative, the vehicle made a Go decision.
• If TTSB is positive, the vehicle remains behind the stop bar.
If the vehicle does not have a trajectory during the red phase or the vehicle has a trajectory and TTSB is negative, this indicates that the vehicle made a safe Go decision and crossed the intersection. If TTSB in the last trajectory is blank (indicating a speed of 0 mph), the vehicle made a Stop decision and decelerated to a complete stop behind the stop bar. However, if TTSB is not blank, it means the vehicle continues moving forward, resulting in a red-light running violation.
Red light violation warning application assessment
-
This study employed the calibrated simulation model, as described earlier, to evaluate the safety and mobility performance of the RLVW application. The utilized mobility performance measures are the stopped delay, average number of stops, and approach delays. Safety performance is assessed by tracking the Red-Light Running (RLR) events. The simulation was conducted with varying rates of RLVW CV market penetration (MP%)[29].
The RLVW algorithm, adopted from Hadi et al.[27], was integrated into VISSIM using the COM Interface and Python programming. The simulated CVs receive the DSRC SPaT and MAP messages provided they are within a roadside unit (RSU) communication range. When a CV is detected within the RLVW detection zone, the signal controller extends the green phase time using the AGP. This green phase extension is implemented in the ASC/3 controller by applying an NTCIP 1202 V03.26 Detector Extend Parameter[30]. This parameter represents the vehicle detector's actuation duration that is extended beyond the planned termination point when the signal is green. Adding this extension of the green phase to the yellow and all-red time ensures that vehicles can safely clear the intersection, reducing the likelihood of an RLR event. Additionally, it supports the RLVW technology by providing a definitive value of the end time of the green phase.
A programming script was developed to transfer Simple Network Management Protocol (SNMP) packets carrying the Vehicle Detector Extend Parameter to the controller using the appropriate NTCIP object identifier. If it is determined that the vehicles cannot safely clear the intersection within the AGET, the system will issue a warning message indicating the potential for a red-light violation.
To assess the safety effect of the RLVW, as noted earlier the output .trj files from VISSIM were imported in the SSAM tool to estimate the total of virtual traffic conflicts number[5]. The SSAM converts these conflicts into Surrogate Safety Measures (SSM). That includes Time-to-Collision (TTC) and Post-Encroachment Time (PET). The default threshold values for TTC and PET were set at 1.5 and 5.0 s, respectively[31,32].
-
All simulations were executed with 10 different random seed values to represent the model stochasticity. The simulation period lasted for 70 min, consisting of 10 min of preliminary time and 60 min of actual analysis time. The offset time used for the coordinated traffic signals was calculated to be 10.8 s. Results were gathered for two different scenarios (a) and (b):
(a) No offset: (zero second) between the upstream and downstream intersections
(b) Coordination: with the optimal 11-s offset.
Model calibration results
-
The calibration parameters in Eqn (3) were tuned to examine the influence of each parameter on the vehicle trajectories. The results suggest that changing the alpha (α) coefficient did not provide significant impacts on the vehicle trajectories and as such the driver's behavior remained the same in terms of the stopping probability or the number of RLR violations.
However, the β1 and β2 parameters were found to have a positive correlation with the drivers' probability to stop and a negative correlation with the drivers' probability to go. Furthermore, β1 and β2 showed a negative correlation with the occurrence of the number of RLR events. This indicates that higher values for β1 and β2 increase the chances of a stopping behavior at the yellow signal and reduce the probability of RLR.
Figure 5 presents the probability distribution using different values of the aforementioned VISSIM coefficients, compared to the same distribution derived from real-world driver behavior models.
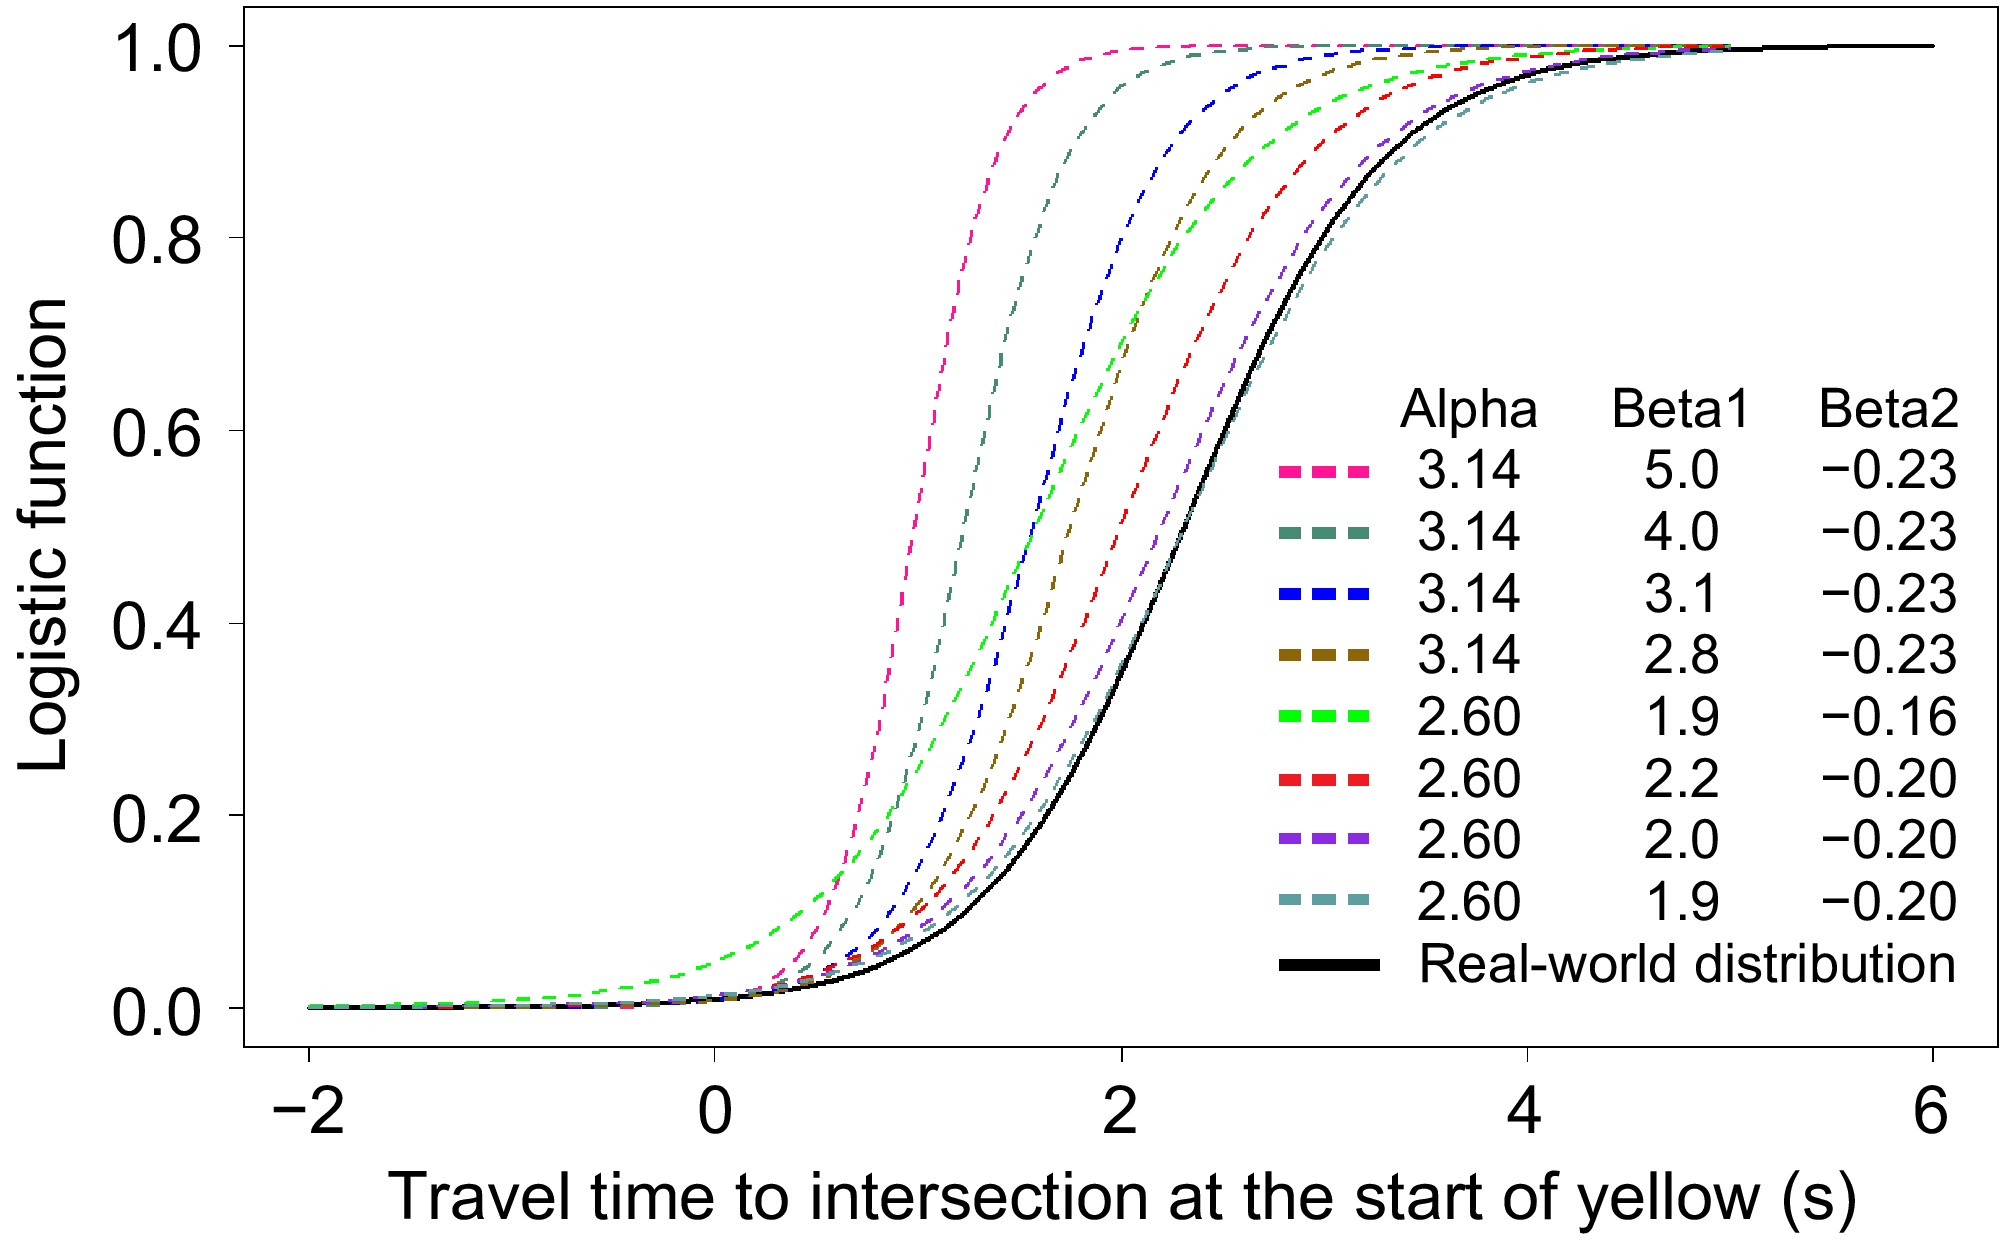
Figure 5.
Stop-go probability distribution of VISSIM vs Gates et al.[26].
The regression results suggested that utilizing the values of α = 2.60, β1 = 1.90, and β2 = −0.20 resulted in the lowest sum of squared errors (SSE), effectively minimizing the discrepancy between the simulation and real-world data.
Arrivals-on-green for coordination scenarios
-
The benefits of traffic signal coordination on the RLVW technology mainly rely on the ability to increase the vehicle throughput during the green interval. Forty-three cycles were tested, and the total traffic volume arrived during the green signal interval were collected using VISSIM data collection points. Figure 6 illustrates a 36% increase in the total traffic volume arriving during the green interval utilizing an offset of 11 s.
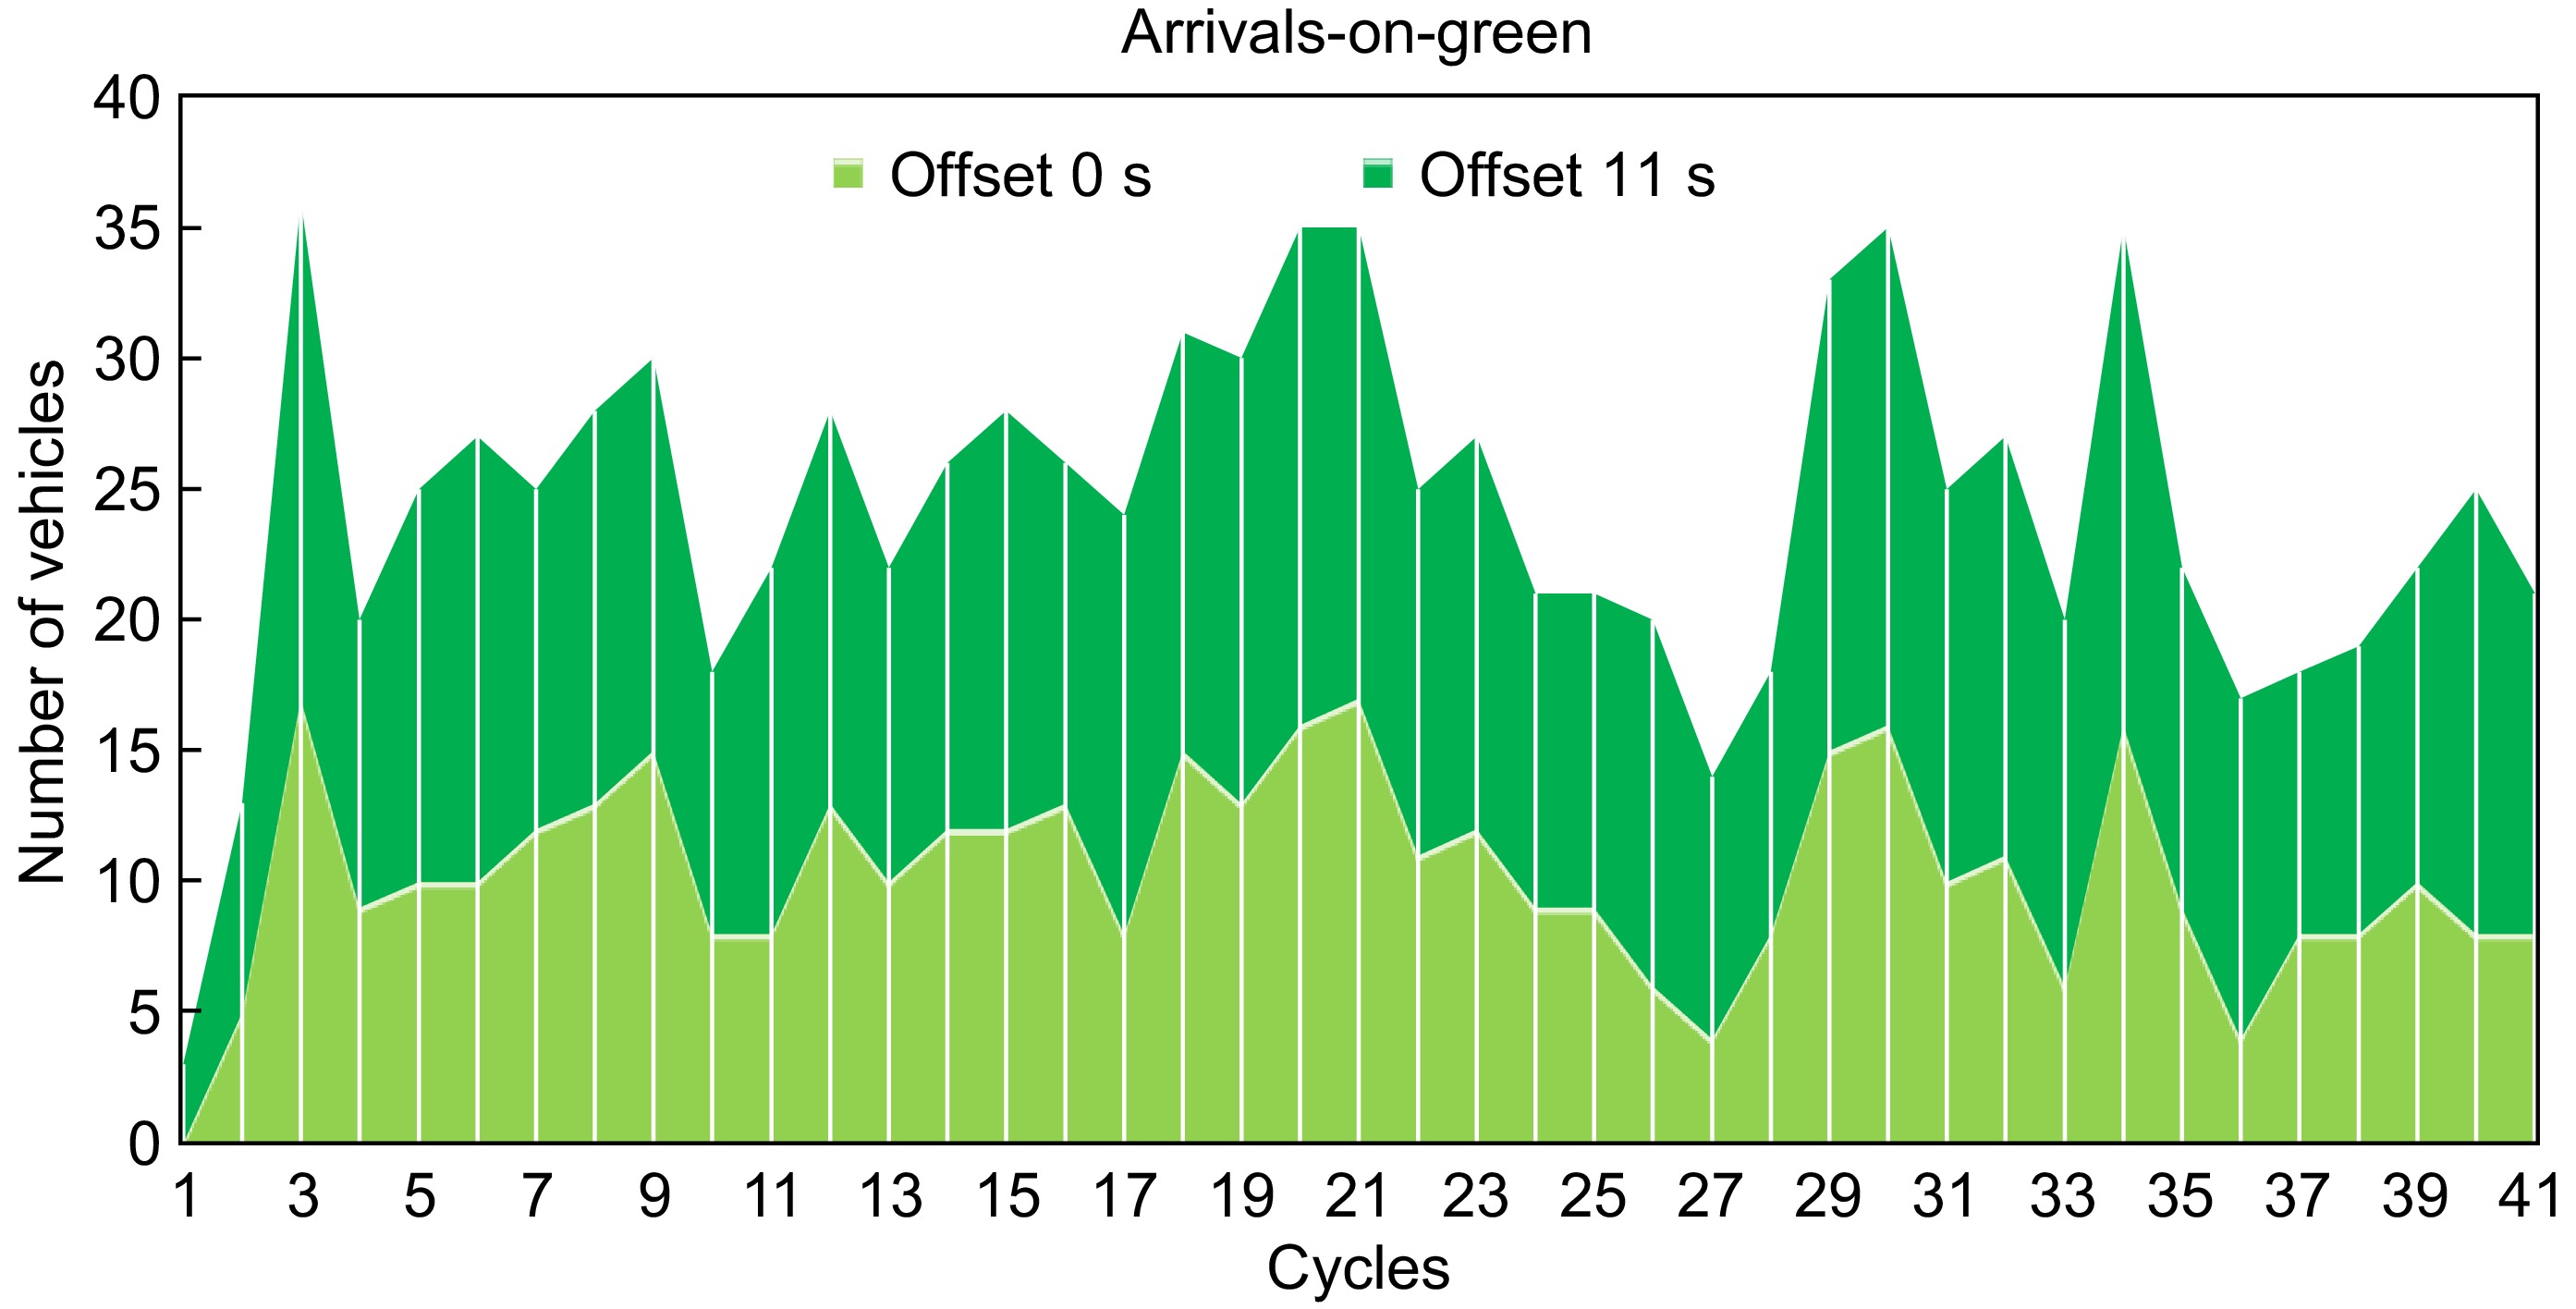
Figure 6.
Vehicle arrivals on green.
Mobility performance measures without AGP
-
For scenario (a) (zero-second offset), Table 1 shows that without AGP and as the CV Market Penetration (MP) increased, the mean stopped delay for each vehicle slightly increased by only 1.5 s. Additionally, except at 0% MP, the average number of stops per vehicle constantly equaled 0.8. However, the approach delay increased from 31.8 s at 0% MP to 36.4 s at 100% MP. Since the change in the stopped delay and the number of stops per vehicle are almost negligible, the increase in approach delay is attributed to factors other than actual stopping time. Approach delay is often measured as the difference between actual travel time and free-flow travel time for a given approach. If free-flow travel speeds are high but vehicles decelerate earlier due to the modeled RLVW behavior, approach delay naturally increases. CVs often slow down earlier when approaching a signalized intersection or an area with potential congestion. This proactive speed reduction increases the travel time along the approach, contributing to higher approach delay, even if the stopped delay and the number of stops per vehicle remain unchanged.
Table 1. Simulation output with zero-second offset.
CV MP Stopped delay (s/veh) Stops per vehicle (mean) Approach delay (s/veh) 0% 24.2 0.7 31.8 10% 24.7 0.8 33.0 20% 24.2 0.8 32.8 30% 24.8 0.8 33.7 40% 24.6 0.8 34.0 50% 25.4 0.8 35.0 60% 25.1 0.8 35.0 70% 25.5 0.8 36.0 80% 25.0 0.8 35.4 90% 25.7 0.8 36.4 100% 25.5 0.8 36.4 As shown in Table 2, the results from scenario (b) (11-s offset) showed that as the CV utilization rate increased from 0% to 100%, the average stopped delay slightly increased from 23 to 25.1 s, a change of 9.1%. The average number of stops per vehicle fluctuated between 0.7 and 0.8 stops per vehicle. The approach delays also increased from 30.6 s at 0% CV utilization to 36.1 s at 100% CV utilization, marking approximately an 18% growth.
Table 2. Simulation output with 11-s offset.
CV MP Stopped delay (s/veh) Stops per vehicle (mean) Approach delay (s/veh) 0% 23.0 0.7 30.6 10% 23.1 0.8 31.2 20% 23.5 0.8 32.0 30% 23.8 0.8 32.6 40% 23.8 0.8 33.0 50% 24.3 0.8 34.0 60% 24.4 0.8 34.2 70% 25.1 0.8 35.3 80% 25.1 0.8 35.8 90% 25.1 0.8 36.0 100% 25.1 0.7 36.1 Safety performance measures without AGP
-
The number of RLR events was used as an indication of the safety performance of the RLVW technology. As shown in Fig. 7 and for scenario (a), the results indicate that the number of RLR events fluctuated between 5 and 11 events per hour. This variation is attributed to the lack of certainty in the green interval duration due to the actuated signal operations.
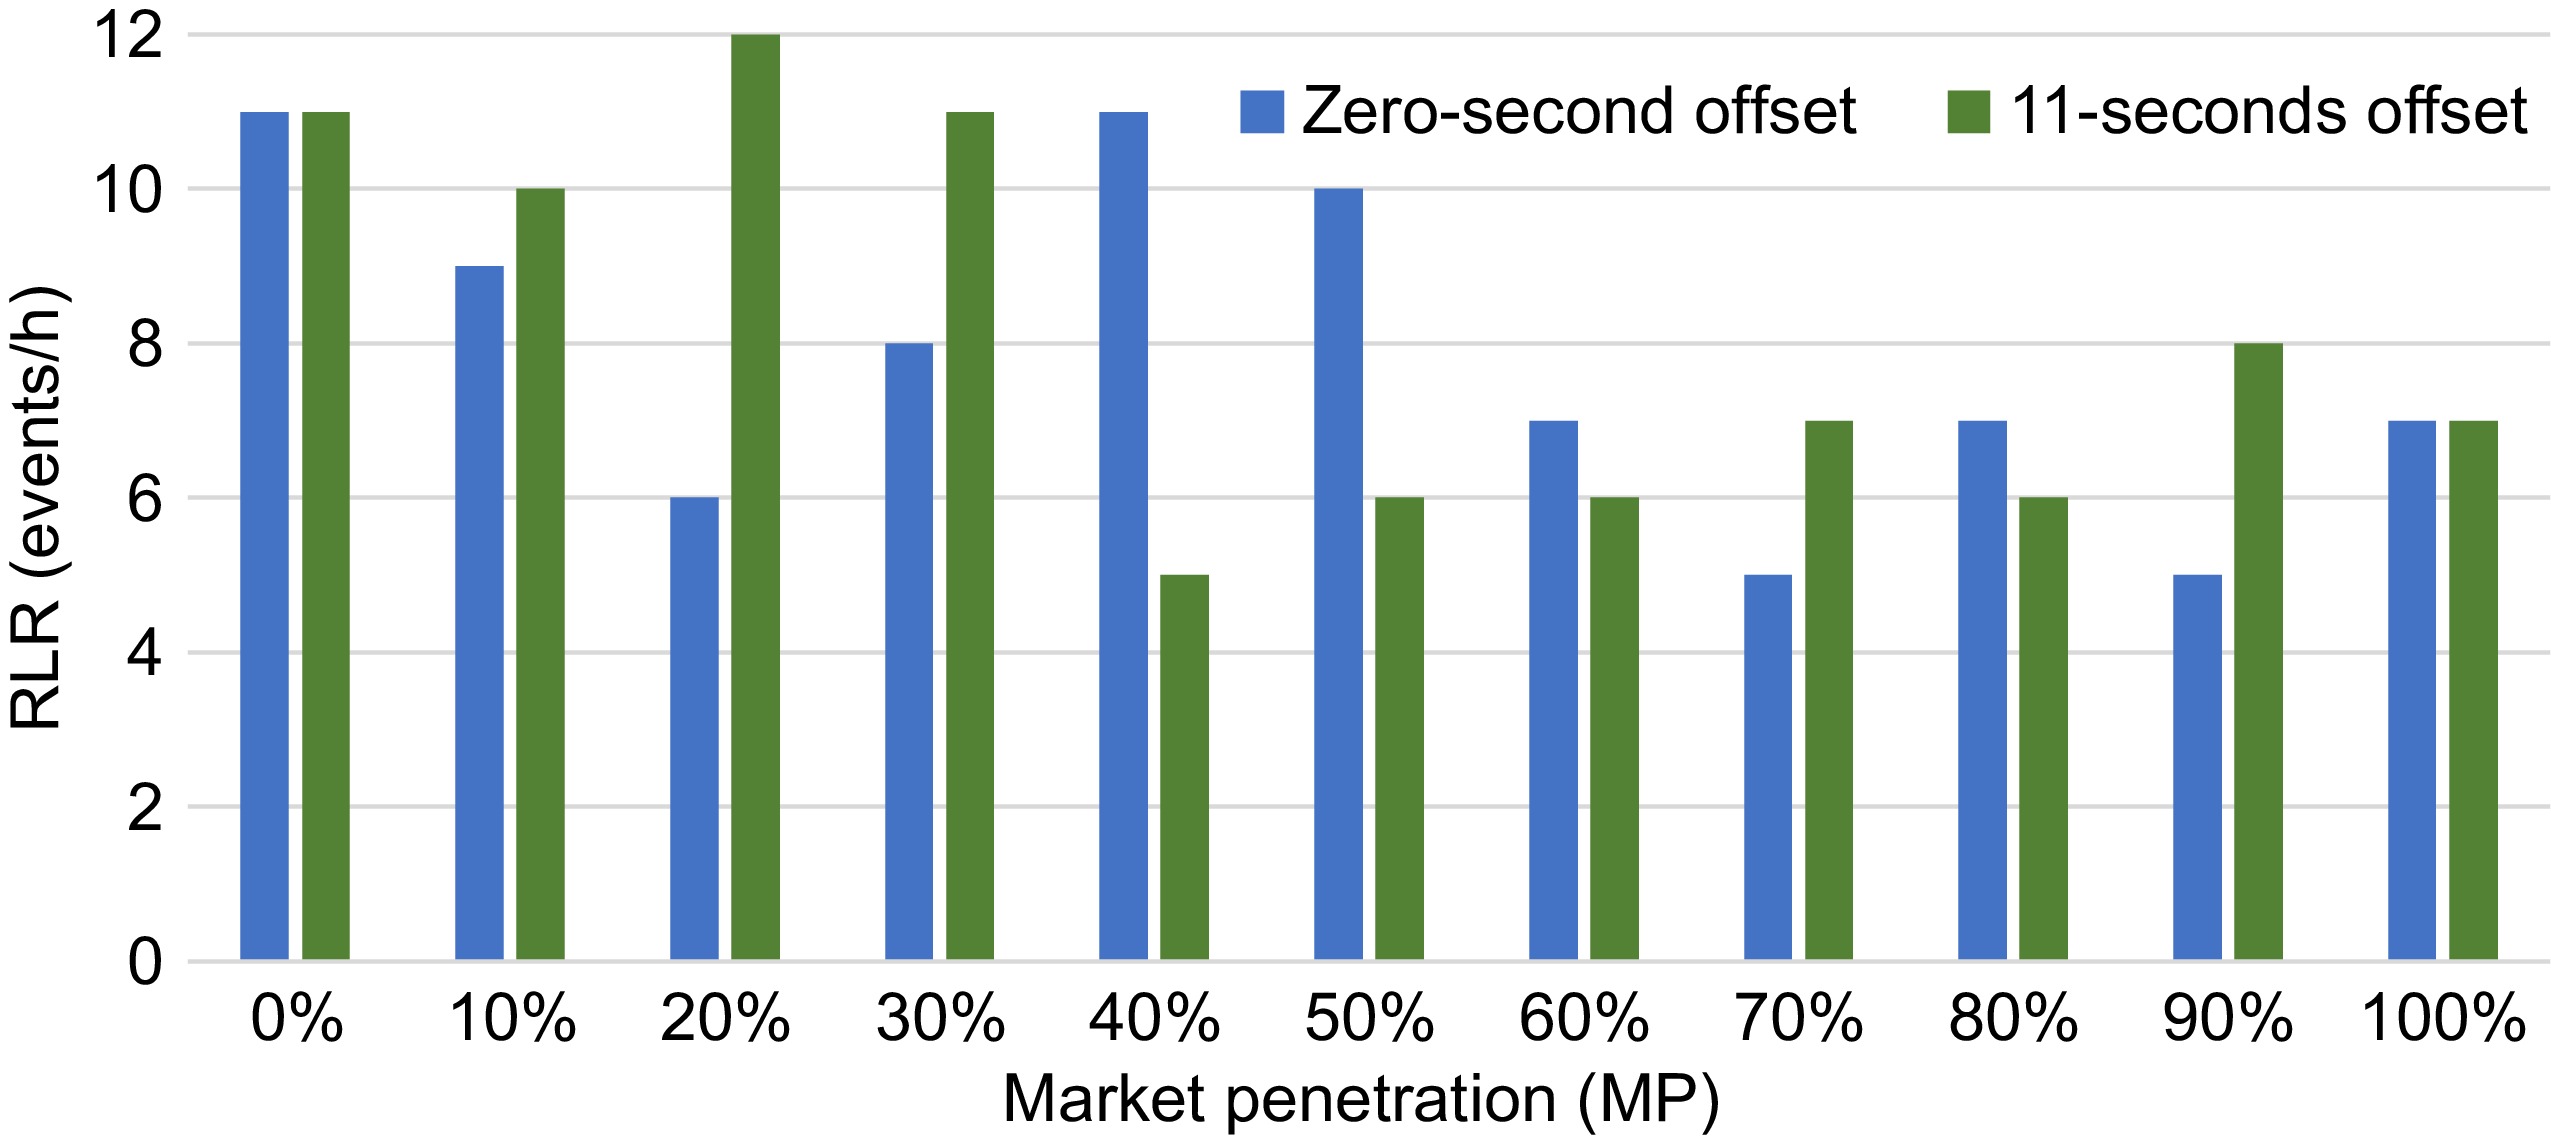
Figure 7.
Red-Light Running events without AGP.
For scenario (b), the RLR events fluctuated between 5 and 12 per hour. The results suggest that for both scenarios and without the AGP, the benefits of the RLVW were limited from a safety perspective.
Mobility performance measures with AGP
-
For scenario (a) and with AGP, Table 3 shows that as the CV utilization rate increased from 0% to 100%, the average stopped delay per vehicle ranged from 26.5 to 27.8 s. The average number of stops per vehicle constantly equaled 0.9, while the approach delay varied from 37.3 to 39.1 s. These findings suggest that with coordination and AGP, the CV-based RLVW application had an insignificant impact on the overall intersection delay according to the assessment of the mobility performance measures.
Table 3. Simulation output with a zero-second offset.
CV MP Stopped delay (s/veh) Stops per vehicle (mean) Approach delay (s/veh) 0% 26.5 0.9 37.3 10% 26.6 0.9 37.5 20% 26.6 0.9 37.5 30% 27.0 0.9 38.1 40% 26.9 0.9 38.9 50% 27.1 0.9 37.9 60% 27.4 0.9 38.5 70% 27.0 0.9 38.1 80% 27.4 0.9 38.5 90% 27.6 0.9 39.1 100% 27.8 0.9 38.9 For scenario (b), Table 4 shows that the average stopped delay per vehicle increased slightly from 17.9 s at 0% CV utilization to 19.8 s at 100% CV utilization, reflecting an increase of approximately 11%. The mean number of stops for each vehicle was constantly 0.7, with a CV utilization between 0% and 90%, and slightly increased to 0.8 stops at 100% CV utilization. In addition, the approach delay ranged from 30.6 to 32.6 s. In summary, these results indicate no significant changes in delays when AGP was implemented.
Table 4. Simulation output with 11-s offset.
CV MP Stopped delay (s/veh) Stops per vehicle (mean) Approach delay (s/veh) 0% 17.9 0.7 30.6 10% 17.9 0.7 32.2 20% 18.0 0.7 30.6 30% 18.1 0.7 32.6 40% 18.4 0.7 31.2 50% 18.4 0.7 32.3 60% 19.3 0.7 30.4 70% 19.3 0.7 32.6 80% 19.6 0.7 32.4 90% 19.7 0.7 30.6 100% 19.8 0.8 31.6 Safety performance measures with AGP
-
Figure 8 illustrates the impacts of applying AGP on red-light running (RLR) events' numbers. The results indicate a strong reduction in the average number of RLR events, decreasing from 17.2 to 4.3 events per hour when AGP is implemented, compared to without AGP.
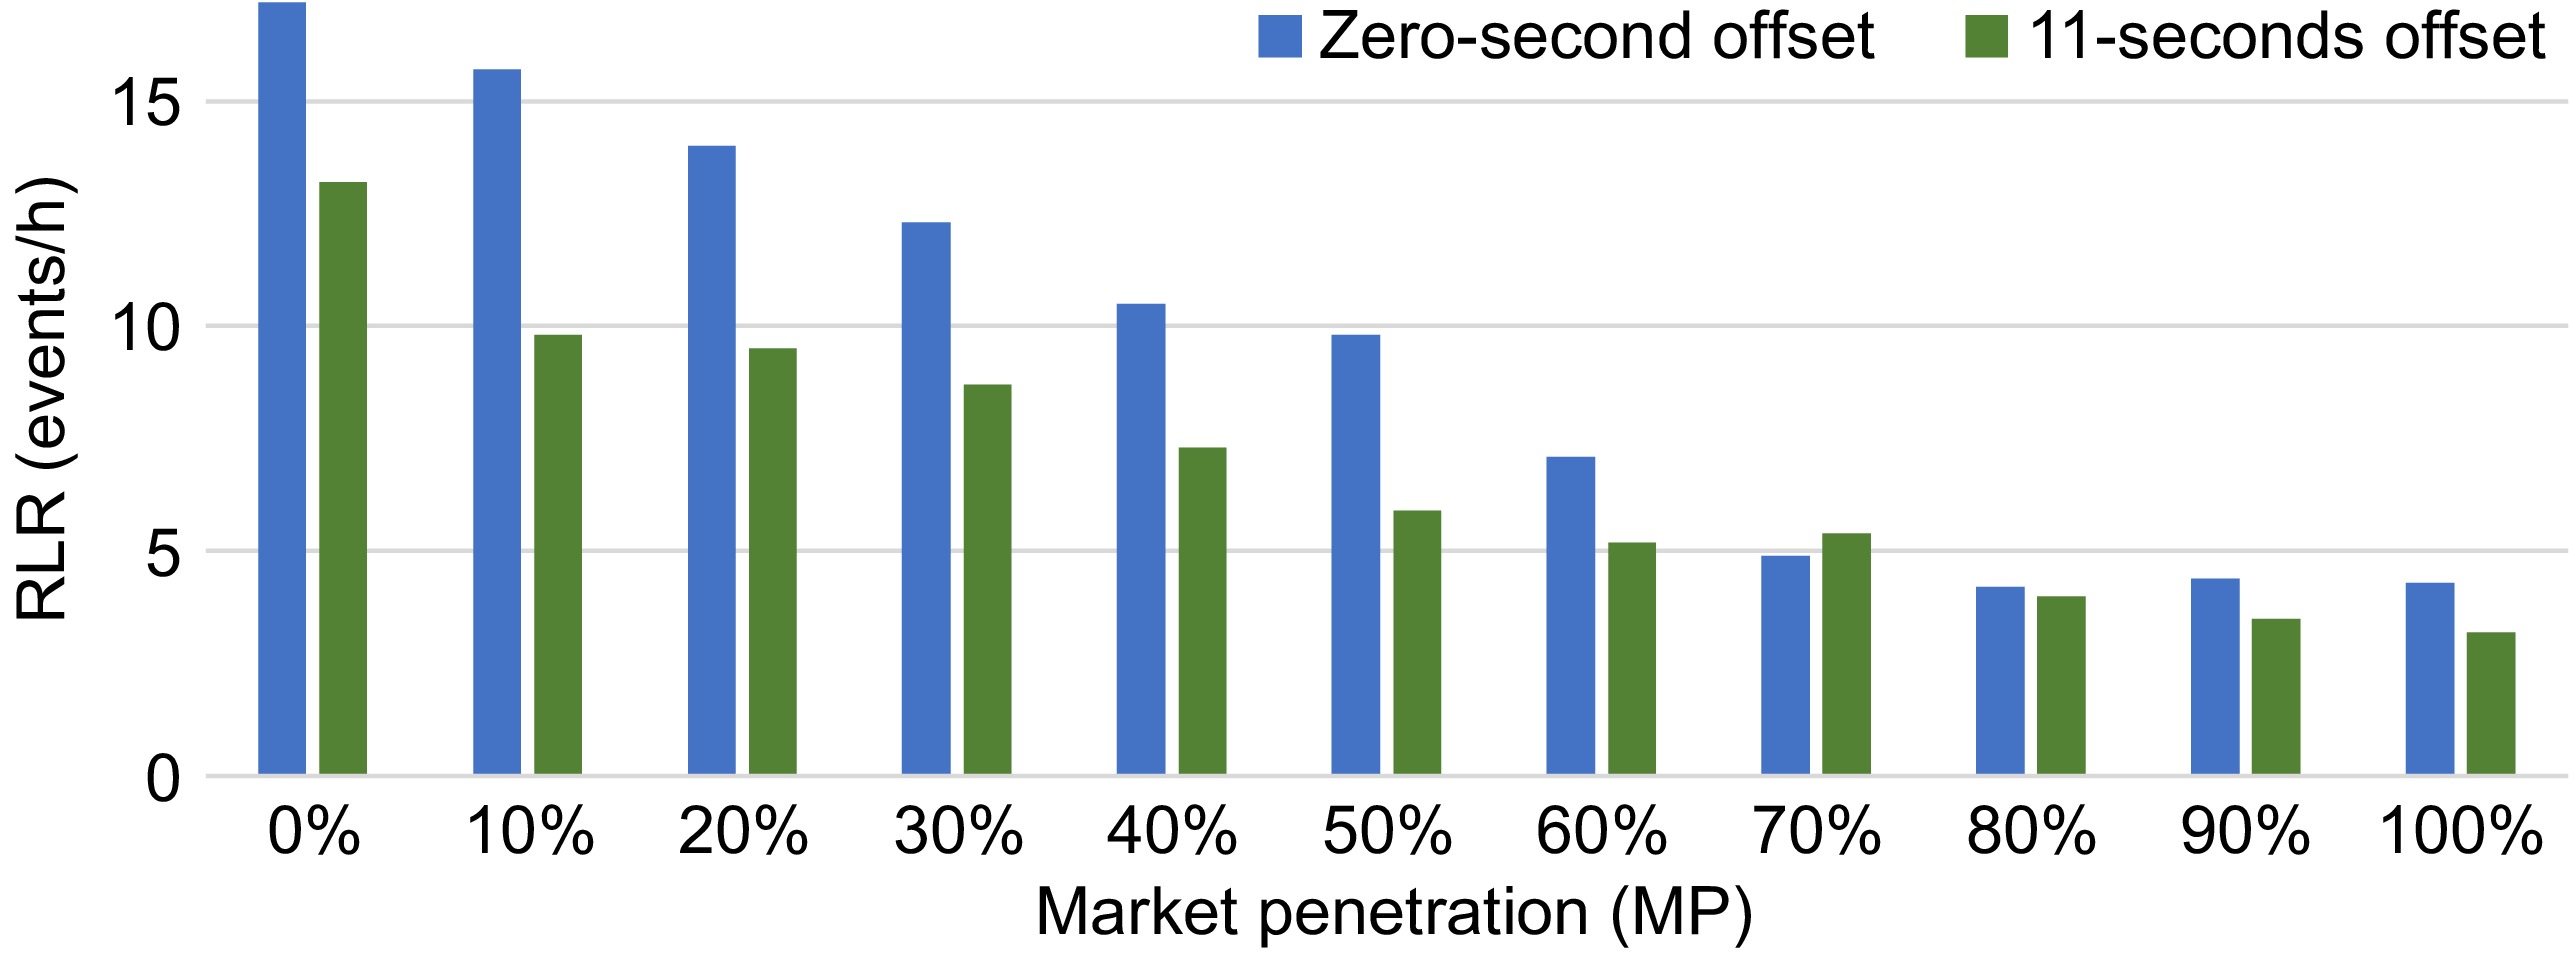
Figure 8.
Red-Light Running events with AGP.
For scenario (b) and application of the AGP, a similar decreasing pattern was observed in the RLR events' number, dropping from 13.2 to 3.2 events per hour. Overall, better coordination with the 11-s offset reduced the number of RLR events from 17.2 to 13.2 at a 0% CV utilization rate, and from 4.3 to 3.2 at a 100% CV utilization rate, totaling approximately a 75% overall reduction in RLRs.
In conclusion, it is clear from comparing results with and without AGP that AGP protects intersection delay while enhancing the safety benefits of the CV-based RLVW application at coordinated-actuated signalized intersections.
-
This study explored the effects of coordinated-actuated traffic signal control operations on the performance of the CV-based Red Light Violation Warning (RLVW) application, both with and without the implementation of Assured Green Time (AGP), under various offset settings. The findings revealed that in the absence of AGP, the mobility and safety benefits of RLVW were limited. However, the introduction of AGP, combined with signal coordination, led to a notable increase in the overall number of vehicles arriving on green, particularly with an 11-s offset compared to a zero-second offset coordination. The number of cars arriving on green at the downstream intersection rose by 36% during the 43-cycle analysis. Red-light running events (RLR) were generally decreased by improved coordination, particularly when RLVW was not in operation.
Previous studies have suggested that applying AGP at isolated intersections could compromise mobility by increasing stops and delays. In contrast, the results of this study indicate that traffic signal coordination can enhance the effectiveness of the CV-based RLVW with AGP, improving mobility at coordinated signalized intersections. Future research should focus on optimizing traffic signal coordination settings throughout the day, balancing both mobility and safety impacts.
-
The authors confirm contribution to the paper as follows: conceptualization, data curation, investigation, writing—original draft preparation: Arafat M; software, validation, visualization, supervision, resources, writing—review and editing: Arafat M, Sadeghvaziri E, Javid R; formal analysis: Arafat M, Sadeghvaziri E. All authors have read and agreed to the published version of the manuscript.
-
All data generated or analyzed during this study are included in this published article.
-
The authors declare that they have no conflict of interest.
- Copyright: © 2025 by the author(s). Published by Maximum Academic Press, Fayetteville, GA. This article is an open access article distributed under Creative Commons Attribution License (CC BY 4.0), visit https://creativecommons.org/licenses/by/4.0/.
-
About this article
Cite this article
Arafat M, Sadeghvaziri E, Javid R. 2025. Performance evaluation of red-light violation warning application with traffic signal actuation and coordination. Digital Transportation and Safety 4(2): 108−117 doi: 10.48130/dts-0025-0007 

Performance evaluation of red-light violation warning application with traffic signal actuation and coordination
- Received: 20 December 2024
- Revised: 13 January 2025
- Accepted: 09 February 2025
- Published online: 27 June 2025
Abstract: The Red-Light Violation Warning (RLVW) is a Connected Vehicle-to-Infrastructure application designed to enhance traffic safety by significantly reducing Red-Light Running (RLR) incidents at traffic signals. This paper evaluates the safety and mobility impacts of RLVW under coordinated-actuated signal control using a software-in-the-loop simulation environment. Specifically, it examines a recently proposed method as part of a national initiative to implement an Assured Green Period (AGP). It aims to address uncertainties in the duration of the green phase conveyed to drivers through connected vehicle (CV) technology under actuated signal control. While previous research indicated that AGP implementation without signal coordination improved safety, it also highlighted potential mobility drawbacks, such as increased stops and delays at intersections. The findings of this study reveal that integrating AGP with traffic signal coordination, particularly using an 11-second offset, significantly increased the vehicle throughput during the green interval by 36% at the downstream intersection over 43 analyzed signal cycles—compared to a zero-second offset. This improvement mitigated the negative mobility impacts of RLVW. Furthermore, the system achieved a 75% reduction in Red-Light Running events, underscoring its safety benefits.