-
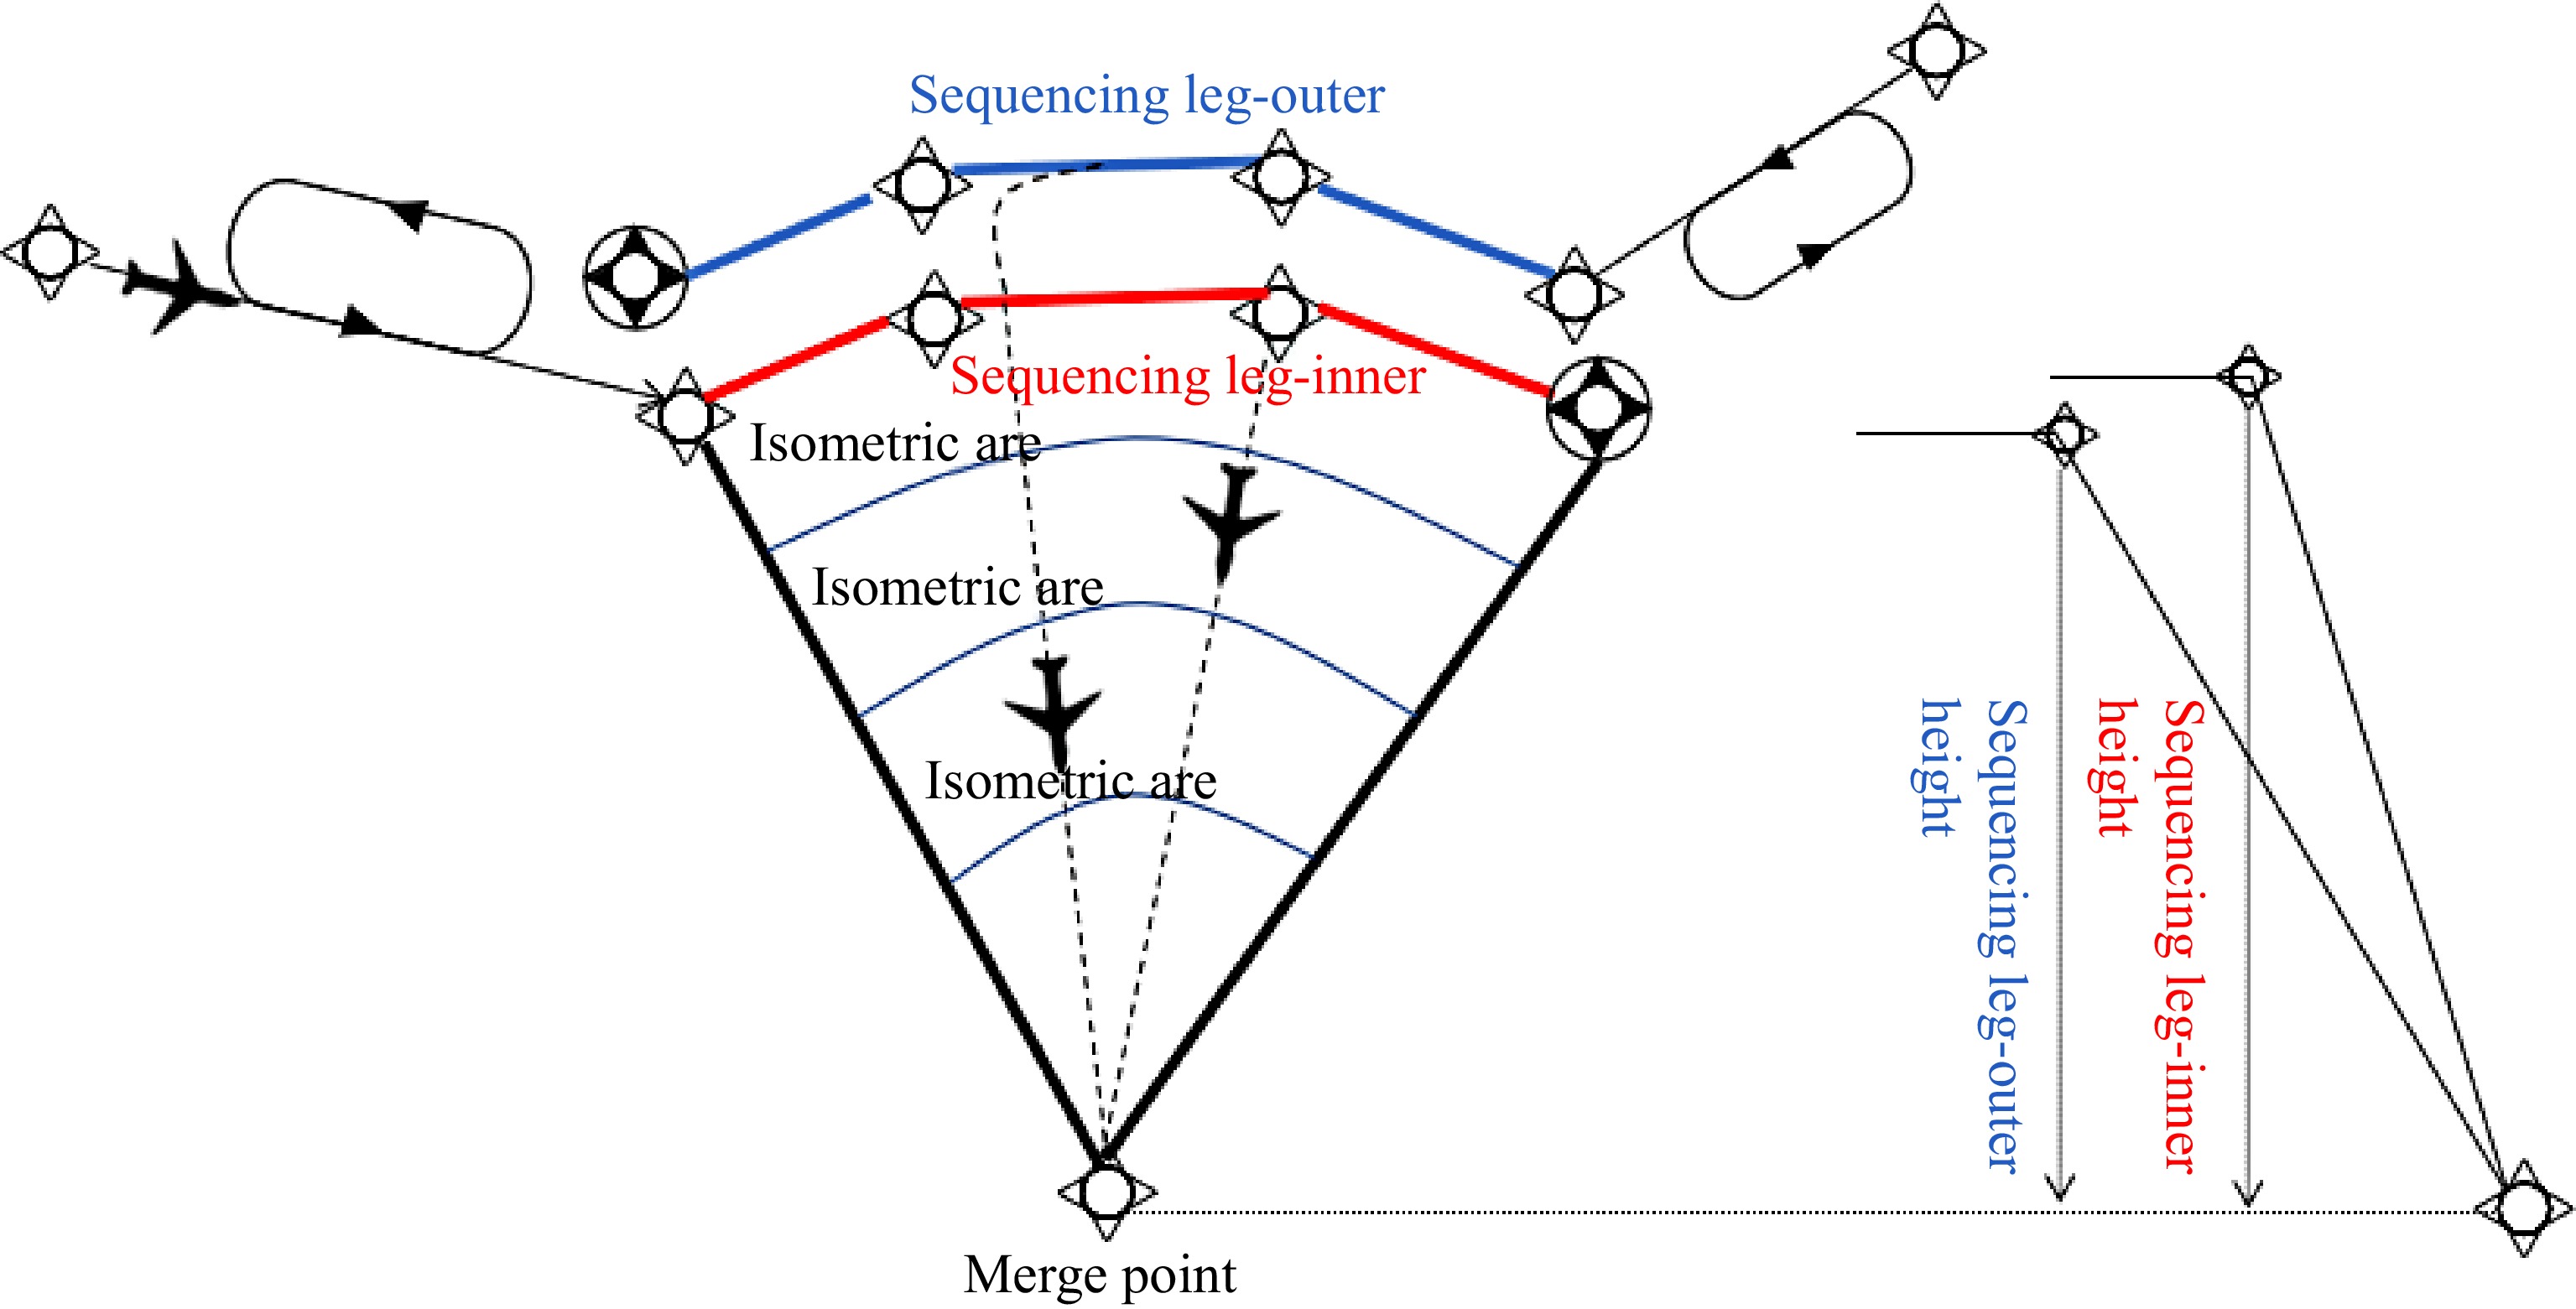
Figure 1.
Point merge approach procedure.
-
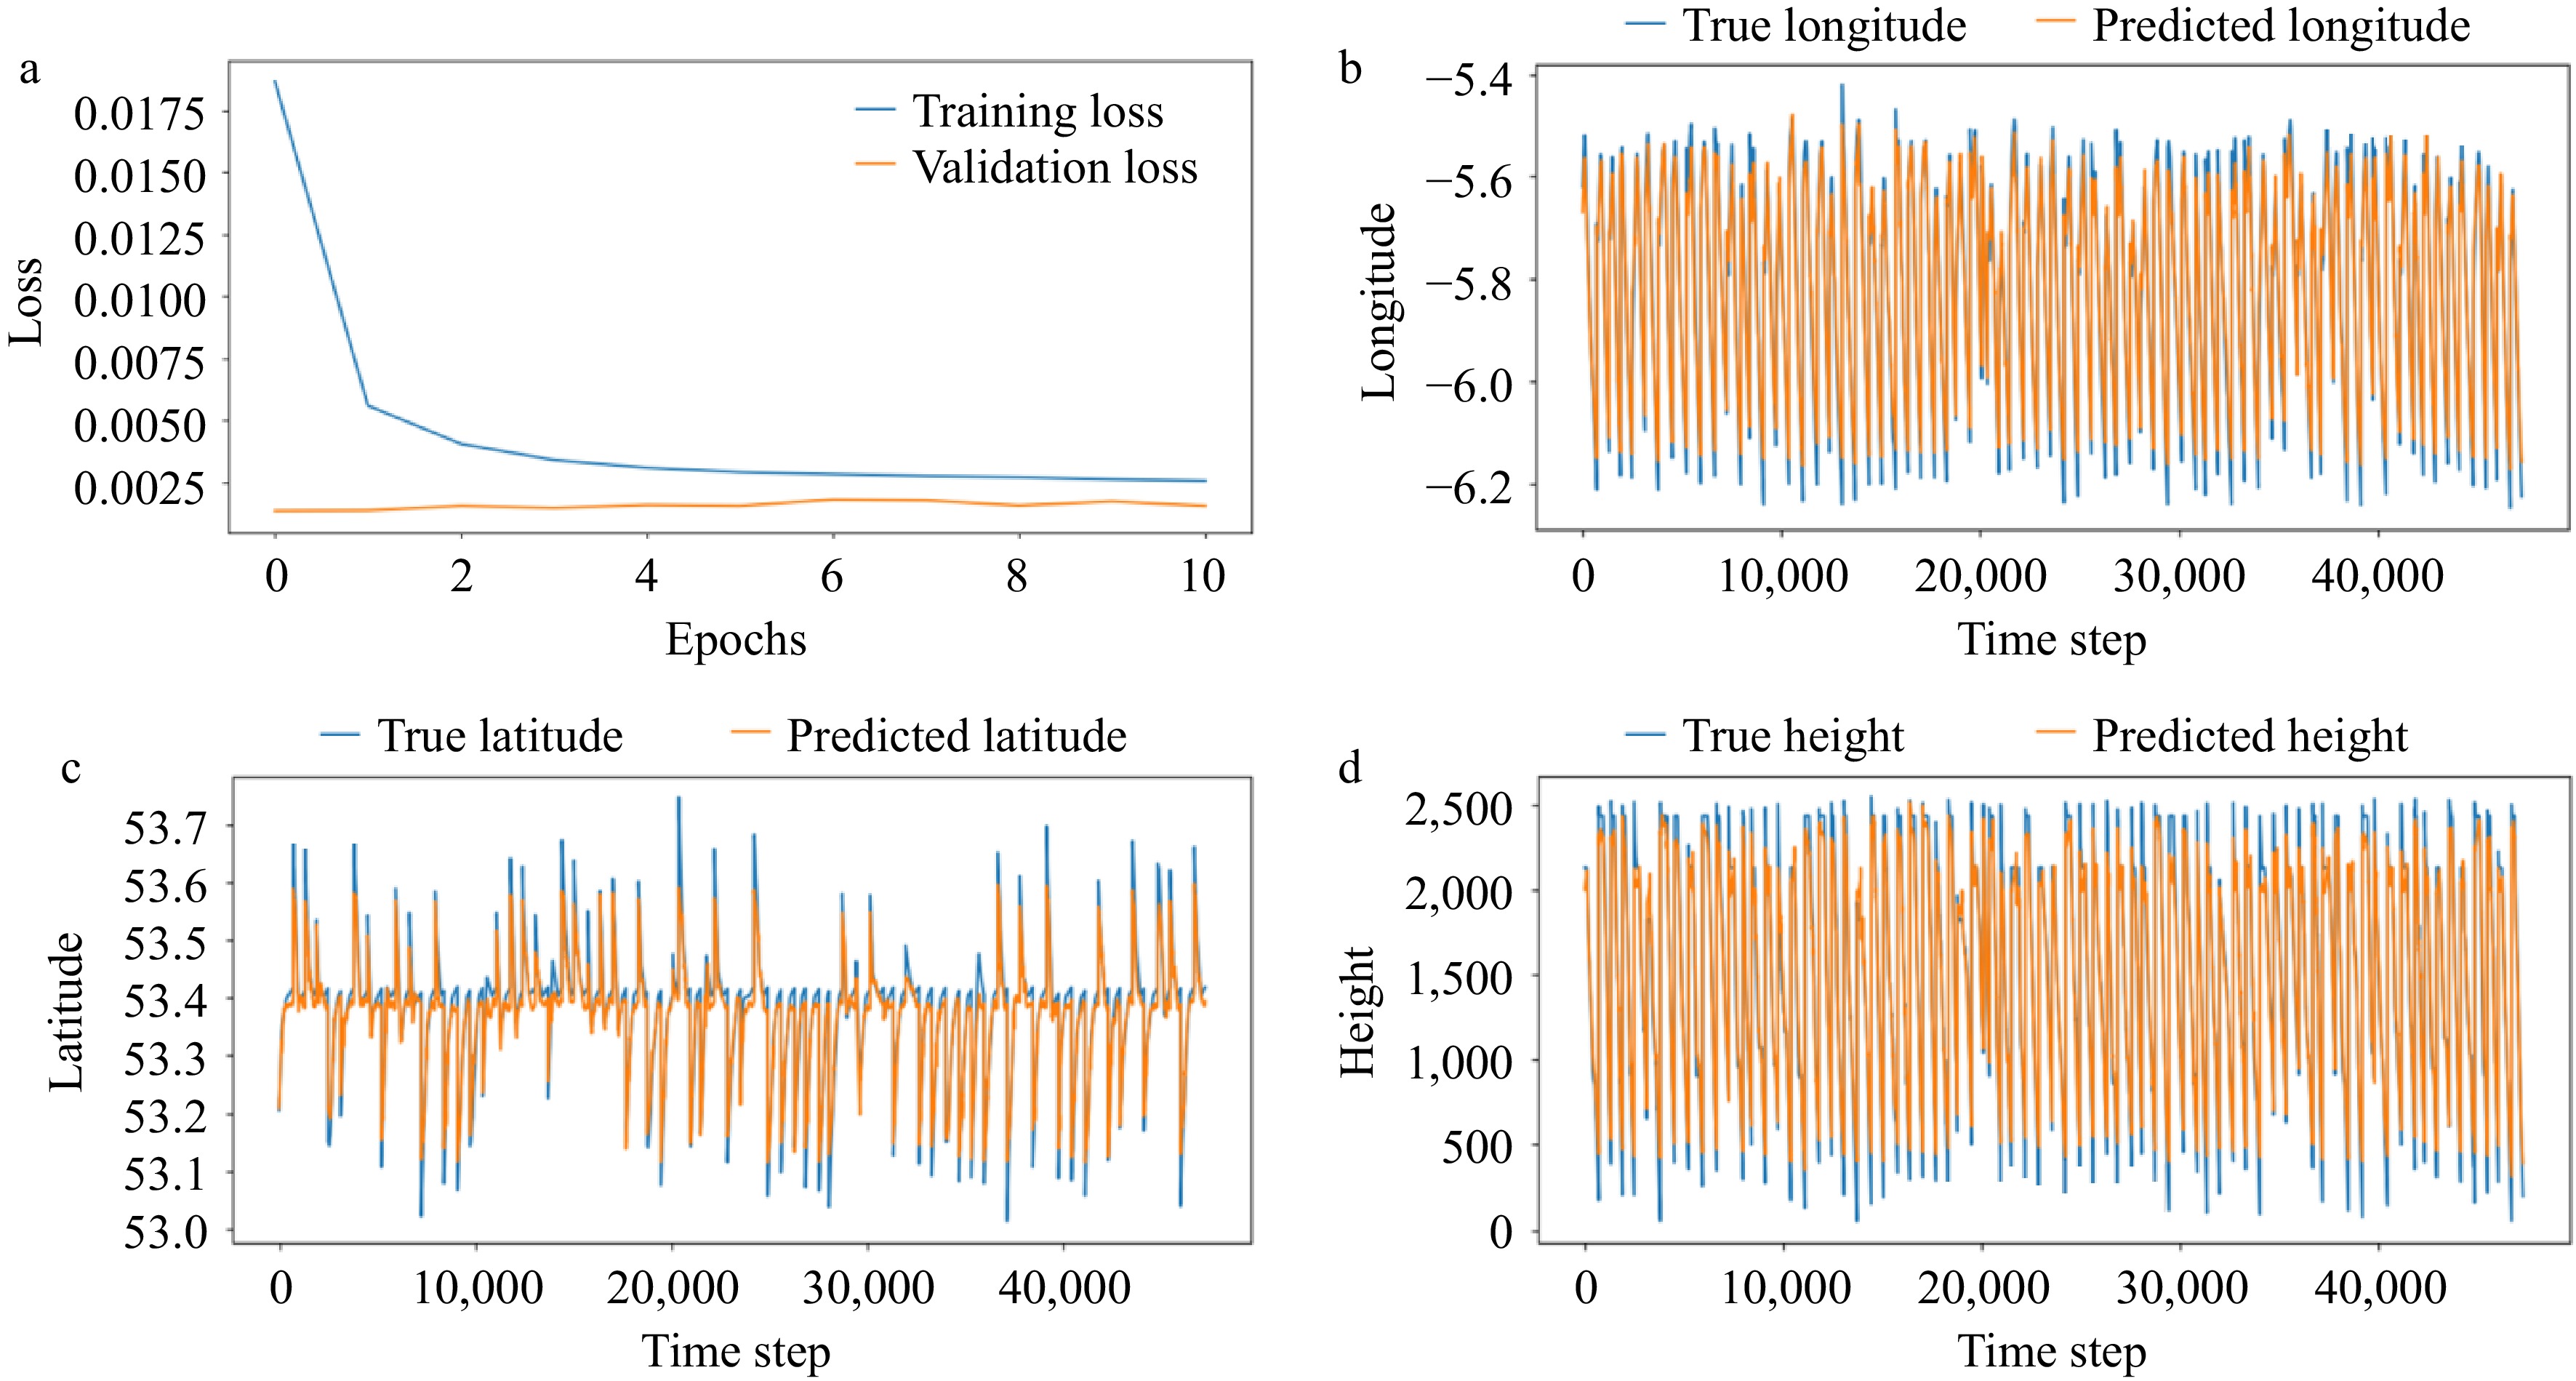
Figure 2.
(a) CNN loss characteristic curve and CNN model prediction of (b) longitude, (c) latitude, and (d) height based on the CNN model.
-
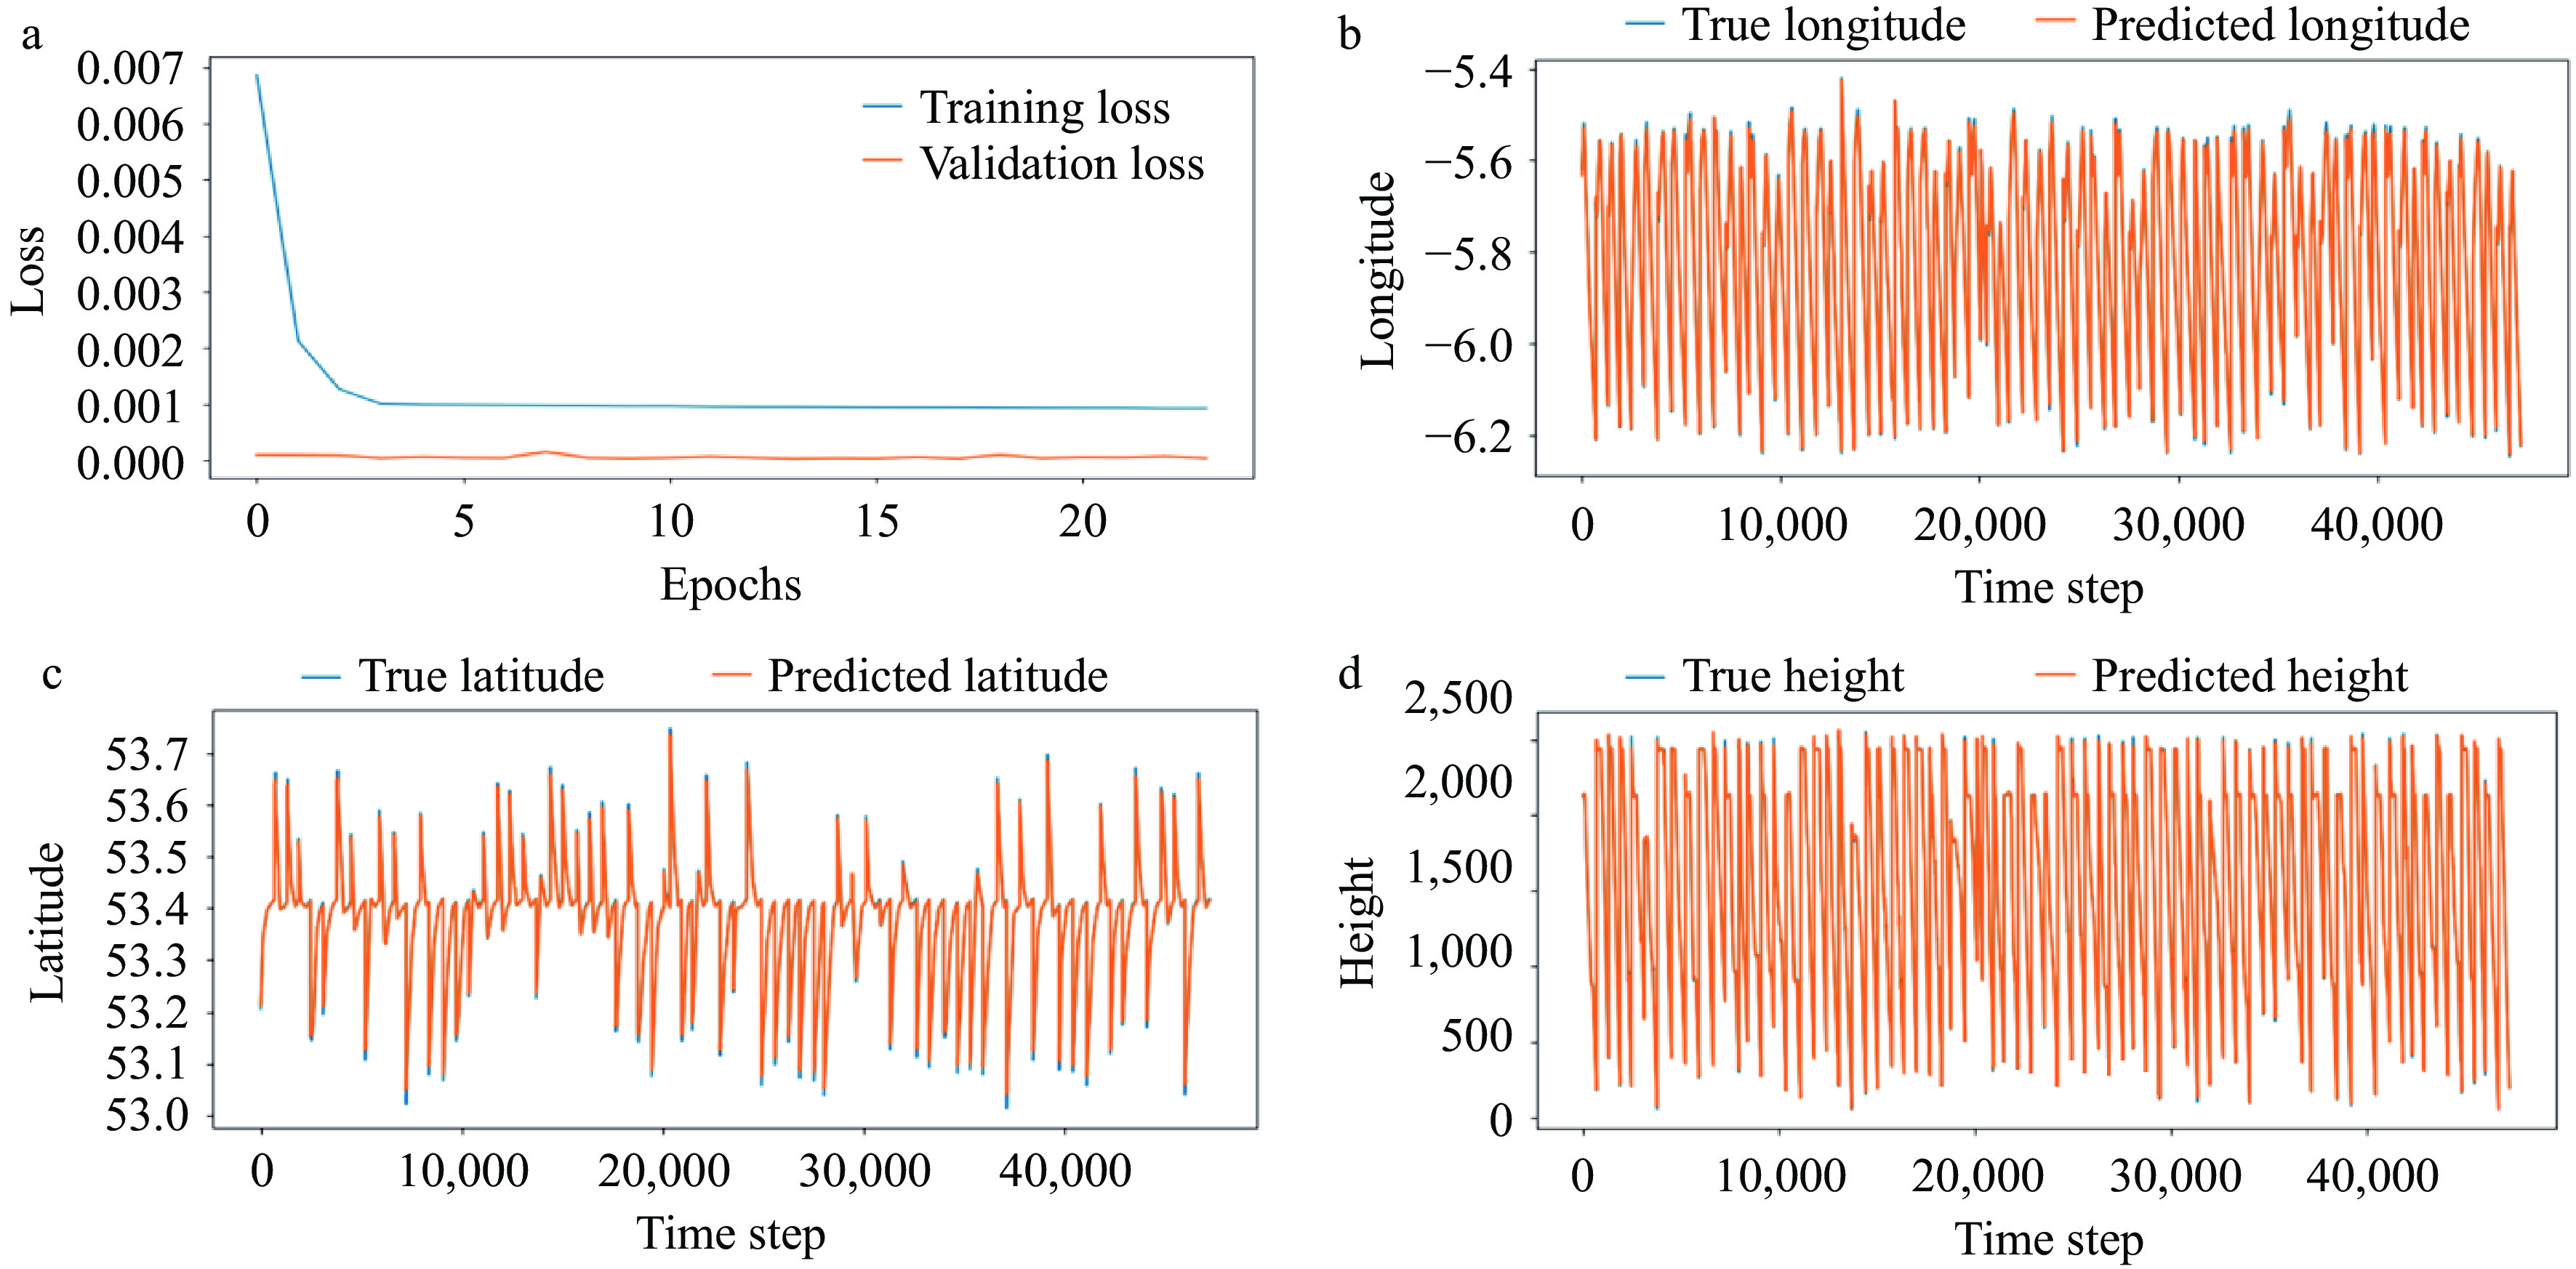
Figure 3.
LSTM loss characteristic curve and prediction of longitude, latitude, and altitude based on the LSTM model. (a) LTSM loss characteristic curve, LTSM model (b) longitude, (c) latitude, and (d) height prediction and actual illustration.
-
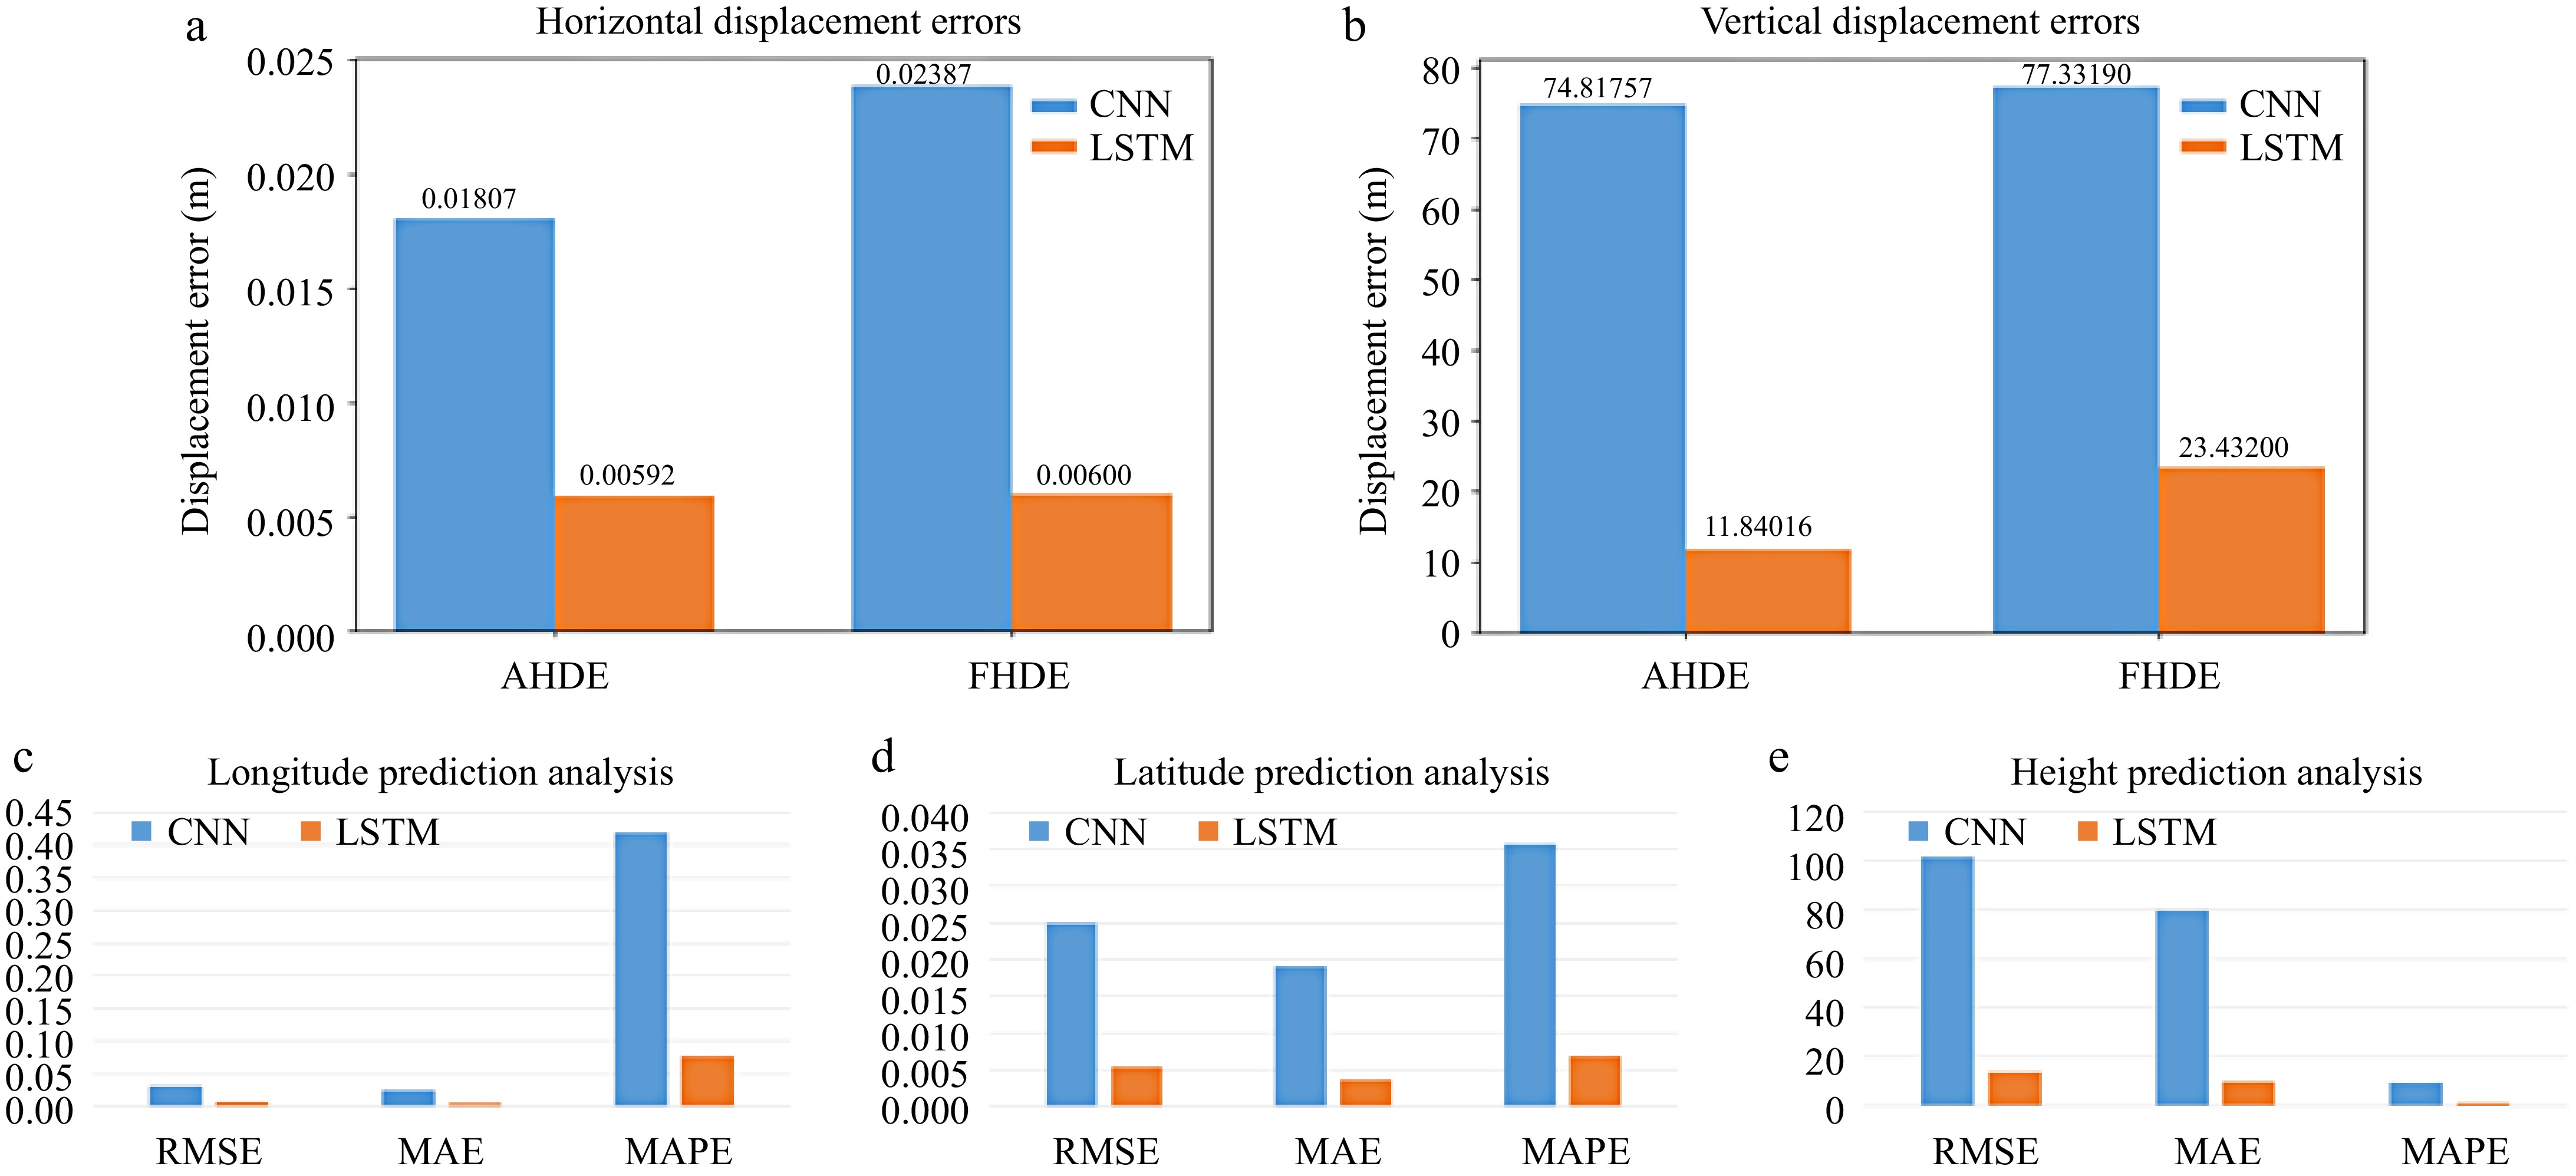
Figure 4.
Comparison of prediction results. Comparison of prediction results in (a) horizontal dimension and (b) vertical dimension between two models. Comparison of (c) longitude prediction results, (d) latitude prediction results, and (e) height prediction results between two models.
-
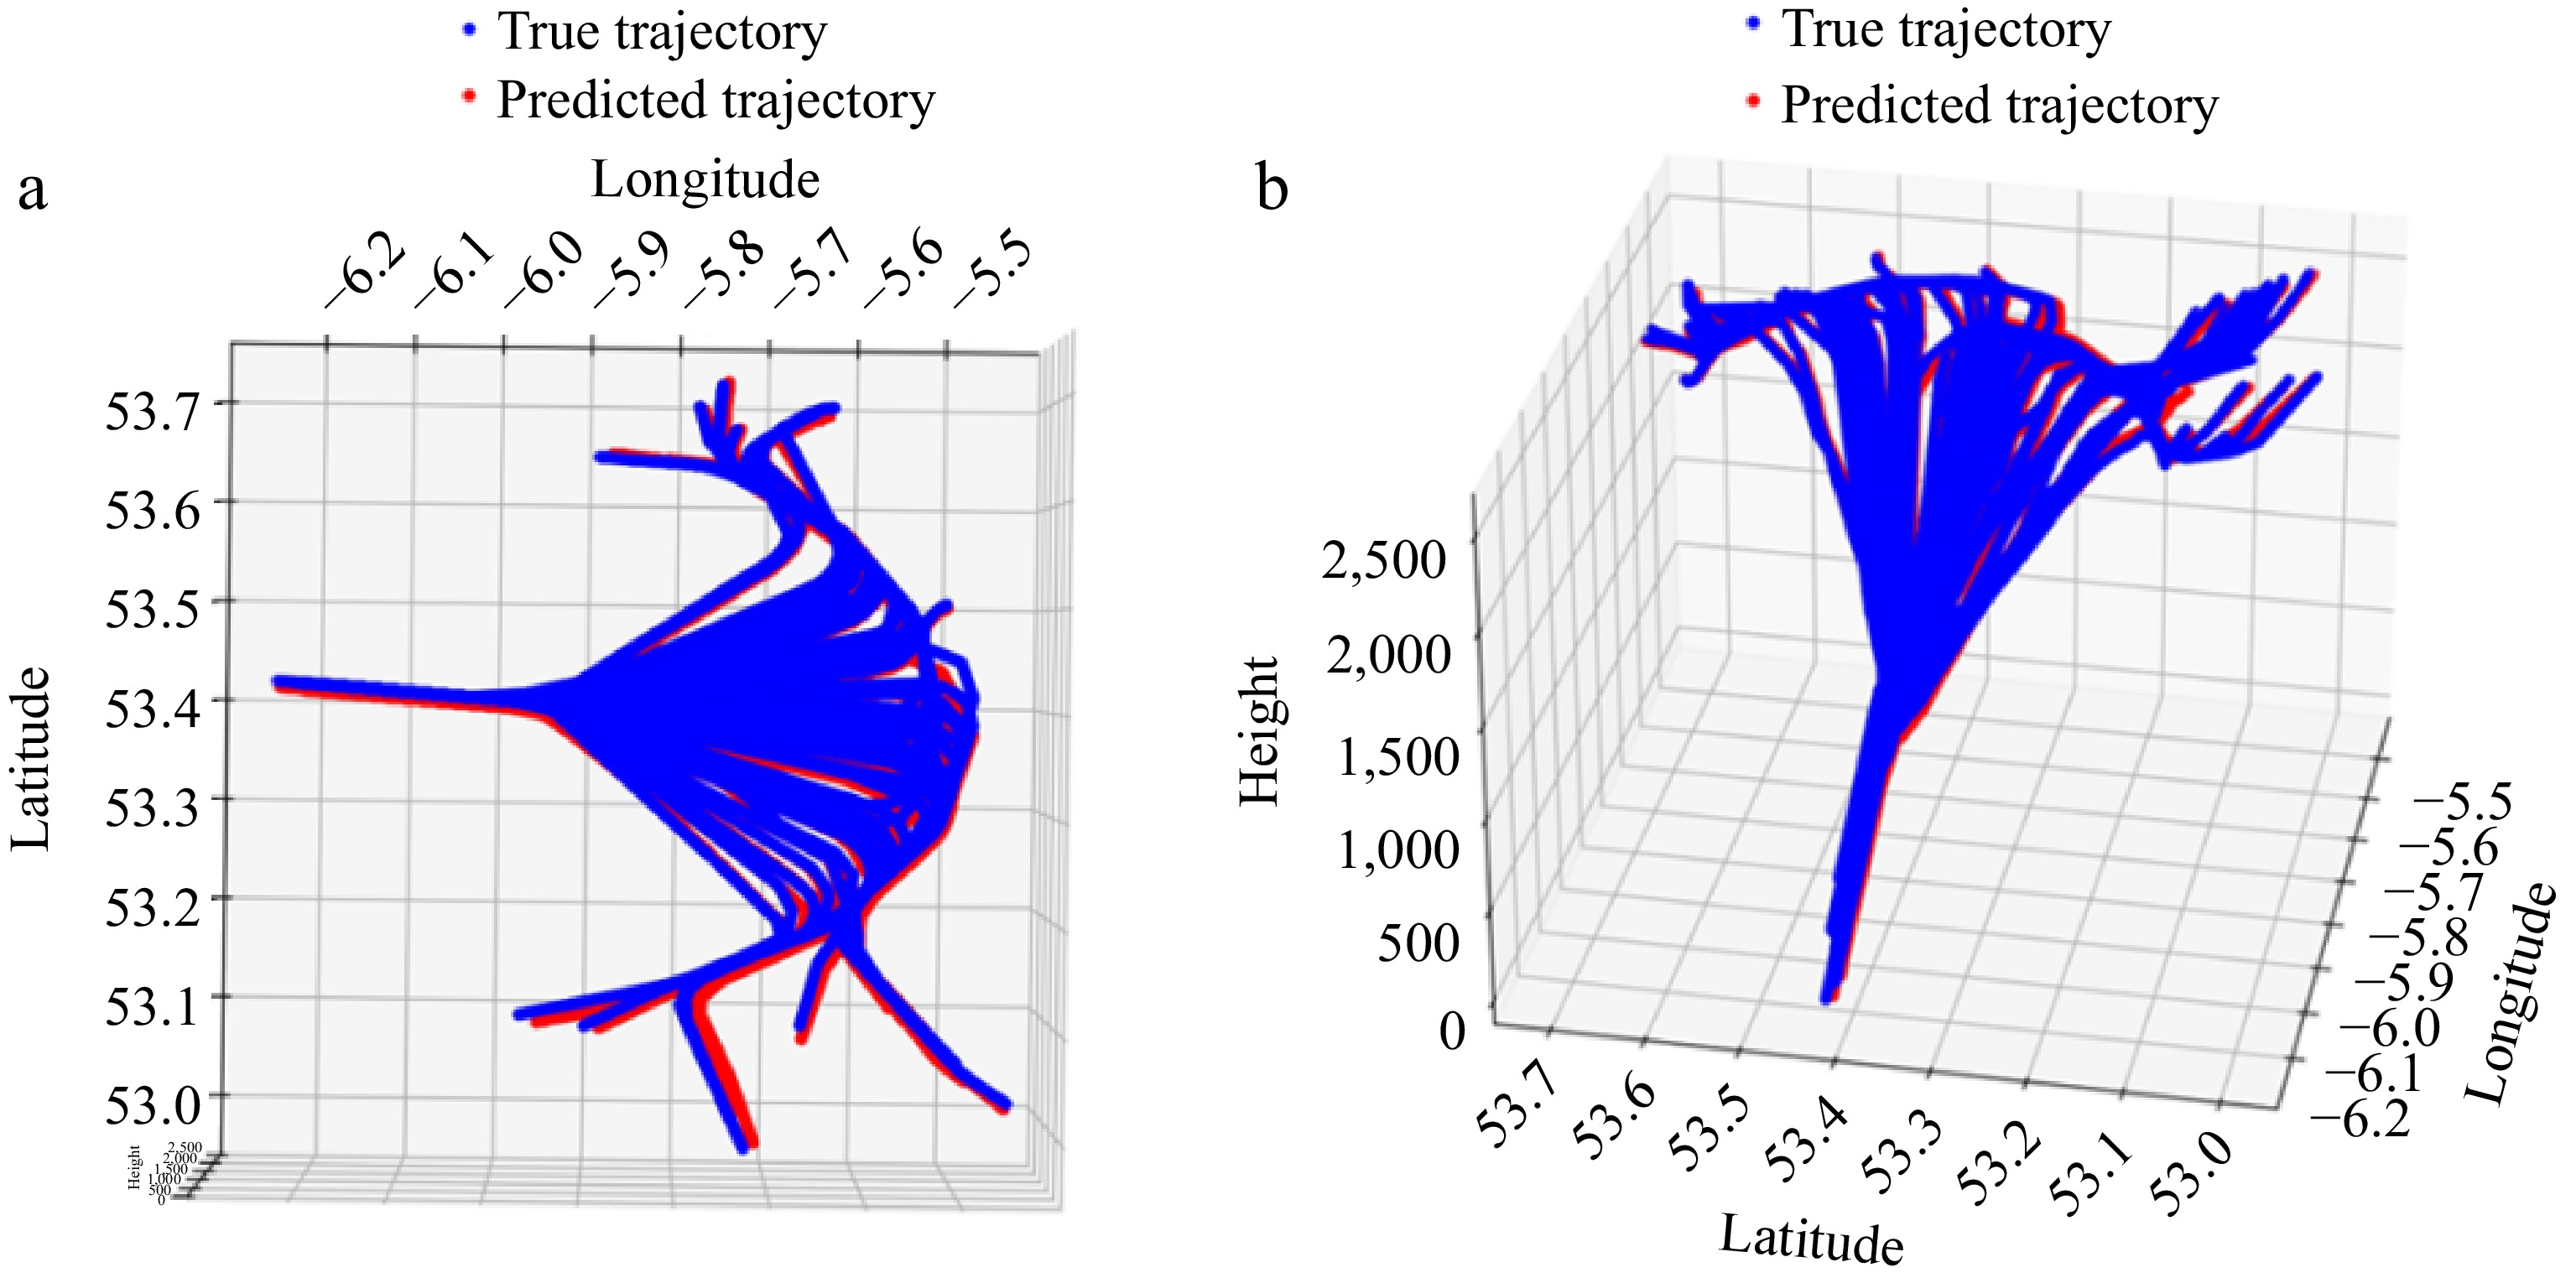
Figure 5.
(a) 2D and (b) 3D illustration of the LSTM model.
-
Parameter RMSE MAE MAPE Time (s) 992,962.736 775,551.055 0.047201227% Longitude (°) 0.030995 0.024325 0.418996169% Latitude (°) 0.024935 0.01907 0.035712202% Height (m) 101.389603 79.924794 9.16003619% Table 1.
CNN model prediction results.
-
Parameter RMSE MAE MAPE Time (s) 112,827.282 83,942.09 0.005117341% Longitude (°) 0.005845 0.004404 0.076845338% Latitude (°) 0.00528 0.003657 0.006856182% Height (m) 13.617229 9.746936 0.815694762% Table 2.
LSTM model prediction results.
Figures
(5)
Tables
(2)