-
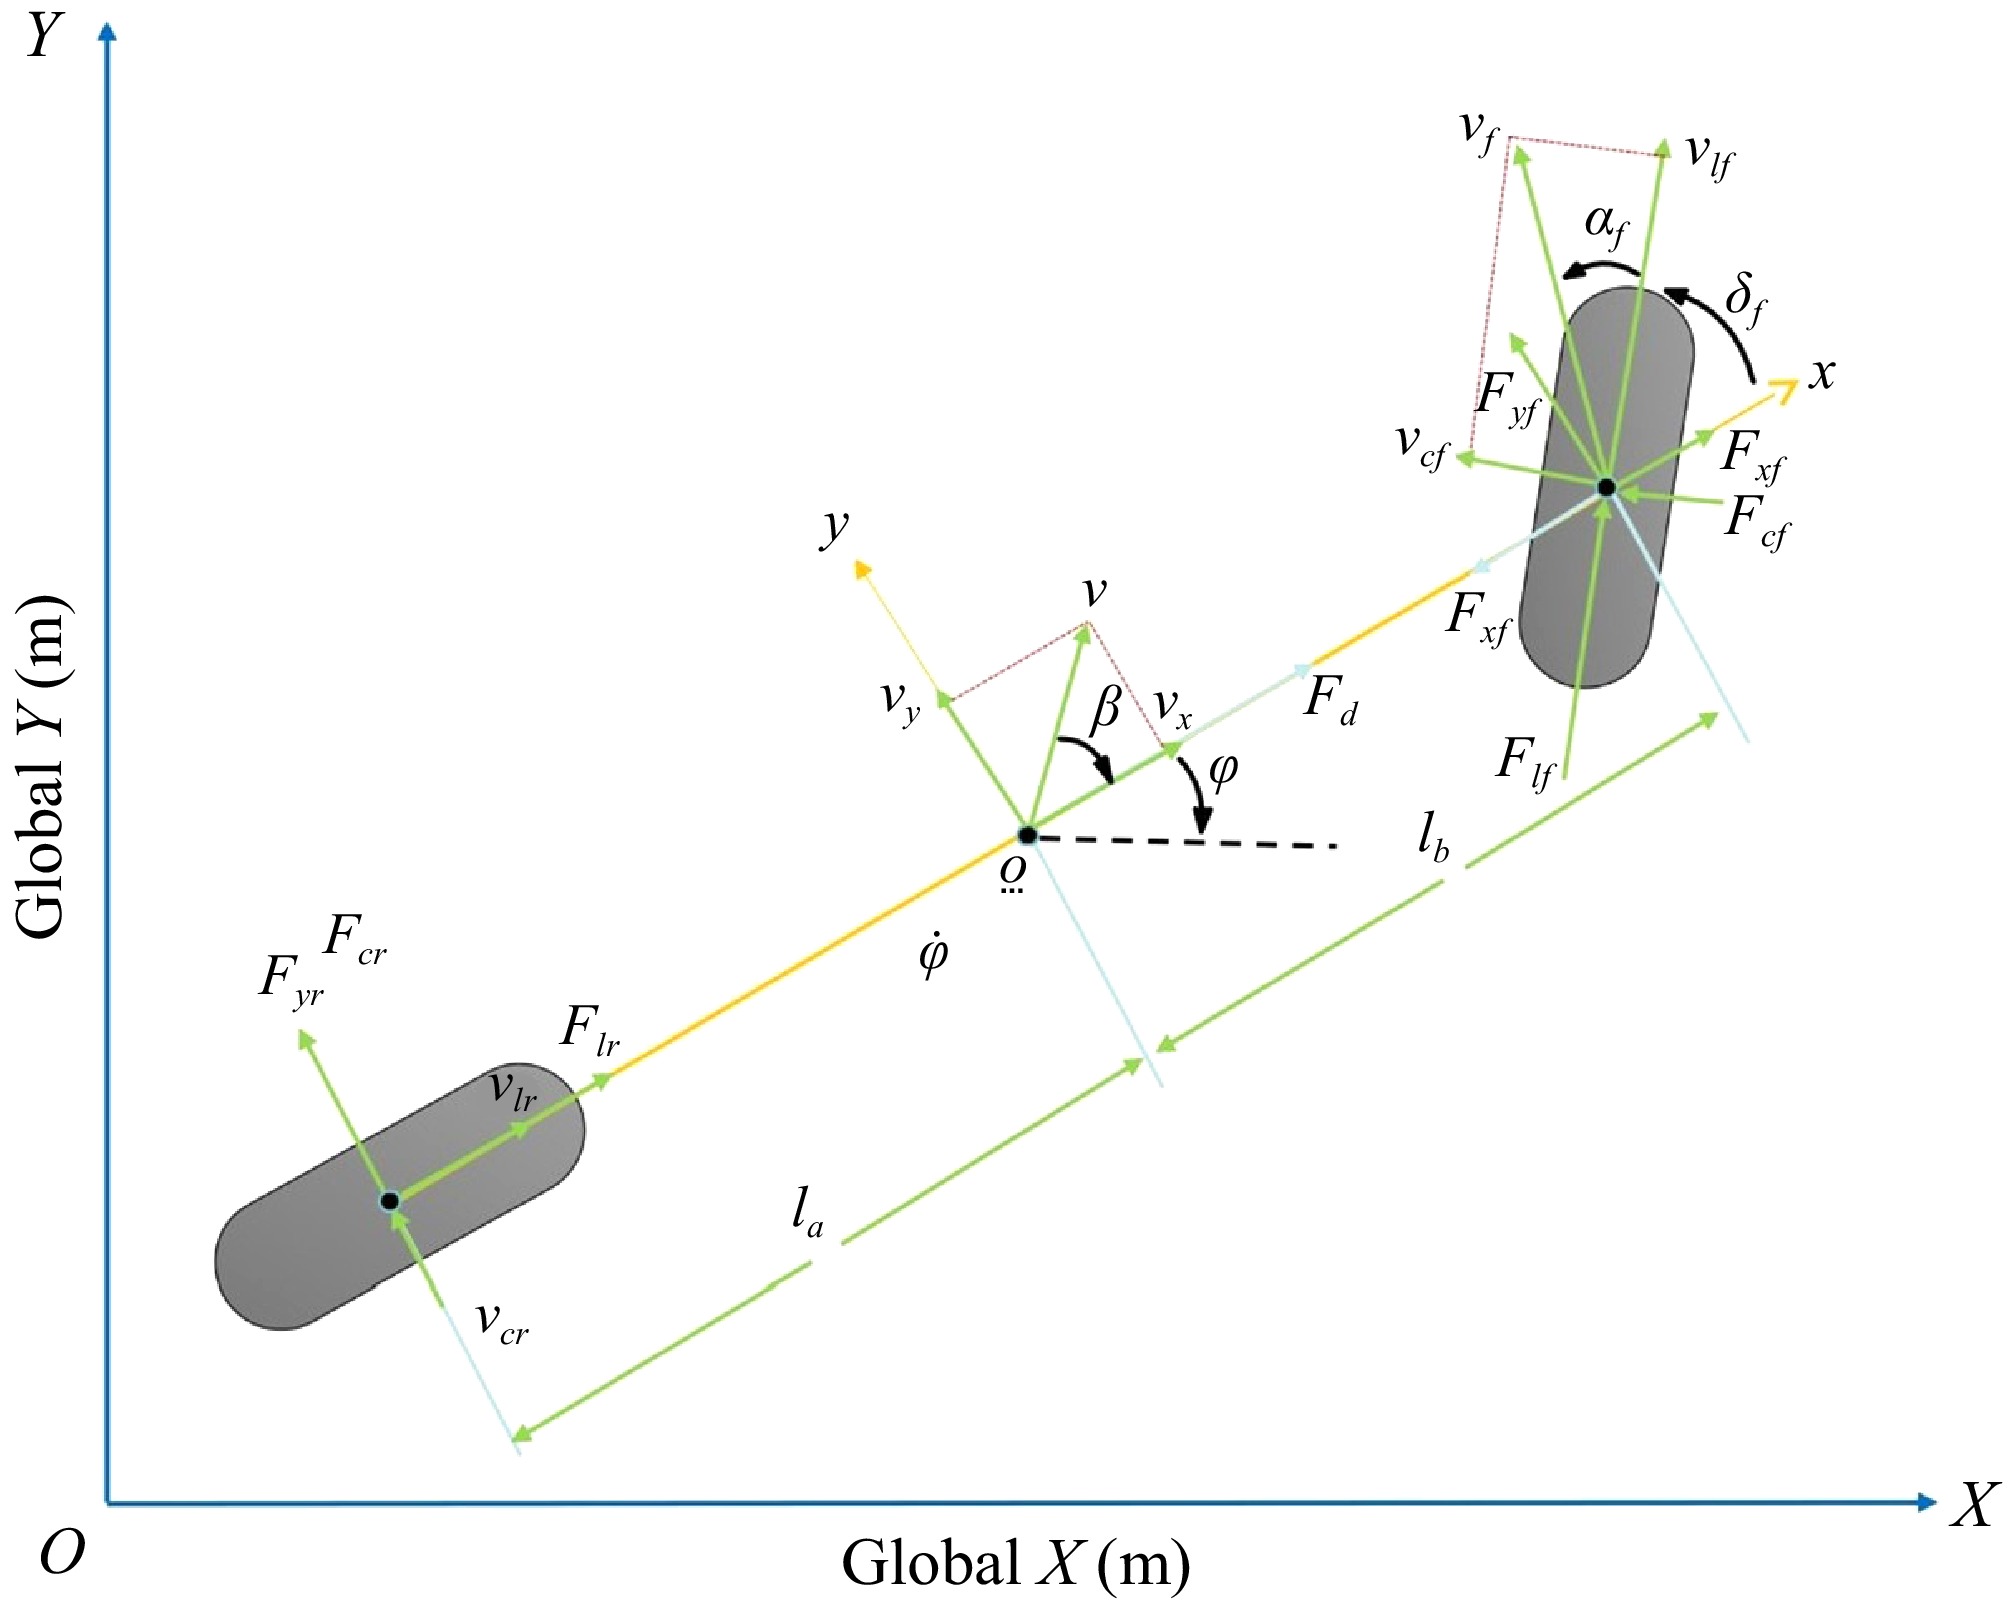
Figure 1.
Vehicle dynamics model.
-
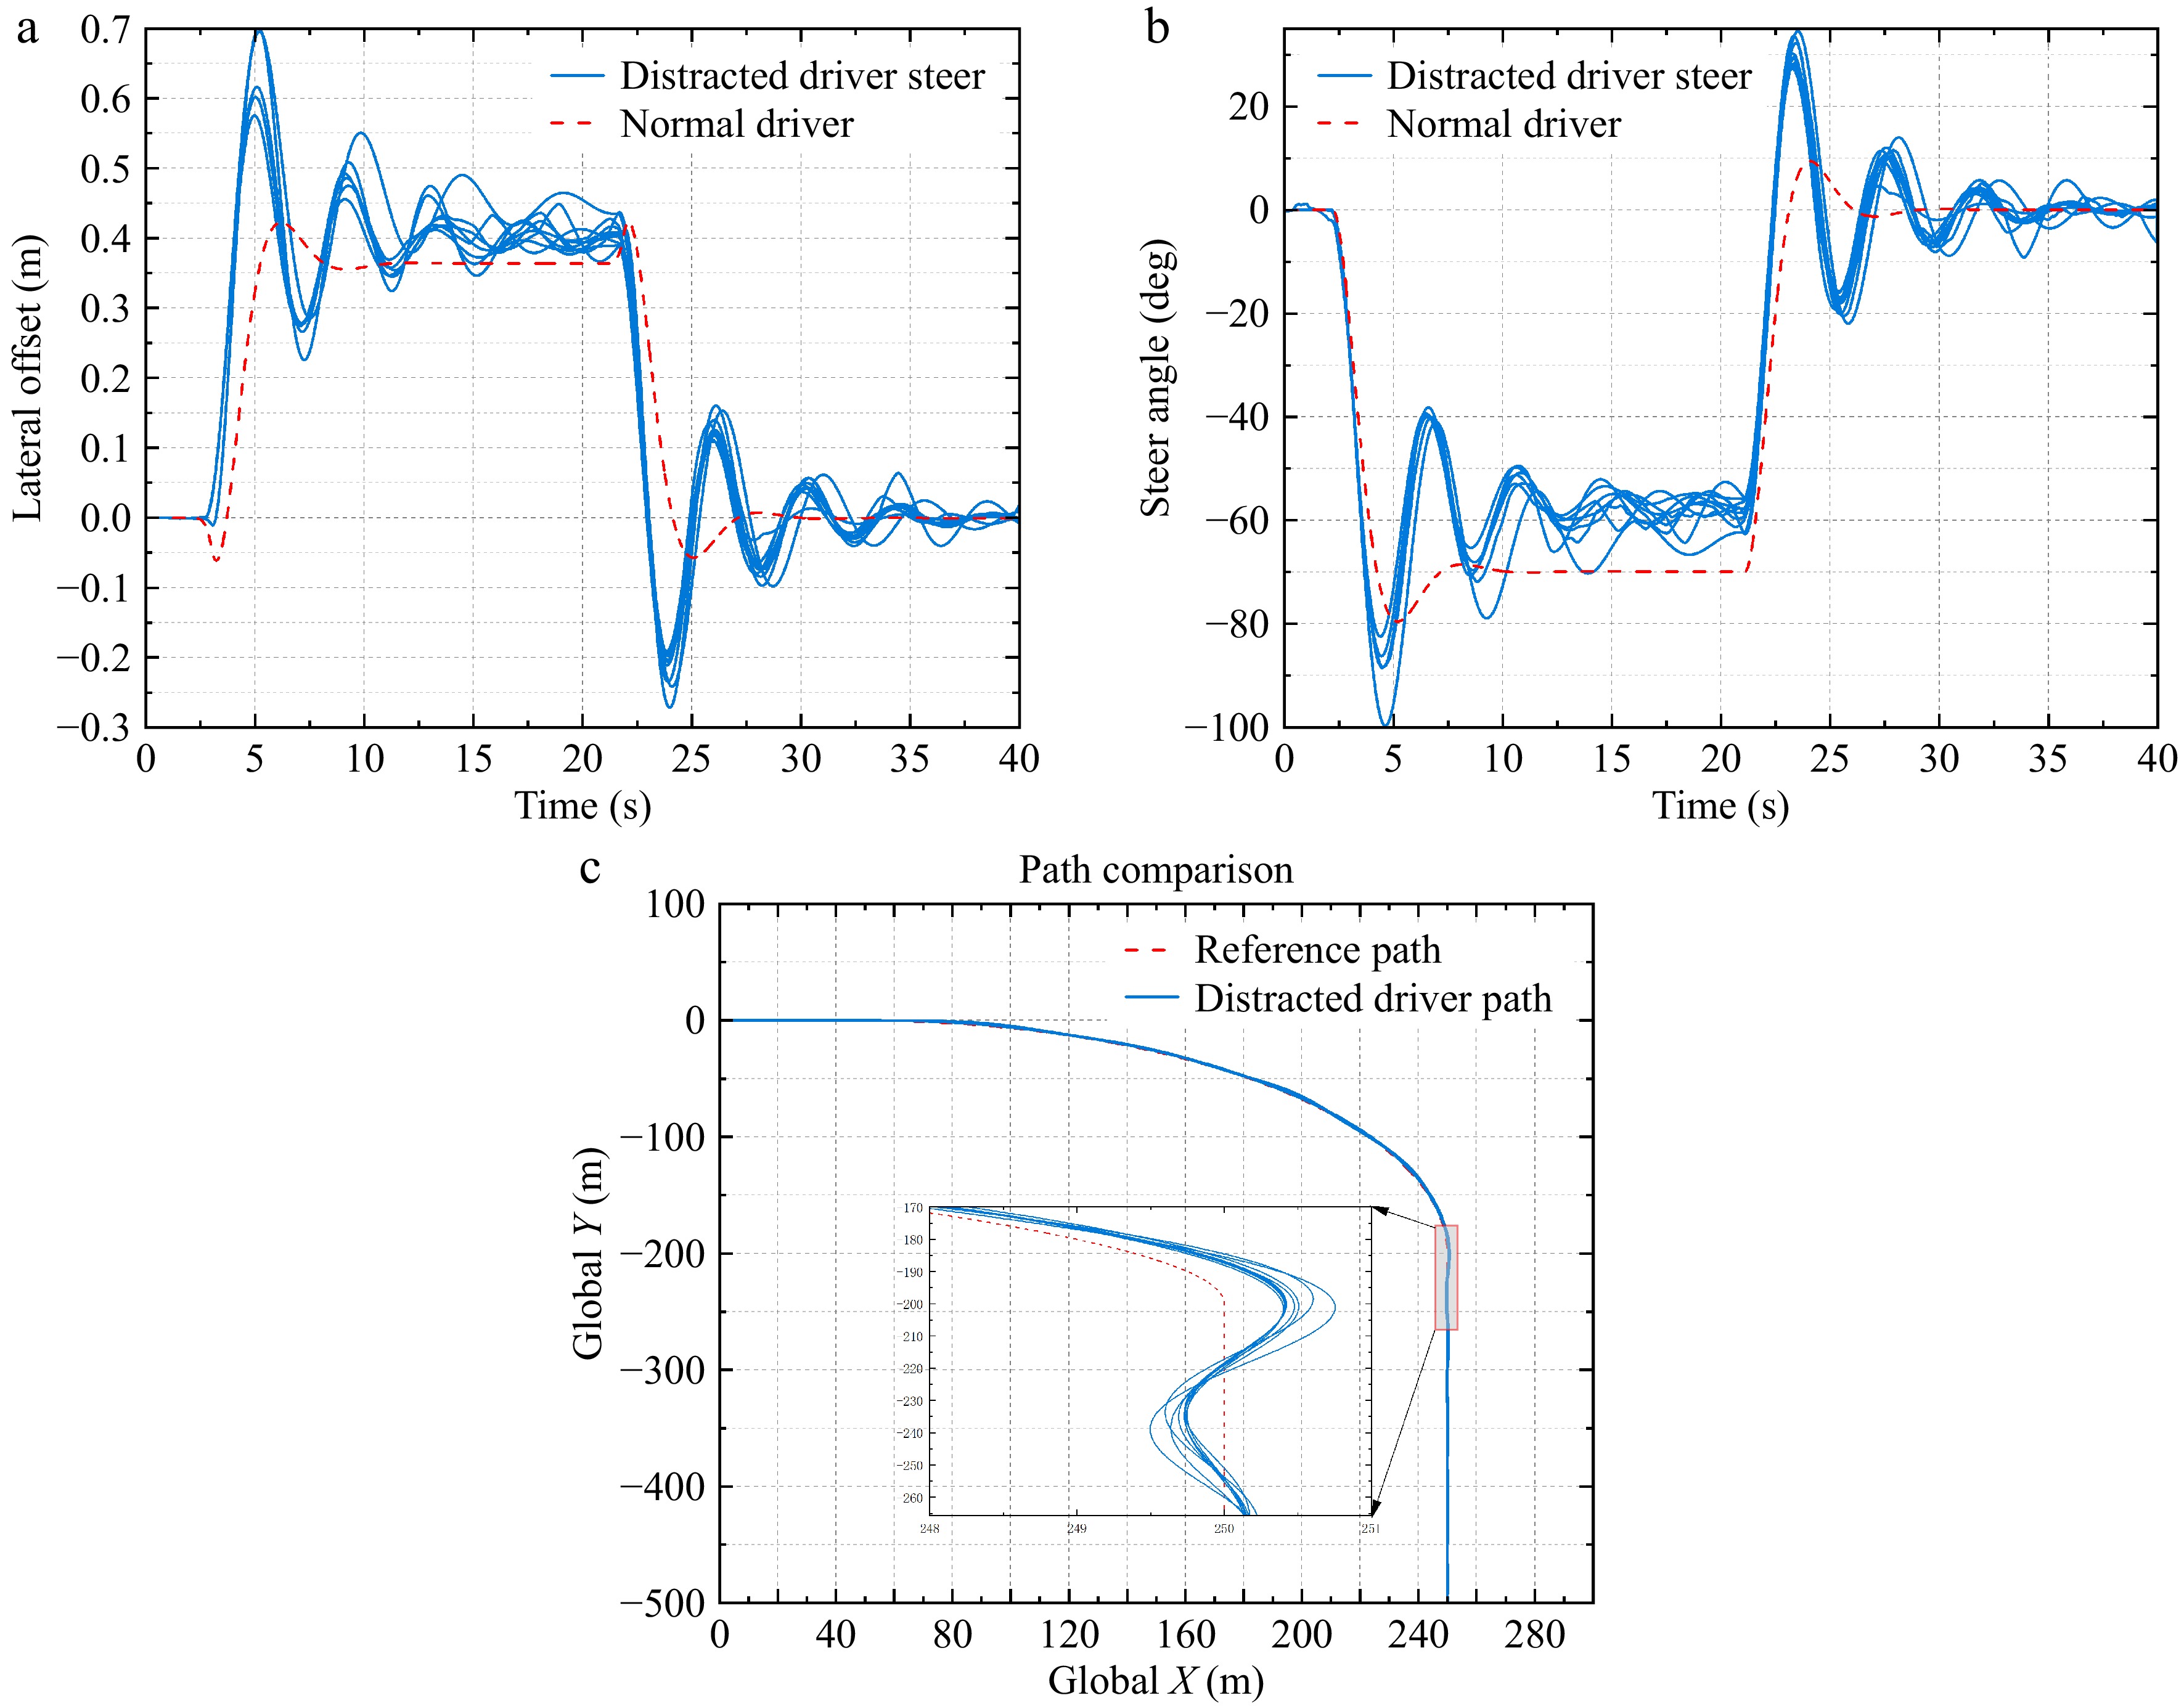
Figure 2.
Driving performance of distracted drivers.
-
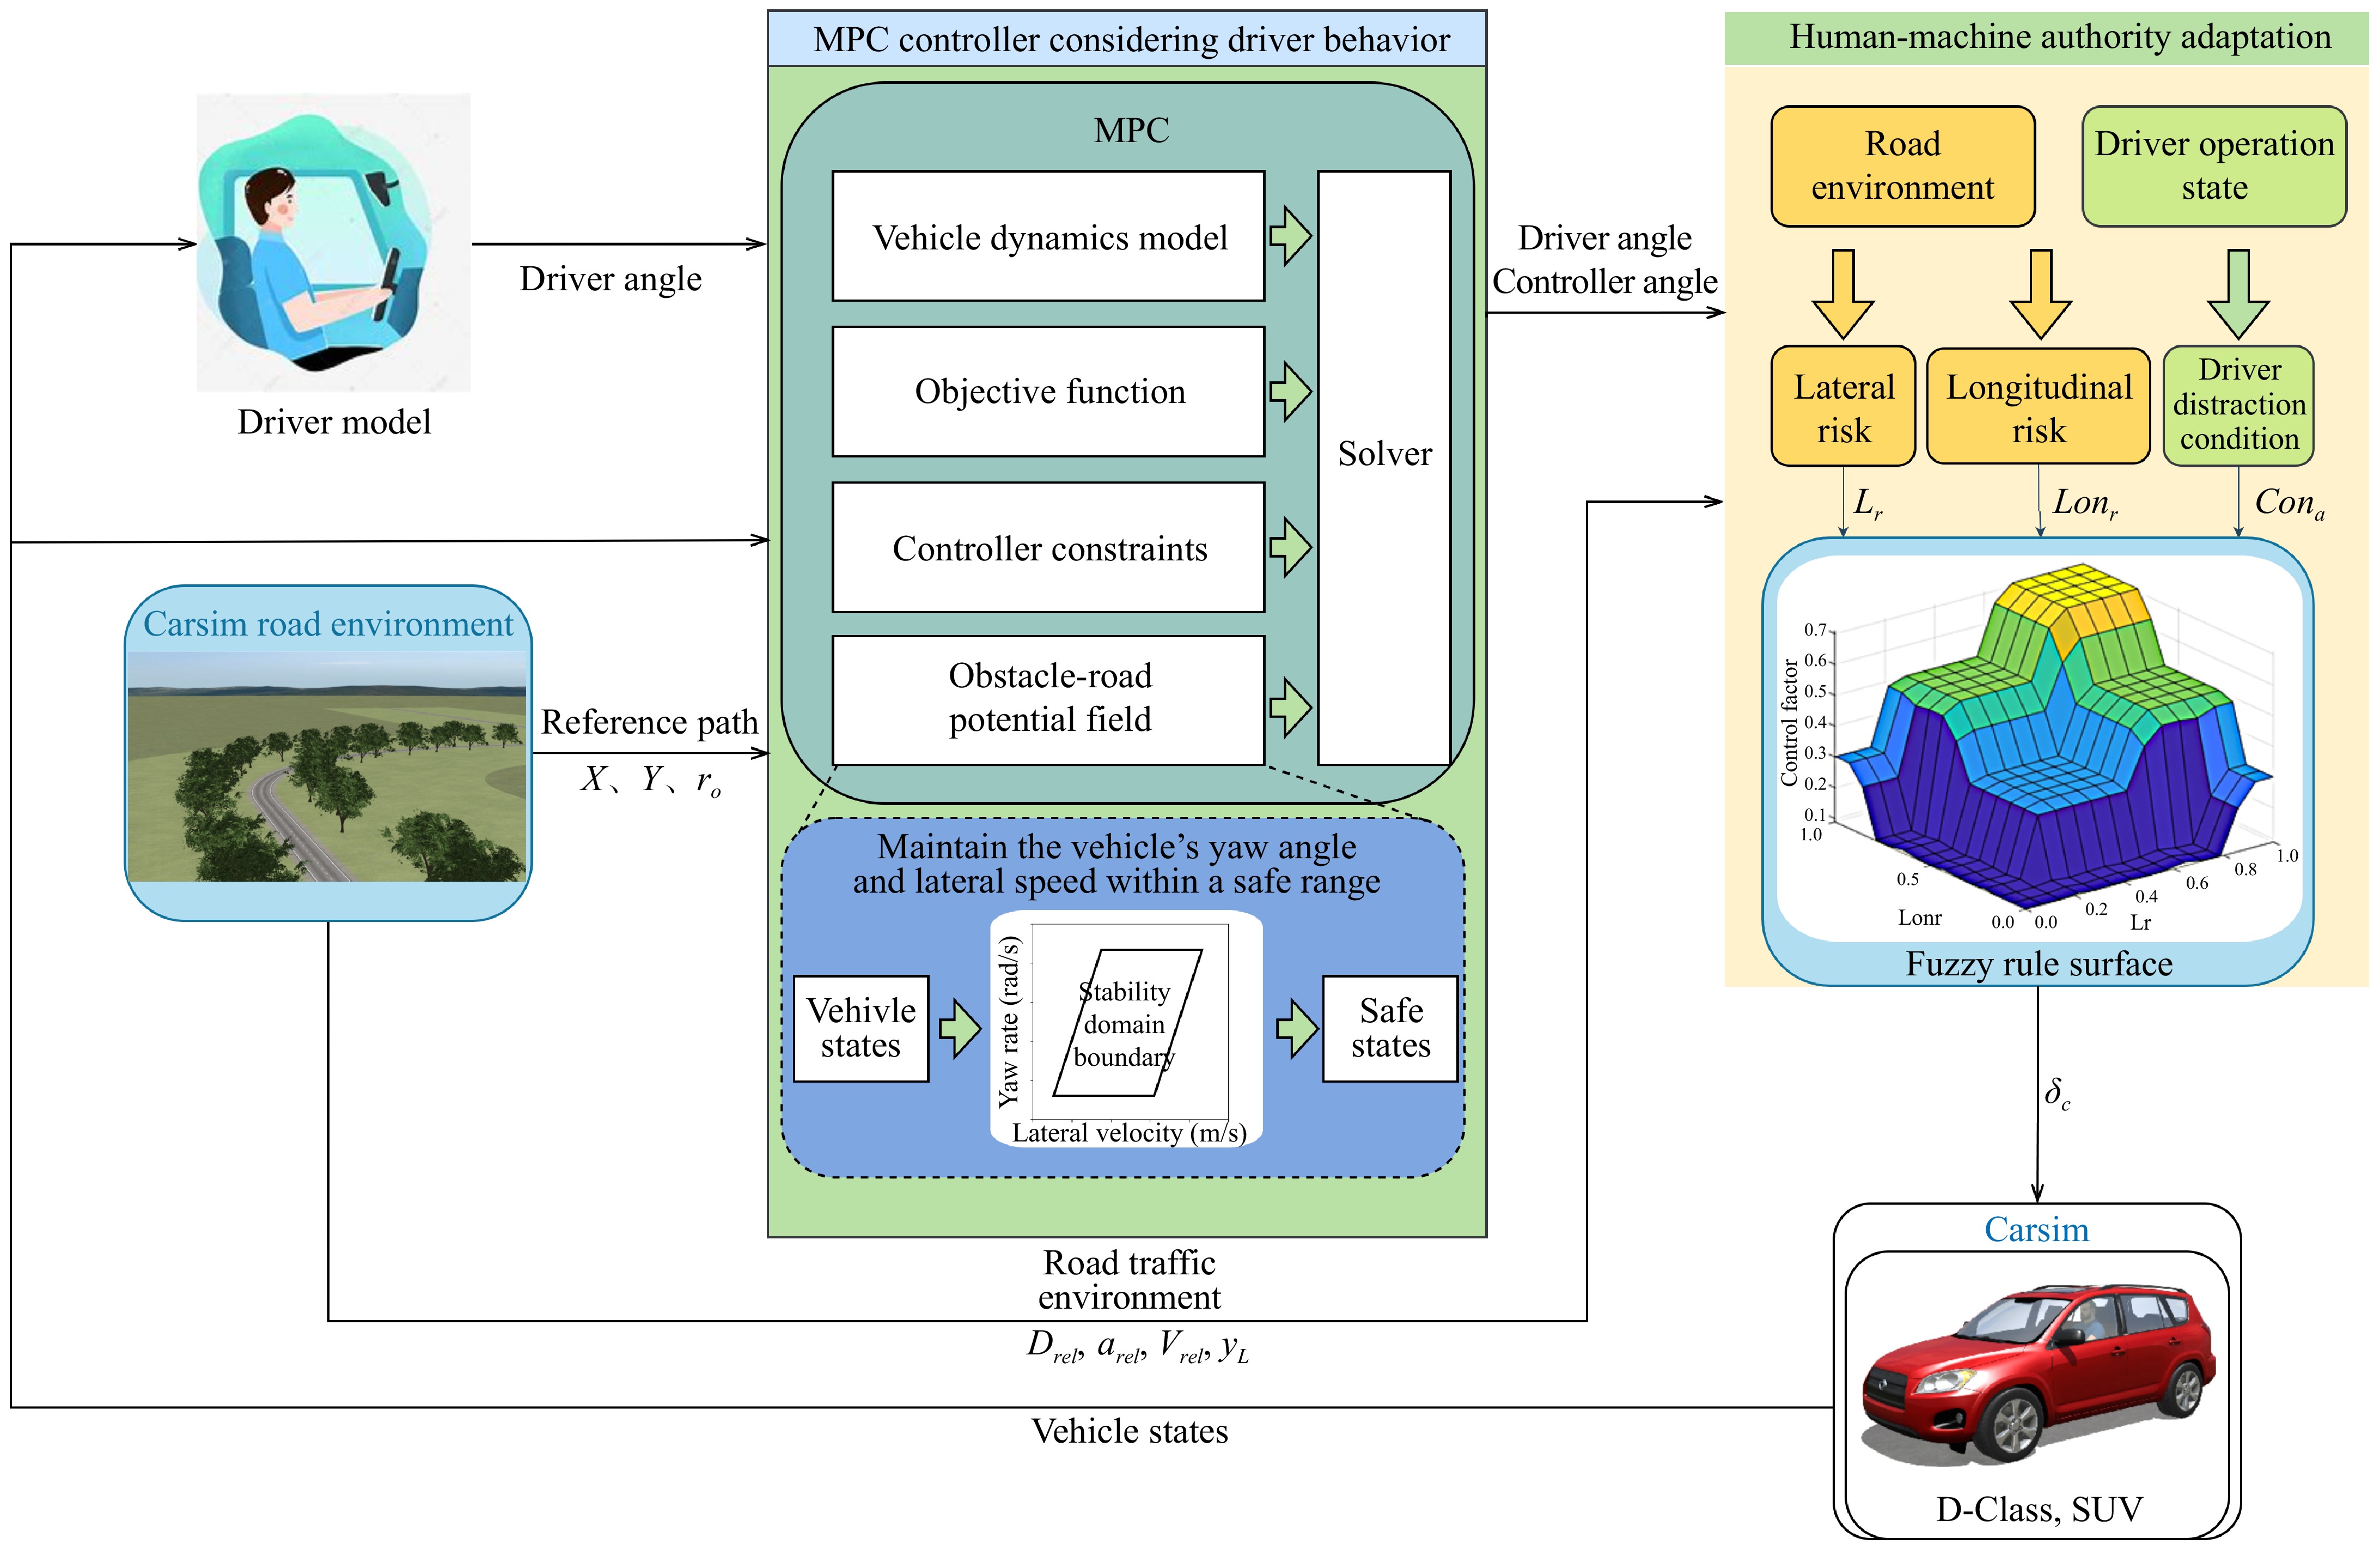
Figure 3.
The framework of a proposed shared control system.
-
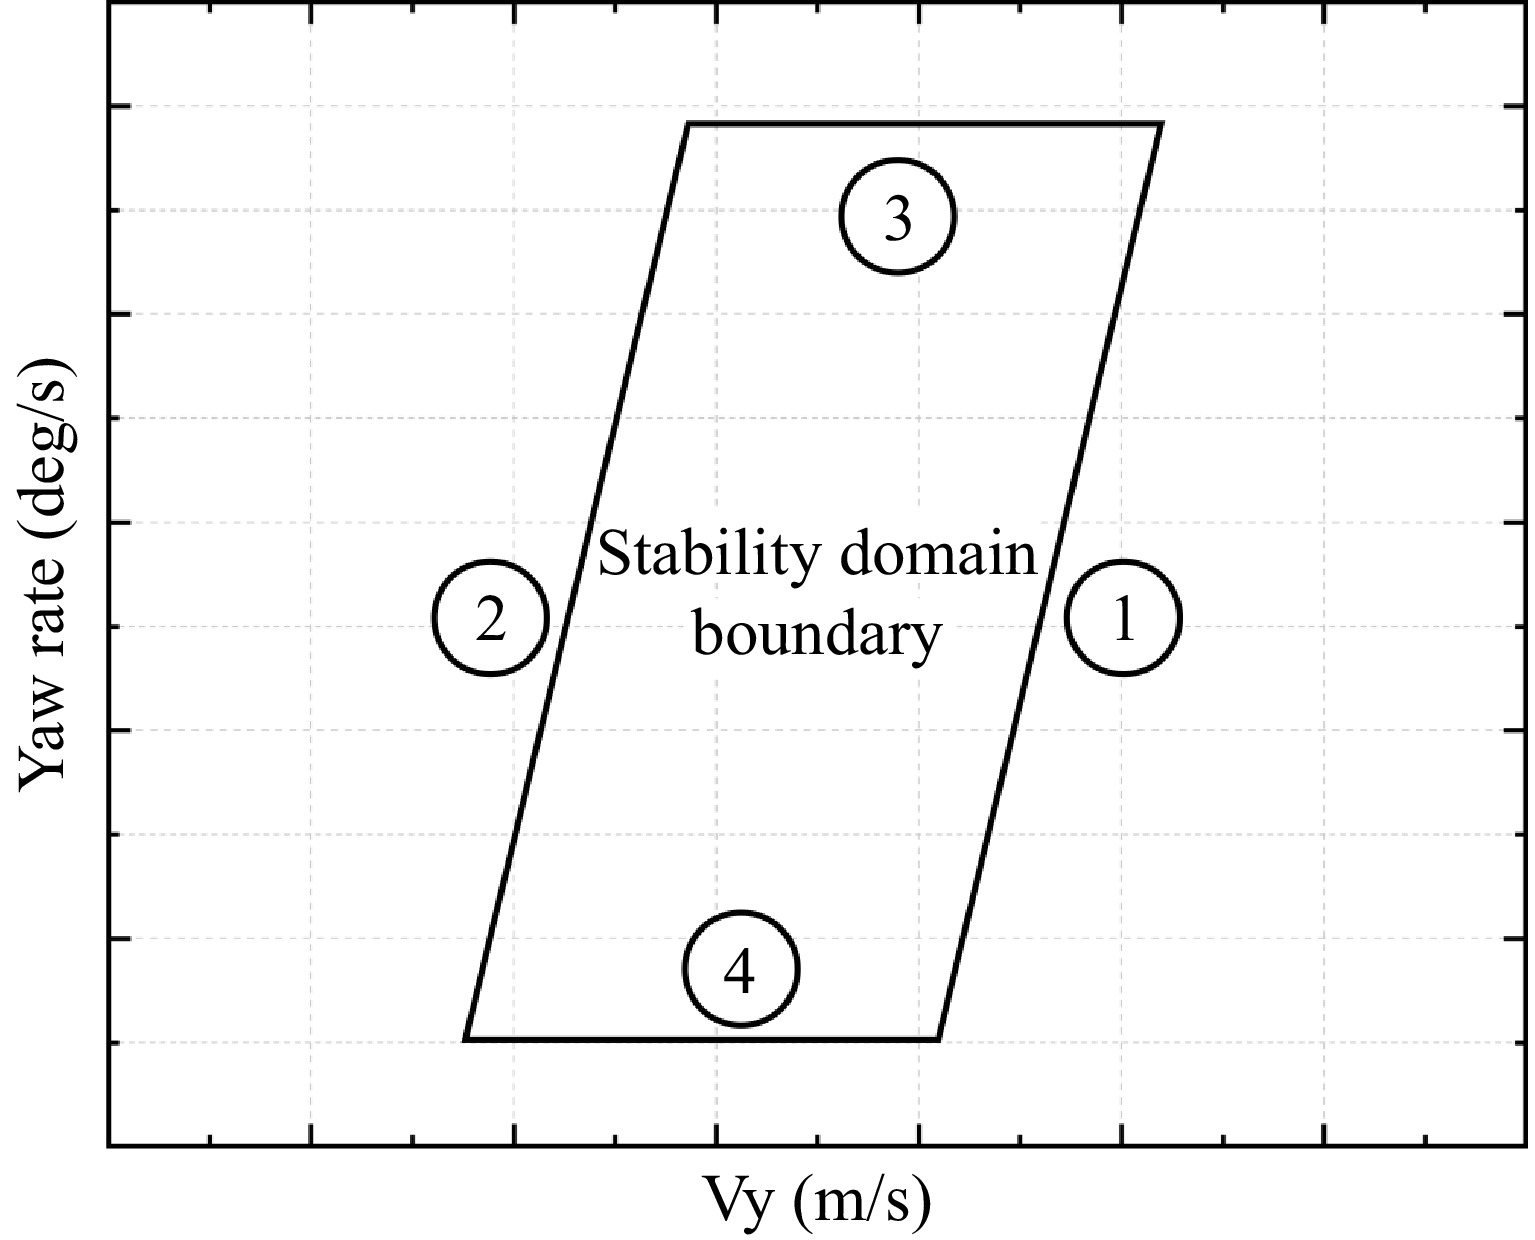
Figure 4.
Stable envelope constraints.
-
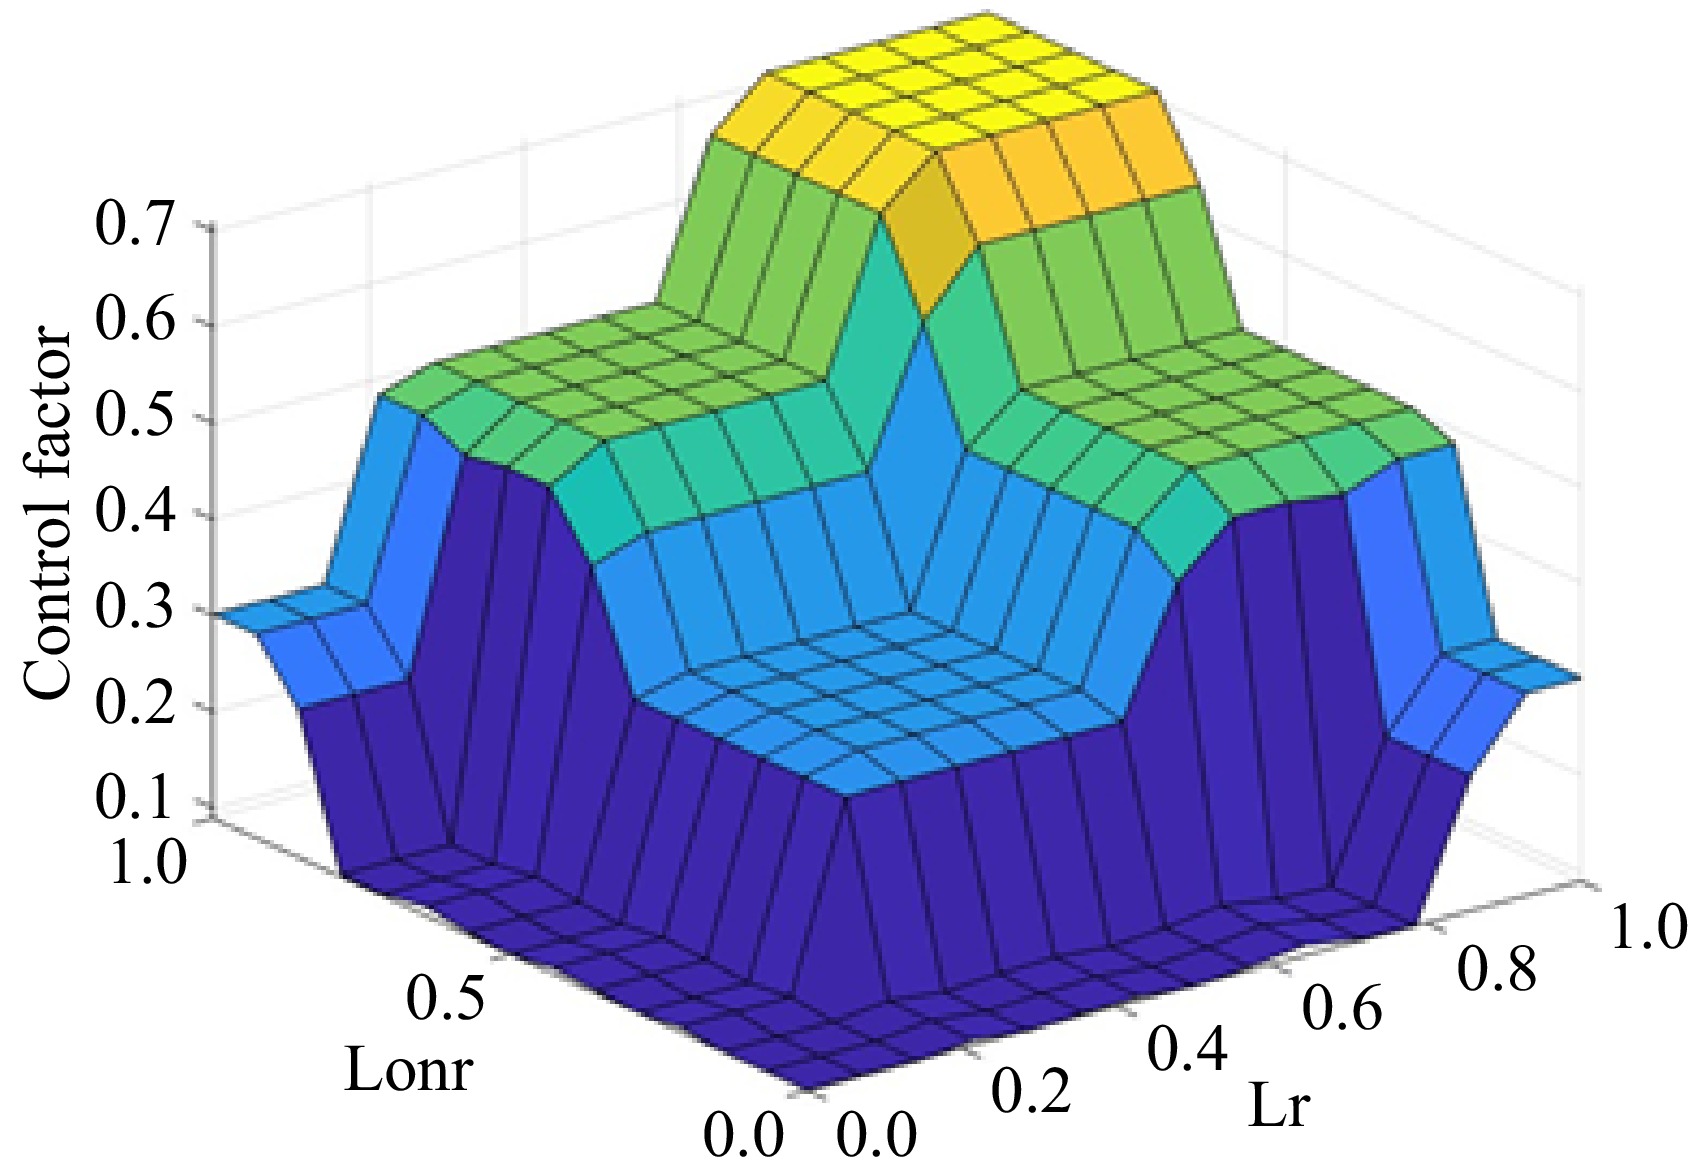
Figure 5.
Fuzzy surfaces of fuzzy rules.
-
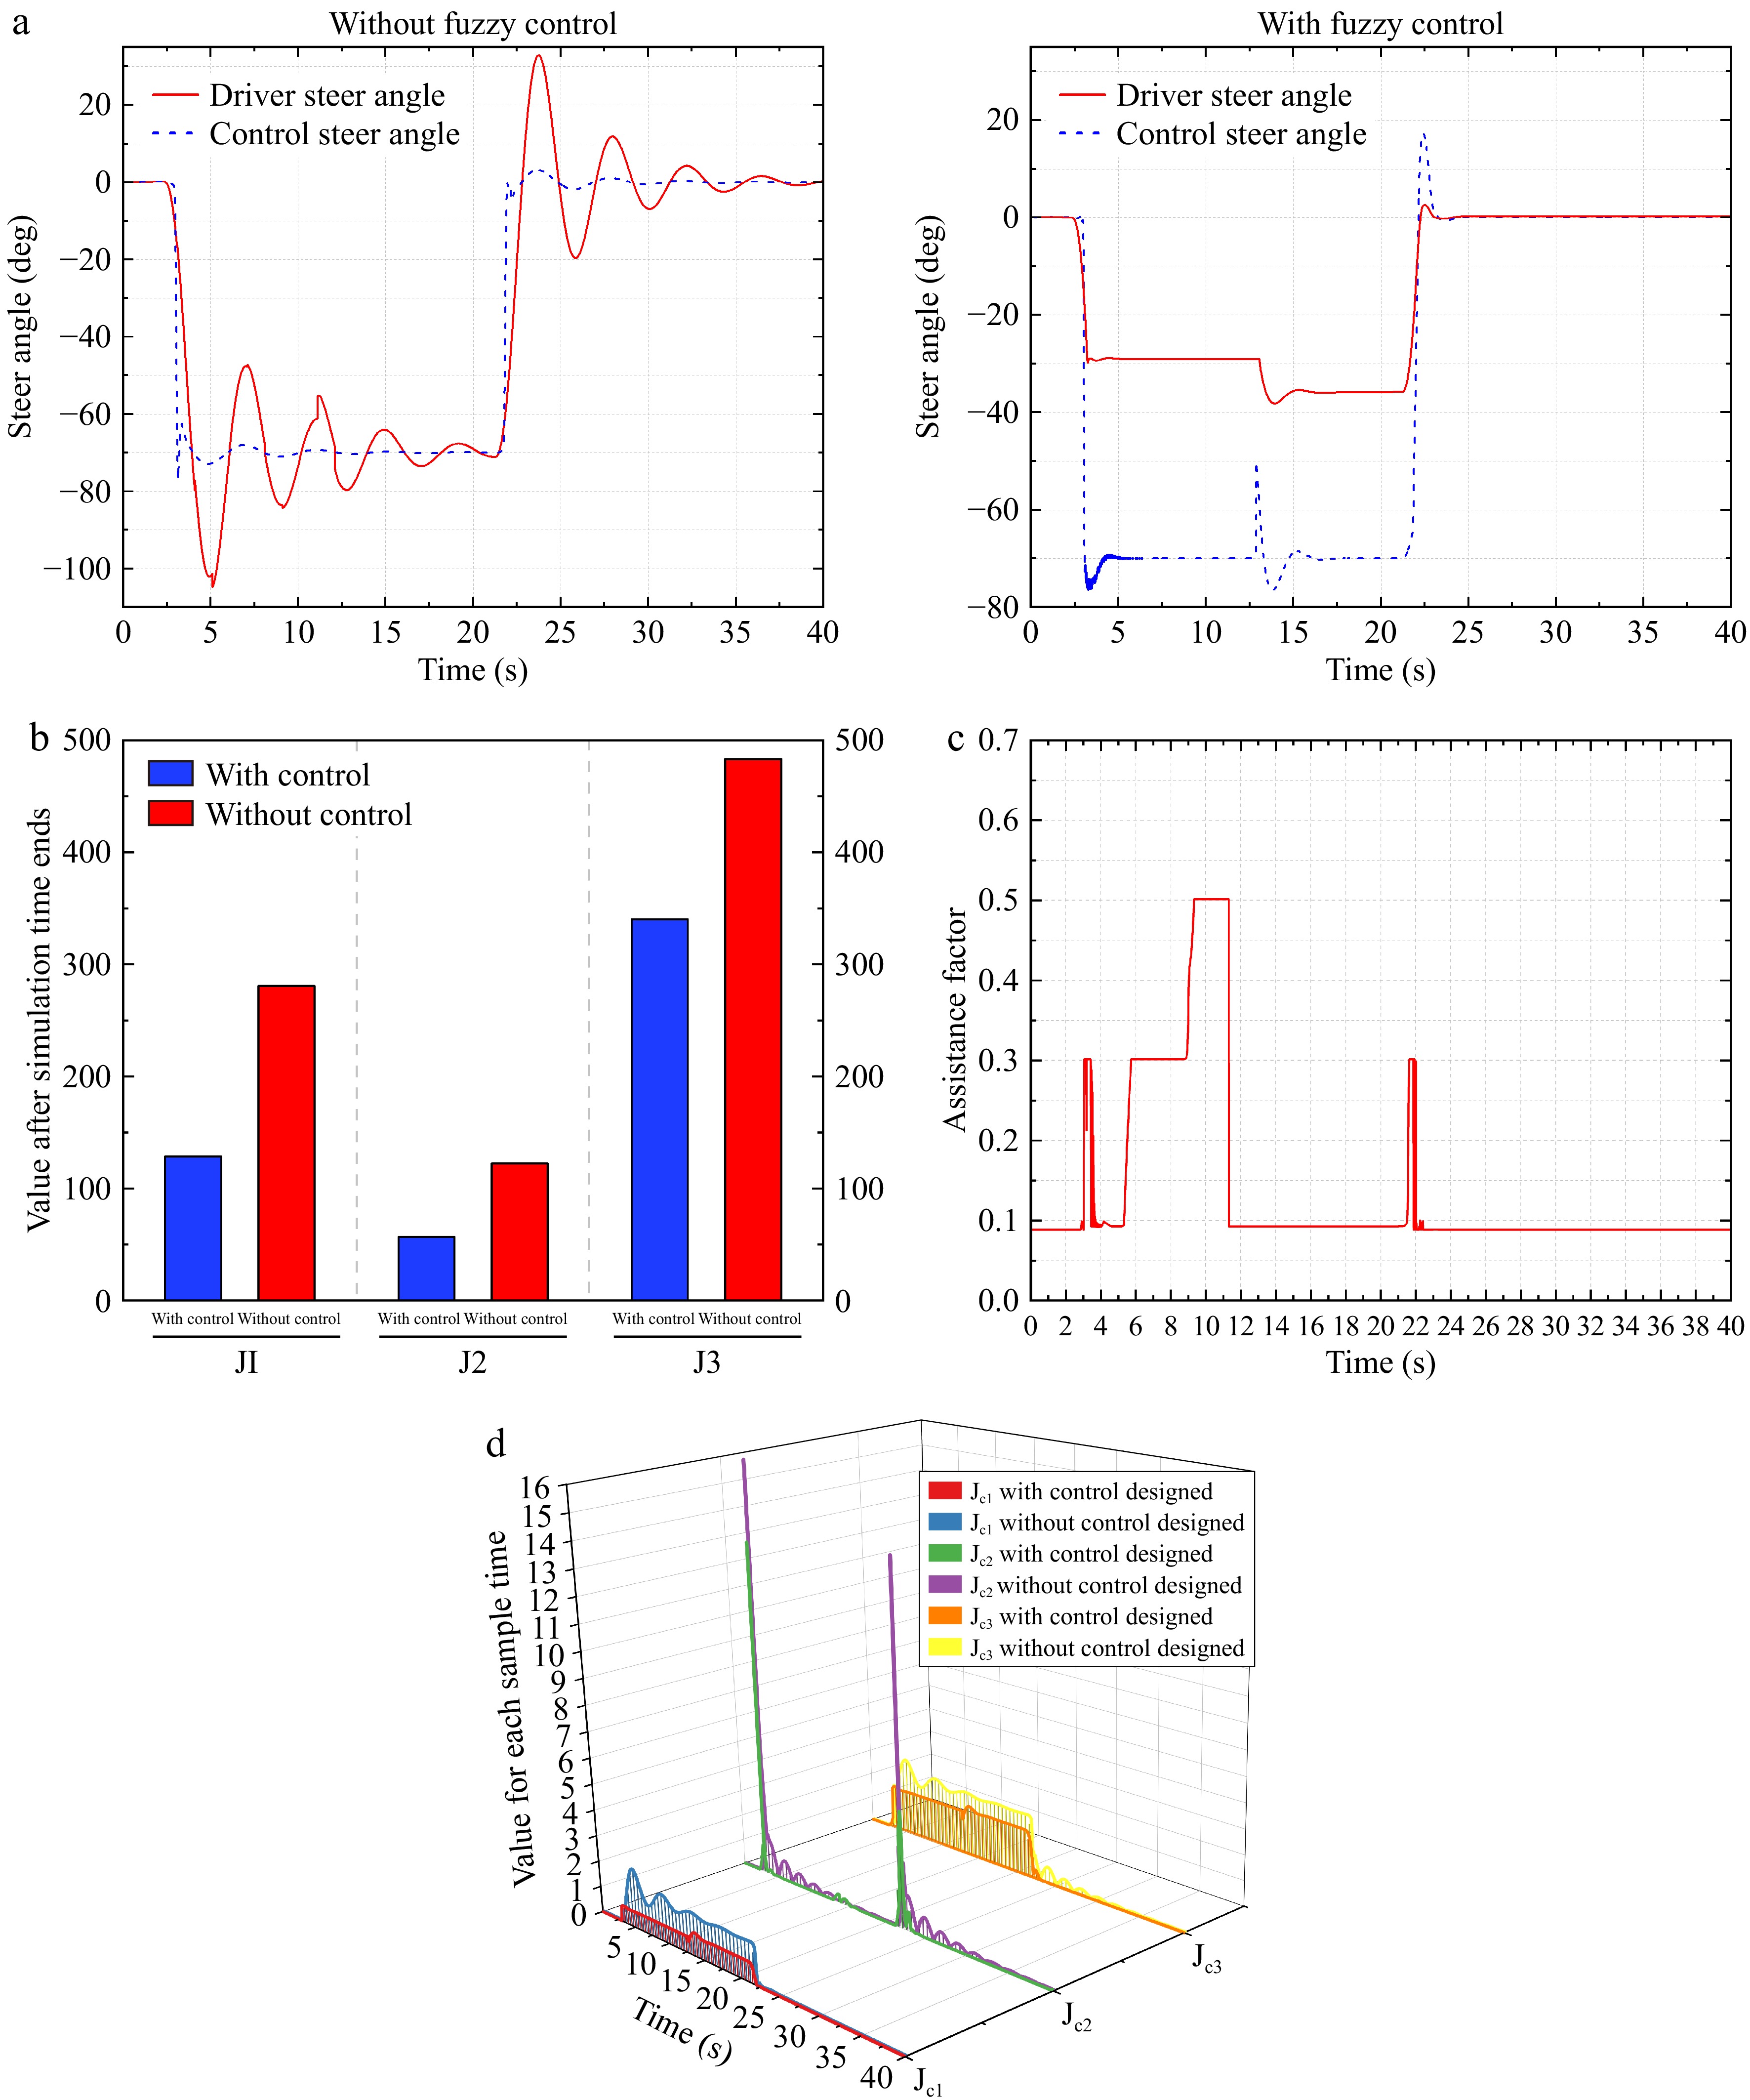
Figure 6.
Experimental results of the curved road scenario.
-
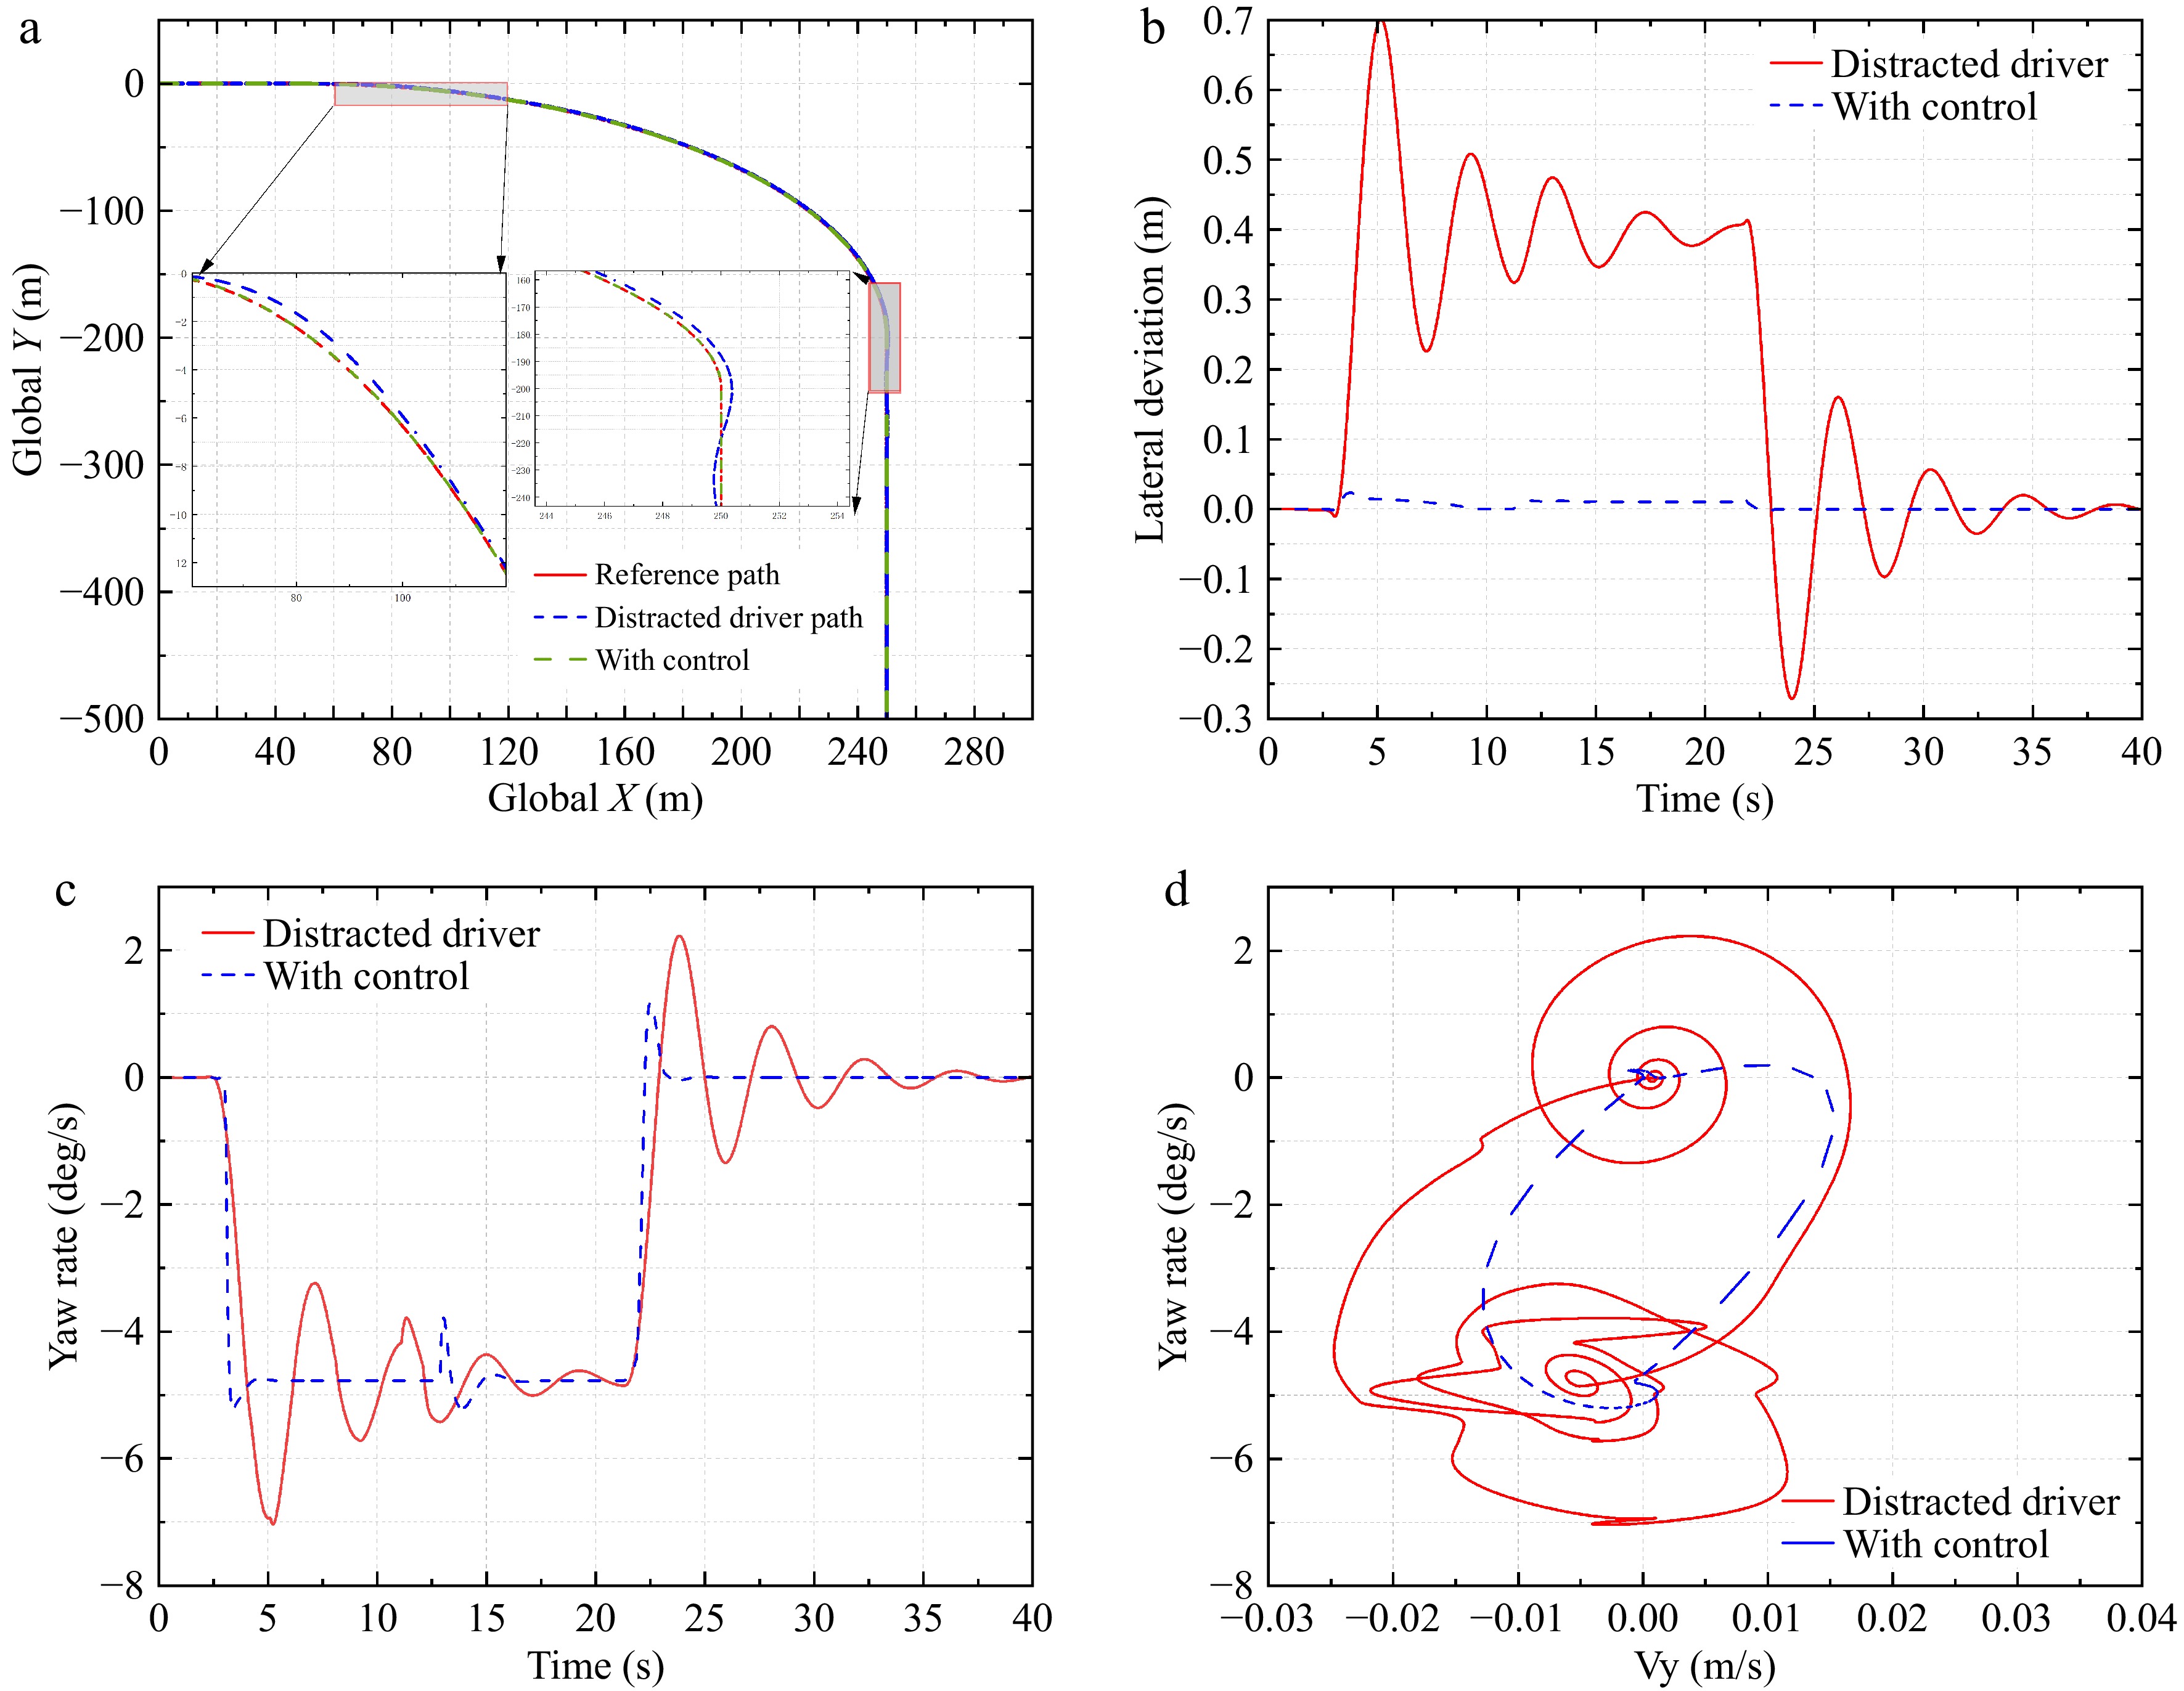
Figure 7.
Experimental results of a curved road scenario.
-
Cona Lonr Lr S MS M MD D S S S S S S S MS S S S S S M S S S S S MD S S S S MS D S S S MS MS MS S S S S MS MS MS S S S MS MS M S S MS MS M MD S S MS M M D S MS MS M MD M S S S S S MS MS S MS MS M M M S MS MS M M MD S M M MD MD D MS M M MD MD MD S S S MS M M MS S MS M M M M MS M M M M MD MS M M MD M D M M M MD MD D S MS MS MS M M MS MS MS M M M M MS M M M M MD MS M M MD MD D MS M M MD MD Table 1.
Fuzzy rules.
-
Notation Meaning Value m Vehicle mass 1,624 (kg) Iz Yaw moment of inertia 2,059.2 (kg·m2) a Distance to front axle 1.05 (m) b Distance to rear axle 1.61 (m) Sf Front slip ratio 0.2 Sr Rear slip ratio 0.2 Ccf/Clf Front cornering stiffness ratio 66,900 (N/rad) Ccr/Clr Rear cornering stiffness ratio 62,700 (N/rad) yL Preview distance 14.5 (m) tp Driver preview time 0.9 (s) th Driver reaction time 0.6 (s) td Neural time delay 0.3 (s) Vy Longitudinal velocity 60 (km/s) T Sampling time 0.025 (s) Np Prediction horizon 30 Q Output weighting matrix diag (250, 200, 100, 10) R Control weight 100 H Driver weight 2 Table 2.
Parameters in the experiment.
Figures
(7)
Tables
(2)