


-
With the increasing availability of in-vehicle entertainment functions, driver distraction has emerged as a critical safety issue. Even seemingly minor tasks, such as adjusting temperature controls or using navigation systems, can significantly impair a driver's focus on the road[1]. Driver distraction can lead to operational errors, severely compromising safety. Investigations into traffic accidents consistently highlight driver inattention as a primary factor in severe injury accidents. For instance, a study analyzing 340 cases found that 57.6% of drivers were inattentive, with an additional 5.9% potentially inattentive. Née et al.[2] examined the role of driver distraction in road traffic accidents, surveying 1,912 drivers involved in such incidents. The study identified activities that diverted the driver's attention away from the road or caused them to remove their hands from the steering wheel as significant contributors to accident responsibility. These findings underscore the necessity for driver assistance systems that can enhance vehicle performance when drivers are distracted.
Recent advancements in artificial intelligence have led to significant progress in autonomous driving technologies. Nevertheless, due to societal concerns regarding acceptance, privacy issues[3], precise network transmission challenges[4], and the complexity of navigating intricate road networks, human drivers are expected to remain integral participants or even primary operators for the foreseeable future. Until fully autonomous driving becomes a reality, human-machine co-driving, where control is shared between drivers and automated systems, has gained widespread acceptance. This approach enables drivers to leverage autonomous driving systems while retaining control, effectively correcting inappropriate human driving behaviors[5].
In shared human-machine co-driving systems, both the driver and the automated system contribute to vehicle control, interacting dynamically through control mechanisms that allow real-time adjustments. This interaction enables the system to harness the driver's operational characteristics, thereby improving overall vehicle control performance. Within this framework, the driver's behavior plays a pivotal role, significantly influencing the effectiveness of collaborative control.
Current research on driver behavior and shared control systems emphasizes the critical importance of understanding driver behavior to improve road safety and advance the development of autonomous vehicles[6]. Studies conducted both domestically and internationally demonstrate that incorporating driver behavior into controller design can enhance traffic efficiency and increase the effectiveness of driver assistance systems. Domestically, researchers have conducted in-depth studies on driver behavior modeling, managing uncertainties in driving behavior and improving controller robustness. For instance, Jiang et al.[7], developed an adaptive steering feedback torque system by analyzing drivers' compensation mechanisms in response to changes in steering feedback. Another study[8] improved system robustness by introducing random perturbations and various traffic scenarios to simulate behavioral uncertainties among different drivers. Jiang et al.[9] integrated driver uncertainties and vehicle dynamics into trajectory prediction, achieving more accurate long-term predictions. Similarly, Chen et al.[10] proposed a robust driver assistance controller that enhanced collaboration between human drivers and automated controllers during switching scenarios by accounting for uncertainties in driver model parameters. Inspired by professional driver behavior, Chen et al.[11] designed a robust steering controller capable of achieving precise control under model uncertainties and external disturbances. Internationally, significant progress has been made in improving interactions between human drivers and control systems while enhancing system robustness to uncertainties and dynamic changes. Nguyen et al.[12] applied the Takagi-Sugeno fuzzy control method to incorporate driver behavior into the control loop, dynamically adjusting time-varying driver activity parameters and vehicle speed to improve safety and comfort. Sentouh et al.[13] developed a driver model combining visual prediction and compensation, suitable for both novice and experienced drivers and designed an H∞ robust controller within a dual-loop human-machine shared control structure to minimize vehicle trajectory tracking errors. Chen et al.[14] addressed the risks posed by impaired drivers by proposing an impaired steering behavior model and developing a Gain-Scheduling Compound Nonlinear Feedback (GCNF) controller to assist steering, reducing steering angle deviations and driver workload. Additionally, Singh et al.[15] employed a Weighted Online Extended Dynamic Mode Decomposition (WOEDMD) algorithm to update driver models in real-time during obstacle avoidance, thereby improving driving safety.
These studies collectively highlight the importance of incorporating driver behavior into the design of vehicle control systems. However, a significant gap remains in addressing the dynamic state of drivers, particularly in scenarios involving distraction. Most existing research focuses on enhancing vehicle control performance through advanced control algorithms, often modeling drivers and designing controllers independently. This approach tends to overlook the impact of driver behavior on controller stability and fails to consider drivers' subjective comfort. Furthermore, road conditions such as curves and intersections can amplify the risks associated with driver distraction[16]. An analysis of crash data from 15 US states between 2013 and 2017 found that certain built environments, including curves, intersections, and work zones, significantly increase the likelihood of injuries in accidents involving distracted driving. Despite these findings, few studies have specifically targeted the development of driver assistance controllers for distracted drivers in long curve scenarios.
Research on driving authority allocation between humans and machines generally falls into two categories. The first adjusts driving authority based on the driver's state or intention. For example, the study by Huang et al.[17] detects driver steering intention through geometric relationships and intervenes when steering behavior is deemed inappropriate. Flad et al.[18] used a semi-supervised learning algorithm to predict lane-changing intentions based on steering wheel angles and pedal inputs, thereby improving vehicle stability during lane changes. Another study by Fang et al.[19] employed a Gaussian-Bernoulli Restricted Boltzmann Machine to assess driving intentions and adjust driving authority in real-time. Sentouh et al.[13] used a Driver Monitoring System (DMS) to assess driver states, facilitating smooth transitions between driver and Lane Keeping Assist (LKA) control. Li et al.[20] developed a perception function to better represent drivers' sensitivity to distance, using experimental data to model real-world reaction times and enhance collaboration between human drivers and automated systems.
The second category of research focuses on adjusting driving authority based on assessed driving risks. For instance, Jiang et al.[21] proposed a two-layer sequence prediction algorithm using Long Short-Term Memory (LSTM) to detect lane-changing intentions and design a safety-oriented decision-making mechanism. In the study by Dong et al.[22], a fuzzy controller was employed to infer control weight distribution coefficients, creating a model that adjusts driving authority in real time based on vehicle distance and longitudinal motion risks. Zhao et al.[23] developed a Gaussian Process Regression (GPR) model to evaluate cornering risks, generating safety envelopes to allocate control authority between drivers and machines.
However, solely considering driver intention or driving risk in authority allocation can result in control strategies that either overemphasize comfort at the expense of safety or focus excessively on safety, potentially diminishing the driving experience. A balanced approach that integrates both driver intention and driving risk is essential for ensuring optimal safety and comfort. This work introduces a shared control strategy that accounts for the behavior of distracted drivers. The contributions of this study are summarized as follows:
(1) A model predictive controller considering driver behavior and the obstacle-road potential field (H-ORPF-MPC) is developed that integrates driver behavior and environmental conditions to balance driving comfort with controller stability. The proposed controller uses a driver intention function and an obstacle-road potential field (ORPF) to quantify risks from surrounding obstacles and road boundaries. A state constraint envelope is employed to ensure real-time safe operation of the vehicle.
(2) A balanced authority allocation mechanism is proposed that considers both road safety and driver subjective comfort, enhancing the effectiveness of driver assistance. Three functions were designed to evaluate the road environment and driver distraction levels. Lateral risk in the road environment combines road width and vehicle deviation; longitudinal risk utilizes TTC with the TTCi formula; and driver distraction level is assessed based on the difference between the driver's steering output and the desired steering angle. Fuzzy rules were designed based on the driver's state while considering vehicle safety, and a fuzzy controller was used to calculate the cooperation factor.
(3) A distracted driver model was constructed to capture path-following ability and distraction duration. Using a single-point preview driver model based on sliding mode control as the baseline, the model introduced reaction delay and correction components to simulate the delayed reaction characteristics of distracted drivers. During modeling, driver steering input and parameter uncertainties were considered, and real vehicle test data were incorporated to model the delayed reaction characteristics of distracted drivers.
-
In this section, the vehicle dynamics model and distracted driver model are established to facilitate the shared controller design in the next section. The distracted driver model will imitate the human driver to control the vehicle, and the vehicle dynamics model will serve as the basic part of the multi-constraint MPC in the next section. Finally, a simulation test was conducted on the distracted driver model.
Vehicle dynamics model
-
The single-track model of a vehicle is illustrated in Fig. 1. Here, (X, Y) represents the coordinates of the vehicle's center of gravity in the global coordinate system, and (x, y) represents the vehicle coordinate system. Considering the lateral, longitudinal, and yaw movements of the vehicle, the vehicle dynamics model can be derived using Newton's second law[24–25]:
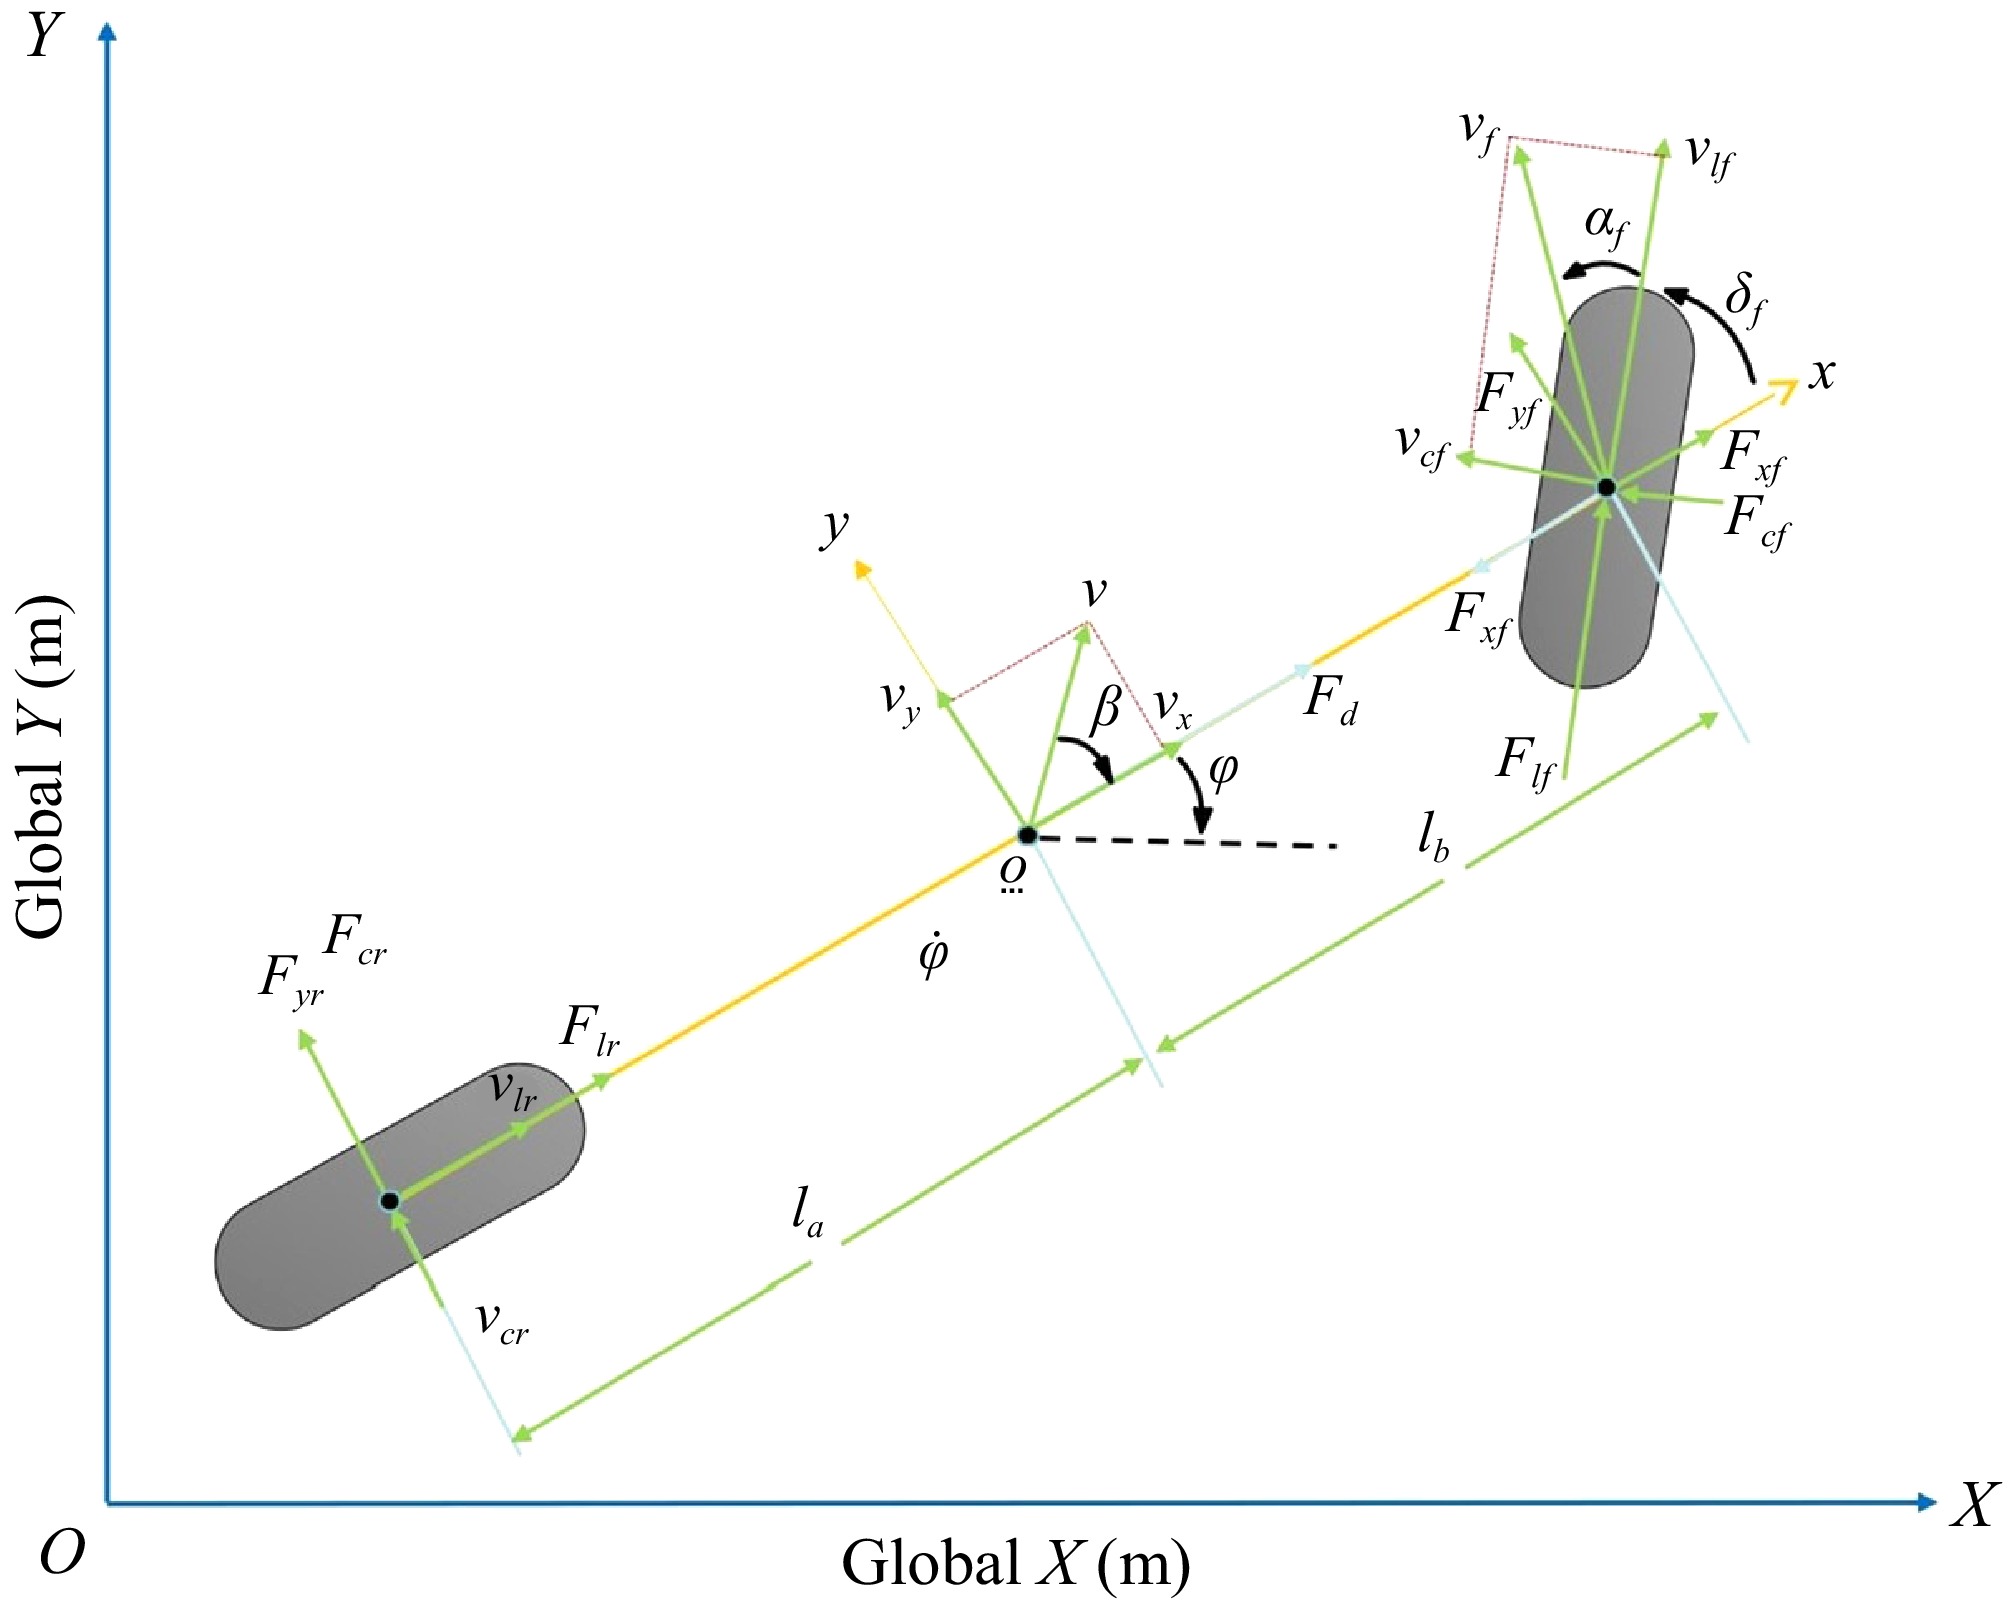
Figure 1.
Vehicle dynamics model.
$\left\{\begin{array}{l}m{a}_{y}={F}_{yf}+{F}_{yr}\\ m{a}_{x}={F}_{d}-{F}_{xf}\\ {I}_{z}\ddot{\varphi }={l}_{a}{F}_{cf}-{l}_{b}{F}_{cr}\end{array}\right. $ (1) The parameter m represents the vehicle's mass, while Fcf and Fcr represent the lateral forces acting on the front and rear wheels, respectively. Fyf and Fyr correspond to the lateral forces on the front and rear wheels, respectively, while Fxf denotes the longitudinal force on the front wheels. Iz represents the moment of inertia of the vehicle about the z-axis, and φ denotes the yaw angle. The distances la and lb measure the distance from the center of mass to the front and rear axles, respectively. ax and ay are the longitudinal and lateral inertial accelerations of the vehicle at the center of mass o.
$ \left\{\begin{array}{l}{a}_{y}=\ddot{y}+{v}_{x}\dot{\varphi }\\ {a}_{x}=\dot{{v}_{x}}-{v}_{y}\dot{\varphi }\end{array}\right. $ (2) From the geometric relationships in the figure:
$ \left\{\begin{array}{l}{F}_{xf}={F}_{cf}sin{\delta }_{f}\\ {F}_{yf}={F}_{cf}cos{\delta }_{f}\\ {F}_{yr}={F}_{cr}\end{array}\right. $ (3) When the slip ratio is small, the relationship between slip ratio and lateral force is linear. The same applies to longitudinal force. Therefore, when the sideslip angle and slip ratio are small, the tire forces can be linearized to simplify the model. The tire force equations are as follows:
$\left\{\begin{array}{l}{F}_{lf}={C}_{lf}{s}_{f}\\ {F}_{cf}={C}_{cf}{\alpha }_{f}\\ {F}_{lr}={C}_{lr}{s}_{r}\\ {F}_{cr}={C}_{cr}{\alpha }_{r}\end{array}\right. $ (4) where, Ccf, Clf and Ccr, Clr are the lateral stiffness of the front and rear tires, αf and αr are the front and rear tire sideslip angles, and sf and sr are the slip ratios of the front and rear tires. Based on the geometric relationships in Fig. 1, we can express αf and αr as:
$ \left\{\begin{array}{l}{\alpha }_{f}={\mathrm{t}\mathrm{a}\mathrm{n}}^{-1}\dfrac{{v}_{cf}}{{v}_{lf}}={\delta }_{f}-arctan\dfrac{\dot{y}+{l}_{a}\dot{\varphi }}{{v}_{x}}\\ {\alpha }_{r}={\mathrm{t}\mathrm{a}\mathrm{n}}^{-1}\dfrac{{v}_{cr}}{{v}_{lr}}=arctan\dfrac{{l}_{b}\dot{\varphi }-\dot{y}}{x}\end{array}\right. $ (5) For the global coordinates:
$ \left\{\begin{array}{l}\dot{X}=\dot{x}\mathrm{cos}\varphi -\dot{y}\mathrm{sin}\varphi \\ \dot{Y}=\dot{x}{\sin}\varphi +\dot{y}{\cos}\varphi \end{array}\right. $ (6) Combined with the above formulas, the vehicle dynamics model is obtained:
$ \left\{\begin{array}{l}m\ddot{x}=m\dot{y}\dot{\varphi }+2\left[{C}_{lf}{s}_{f}+{C}_{cf}\left({\delta }_{f}-\dfrac{\dot{y}+{l}_{f}\dot{\phi }}{\dot{x}}\right){\delta }_{f}+{C}_{lr}{s}_{r}\right] \\ m\ddot{y}=-m\dot{x}\dot{\varphi }+2\left[{C}_{lf}{s}_{f}{\delta }_{f}+{C}_{cf}\left(\dfrac{\dot{y}+{l}_{f}\dot{\varphi }}{\dot{x}}-{\delta }_{f}\right)+{C}_{cr}\dfrac{{l}_{r}\dot{\phi }-\dot{y}}{\dot{x}}\right] \\ {I}_{z}\dot{\varphi }=2{l}_{f}\left[{C}_{lf}{s}_{f}{\delta }_{f}+{C}_{cf}\left(\dfrac{\dot{y}+{l}_{f}\dot{\varphi }}{\dot{x}}-{\delta }_{f}\right)\right]-2{l}_{r}{C}_{cr}\dfrac{{l}_{r}\dot{\varphi }-\dot{y}}{\dot{x}} \\ \dot{X}=\dot{x}\mathrm{cos}\varphi -\dot{y}\mathrm{sin}\varphi \\ \dot{Y}=\dot{x}\mathrm{sin}\varphi +\dot{y}\mathrm{cos}\varphi \end{array}\right. $ (7) To facilitate subsequent controller design, this study reformulates the vehicle dynamics differential equation presented in Eq. (8) into a state-space representation form.
Take the state vector as:
$\chi =[\dot{x},\dot{y},\varphi ,\dot{\varphi },X,Y{]}^{T} $ (8) The input vector is
$ u=\delta $ $\dot{\chi }=A\left(t\right)\chi \left(t\right)+B\left(t\right)u\left(t\right) $ (9) $\begin{split}& B(t)=\left[\begin{array}{l} \dfrac{2 C_{c f}}{m_{2}}\left(2 \delta_{f}-\dfrac{\dot{y}+l_{f} \dot{\varphi}}{s}\right) \\ \dfrac{2\left(C_{l f} s_{f}-C_{c f}\right)}{m} \\ 0 \\ \dfrac{2 l_{f}\left(C_{l f} s_{f}-C_{c f}\right)}{l_{z}} \\ 0 \\ 0 \end{array}\right] \cdots \cdots \cdot\\& A(t)=\left[\begin{array}{cccccc} a_{11} & a_{12} & 0 & a_{14} & 0 & 0 \\ a_{31} & a_{32} & 0 & a_{34} & 0 & 0 \\ 0 & 0 & 0 & 1 & 0 & 0 \\ a_{41} & a_{42} & 0 & a_{44} & 0 & 0 \\ a_{51} & a_{41} & a_{41} & 0 & 0 & 0 \\ a_{41} & a_{41} & a_{41} & 0 & 0 & 0 \end{array}\right]\end{split}$ $ {a}_{11}=\dfrac{2{C}_{cf}{\delta }_{f}-\left(\dot{y}+{l}_{f}\dot{\varphi }\right)}{m{\dot{x}}^{2}},\;\,{a}_{12}=\dot{\varphi }-\dfrac{2{C}_{cf}{\delta }_{f}}{m\dot{x}},\;\,{a}_{14}=\dot{y}-\dfrac{2{C}_{cf}{l}_{f}{\delta }_{f}}{m\dot{x}} $ $ \begin{aligned} & a_{21}=-\dot{\varphi}-\dfrac{2C_{cf}\left(\dot{y}+l_f\dot{\varphi}\right)+2C_{cf}\left(l_r\dot{\varphi-}\dot{y}\right)}{m\dot{x}^2},\; \; a_{22}=\dfrac{2C_{cf}-2C_{cr}}{m\dot{x}}, \\ & a_{24}=-\dot{x}+\dfrac{2\left(C_{lf}l_f+C_{cf}l_r\right)}{m\dot{x}},\ a_{41}=-\dot{\varphi}-\dfrac{2C_{cf}\left(\dot{y}+l_f\dot{\varphi}\right)+2C_{cf}\left(l_r\dot{\varphi-}\dot{y}\right)}{m\dot{x}^2},\end{aligned} $ $ \begin{aligned} & a_{42}=\dfrac{2C_{cf}-2C_{cr}}{m\dot{x}},\ a_{44}=-\dot{x}+\dfrac{2\left(C_{lf}l_f+C_{cf}l_r\right)}{m\dot{x}} \\ & \end{aligned} $ $ {a}_{51}=\mathrm{c}\mathrm{o}\mathrm{s}\varphi ,\;\;{a}_{52}=\text-\mathrm{sin}\varphi ,\;\;{a}_{53}=-\dot{x}\mathrm{sin}\varphi -\dot{y}\mathrm{c}\mathrm{o}\mathrm{s}\varphi $ $ {a}_{61}=\mathrm{sin}\varphi ,\;\;{a}_{62}=\mathrm{c}\mathrm{o}\mathrm{s}\varphi ,\;\;{a}_{63}=\dot{x}\mathrm{c}\mathrm{o}\mathrm{s}\varphi -\dot{y}\mathrm{s}\mathrm{i}\mathrm{n}\varphi $ Distracted driver model
-
Combined with the driver's distracted operating characteristics on long curves, the driver model parameters (preview time tp, driver neural reaction time td, driver operation lag time th, steady-state gain coefficient Gay) are adjusted.
Using the driver model from Kong et al.[26], consider the steering behavior of the driver, while incorporating correction and delay components to simulate the delayed reaction characteristics of a distracted driver:
$ {\delta }_{l}=\left[\delta _{f}-\dfrac{{I}_{z}\eta }{{l}_{a}{C}_{lf}}({\varphi }_{r}-{\varphi }_{d})\right]\dfrac{\mathrm{e}\mathrm{x}\mathrm{p}(-{t}_{d}s)}{1+{t}_{h}s}\dfrac{1+{t}_{c}s}{{G}_{ay}} $ (10) Among them:
$ {\delta }_{f}=\dfrac{{I}_{z}}{{l}_{a}{C}_{f}}\left[\dfrac{{{l}_{a}}^{2}{C}_{lf}+{{l}_{b}}^{2}{C}_{cr}}{{I}_{z}{V}_{x}}\varphi +\dfrac{{l}_{a}{C}_{lf}-{l}_{b}{C}_{cr}}{{I}_{z}}\beta -{\dot{\varphi }}_{r}\right] $ $ {\varphi }_{d}=2\left[\mathrm{a}\mathrm{r}\mathrm{c}\mathrm{t}\mathrm{a}\mathrm{n}\left(\dfrac{{\Delta }f}{{V}_{x}{t}_{p}}\right)-\beta \right]{t}_{p}^{-1} $ where, Vx represents the longitudinal velocity of the vehicle. β denotes the sideslip angle at the center of mass. δf indicates the front wheel steering angle controlled by the sliding mode. φd is the desired yaw rate. φr is the actual yaw rate. tp is the preview time, preview time refers to the time that the driver can observe and judge the road conditions ahead in advance during driving.
$ \text{Δ}$ $ \dfrac{1+{t}_{c}s}{{G}_{ay}} $ $ \dfrac{\mathrm{e}\mathrm{x}\mathrm{p}(-{t}_{d}s)}{1+{t}_{h}s} $ In a distracted state, drivers not only exhibit delayed reactions but also demonstrate uncertainty in their steering operations. It is therefore imperative to incorporate these uncertain factors into the model of a distracted driver. The steering angle can be represented as:
$\delta =\theta {\delta }_{l}+\Delta {\delta }_{l} $ (11) In the formula, δ represents the actual steering angle. θ is an uncertainty coefficient that represents the uncertainty of driver modeling. δl is the standard steering angle of the sliding mode controller.
$ {\Delta } $ $\delta =\theta \left[{\delta }_{f}-\dfrac{{I}_{z}\eta }{{l}_{a}{C}_{lf}}\left({\varphi }_{r}-{\varphi }_{d}\right)\right]\dfrac{exp\left(-{t}_{d}s\right)}{1+{t}_{h}s}\dfrac{1+{t}_{c}s}{{G}_{ay}}+\Delta {\delta }_{l} $ (12) For distracted drivers, as the preview time decreases and the reaction time increases, their ability to control the vehicle diminishes. Vehicle yaw is the most easily recognized signal by a distracted driver, hence the lateral deviation of the vehicle is used as a quantifiable measure of the distracted driver's steering behavior. The study by Hua et al.[27] analyzes the steering behavior, psychological comfort, and lateral deviation data under cognitive and visual distractions across various curve radii. It notes that under cognitive distraction, drivers exhibited a lateral deviation of 0.345 m on a 200-m radius path. To simulate distracted driving behavior, a simulation was conducted considering the characteristics of distracted drivers, with a set speed of 60 km/h.
By adjusting the driver parameters (preview time tp, neural reaction time td, and operation delay time th), the driving performance declines. Cognitive distraction reduces the vehicle's lateral stability and the driver's time to focus on the road ahead. Attentive drivers can anticipate curves and take measures to navigate smoothly, whereas distracted drivers, due to a lack of focus, often miss the optimal moment to anticipate curves, resulting in greater lateral deviation. This deviation not only diminishes driving safety but also indicates an overall decline in driving performance, including extended response times to road conditions and reduced decision-making accuracy. Figure 2 records the changes in steering angle and vehicle lateral deviation of 12 distracted driving experiments, with the average lateral deviation of the 12 experiments being 0.351 m.
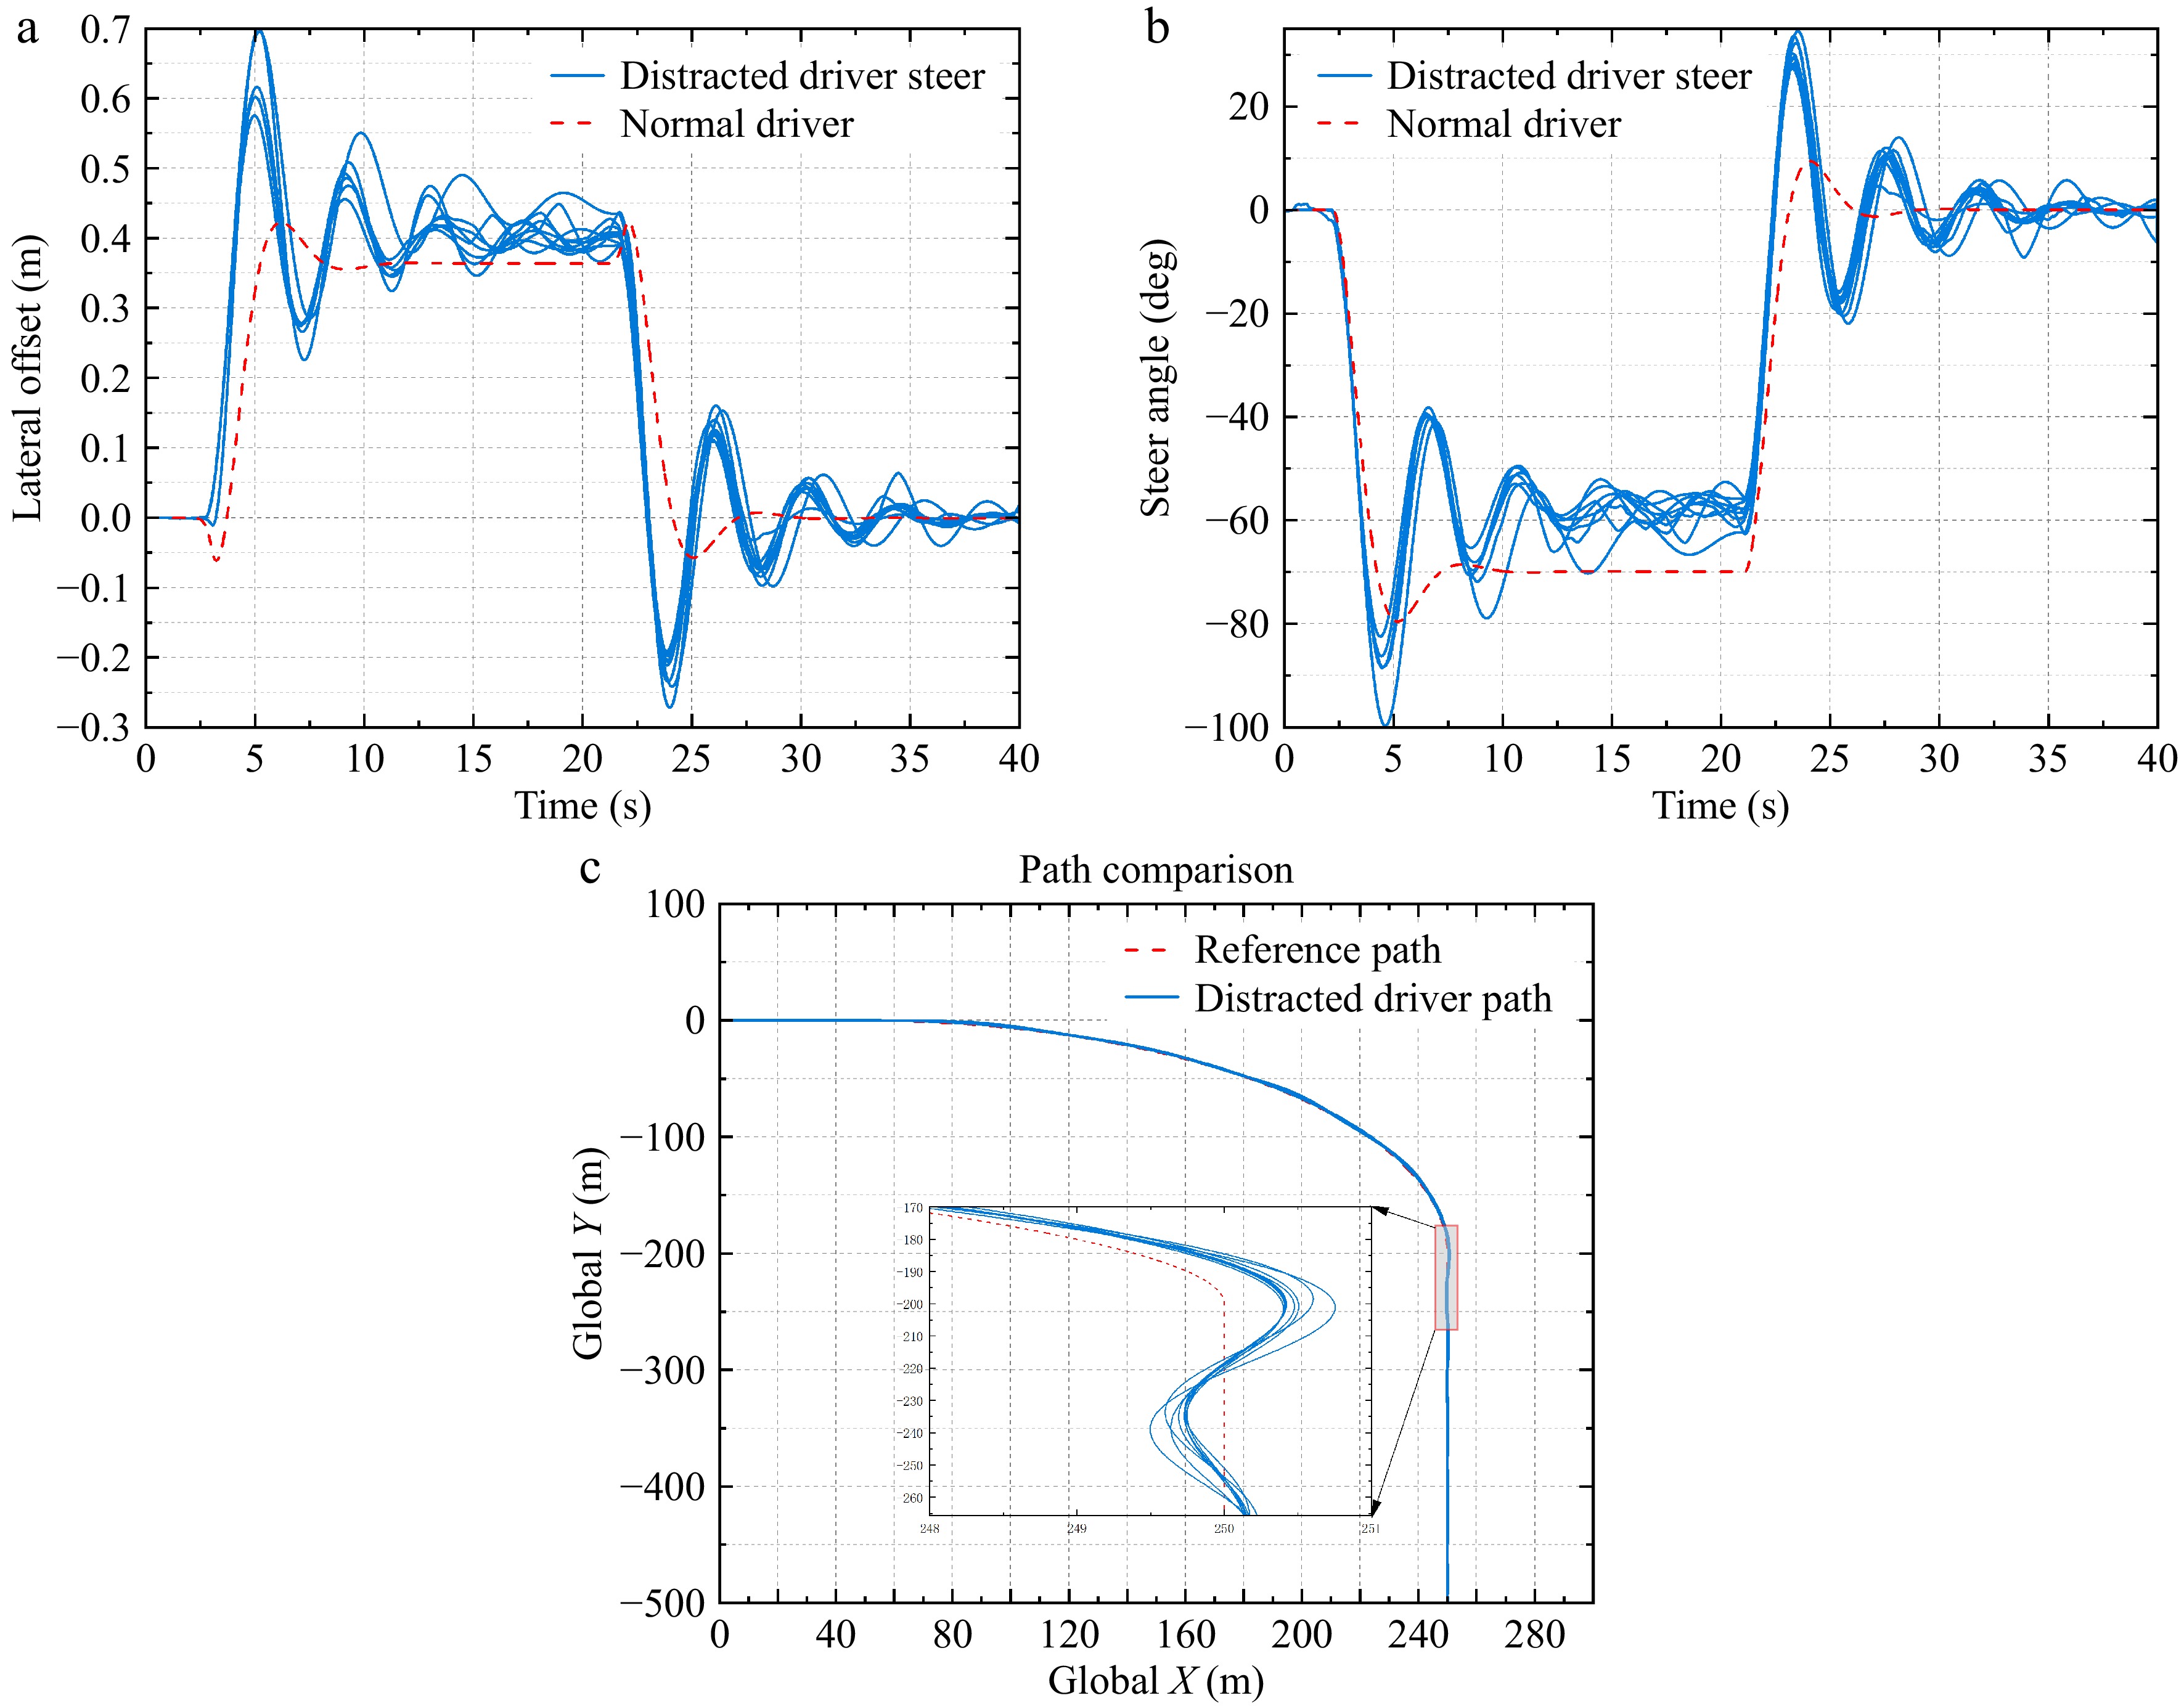
Figure 2.
Driving performance of distracted drivers.
-
In this section, we design a multi-constraint model predictive controller (H-ORPF-MPC) that incorporates both driver behavior and road environment factors to strengthen collaboration between the driver and the control system. Additionally, a fuzzy controller is introduced to adaptively adjust driving authority based on real-time road safety conditions and driver distraction levels. The proposed shared control framework is depicted in Fig. 3. The shared control system framework is mainly divided into three parts: the human-vehicle control system, the authority allocation module, and the Carsim driving environment module. The vehicle control system integrates the driver model and H-ORPF-MPC, both of which receive vehicle status data. The driver model outputs the driver control angle to H-ORPF-MPC. The core of H-ORPF-MPC includes the vehicle dynamics model, objective function, obstacle-road potential field, and controller constraint settings. The obstacle-road potential field quantifies the risk of obstacles and road boundaries around the host vehicle. The controller constraint part limits the vehicle's state within a safe envelope by limiting the vehicle's lateral speed and yaw angular velocity. H-ORPF-MPC finally outputs the driver's control angle and the controller's angle to the authority allocation module. The authority allocation module will quantify the road environment conditions and driver operating status according to the three set functions. The normalized driver distraction value and road environment risk value are used as the input of the fuzzy controller, and the control authority of the driver controller is determined according to the set fuzzy rules to obtain the final vehicle angle input.
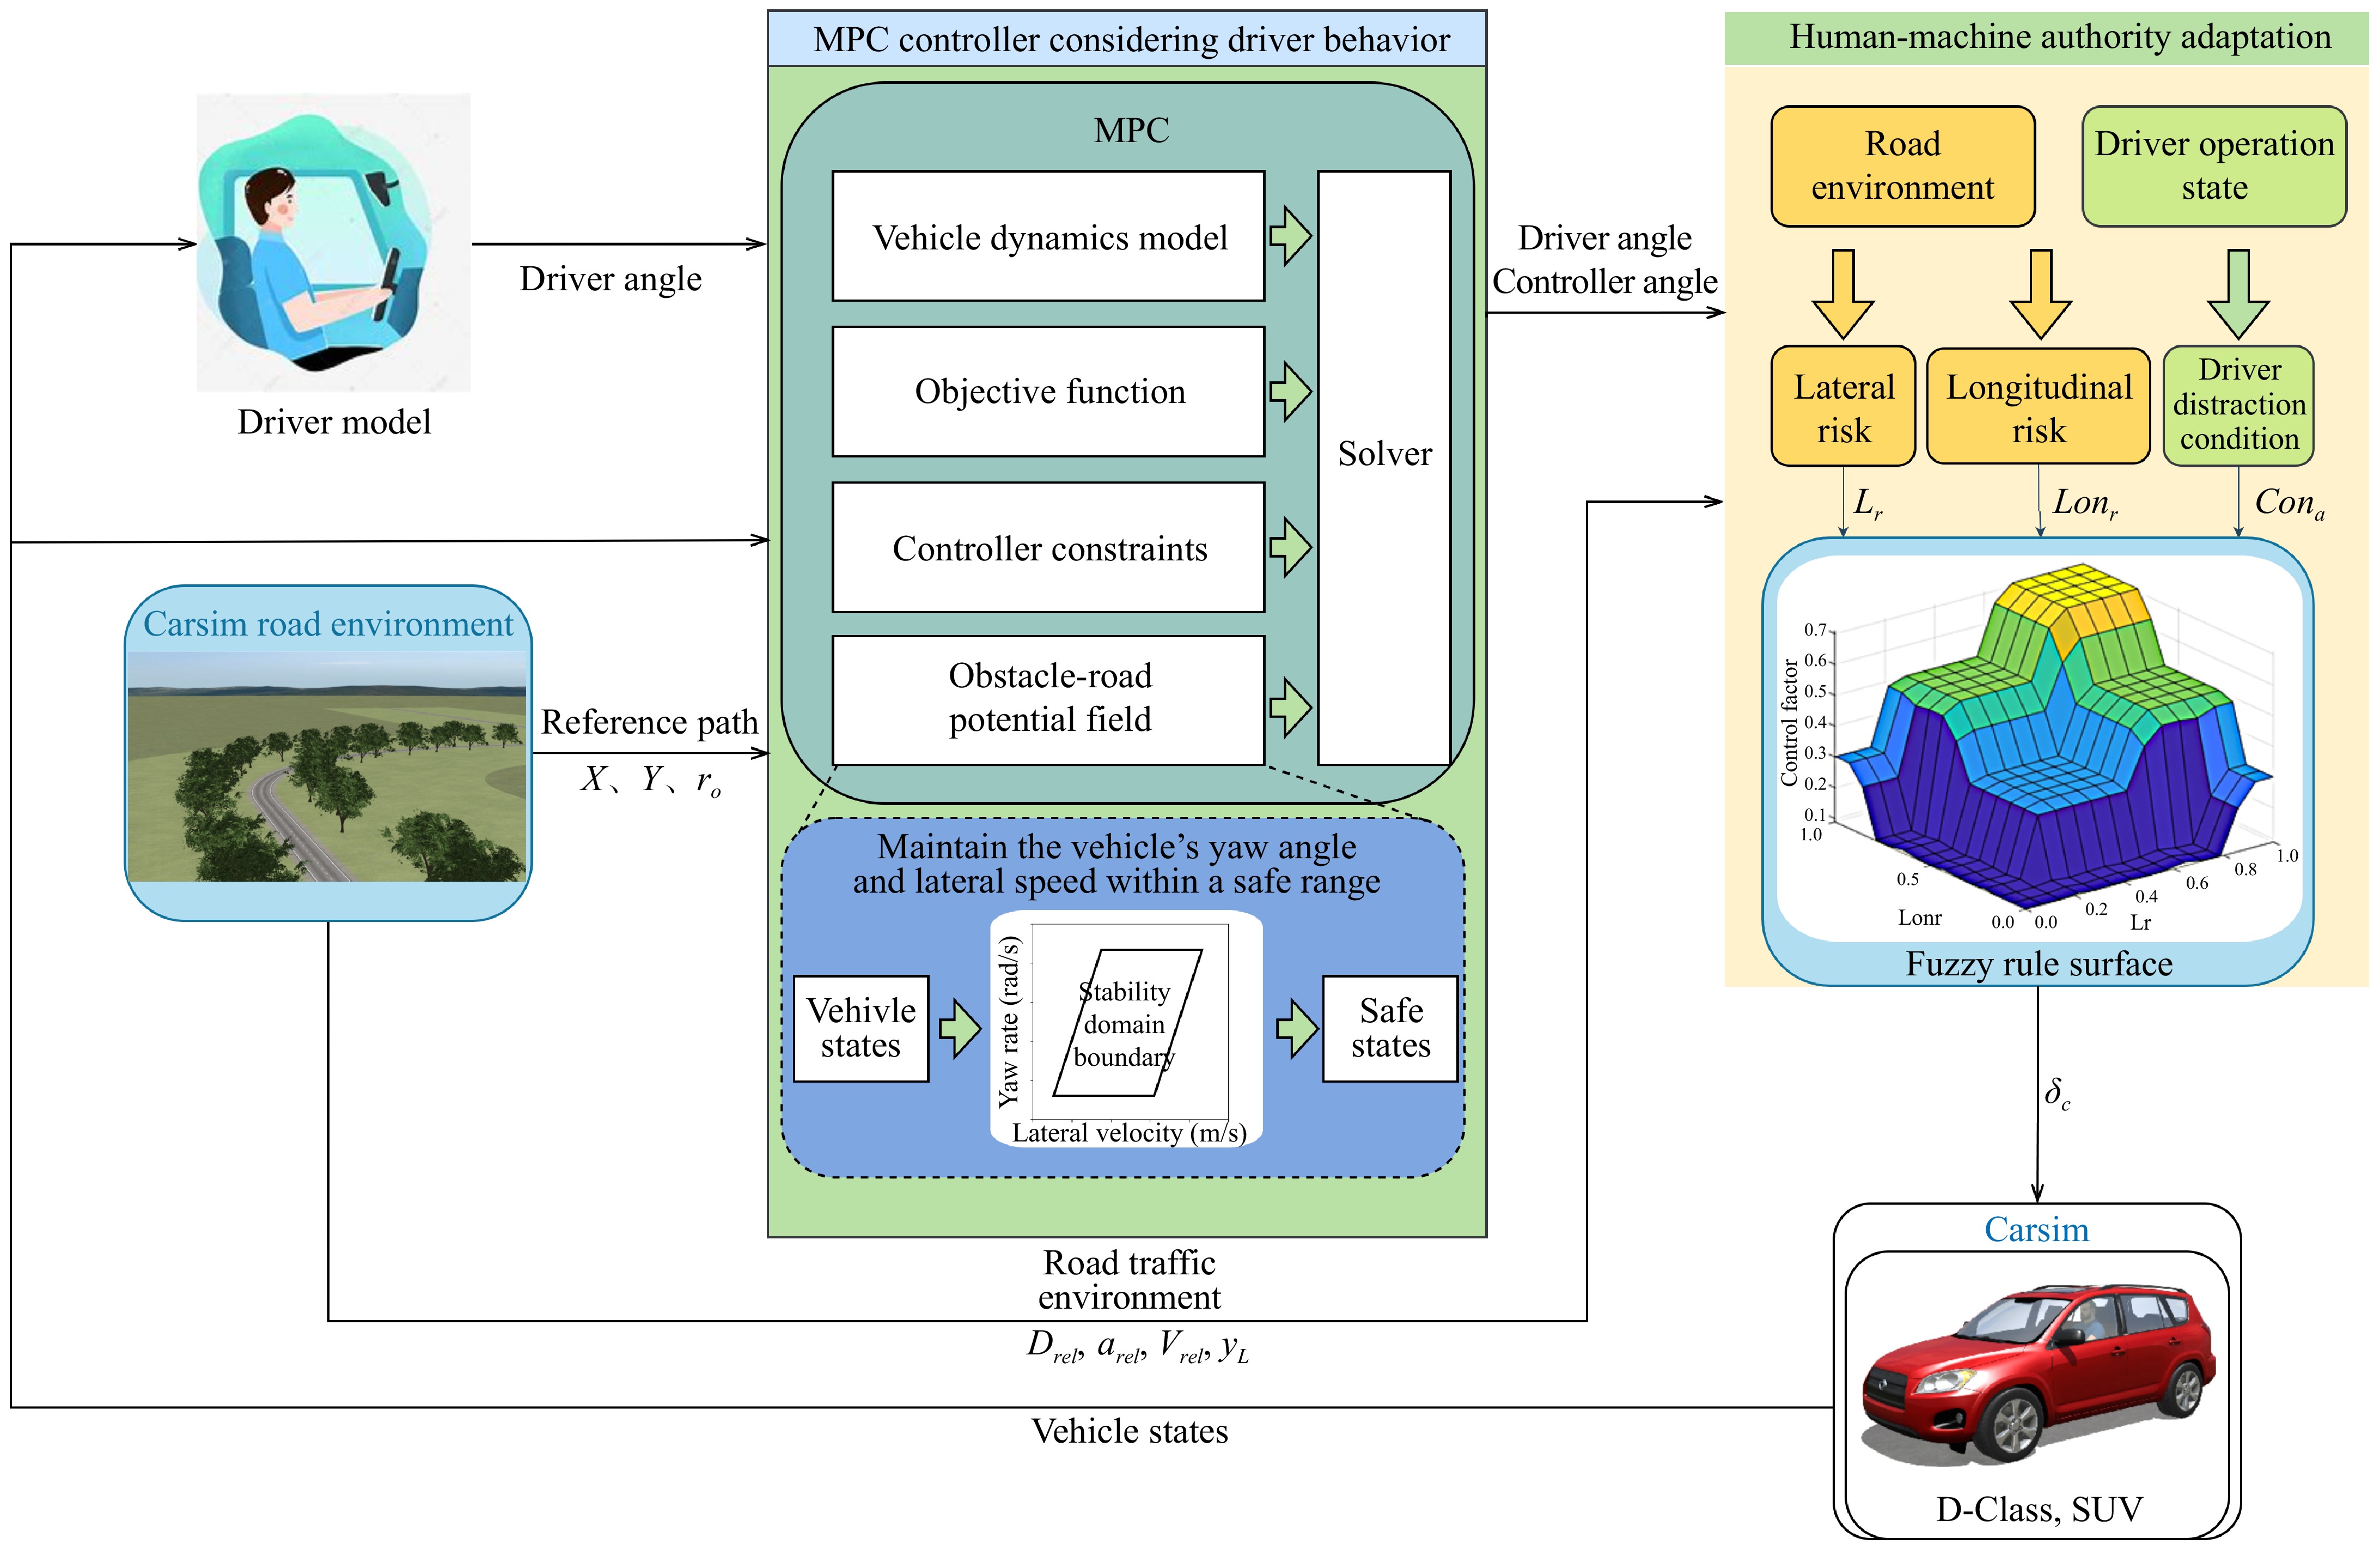
Figure 3.
The framework of a proposed shared control system.
Controller design considering driver behavior and driving environment
-
In the design of the controller, the driver control action and road environment evaluation function are embedded into the model prediction controller, so that the controller can obtain the optimal solution according to the driver's operation, and the mutual assistance ability of the shared controller and the driver is enhanced. Research indicates that both the lateral velocity and yaw rate of the vehicle are significantly higher under distracted driving conditions compared to normal driving[28]. To address this, a yaw rate-lateral velocity safety envelope is designed as a constraint for the controller.
By incorporating driver control actions, Eqn (9) can be revised as follows:
$\dot{\chi }=A\left(t\right)\chi \left(t\right)+{B}_{m}\left(t\right){U}_{m}\left(t\right)+{B}_{h}\left(t\right){U}_{h}\left(t\right) $ (13) where,
$\begin{split}& {B}_{m}\left(t\right)=\left[\begin{array}{c}\dfrac{2{C}_{cf}{\lambda }_{LLC}}{{m}_{2}}\left(2{\delta }_{f}-\dfrac{\dot{y}+{l}_{f}\dot{\varphi }}{s}\right)\\ \dfrac{2\left({C}_{lf}{s}_{f}-{C}_{cf}\right)}{m}{\lambda }_{LLC}\\ 0\\ \dfrac{2{l}_{f}\left({C}_{lf}{s}_{f}-{C}_{cf}\right)}{{l}_{z}}{\lambda }_{LLC}\\ 0\\ 0\end{array}\right],\\&{B}_{h}\left(t\right)=\left[\begin{array}{c}\dfrac{2{C}_{cf}\left(1-{\lambda }_{LLC}\right)}{{m}_{2}}\left(2{\delta }_{f}-\dfrac{\dot{y}+{l}_{f}\dot{\varphi }}{s}\right)\\ \dfrac{2\left({C}_{lf}{s}_{f}-{C}_{cf}\right)}{m}\left({1-\lambda }_{LLC}\right)\\ 0\\ \dfrac{2{l}_{f}\left({C}_{lf}{s}_{f}-{C}_{cf}\right)}{{l}_{z}}\left(1-{\lambda }_{LLC}\right)\\ 0\\ 0\end{array}\right] \end{split}$ The forward Euler discretization method is used to obtain the discrete state space equation:
$ \chi (\mathrm{k}+1)=\overline{A}\left(k\right)\chi \left(k\right)+{\overline{B}}_{m}\left(k\right){U}_{m}\left(k\right) + {\overline{B}}_{h}\left(k\right){U}_{h}\left(k\right) $ In the above equation, λLLC is the control collaborative factor, which is determined by the authority allocation strategy between human and machine designed in the next section. The other parameters are vehicle performance parameters.
$ \overline{A}\left(k\right)=I+TA\left(t\right) $ $ {\overline{B}}_{m}\left(k\right)=T{B}_{m}\left(t\right) $ $ {\overline{B}}_{h}\left(k\right)=T{B}_{h}\left(t\right) $ $ {E}_{driver}=\dfrac{\left|{\delta }_{h}-{\delta }_{m}\right|}{H} $ (14) where, δh is the current output action by the driver, δm is the optimal solution calculated by the controller at the previous moment and used as the controller's output action, and H is the adjustment coefficient.
In order to evaluate the safety situation around the vehicle when the host vehicle is driving, the artificial potential field[29−31] method is used to construct the obstacle-road potential field (ORPF) to quantify the risks of surrounding obstacles and road boundaries to the host vehicle. Obstacles include roadblocks, pedestrians, vehicles, etc. All objects that may threaten the host vehicle. The obstacle potential field function is as follows:
${U}_{oPF,i}(X,Y)=\dfrac{{\kappa }_{oPF,i}}{{\left\|\dfrac{X}{{x}_{i}},\dfrac{Y}{{y}_{i}}\right\|}^{{b}_{oPF,i}}}$ (15) where, koPF,i and boPF,i are both constant, which are expressed as the potential field strength coefficient and shape coefficient of the obstacle, respectively. xi and yi represent the relative distance between the main car and the obstacle, respectively. Their specific settings are as follows:
$\begin{aligned}&{x}_{i}={x}_{0}+{v}_{x}{T}_{0}+\dfrac{{\Delta }{v}_{xi}^{2}}{2{a}_{n}}\\ &{y}_{i}={y}_{0}+({v}_{x}sin\varphi +{v}_{obsi}sin\varphi ){T}_{0}+\dfrac{{\Delta }{v}_{yi}^{2}}{2{a}_{n}} \end{aligned}$ (16) where, x0 and y0 are the minimum safety distances in the horizontal and vertical directions respectively, T0 is the safety reaction and braking time, vobsi is the speed of the obstacle,
${\Delta } $ ${\Delta } $ The safety risk increases when the vehicle is closer to the lane boundary, so the road boundary material potential field should be inversely proportional to the relative distance between the main vehicle and the road boundary:
${U}_{RPF}(X,Y)=\dfrac{{\kappa }_{R}}{{\|X-{x}_{R},Y-{y}_{R}\|}^{2}} $ (17) Among them, kR is the electric field intensity coefficient of the road, xR and yR are the horizontal and vertical coordinates of the lane boundary line. The final defined ORPF function is:
${U}_{\mathrm{O}\mathrm{R}\mathrm{P}\mathrm{F}}=\sum _{i}{U}_{oPF,i}+\sum _{j}{U}_{RPF} $ (18) Considering the driver's operating intention and the vehicle driving environment, the objective function of MPC is set as follows:
$ \begin{split}J=\;&Q\sum _{i=0}^{{N}_{p}-1}{\left(\eta (t+i|t)-{\eta }_{ref}(t+i\left|t\right)+{E}_{d}\right)}^{2}+\\& R\sum _{i=0}^{{N}_{p}-1}{\left({\Delta }{U}_{m}(t+i|t)\right)}^{2}+\sum _{i=0}^{{N}_{p}-1}{U}_{\mathrm{O}\mathrm{R}\mathrm{P}\mathrm{F}}(t+i|t)+\rho {\text ϵ}^{2}\end{split} $ (19) Due to the delayed and often unreasonable steering inputs by the driver while driving in a distracted state, significant path-tracking deviations can occur. When the driver recovers from distraction, they must promptly adjust the vehicle's steering angle to return to the desired path, resulting in notable increases in the vehicle's yaw rate and lateral velocity. Considering that visual distraction reduces the vehicle's lateral stability, an envelope constraint is set in the controller to maintain vehicle safety and prevent loss of stability due to skidding[32].
By setting the rear wheel slip angle constraint as αr,min ≤αr ≤ αr,max and combining Eqns (1)−(4), the constraint on yaw rate is derived, corresponding to regions 2 and 4 in Fig. 4:
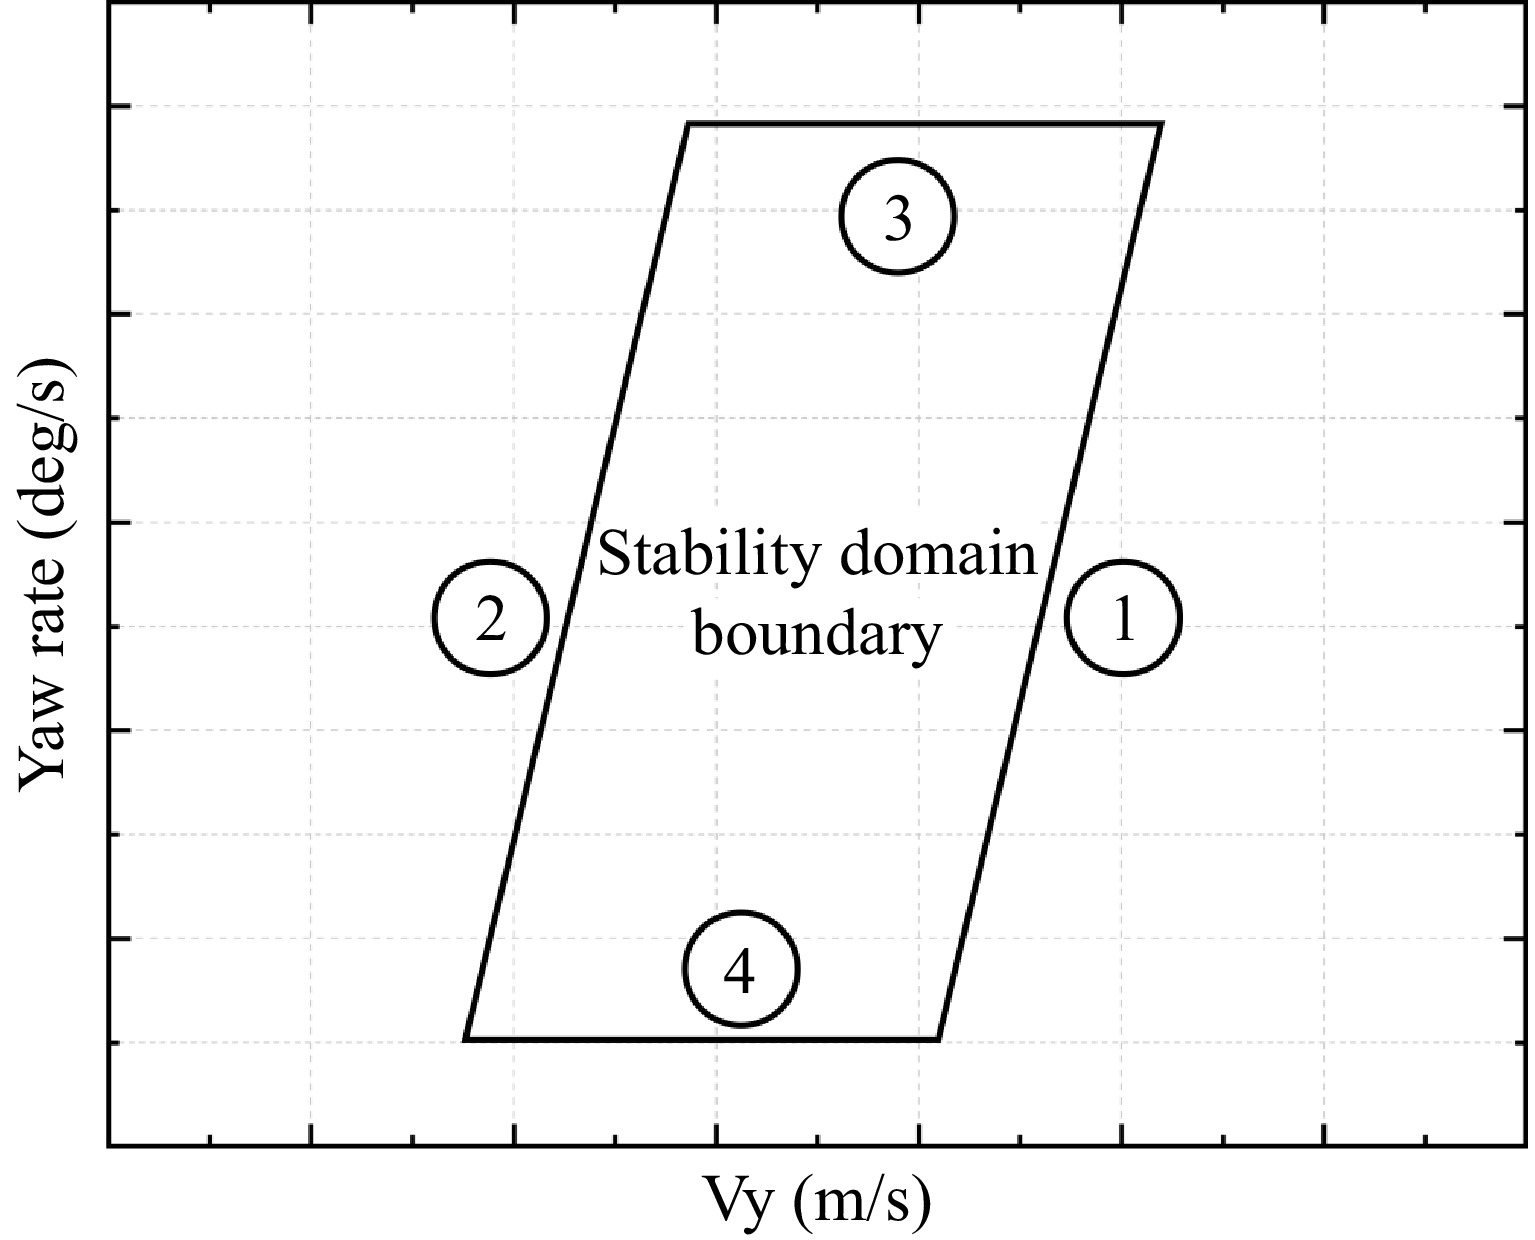
Figure 4.
Stable envelope constraints.
$ {\dot{\varphi }}_{lim,max}=\left(\dfrac{{\overline{C}}_{ar}{\alpha }_{r,max}\left(1+{l}_{a}/{l}_{b}\right)}{m\dot{x}}\right) $ (20) Combining Eqn (5) yields the constraint on lateral velocity, corresponding to the boundaries 1 and 3 in Fig. 4:
$ {\alpha }_{r,min}\le \dfrac{\dot{y}-{l}_{\mathrm{a}}\dot{\varphi }}{\dot{x}}\le {\alpha }_{\mathrm{r},\mathrm{m}\mathrm{a}\mathrm{x}} $ (21) Writing Eqns (20) and (21) in matrix form:
$ {D}_{lim}=\left[\begin{array}{cccccc}{\alpha }_{\mathrm{r},\mathrm{m}\mathrm{a}\mathrm{x}}& 0& 0& {l}_{a}& 0& 0\\ 0& 0& 0& 1& 0& 0\end{array}\right]{s}_{lim}=\left[\begin{array}{c}{v}_{y,max}\\ {\dot{\varphi }}_{lim,max}\end{array}\right] $ (22) Further expressed as:
$ {-s}_{lim}\le {D}_{lim\left(t\right)}{X}_{\left(t\right)}\le {s}_{lim}$ (23) Simultaneously, constraints are imposed on the control inputs and control increments:
${U}_{\mathrm{m},\mathrm{m}\mathrm{i}\mathrm{n}}\le{U}_{m}\le{U}_{\mathrm{m},\mathrm{m}\mathrm{a}\mathrm{x}}\Delta {U}_{\mathrm{m},\mathrm{m}\mathrm{i}\mathrm{n}}\le\Delta {U}_{m}\le\Delta {U}_{\mathrm{m},\mathrm{m}\mathrm{a}\mathrm{x}} $ (24) The final controller constraints are:
$ \left\{\begin{array}{l}{U}_{m,min}\le{U}_{m}\le{U}_{m,max}\\ \Delta {U}_{m,min}\le\Delta {U}_{m}\le\Delta {U}_{m,max}\\ \left|{D}_{lim\left(t\right)}{X}_{\left(t\right)}\right|\le {s}_{lim}\end{array}\right. $ (25) Converting these equations into matrix form for the controller inputs[10,25,33]:
$ \left[\begin{array}{c}{\delta }_{f,min}\\ {\delta }_{f,min}\\ \vdots\\ {\delta }_{f,min}\end{array}\right]\le\left[\begin{array}{c}{u}_{m}\left(k\right)\\ {u}_{m}\left(k+1\right)\\ \vdots\\ {u}_{m}\left(k+{N}_{p}-1\right)\end{array}\right]\le\left[\begin{array}{c}{\delta }_{f,m\alpha n}\\ {\delta }_{f,m\alpha n}\\ \vdots\\ {\delta }_{f,m\alpha n}\end{array}\right] $ $ \left[\begin{array}{c}{\Delta \delta }_{f,min}\\ \Delta {\delta }_{f,min}\\ \vdots\\ \Delta {\delta }_{f,min}\end{array}\right]\le\left[\begin{array}{c}\Delta {u}_{m}\left(k\right)\\ \Delta {u}_{m}\left(k+1\right)\\\vdots\\ \Delta {u}_{m}\left(k+{N}_{p}-1\right)\end{array}\right]\le\left[\begin{array}{c}{\Delta \delta }_{f,min}\\ \Delta {\delta }_{f,min}\\ \vdots\\ {\Delta \delta }_{f,min}\end{array}\right] $ thus:
$ \left[\begin{array}{c}I\\ -I\end{array}\right]{U}_{m}\left(k\right)\le {U}_{m,max} $ $ \left[\begin{array}{c}I\\ -I\end{array}\right]\Delta {U}_{m}\left(k\right)\le {\Delta U}_{m,max} $ Similarly, the envelope constraint matrix can be transformed into:
$ {-S}_{lim}\le\overline{P}\chi +{\overline{T}}_{m}{U}_{m}+{\overline{V}}_{h}{U}_{h}\le{S}_{lim} $ (26) where,
$\overline{P} =\underbrace {\begin{bmatrix} D_{\text{lim}} \overline{A} \\ D_{\text{lim}} \overline{A}^2 \\ D_{\text{lim}} \overline{A}^3 \\ \vdots \\ D_{\text{lim}} \overline{A}^{N_p} \end{bmatrix}}_{6 \times N_p \times 6} \quad \overline{V}_{\delta} = \underbrace{\begin{bmatrix} D_{\text{lim}} \overline{B}_h \\ D_{\text{lim}} (\overline{A} \overline{B}_h + \overline{B}_h) \\ D_{\text{lim}} (\overline{A}^2 \overline{B}_h + \overline{A}^2 \overline{B}_h + \overline{B}_h) \\ \vdots \\ \sum_{k=0}^{N_p-1} D_{\text{lim}} (\overline{A}^k \overline{B}_h) \end{bmatrix}}_{6 \times N_p \times 1} $ ${ {\overline{T}}_{m}=\underbrace {{\left[\begin{array}{cccccc}{D}_{lim}{\overline{B}}_{m}& 0& \cdots & \cdots & \cdots & 0\\ {D}_{lim}\overline{A}{\overline{B}}_{m}& {D}_{lim}{\overline{B}}_{m}& 0& \cdots & \cdots & 0\\ {D}_{lim}{\overline{A}}^{2}{\overline{B}}_{m}& {D}_{lim}\overline{A}{\overline{B}}_{m}& {D}_{lim}{\overline{B}}_{m}& 0& \cdots & 0\\ \vdots& \ddots & \ddots & \ddots & \ddots & \vdots\\ {{D}_{lim}\overline{A}}^{{N}_{p}-2}{\overline{B}}_{m}& \cdots & & {D}_{lim}\overline{A}{\overline{B}}_{m}& {D}_{lim}{\overline{B}}_{m}& 0\\ {D}_{lim}{\overline{A}}^{{N}_{p}-1}{\overline{B}}_{m}& \cdots & \cdots & & {D}_{lim}\overline{A}{\overline{B}}_{m}& {D}_{lim}{\overline{B}}_{m}\end{array}\right]}}_{6\times {N}_{P}\times {N}_{P}}} $ Here, uh represents the driver's input at each sampling instant, and Um represents the controller's input within the prediction horizon, expressed specifically as:
${U}_{m}=\left[{u}_{h}\left(k\right){u}_{h}\left(k+1\right){u}_{h}\left(k+2\right)\cdots {u}_{h}\left(k+{N}_{p}-1\right)\right] $ (27) The final constraint matrix for the controller is:
$\left[\begin{array}{c}{\overline{T}}_{m}\\ {\overline{T}}_{m}\\ I\\ -I\\ I\\ -I\end{array}\right]{U}_{m}\left(k\right)\le \left[\begin{array}{c}{S}_{lim}-\overline{P}\chi -{\overline{V}}_{h}{U}_{h}\\ {S}_{lim}-\overline{P}\chi -{\overline{V}}_{h}{U}_{h}\\ {U}_{m,max}\\ {U}_{m,max}\\ {\Delta U}_{m,max}\\ {\Delta U}_{m,max}\end{array}\right]$ (28) Human-machine authority allocation based on fuzzy control
-
How to allocate steering authority and how the auxiliary system should apply control inputs are key issues in human-machine cooperative control. This section proposes a dynamic steering control authority allocation method based on fuzzy control, considering road environment and driver behavior. The road environment is comprehensively evaluated using the vehicle's lateral risk (Lr) and longitudinal risk (Lonr), while the driver's distraction level (Cona) is assessed based on the difference between the driver's control input and the controller's output. The normalized values of these three variables are used as inputs to the fuzzy controller, which outputs a control cooperation factor.
The vehicle's steering action at this point is:
$ {\delta }_{a}={\lambda }_{LLC}{\delta }_{m}+\left(1-{\lambda }_{LLC}\right){\delta }_{h} $ (29) where, δh is the driver's control input, δm is the controller's input, λLLC is the control cooperation factor considering the road driving environment and the driver's steering action, and δa is the final vehicle control amount resulting from the combined efforts of the driver and the controller.
The road environment assessment is performed using real-time data on lateral and longitudinal risks. This data, which includes the speed and relative position of surrounding vehicles, is collected using advanced sensors and algorithms. Driving risk is evaluated using Time-to-Collision (TTC) for longitudinal risk and the vehicle's lateral offset for lateral risk.
The lateral risk is measured by the vehicle's lateral offset and quantified using the road width information. The lateral risk coefficient increases in stages with the lateral offset. When the vehicle's offset is within 0.1 meters, it is considered safe. Between 0.1 and 0.3 m, the lateral risk increases with the offset. When the offset reaches 0.3 to 0.45 m, the lateral risk remains at 0.5. However, if the offset continues to increase beyond 0.45 m, the lateral risk increases further until it reaches 1.0 at an offset of 0.7 m, indicating the vehicle is at the road edge and at maximum lateral risk. The lateral risk formula is set as follows:
$ {L}_{r}=\left\{\begin{array}{l}00.1 \gt {y}_{L}\ge 0\\ -0.25+2.5{y}_{L}0.3 \gt {y}_{L}\ge 0.1\\ 0.50.45 \gt {y}_{L}\ge 0.3\\ -0.4+2{y}_{L}0.7 \gt {y}_{L}\ge 0.45\\ 1{y}_{L}\ge 0.7\end{array}\right. $ (30) $ {}_{} $ Time-to-Collision (TTC) is widely used in driving risk assessment. To make longitudinal risk increase with decreasing TTC, the inverse of TTC (TTCi) is used as the longitudinal risk indicator. TTCi intuitively represents the interaction between the vehicle and its surroundings, especially the relative motion and potential collision risk with the vehicle ahead. A higher TTCi indicates a shorter time to collision and thus a higher longitudinal risk. The formula for TTCi is as follows:
$ TTCi=\left\{\begin{array}{l}\dfrac{{v}_{rel}}{{D}_{rel}-{d}_{0}}{a}_{rel}=0\\ \\ \dfrac{{a}_{rel}}{-{\nu }_{rel}+\sqrt{{\nu }_{rel}^{2}+2{a}_{rel}\left({D}_{rel}-{d}_{0}\right)}}\;\;{a}_{rel}\ne 0\end{array}\right. $ (31) where, Drel is the relative distance between two vehicles, d0 is the safe stopping distance, and vrel is the relative speed between the two vehicles. TTC is a dynamic metric that can be influenced by many factors, including vehicle speed, road conditions, and driver reaction time. Many studies in the field of vehicle safety have set standards or recommended values for TTC based on different driving environments. It is generally considered safe when the TTC value is above 2 s, high risk when below 2 s, a warning may be issued when in the range of 1.5 to 2 s to remind the driver to take action, and collision is deemed imminent when TTC is below 1 s requiring immediate avoidance measures[34−37]. Considering the curved road setting in this study, the TTC is set to 2.6 s to allow the driver to maintain autonomous control within a safe distance without unnecessary interference. In the range of 1.6 to 2.6 s, potential hazards need to be addressed with preventive measures instead of suddenly increasing the controller authority which could cause anxiety. When TTC is less than or equal to 0.6 s, the system should take immediate action to minimize collision consequences to the greatest extent. This setting ensures rapid response in emergencies to protect driver and passenger safety.
The equation for setting Lonr is as follows:
$Lo{n}_{r}=\left\{\begin{array}{l}0TTCi\le \dfrac{1}{2.6}\\ \left(TTCi-\dfrac{1}{2.6}\right)\times \dfrac{0.5}{\left(\dfrac{1}{10}-\dfrac{1}{20}\right)}\dfrac{1}{2.6} \lt TTCi\le \dfrac{1}{1.6}\\ 0.5+\left(TTCi-\dfrac{1}{1.6}\right)\times \dfrac{0.5}{\left(\dfrac{1}{0.6}-\dfrac{1}{1.6}\right)}\dfrac{1}{1.6} \lt TTCi\le \dfrac{1}{0.6}\\ 1TTCi \gt \dfrac{1}{0.6}\end{array}\right. $ (32) The driver's distraction is evaluated based on the deviation of the driver's output from the controller's output, which increases with the duration of distraction. This deviation is represented by the difference between the driver's output angle and the desired angle. The distraction level function (Cona) is designed as follows:
$ Co{n}_{a}=\left\{\begin{array}{l}0,|{\delta }_{h}-{\delta }_{m}|=0\\ \dfrac{\left|{\delta }_{h}-{\delta }_{m}\right|}{|{\delta }_{h}-{\delta }_{m}{|}_{max}}, 0 \lt |{\delta }_{h}-{\delta }_{m}| \lt |{\delta }_{h}-{\delta }_{m}{|}_{max}\\ 1,|{\delta }_{h}-{\delta }_{m}| \gt |{\delta }_{h}-{\delta }_{m}{|}_{max}\end{array}\right. $ (33) The normalized driver distraction and driving risk values are used as inputs to the fuzzy controller. The fuzzy subsets for Lr, Lonr, and Cona are [S, MS, M, MD, D], representing small, moderately small, medium, moderately large, and large states, respectively. The input variables use triangular membership functions. The output variable is the cooperation factor, with fuzzy subsets [S, MS, M, MD] representing small, moderately small, medium, and moderately large states. The normalized driver distraction and driving risk values are used as inputs to the fuzzy controller. The fuzzy subsets for Lr, Lonr, and Cona are [S, MS, M, MD, D], representing small, moderately small, medium, moderately large, and large states, respectively. The input variables use triangular membership functions. The output variable is the cooperation factor, with fuzzy subsets [S, MS, M, MD] representing small, moderately small, medium, and moderately large states. The principle for adjusting the collaborative control factors is as follows: To ensure driver comfort, the fuzzy rules are primarily based on the driver's state while also considering vehicle safety. When the driver is not distracted, no auxiliary control is needed, and the cooperation factor is zero. When the driver is slightly distracted, the auxiliary control effort is determined by the vehicle's lateral and longitudinal risks, with a preference towards driver comfort. If either risk is low, the cooperation factor is small; if either risk is high, indicating deteriorating vehicle safety, the cooperation factor is large. When both risks are high, indicating the vehicle is on the verge of losing control, the cooperation factor is maximized for immediate correction by the auxiliary controller. When the driver is moderately distracted, the cooperation factor is determined equally by the driver and the auxiliary controller. When the driver is severely distracted, the auxiliary controller's authority is prioritized to maintain vehicle safety. The fuzzy rules for the cooperation factor are shown in Table 1, and the corresponding fuzzy rule surface diagram is shown in Fig. 5.
Table 1. Fuzzy rules.
Cona Lonr Lr S MS M MD D S S S S S S S MS S S S S S M S S S S S MD S S S S MS D S S S MS MS MS S S S S MS MS MS S S S MS MS M S S MS MS M MD S S MS M M D S MS MS M MD M S S S S S MS MS S MS MS M M M S MS MS M M MD S M M MD MD D MS M M MD MD MD S S S MS M M MS S MS M M M M MS M M M M MD MS M M MD M D M M M MD MD D S MS MS MS M M MS MS MS M M M M MS M M M M MD MS M M MD MD D MS M M MD MD 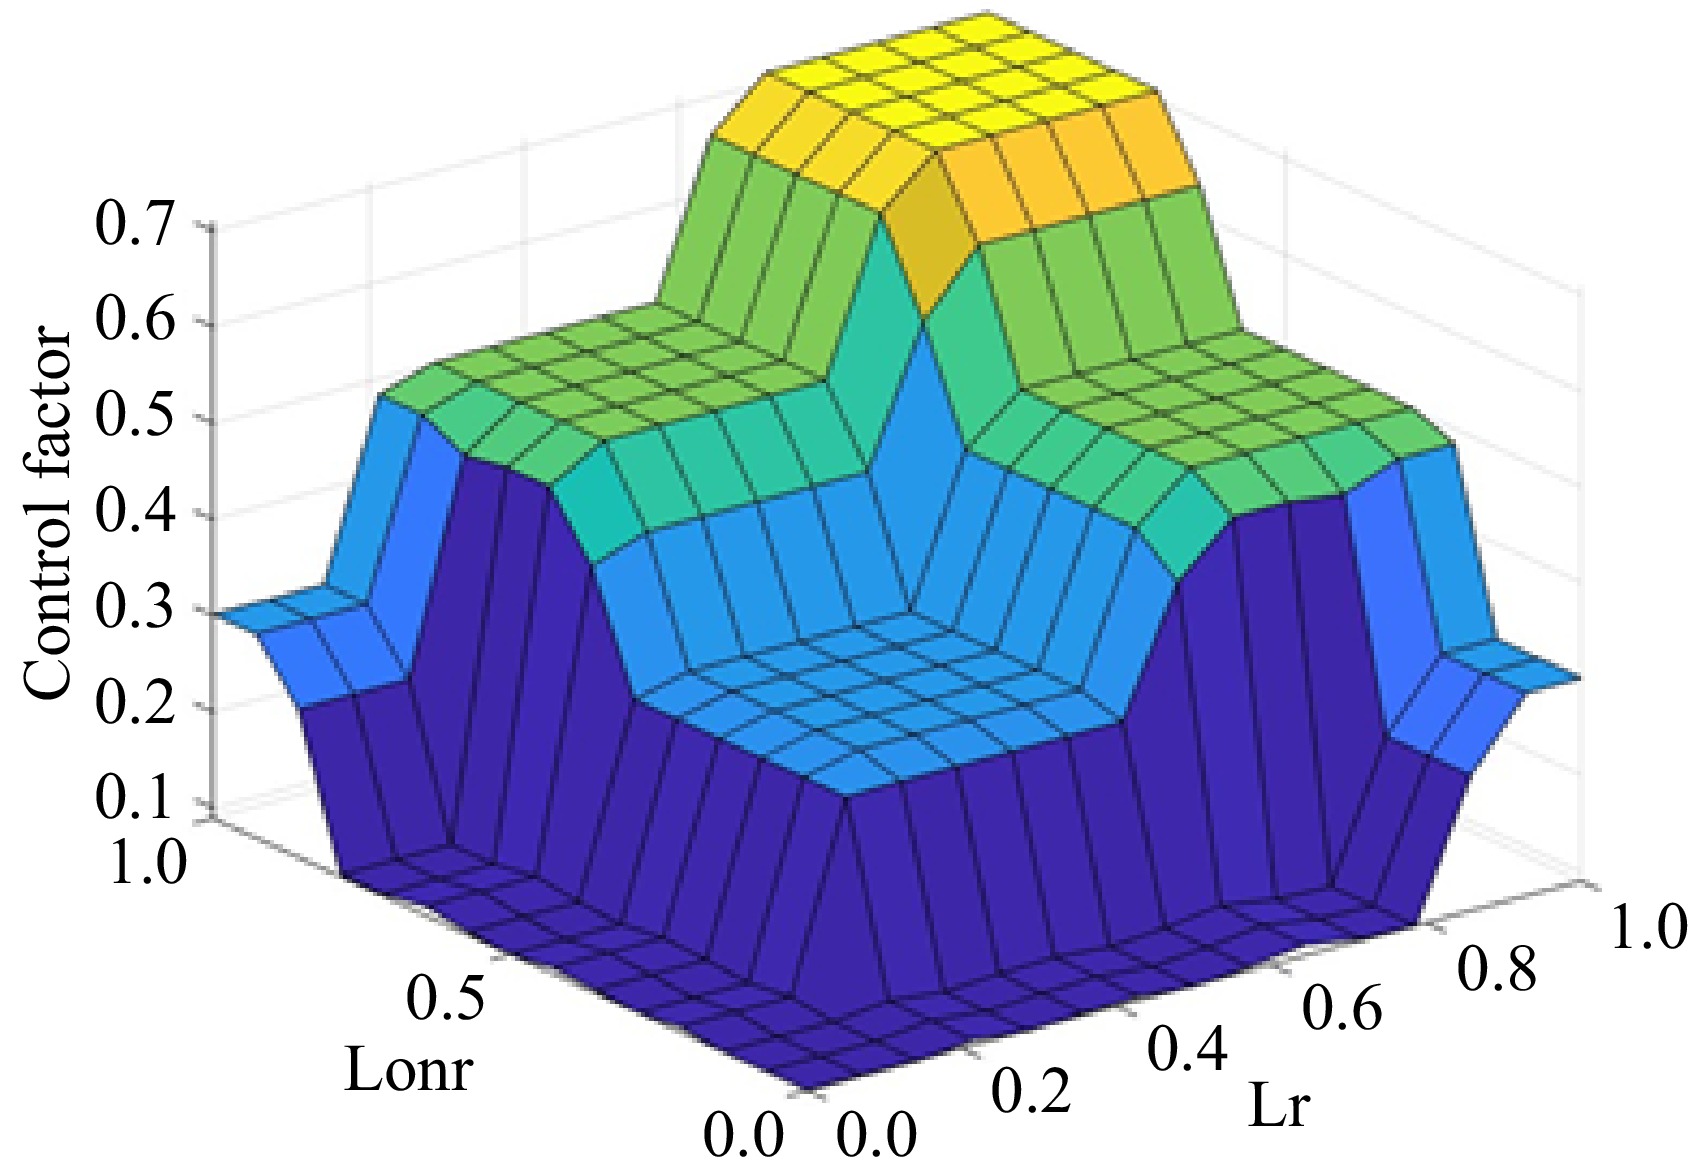
Figure 5.
Fuzzy surfaces of fuzzy rules.
-
In this section, the designed controller and human-machine authority allocation strategy are verified through simulations conducted on the Simulink and CarSim platforms. In Simulink, a distracted driver model, a vehicle-road model, an MPC module considering driver behavior output constraints, and a human-machine authority allocation module is established. In CarSim, an SUV model is selected, and the road model consists of a 50 m straight path, a 200 m radius curve, and a 100 m three-section path. The road has two lanes, each 3.75 m wide, with a friction coefficient of µ = 0.85. A leading vehicle is set to move at 13 m/s in another lane, 50 m ahead of the test vehicle, which overtakes it after 12 s. The parameters used in the experiment are shown in Table 2.
Table 2. Parameters in the experiment.
Notation Meaning Value m Vehicle mass 1,624 (kg) Iz Yaw moment of inertia 2,059.2 (kg·m2) a Distance to front axle 1.05 (m) b Distance to rear axle 1.61 (m) Sf Front slip ratio 0.2 Sr Rear slip ratio 0.2 Ccf/Clf Front cornering stiffness ratio 66,900 (N/rad) Ccr/Clr Rear cornering stiffness ratio 62,700 (N/rad) yL Preview distance 14.5 (m) tp Driver preview time 0.9 (s) th Driver reaction time 0.6 (s) td Neural time delay 0.3 (s) Vy Longitudinal velocity 60 (km/s) T Sampling time 0.025 (s) Np Prediction horizon 30 Q Output weighting matrix diag (250, 200, 100, 10) R Control weight 100 H Driver weight 2 Figure 6a shows the steering angle performance of the driver and the controller before and after adding fuzzy control. Without the fuzzy controller, the driver's steering operation exhibits significant overshoot and subsequent oscillation due to reaction delay during cornering. Although the designed MPC considering driver behavior maintains a smaller steering angle, it still shows slight oscillation due to the driver's steering input. After adding the fuzzy controller, the driver's steering angle reduces without overshoot and oscillation, and the controller's steering input becomes more stable, eliminating oscillation. This indicates that the designed controller can mitigate the delayed steering actions of the driver, making the steering operation more stable and safer. To further verify the performance of the proposed controller, human-machine conflict evaluation index Jc1 and driving comfort evaluation index Jc2[12,19] are introduced to compare the changes of each index before and after adding the proposed controller for each sampling period. The current corner steering trend is represented by the corner slope, and the difference in corner slope between the driver and the controller is calculated Jc1. When the steering angle slopes of the driver and the controller are similar, it means that the steering intentions of the two are consistent, and the human-machine conflict is considered to be minimal; when the signs of the steering angle slopes of the two are opposite, it means that the steering intentions of the driver and the controller are in conflict, and the human-machine conflict is considered to be the largest. The speed of vehicle steering angle change directly affects the overall comfort of the vehicle, so the absolute value and calculation Jc2 of the driver's and controller's steering angle rates are set. The smaller the corner speed is, the smoother the vehicle is driving and the better the comfort. The angle difference between the driver and the controller best reflects the output difference between the two. When the difference is larger, the shared controller output has a greater impact on the final result, and the final output angle deviates further from the driver's angle. Therefore, the intervention degree evaluation index Jc3 is set to visually display the intervention of the shared controller on the driver. As shown below:
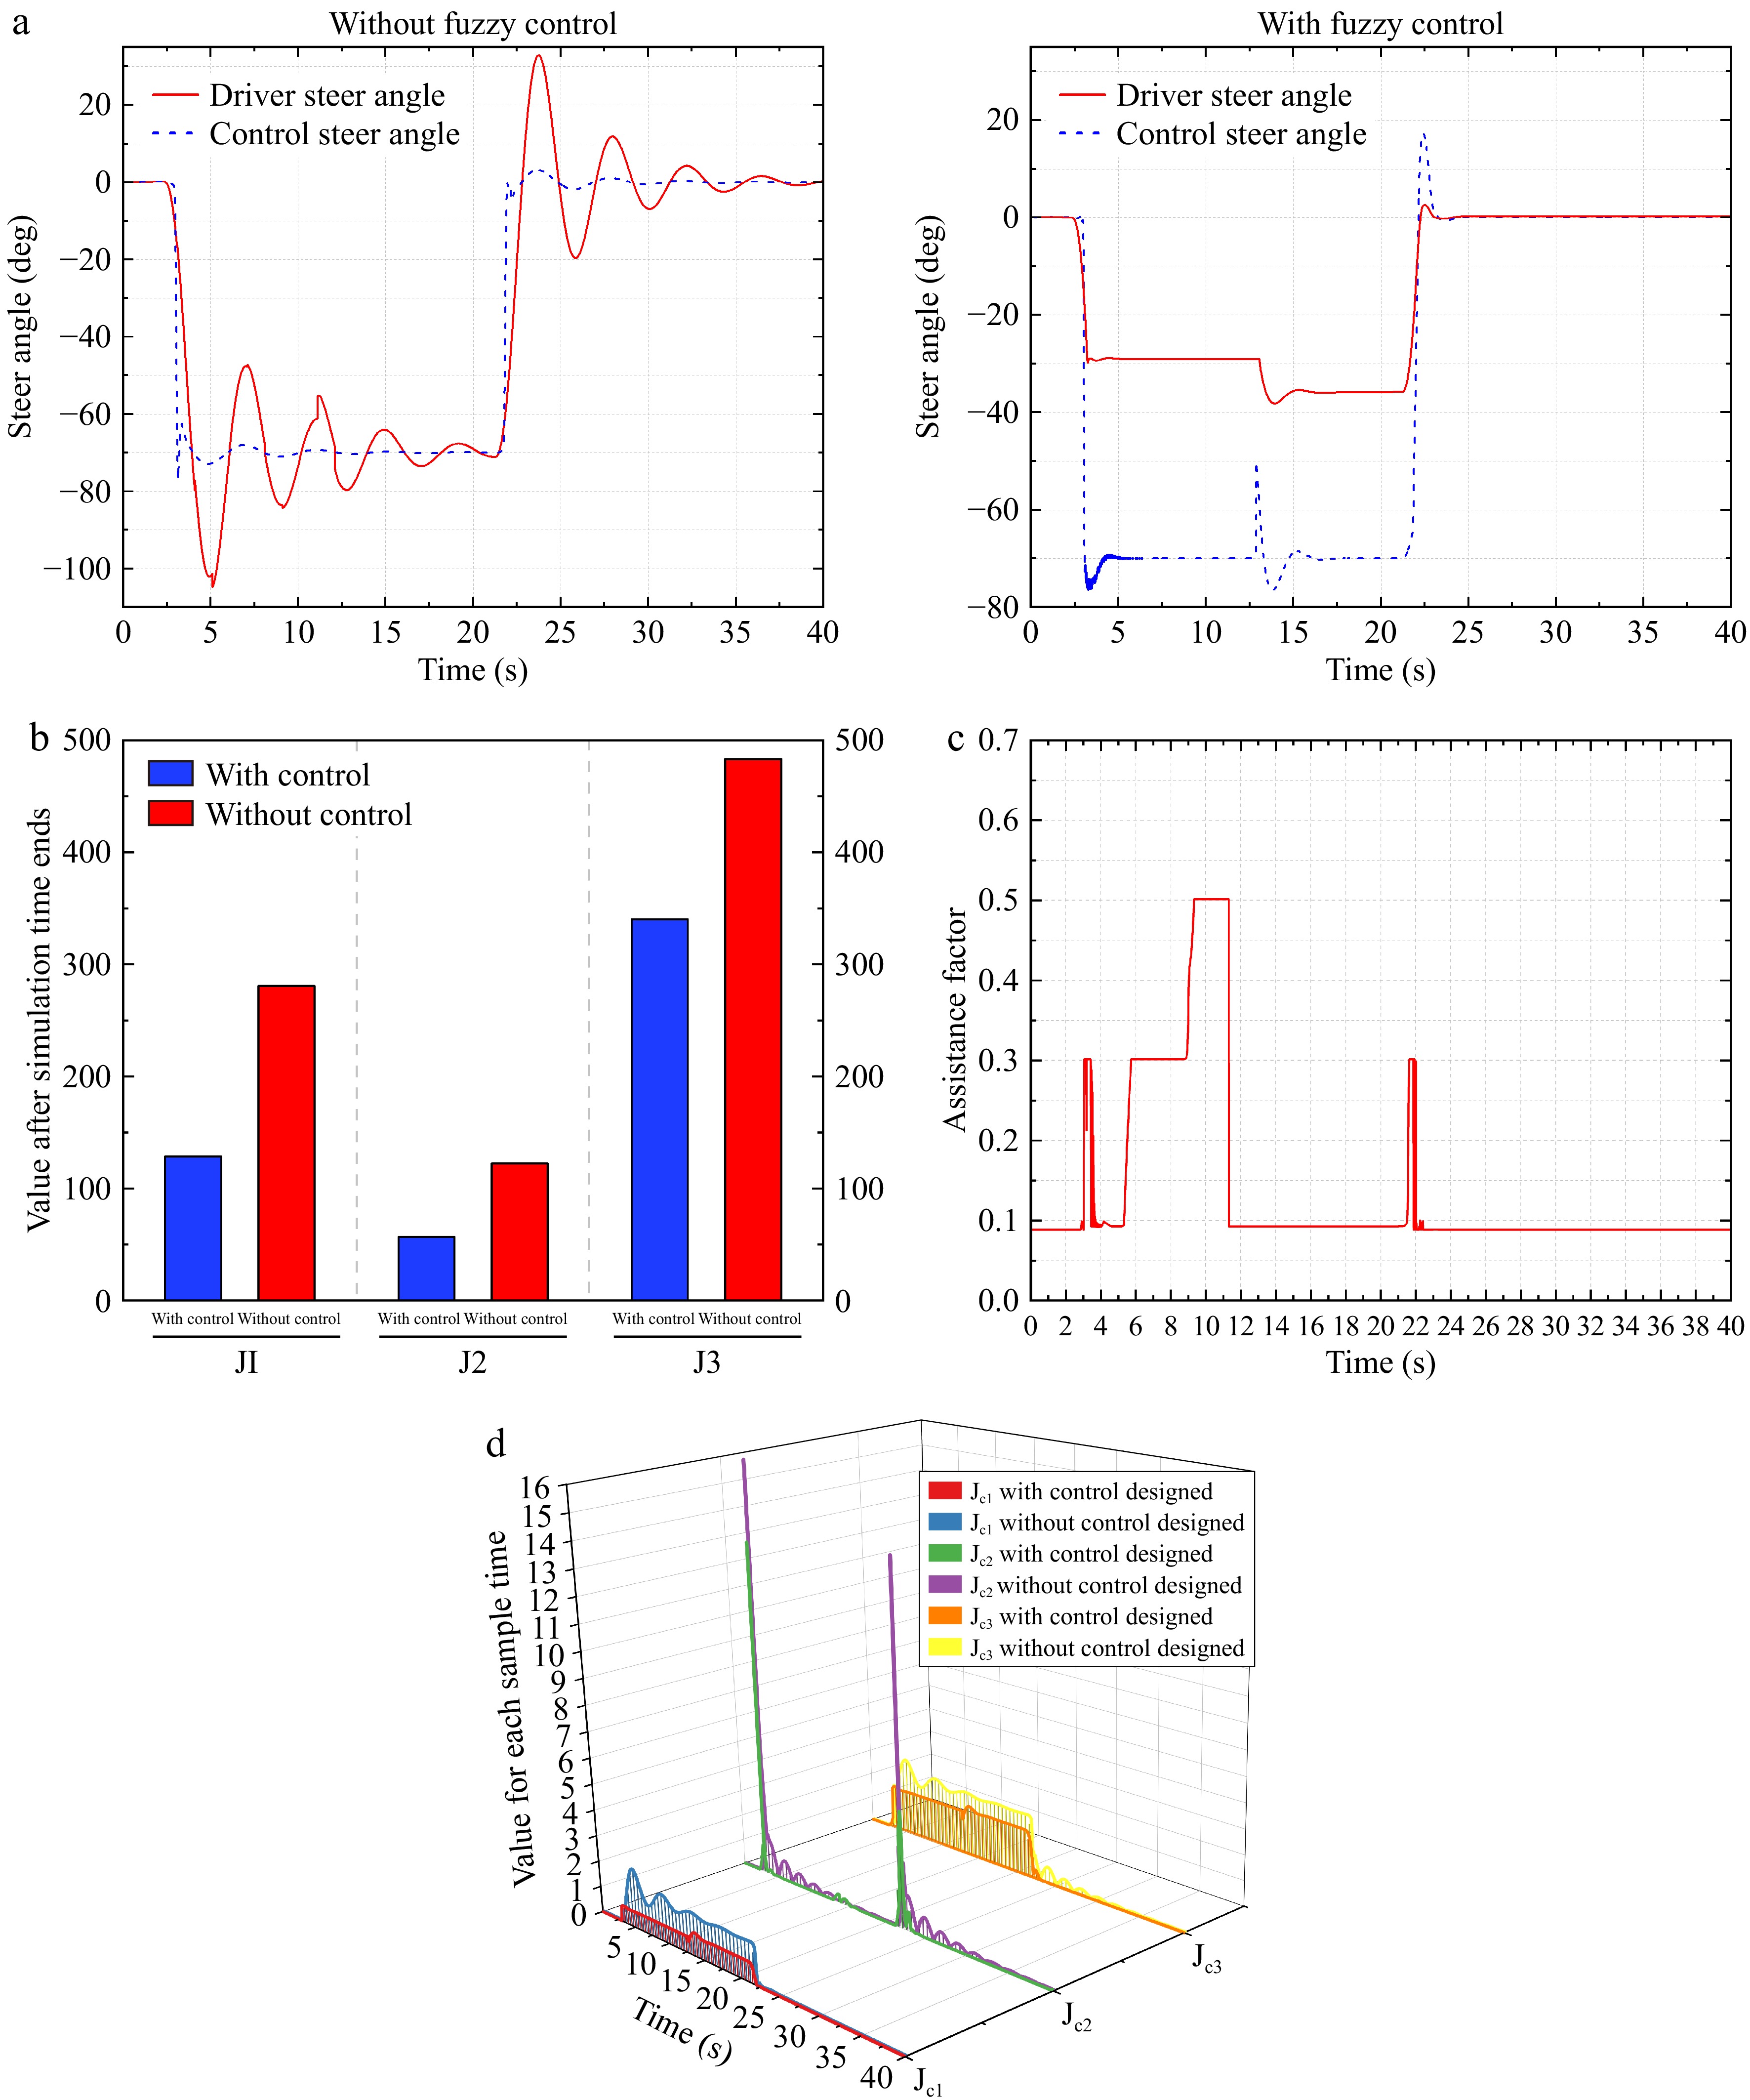
Figure 6.
Experimental results of the curved road scenario.
$ {J}_{c1}={\int }_{t}^{t+T}|{\dot{\delta }}_{h}-{\dot{\delta }}_{m}|dt $ $ {J}_{c2}={\int }_{t}^{t+T}{\left|{\dot{\delta }}_{m}\right|}_{}+\left|{\dot{\delta }}_{h}\right|dt $ $ {J}_{c3}=\frac{{\int }_{t}^{t+T}\left|{\delta }_{h}-{\delta }_{m}\right|dt}{T} $ (34) As shown in Fig. 6b, the addition of the proposed shared controller reduced the human-machine conflict by 54%. This indicates that the proposed strategy for switching control authority between man and machine can mitigate the problem of generating more conflicts with the steering assist system due to excessive steering actions by the driver. At the same time, since the controller can correct inappropriate steering operations, the driving comfort for the driver has been improved by 50% as the lateral behavior is stabilized. Since the driver's operating intention is taken into account when setting the controller and the driving authority allocation strategy, the intervention of the shared controller on the driver is reduced, and the degree of intervention of the shared controller on the driver is reduced by 42%. Figure 6d shows the changes in the three evaluation indicators in each sampling period in detail. It is worth noting that at 12 s, because the vehicle must maintain an appropriate safe distance from the approaching vehicle when overtaking, the steering assistance system increases the control authority of the shared controller. The index Jc2 is higher than the steering assistance system without a fuzzy controller in a short period of time.
Figure 6c depicts the variation of the cooperation factor. At around 3 s, during corner entry, the significant difference between the driver's steering input and the controller's steering input, along with the substantial lateral offset, results in a cooperation factor of 0.3, although the collision risk is relatively low. By 3.5 s, the lateral deviation has decreased to a small level, and the cooperation factor is reduced to its minimum. To ensure that the controller remains active in the control loop, the cooperation factor cannot be 0. Between 5.3 and 8.9 s, the collision risk begins to increase to a relatively dangerous level, and the cooperation factor is kept at 0.3. Subsequently, from 8.9 to 11.3 s, the collision risk reaches its peak, prompting the cooperation factor to adjust to 0.5 to steer the vehicle away from the adjacent car. Afterward, the vehicle's state stabilizes, and the cooperation factor is reduced to its minimum. At 22 s, while exiting the curve, the difference between the driver's steering input and the controller's steering angle increases, along with a rise in lateral deviation. Consequently, the cooperation factor is raised back to 0.3. The lateral offset scenario is illustrated in Fig. 7a.
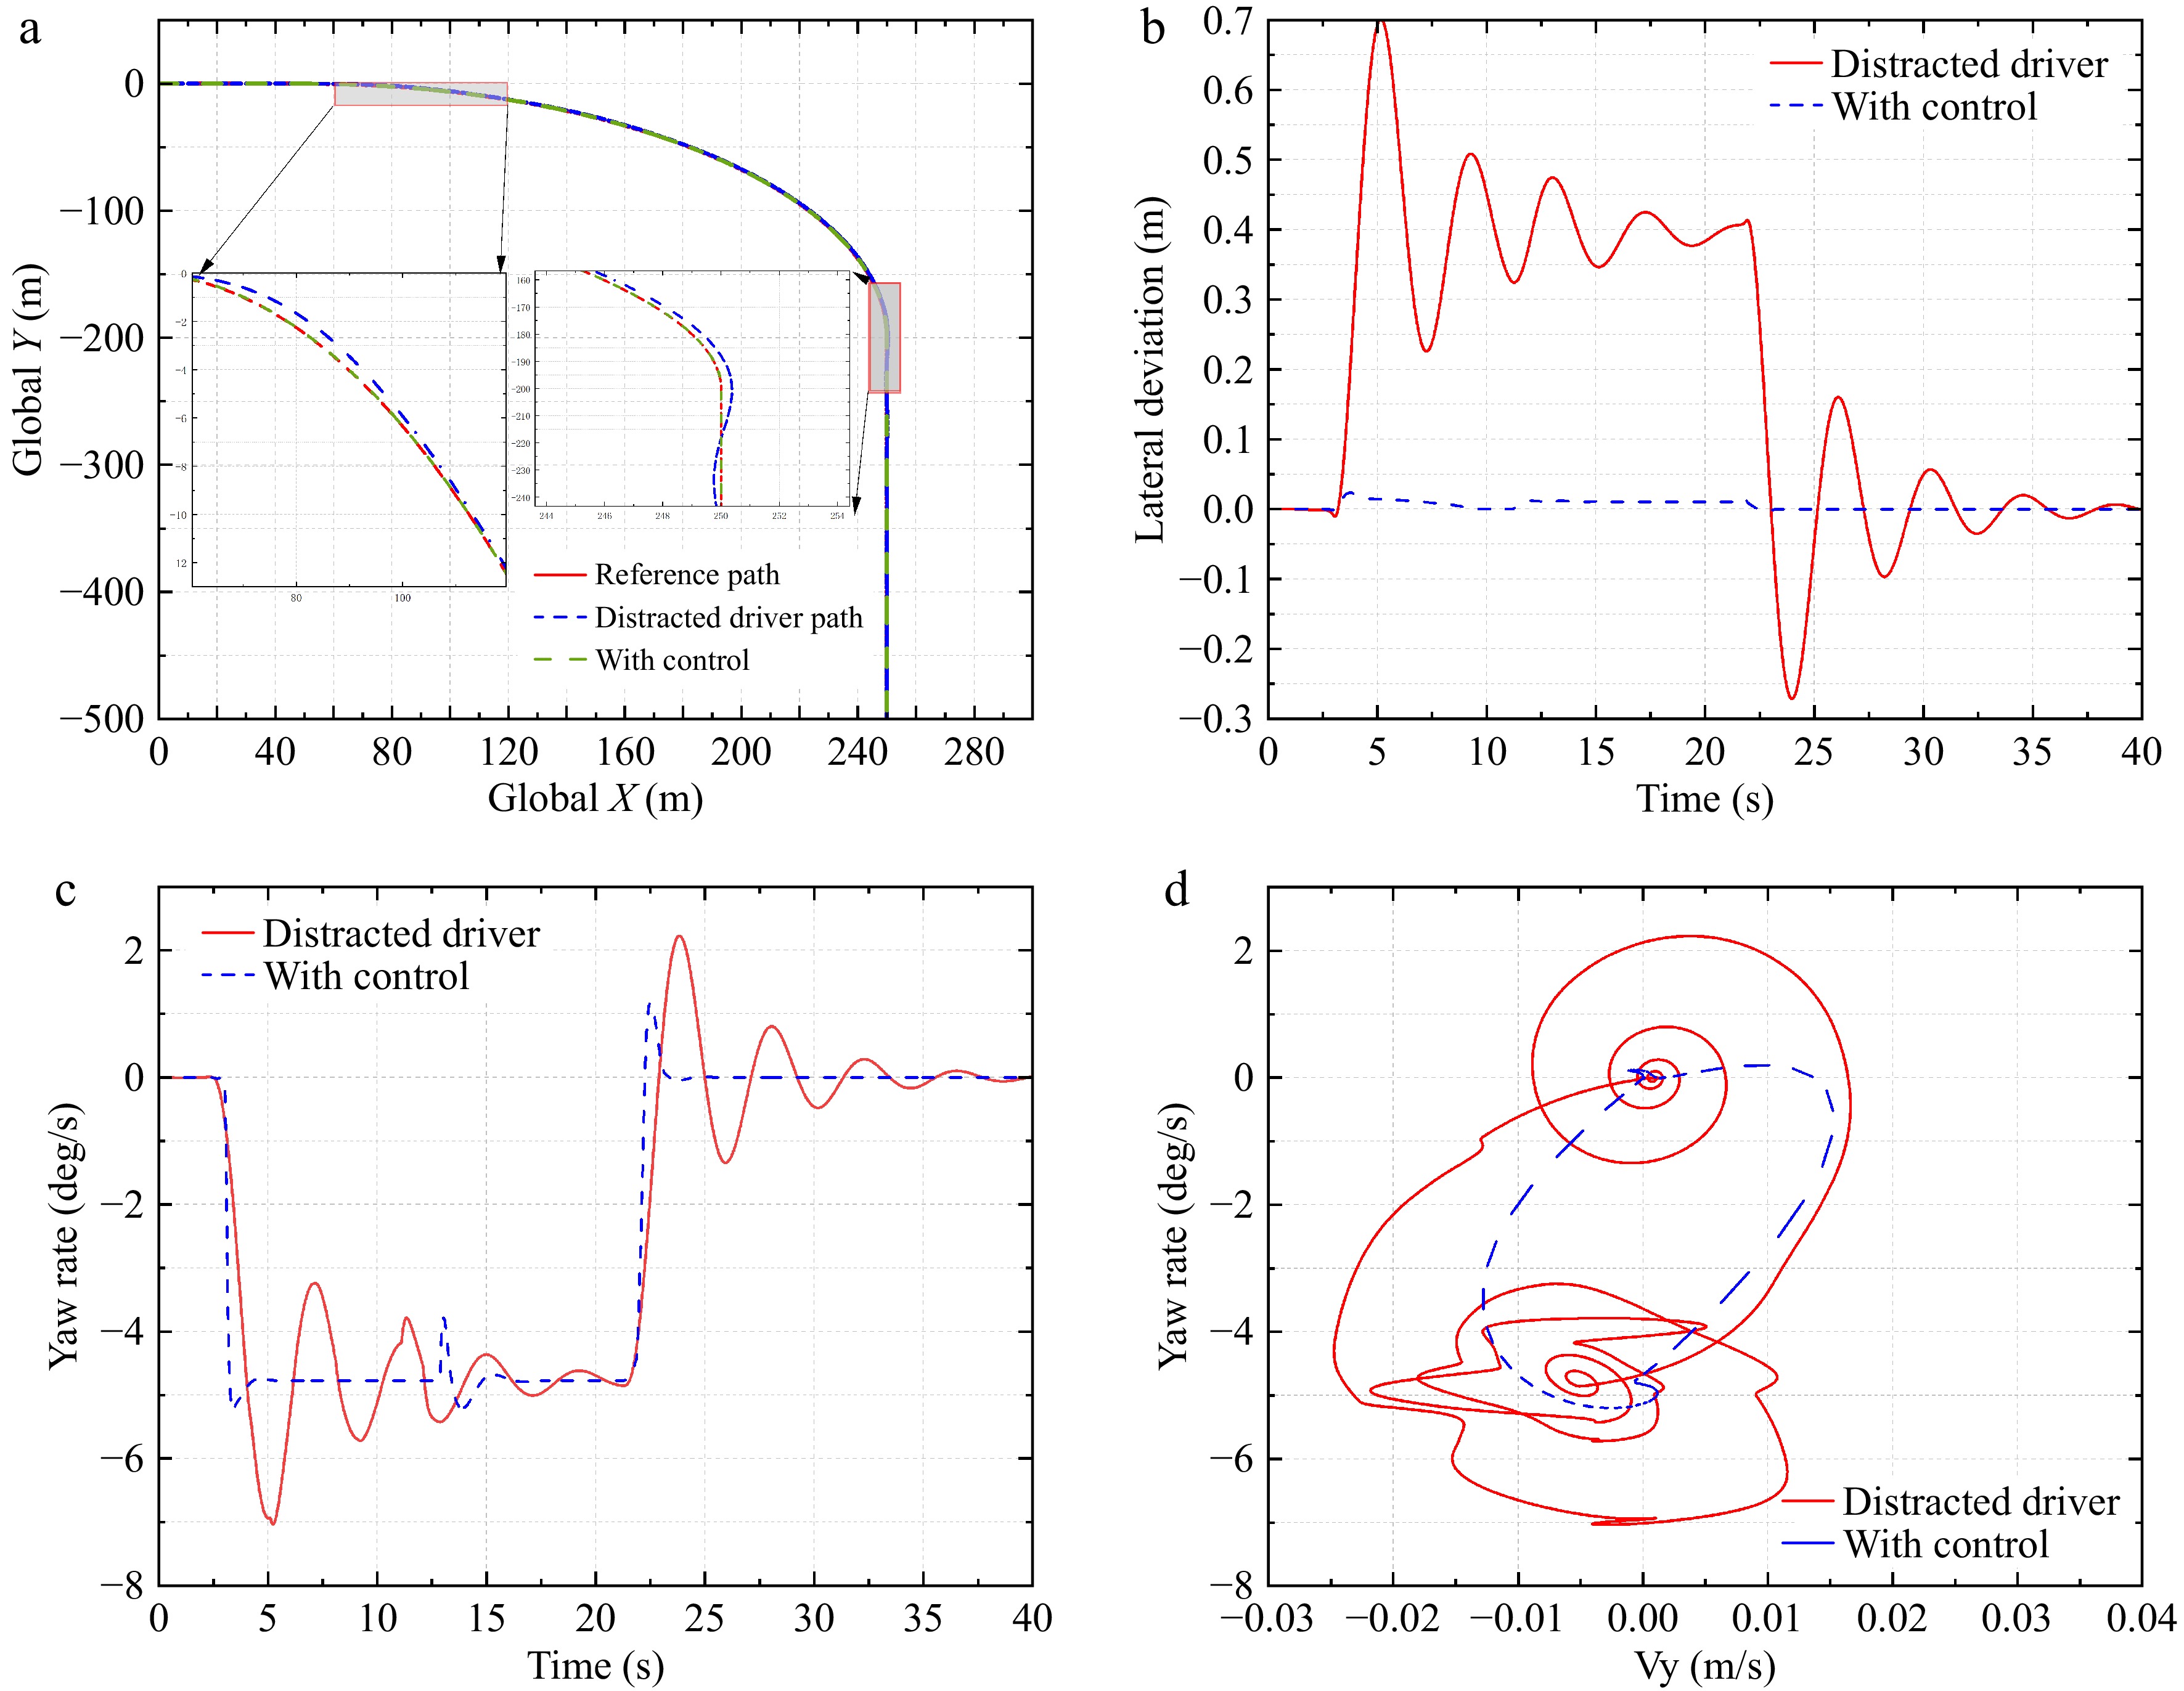
Figure 7.
Experimental results of a curved road scenario.
Figure 7a shows the vehicle's trajectory y with and without the controller's assistance. It is evident that with a distracted driver alone, the vehicle significantly deviates from the target trajectory during cornering and experiences overshoot when exiting the curve. With the designed shared controller, the vehicle can consistently track the reference trajectory.
Figure 7b demonstrates the vehicle's trajectory before and after the addition of the controller. The driver exhibits significant deviations during both corner entry and exit, and due to delayed reactions, oscillations occur around 10 s. The maximum lateral deviation reaches 0.7 m at 5 s into the curve and −0.27 m at 22 s when exiting the curve. With the controller, the maximum lateral deviation reduces to 0.023 m at 3.7 s into the curve and 0.0125 m at 21.9 s. At 12 s, since the main vehicle has to overtake the vehicle in the adjacent lane, the lateral risk increases, and the controller assists the driver to correct the deviation in advance to prevent it from getting too close to other vehicles. The results indicate that the designed controller improves vehicle tracking accuracy and reduces collision risk.
Figure 7c shows that at around 3 s, the driver's yaw rate fluctuates during corner entry, peaking at 0.124 rad/s. With the designed controller assisting the distracted driver, the maximum yaw rate during corner entry reduces to 0.095 rad/s. Similarly, the peak yaw rate at the curve exit is 0.037 rad/s without the controller and only 0.0157 rad/s with the controller. This demonstrates that the designed controller provides better driving stability and comfort. Figure 7d illustrates the lateral stability of the vehicle. The vehicle driven by the distracted driver exhibits significant variations in yaw rate and lateral speed, especially in yaw rate. In contrast, the vehicle with the controller consistently operates within a stable range.
-
This paper proposes a shared control approach that accounts for the operating characteristics of distracted drivers, facilitating the allocation of driving authority between the driver and the shared controller to enhance driver safety and comfort. To model distracted drivers' steering behavior, this study integrates findings on distracted driving behavior, adjusting driver model parameters to reflect operational uncertainty.
To ensure both safety and comfort, a multi-constraint model predictive controller (H-ORPF-MPC) is developed, which incorporates driver steering actions and utilizes an artificial potential field-based approach. A vehicle state safety envelope is also implemented to maintain control stability. For human-machine authority allocation, lateral offset and Time-to-Collision index (TTCi) serve as road safety risk assessment indicators, while the difference between the driver's output angle and the expected angle is used to gauge driver distraction. These indicators are normalized, fuzzified, and coordinated through a fuzzy control mechanism to achieve an optimal collaboration factor.
Future research will focus on exploring additional methods to represent driver behavior more comprehensively, incorporating dynamic driver status into controller design and driving authority allocation strategies to better adapt to varying driver conditions.
This work was supported in part by the projects of the National Natural Science Foundation of China (62376059), in part by projects of Fujian Provincial Department of Science and Technology (2021Y4019), projects of Fujian Provincial Department of Finance (GY-Z230007), and in part by the project of Fujian University of Technology (GY-Z160064).
-
The authors confirm contribution to the paper as follows: conceptualization, methodology, draft manuscript preparation: Liao L, Xing P; software: Xing P; data curation: Xing P; analysis and interpretation of results: Gan Z, Wei X, Liu Y; supervision, project administration, funding acquisition: Liao L. All authors reviewed the results and approved the final version of the manuscript.
-
The datasets generated during and analyzed during the current study are available from the corresponding author on reasonable request.
-
The authors declare that they have no conflict of interest. Lyuchao Liao is the Editorial Board member of Digital Transportation and Safety who was blinded from reviewing or making decisions on the manuscript. The article was subject to the journal's standard procedures, with peer-review handled independently of this Editorial Board member and the research groups.
- Copyright: © 2025 by the author(s). Published by Maximum Academic Press, Fayetteville, GA. This article is an open access article distributed under Creative Commons Attribution License (CC BY 4.0), visit https://creativecommons.org/licenses/by/4.0/.
-
About this article
Cite this article
Liao L, Xing P, Gan Z, Wei X, Liu Y. 2025. Optimizing safety and comfort for distracted drivers via adaptive shared control. Digital Transportation and Safety 4(2): 89−100 doi: 10.48130/dts-0025-0004 

Optimizing safety and comfort for distracted drivers via adaptive shared control
- Received: 08 November 2024
- Revised: 18 December 2024
- Accepted: 05 January 2025
- Published online: 27 June 2025
Abstract: Driver distraction introduces considerable uncertainty in vehicle operation, presenting significant challenges to driving safety and complicating human-machine collaborative control. To address these challenges, this paper proposes a shared control approach to support distracted drivers in maneuvering along extended curves. A model of distracted driver behavior is first constructed to simulate both path-following capability and distraction duration, capturing the operational characteristics of distracted drivers. Building upon this model, a multi-constraint model predictive controller (H-ORPF-MPC) is developed, integrating driver behavior and environmental factors to balance driving comfort and controller stability. Surrounding risks are quantified through a driver intention function and an Obstacle-Road Potential Field (ORPF), with real-time state constraint envelopes applied to control outputs, thereby ensuring vehicle operation within a safe range. Furthermore, safety and comfort-based authority allocation rules are formulated, accommodating both controller performance and driver preferences. Simulation results indicate that the proposed approach effectively assists distracted drivers, significantly reduces trajectory tracking errors, and improves driving comfort.