-
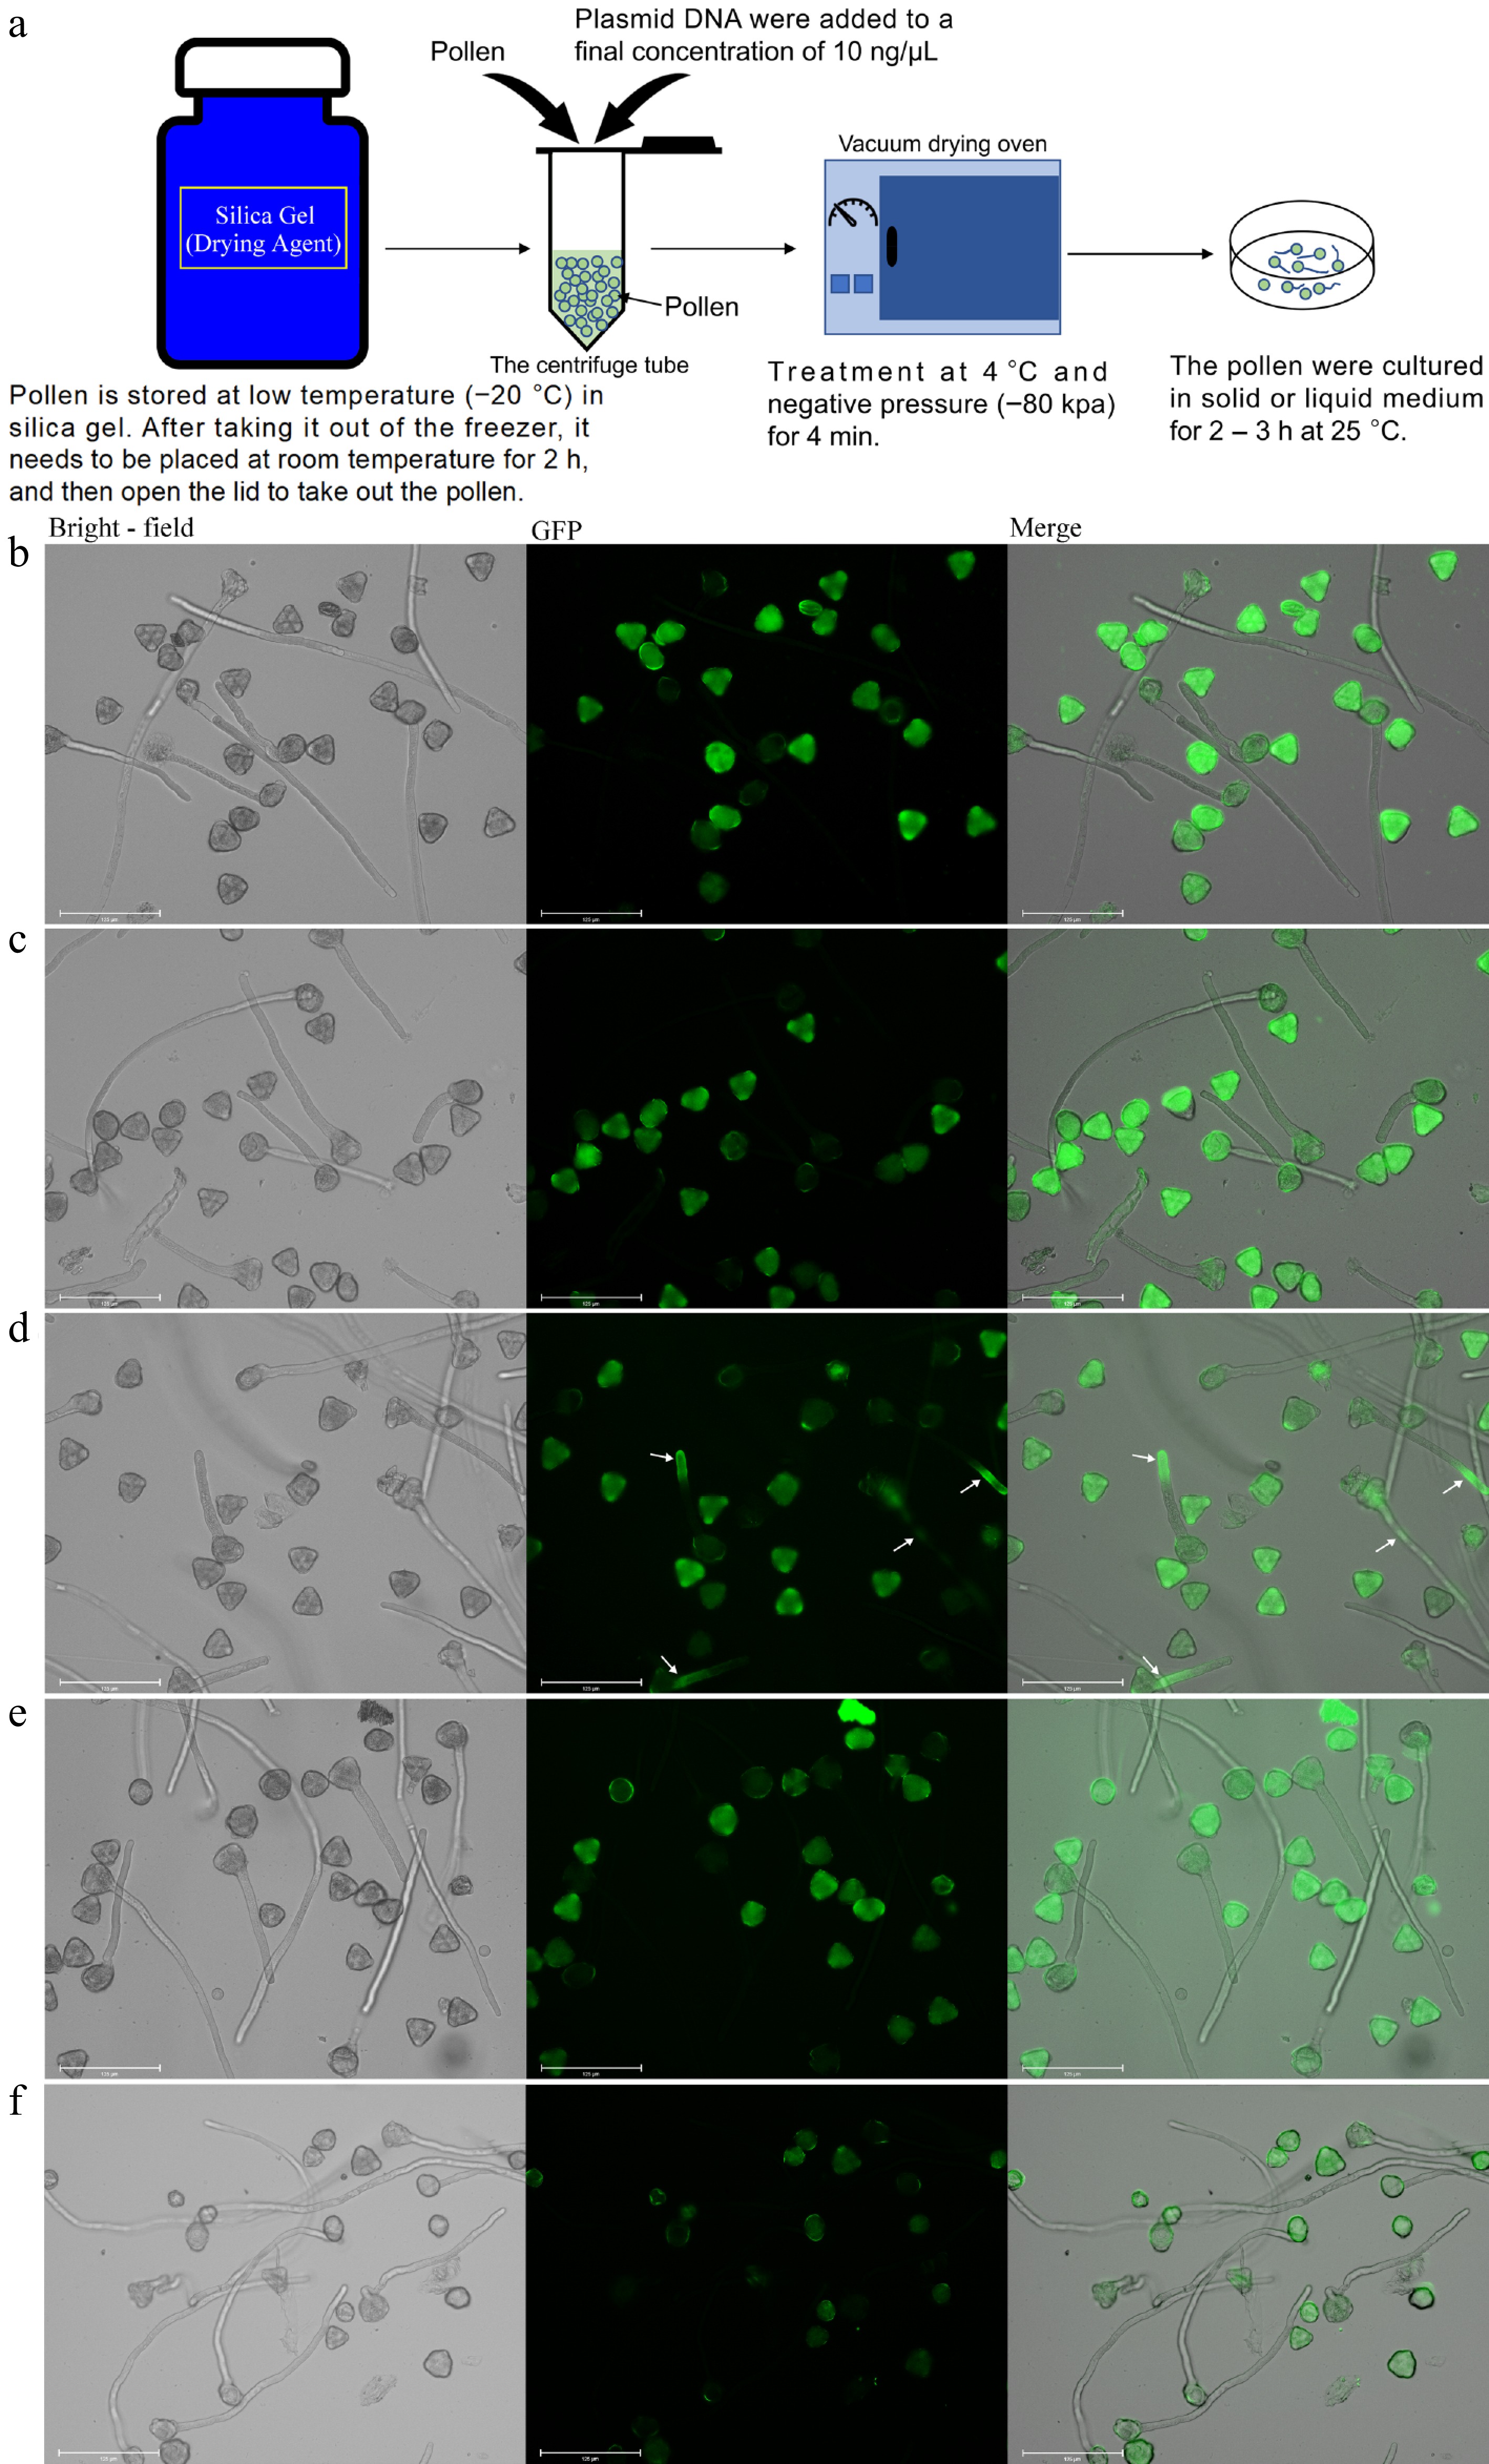
Figure 1.
Delivery of the GFP vector into pear pollen. Pollen culture was performed for 3 h at 25 °C. (a) The process of transforming genes into pollen by negative pressure infiltration. (b) Wild type 'Wonhwang' pollen (control). (c) The empty vector was transformed into 'Wonhwang' pollen. (d) The plasmid containing the GFP gene was transformed into 'Wonhwang' pollen. The white arrow points to where the fluorescent protein-encoding gene is expressed. (e) The plasmid containing the GFP gene was transformed into pollen of the pear cultivar 'Akitsuki'. (f) The plasmid containing the GFP gene was transformed into the pollen of Arabidopsis thaliana.
-
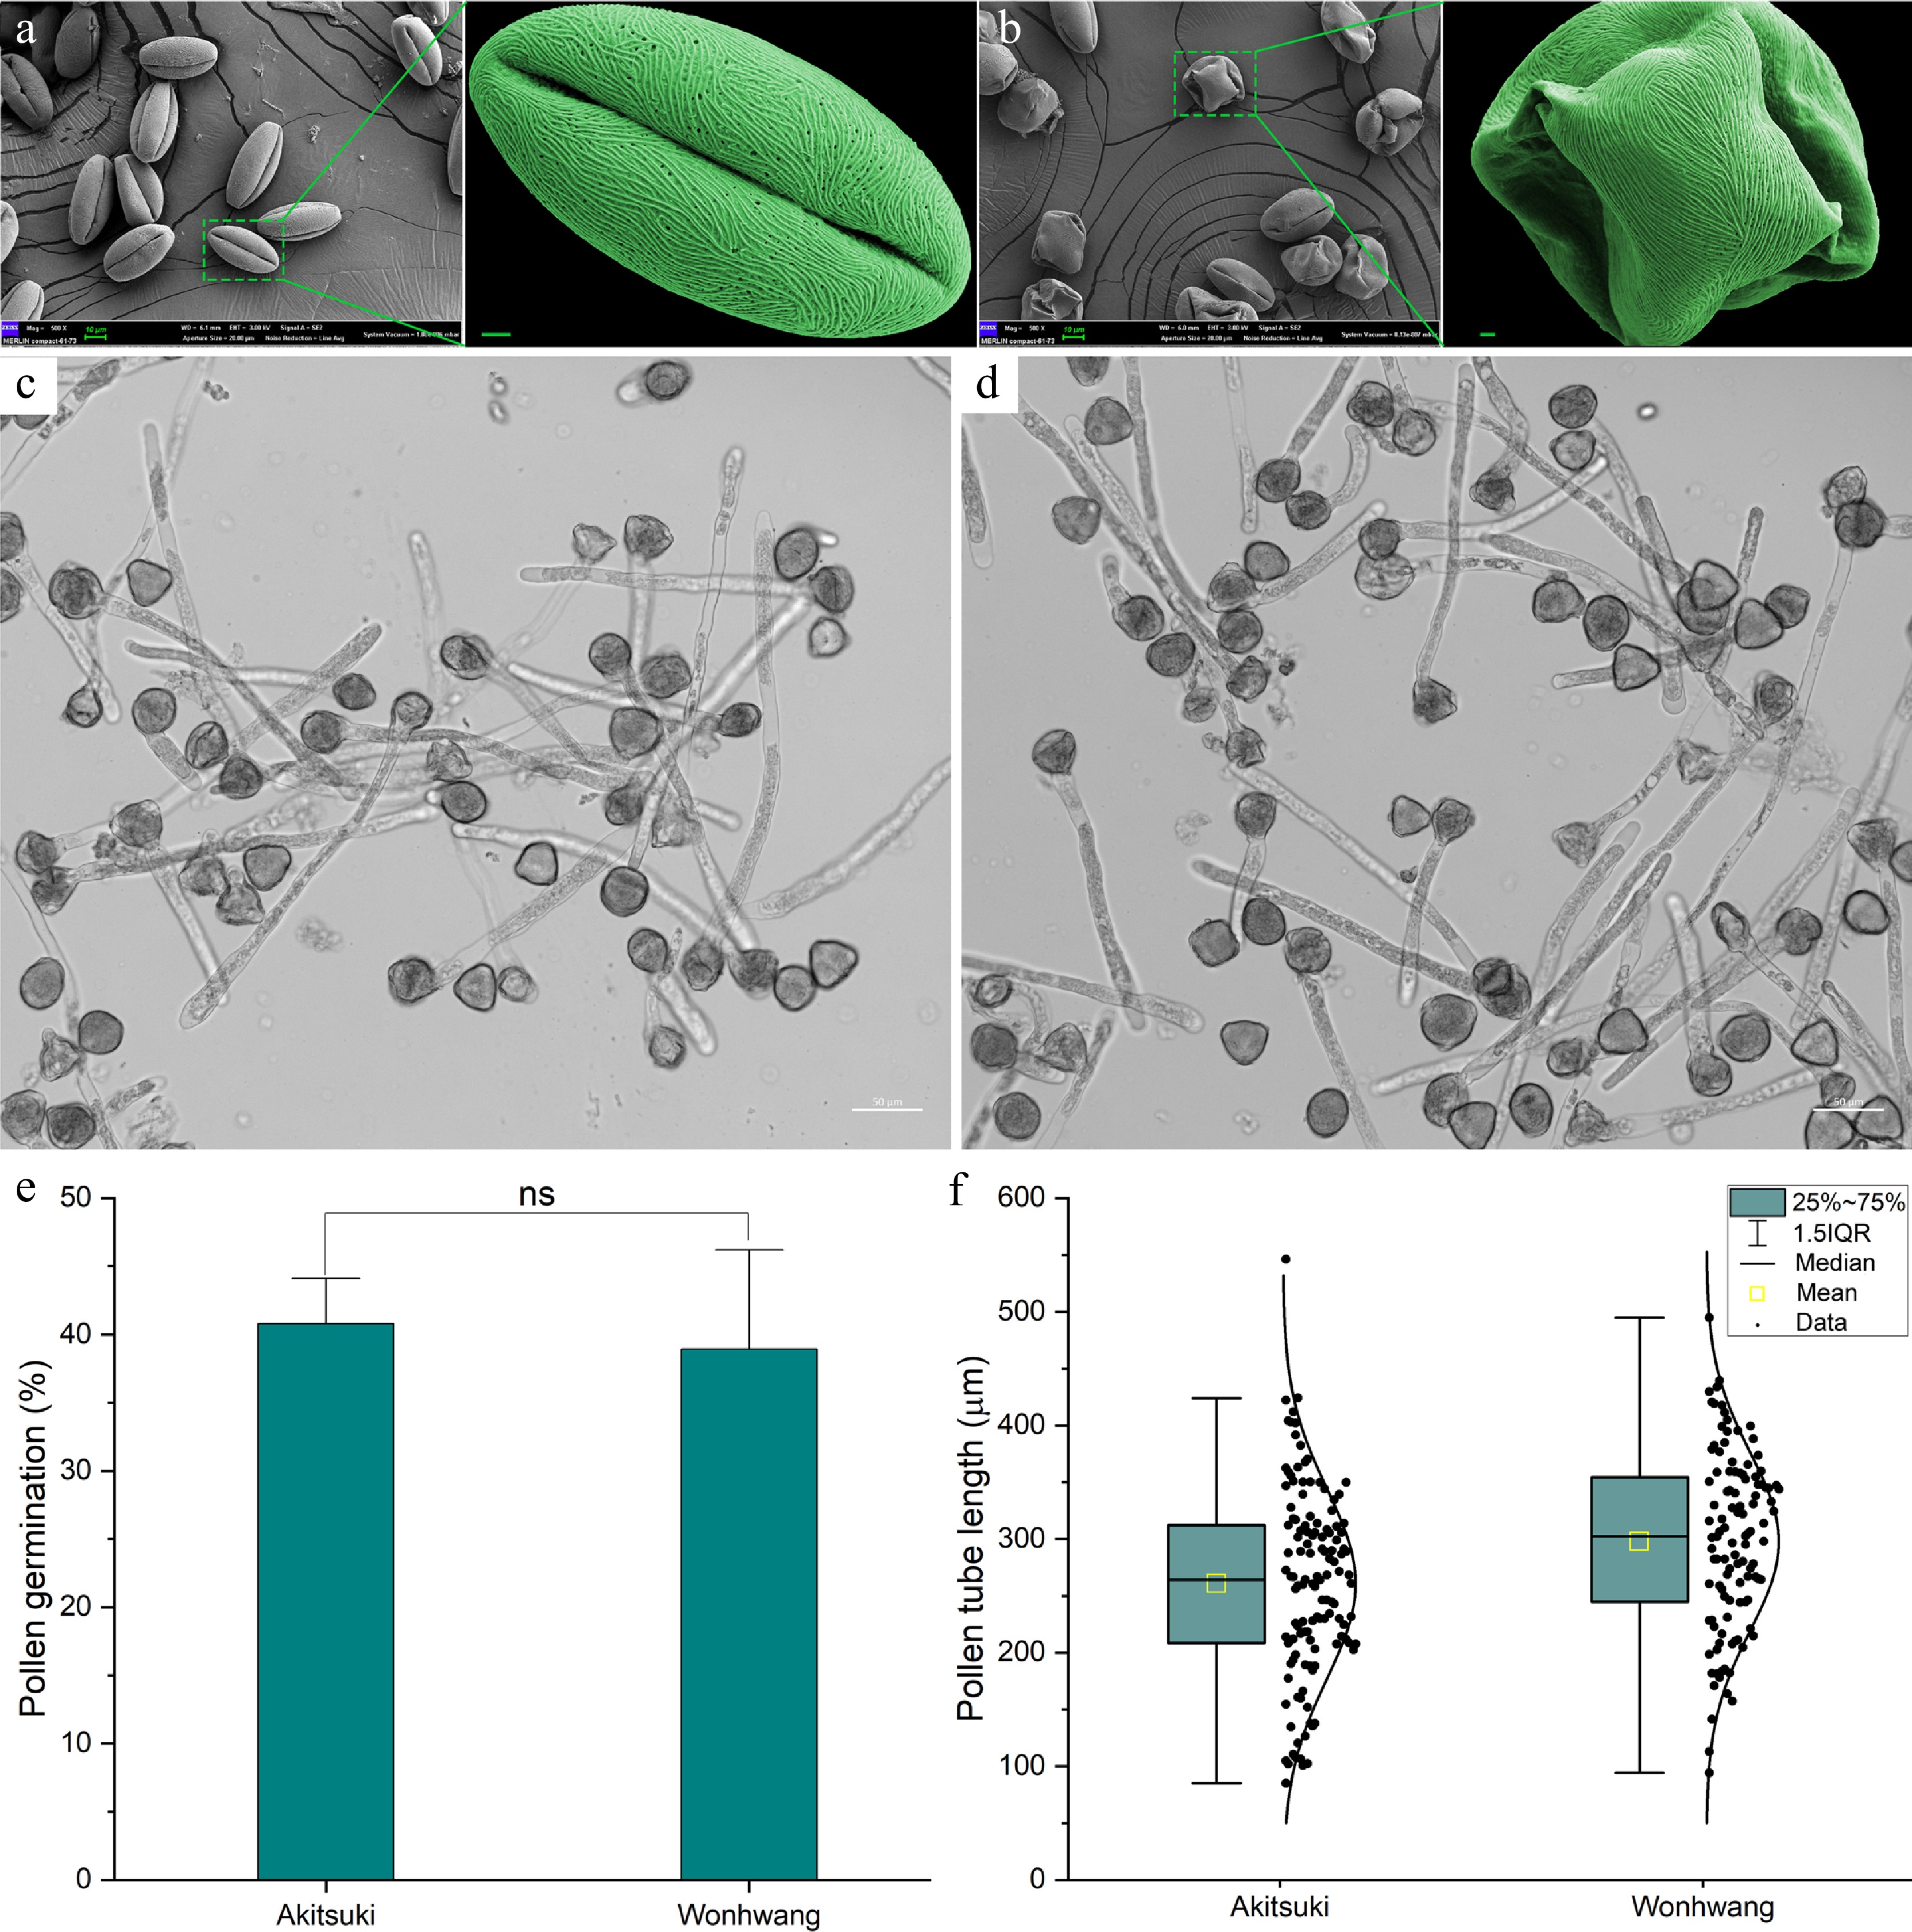
Figure 2.
Scanning electron microscopy (SEM) of pollen and in vivo pollination. (a) SEM images of dried pollen of the 'Akitsuki' cultivar. The scale bar is 2 µm. (b) SEM images of dried pollen of the 'Wonhwang' cultivar. (c) Growth of 'Akitsuki' pollen tubes. (d) Growth of 'Wonhwang' pollen tubes. (e) Comparison of pollen tube germination rates. (f) Comparison of pollen tube lengths. ns: Indicates no significant difference (p > 0.05).
-
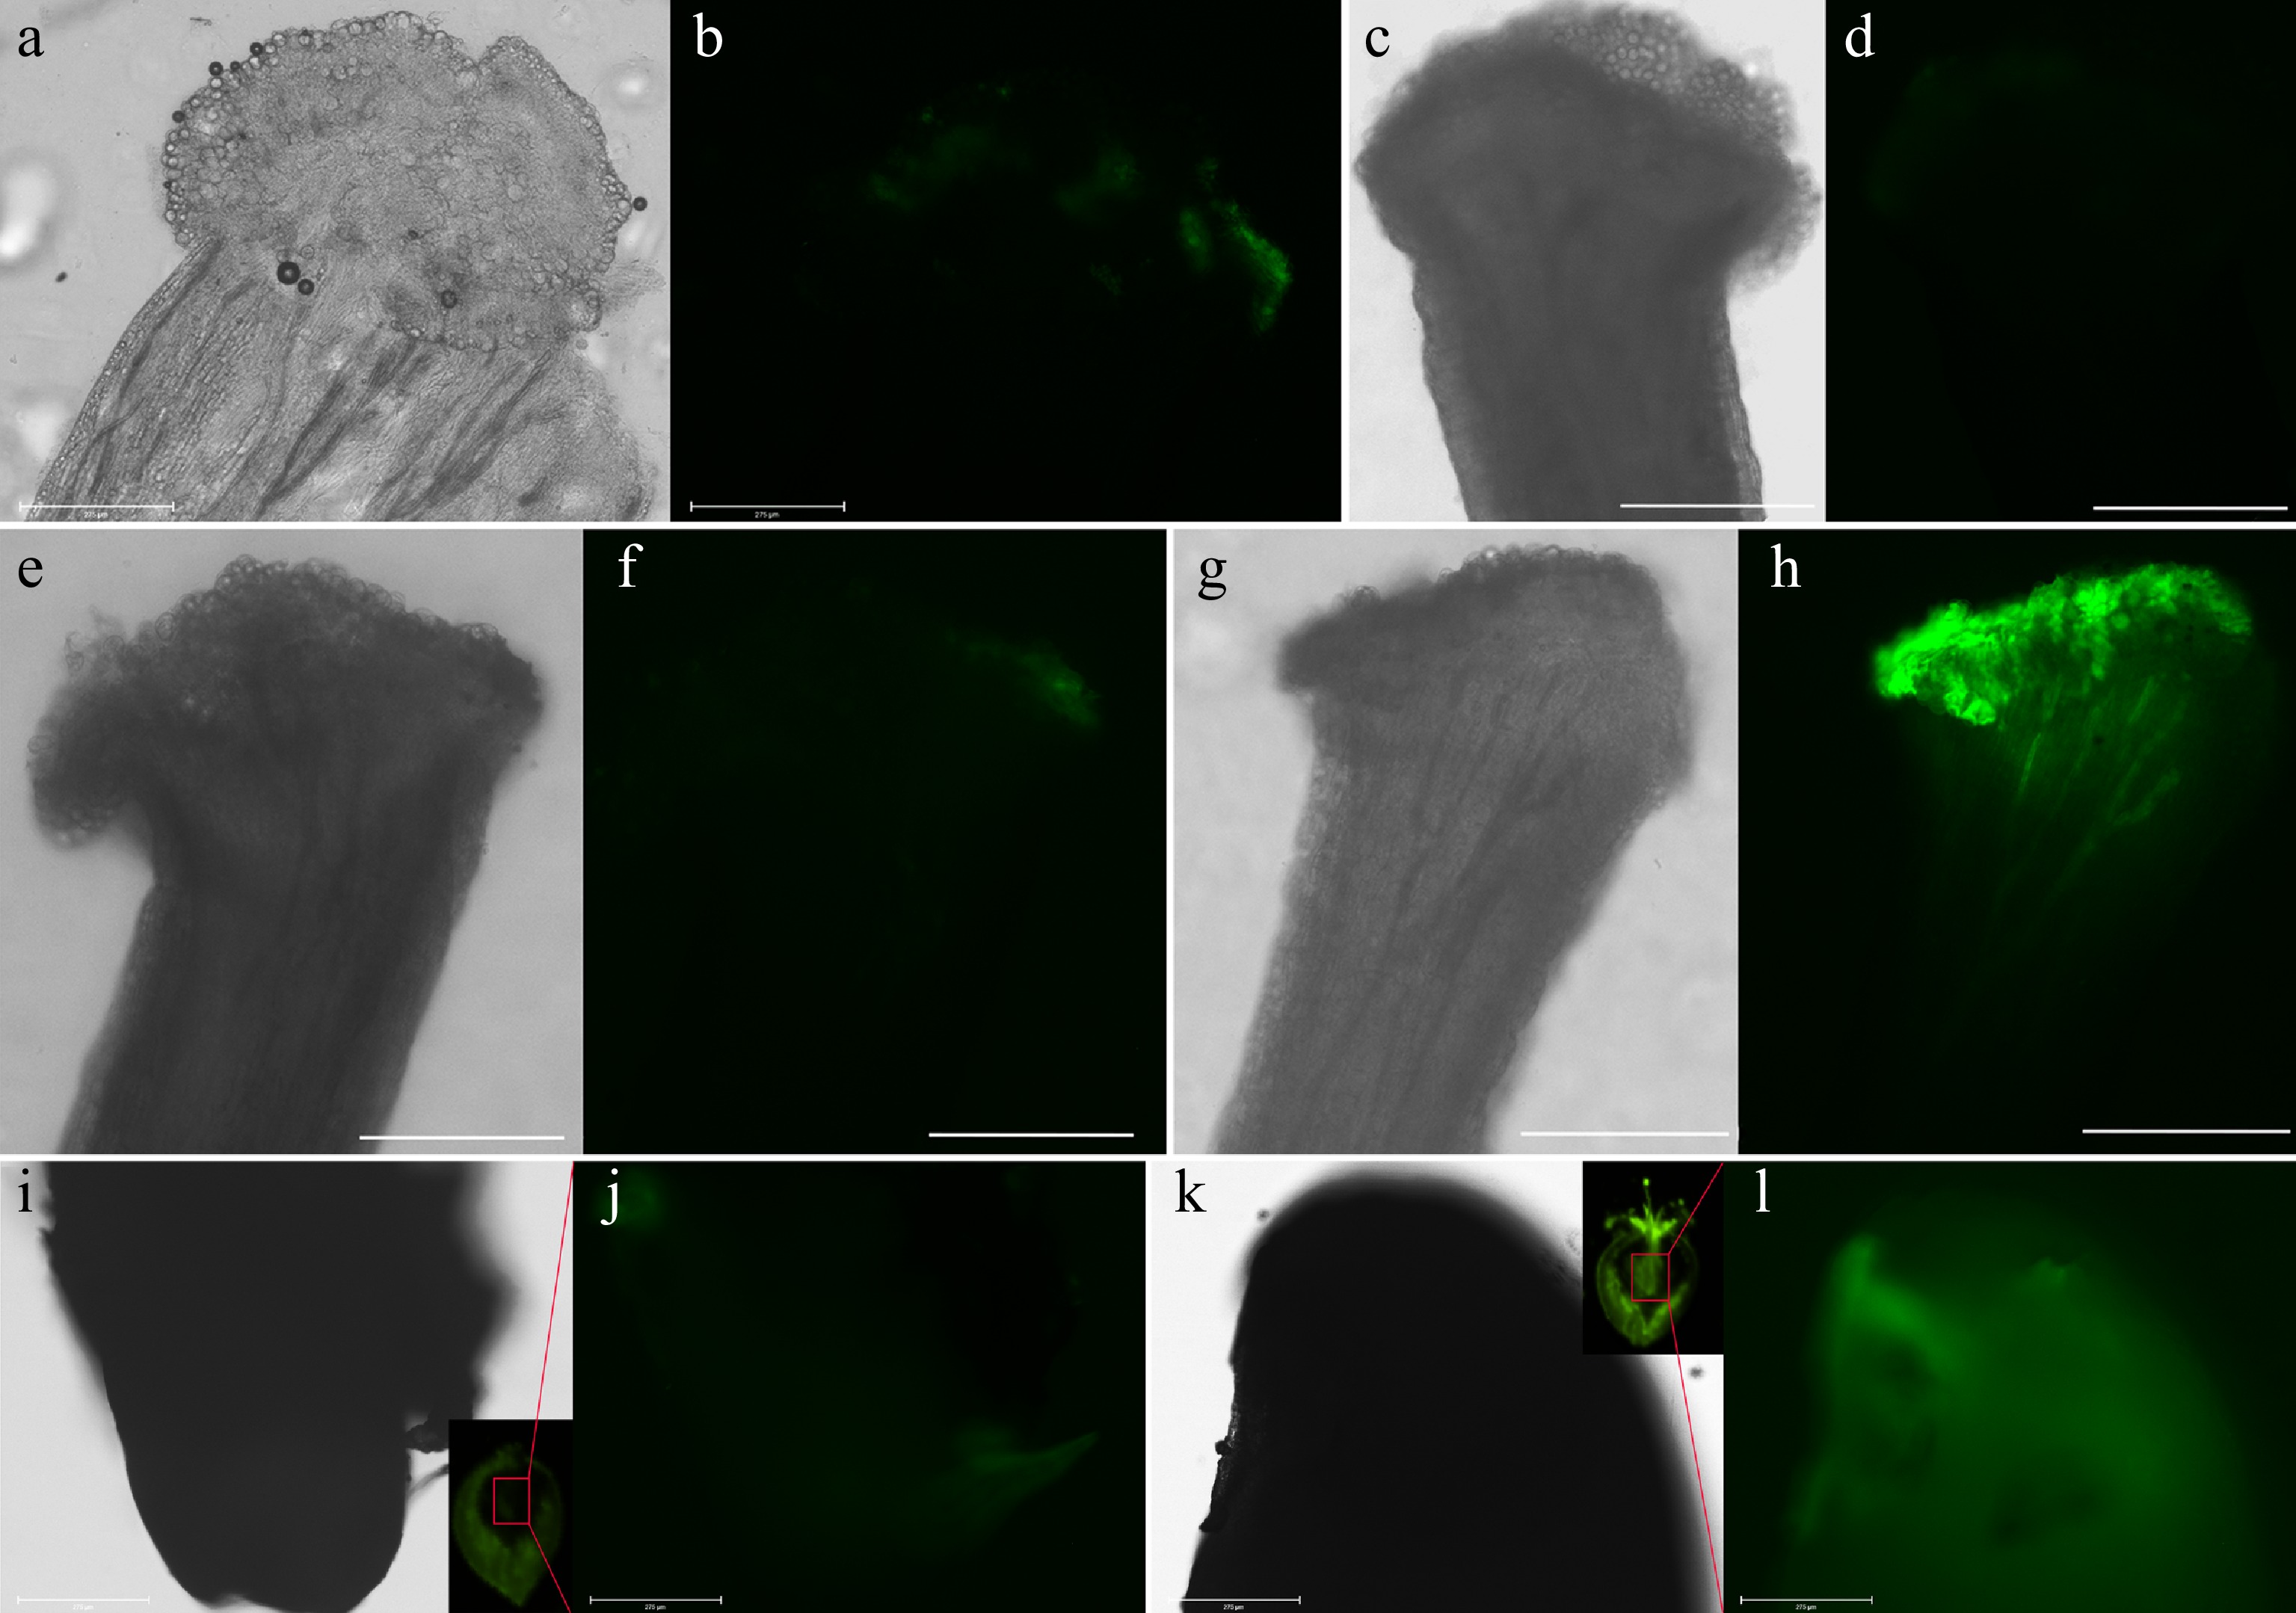
Figure 3.
'Wonhwang' pollen transformed with the GFP gene pollinates the stigma of 'Akitsuki'. (a), (b) Stigma of 'Akitsuki' without pollination. (c), (d) Non-transgenic 'Wonhwang' pollen was used to pollinate a stigma of 'Akitsuki' for 30 h. The scale bar represents 275 μm. (e), (f) Wonhwang' pollen transformed with the empty vector was used to pollinate stigma of 'Akitsuki' for 30 h. The scale bar represents 275 μm. (g), (h) Stigma of 'Akitsuki' pear was pollinated with 'Wonhwang' pollen transformed with the GFP gene for 30 h. The scale bar represents 275 μm. (i), (j) Control: stigma of 'Akitsuki' pear were pollinated with 'Wonhwang' pollen without the GFP gene for 15 d. The inner image in (i) shows the cut young fruit, and the innermost seed cavity was observed by a stereo fluorescence microscope. (i) Bright field image obtained with a fluorescence microscope. (j) The GFP channel as observed with a fluorescence microscope. (k), (l) Stigma of 'Akitsuki' pear were pollinated with 'Wonhwang' pollen transformed with the GFP gene for 15 d. The inset image in (k) shows the cut young fruit, and the innermost seed cavity was observed by stereo fluorescence. (k) Bright field image obtained with a fluorescence microscope. (l) The GFP channel as observed with a fluorescence microscope.
-
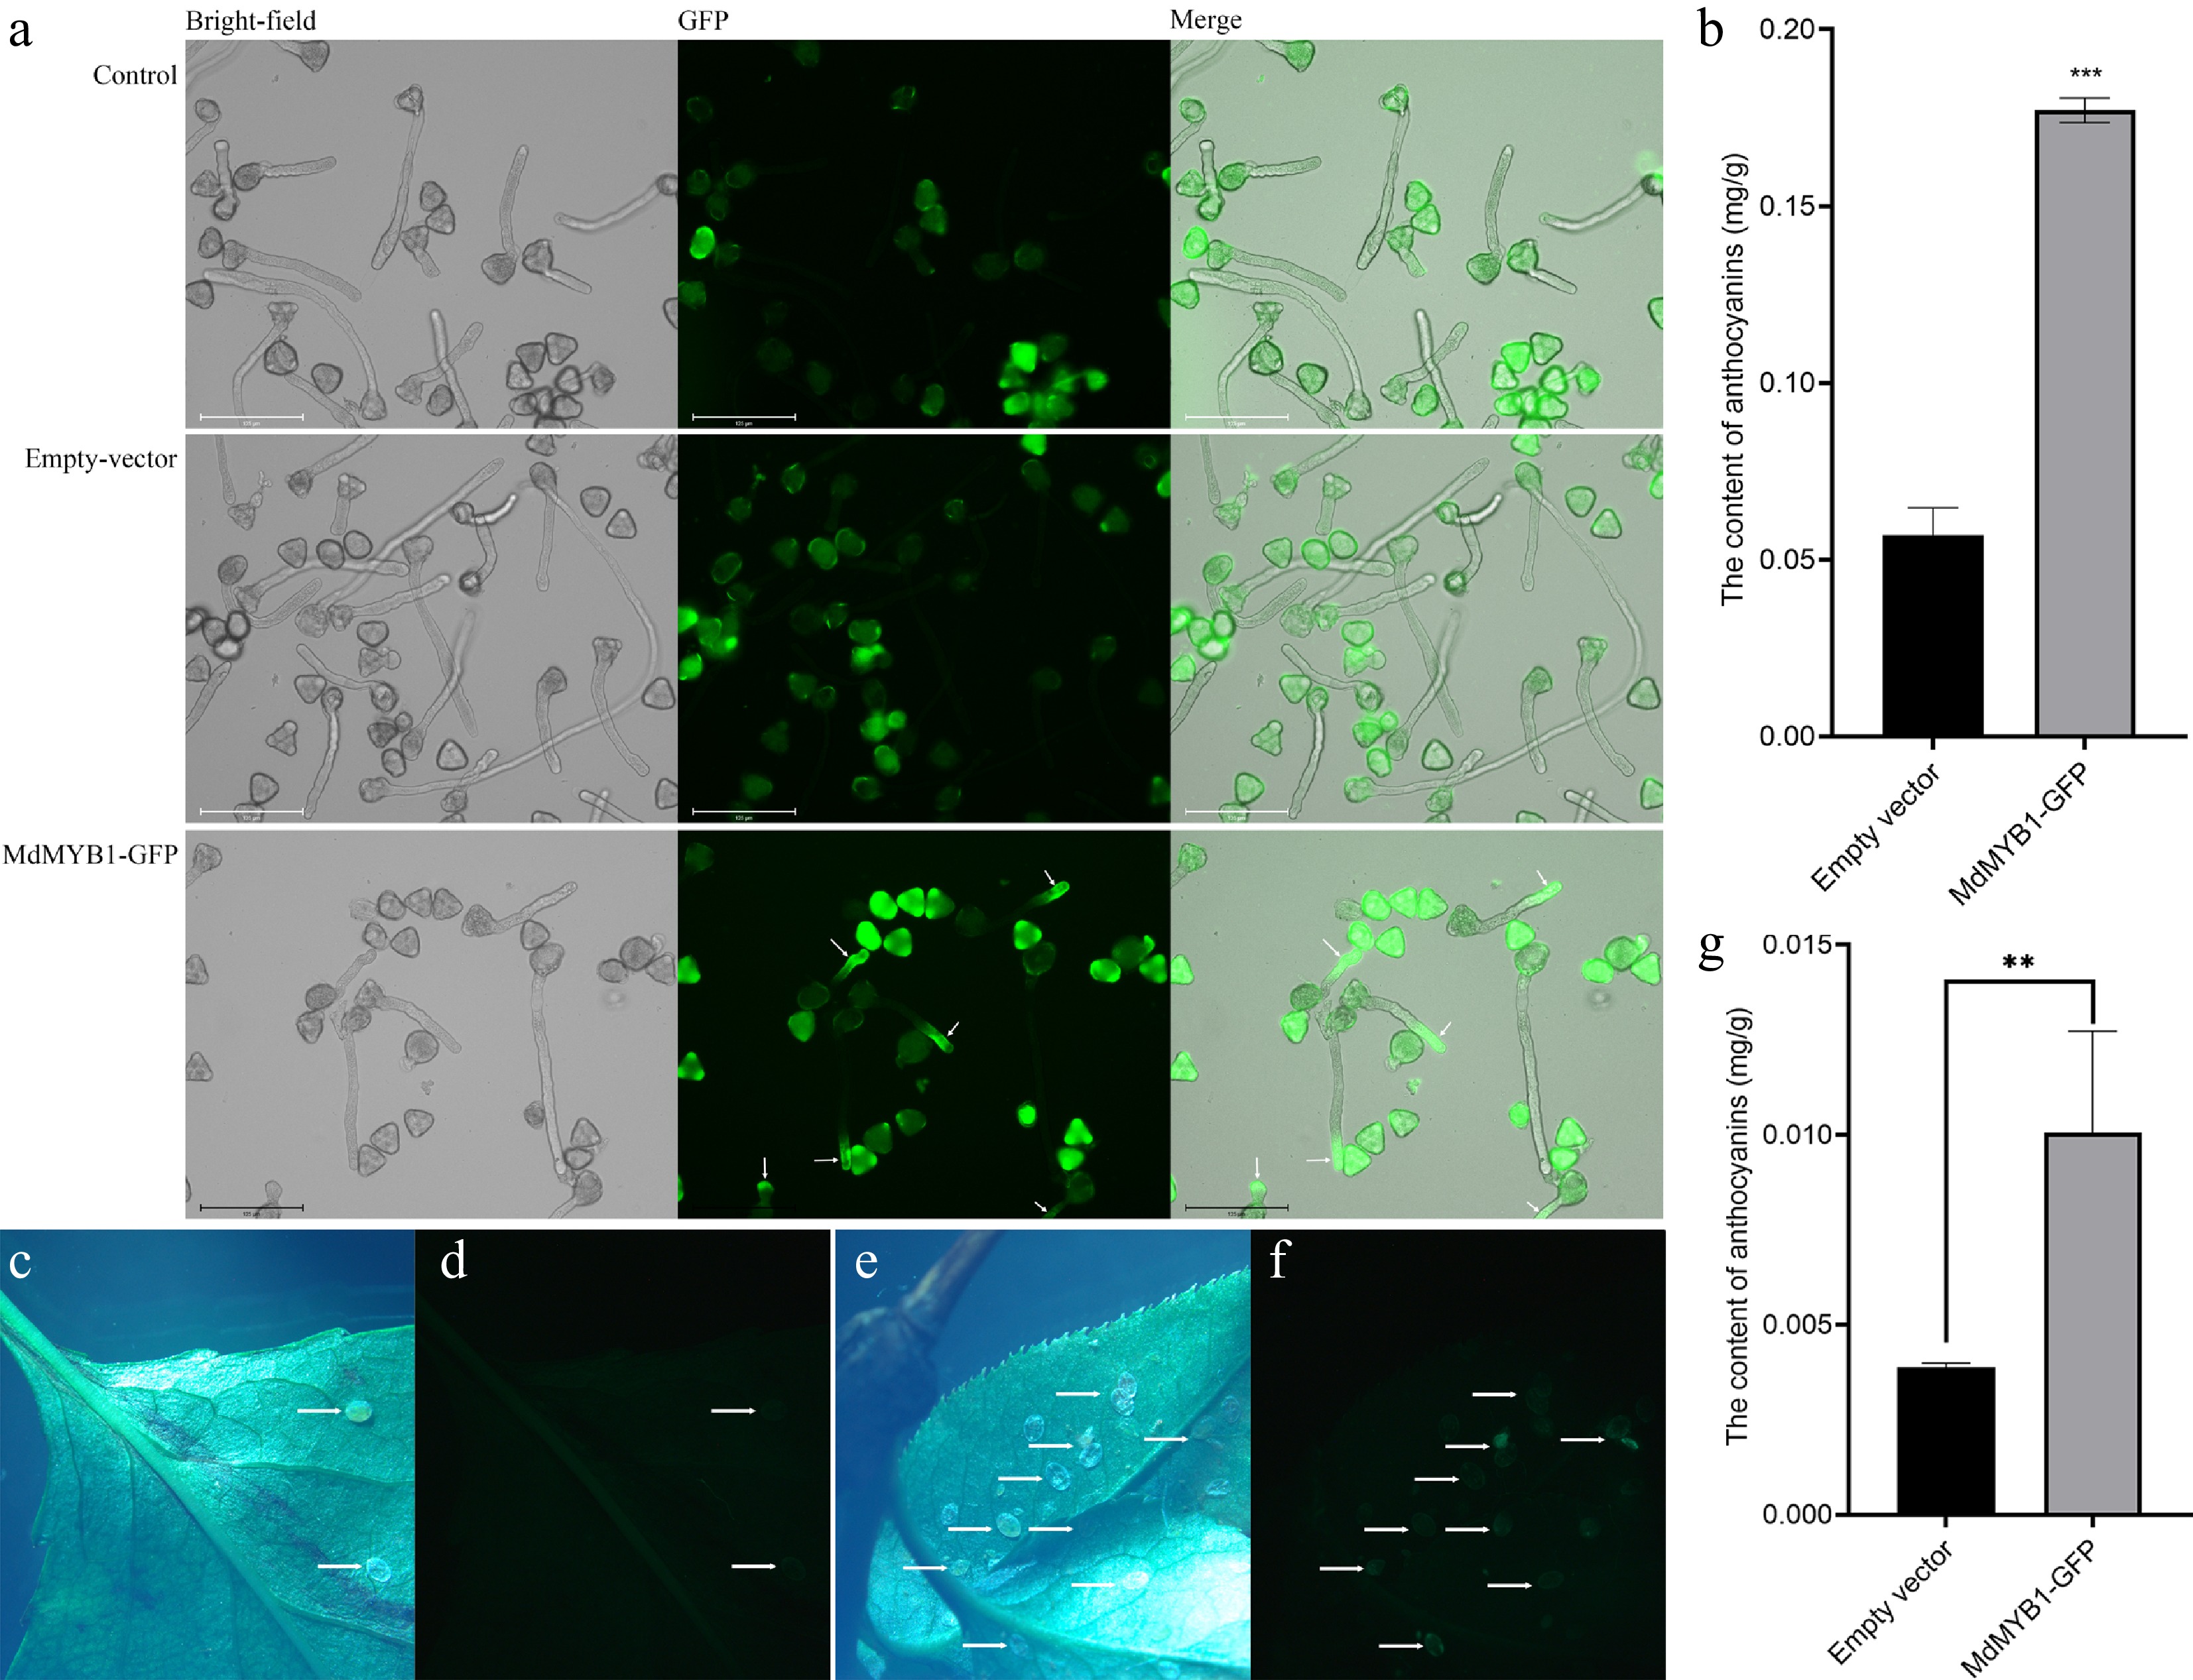
Figure 4.
The MdMYB1-GFP gene was transformed into 'Wonhwang' pollen, which was subsequently cultured on solid medium for 3 h. (a) No transgenic 'Wonhwang' pollen (control). The empty vector was transformed into 'Wonhwang' pollen (empty vector). The plasmid containing the MdMYB1-GFP gene was then transformed into 'Wonhwang' pollen (MdMYB1-GFP). The white arrow points to where the fluorescent protein-encoding gene is expressed. (b) The content of anthocyanins in pollen tubes. *** indicates significant differences at p < 0.001. The data are presented as the means ± standard errors. (c) Bright field photo of pear seedling leaves with an empty carrier, and (d) is a fluorescence photo of the same leaf. The arrow points to the larvae of the whitefly. (e) Bright field photo of transgenic pear seedling leaves, and (f) is a fluorescence photo of the same leaf. The arrow points to the larvae of the whitefly. (g) Anthocyanin content in leaves. ** indicates significant differences at p < 0.01. The data are presented as mean ± standard error.
-
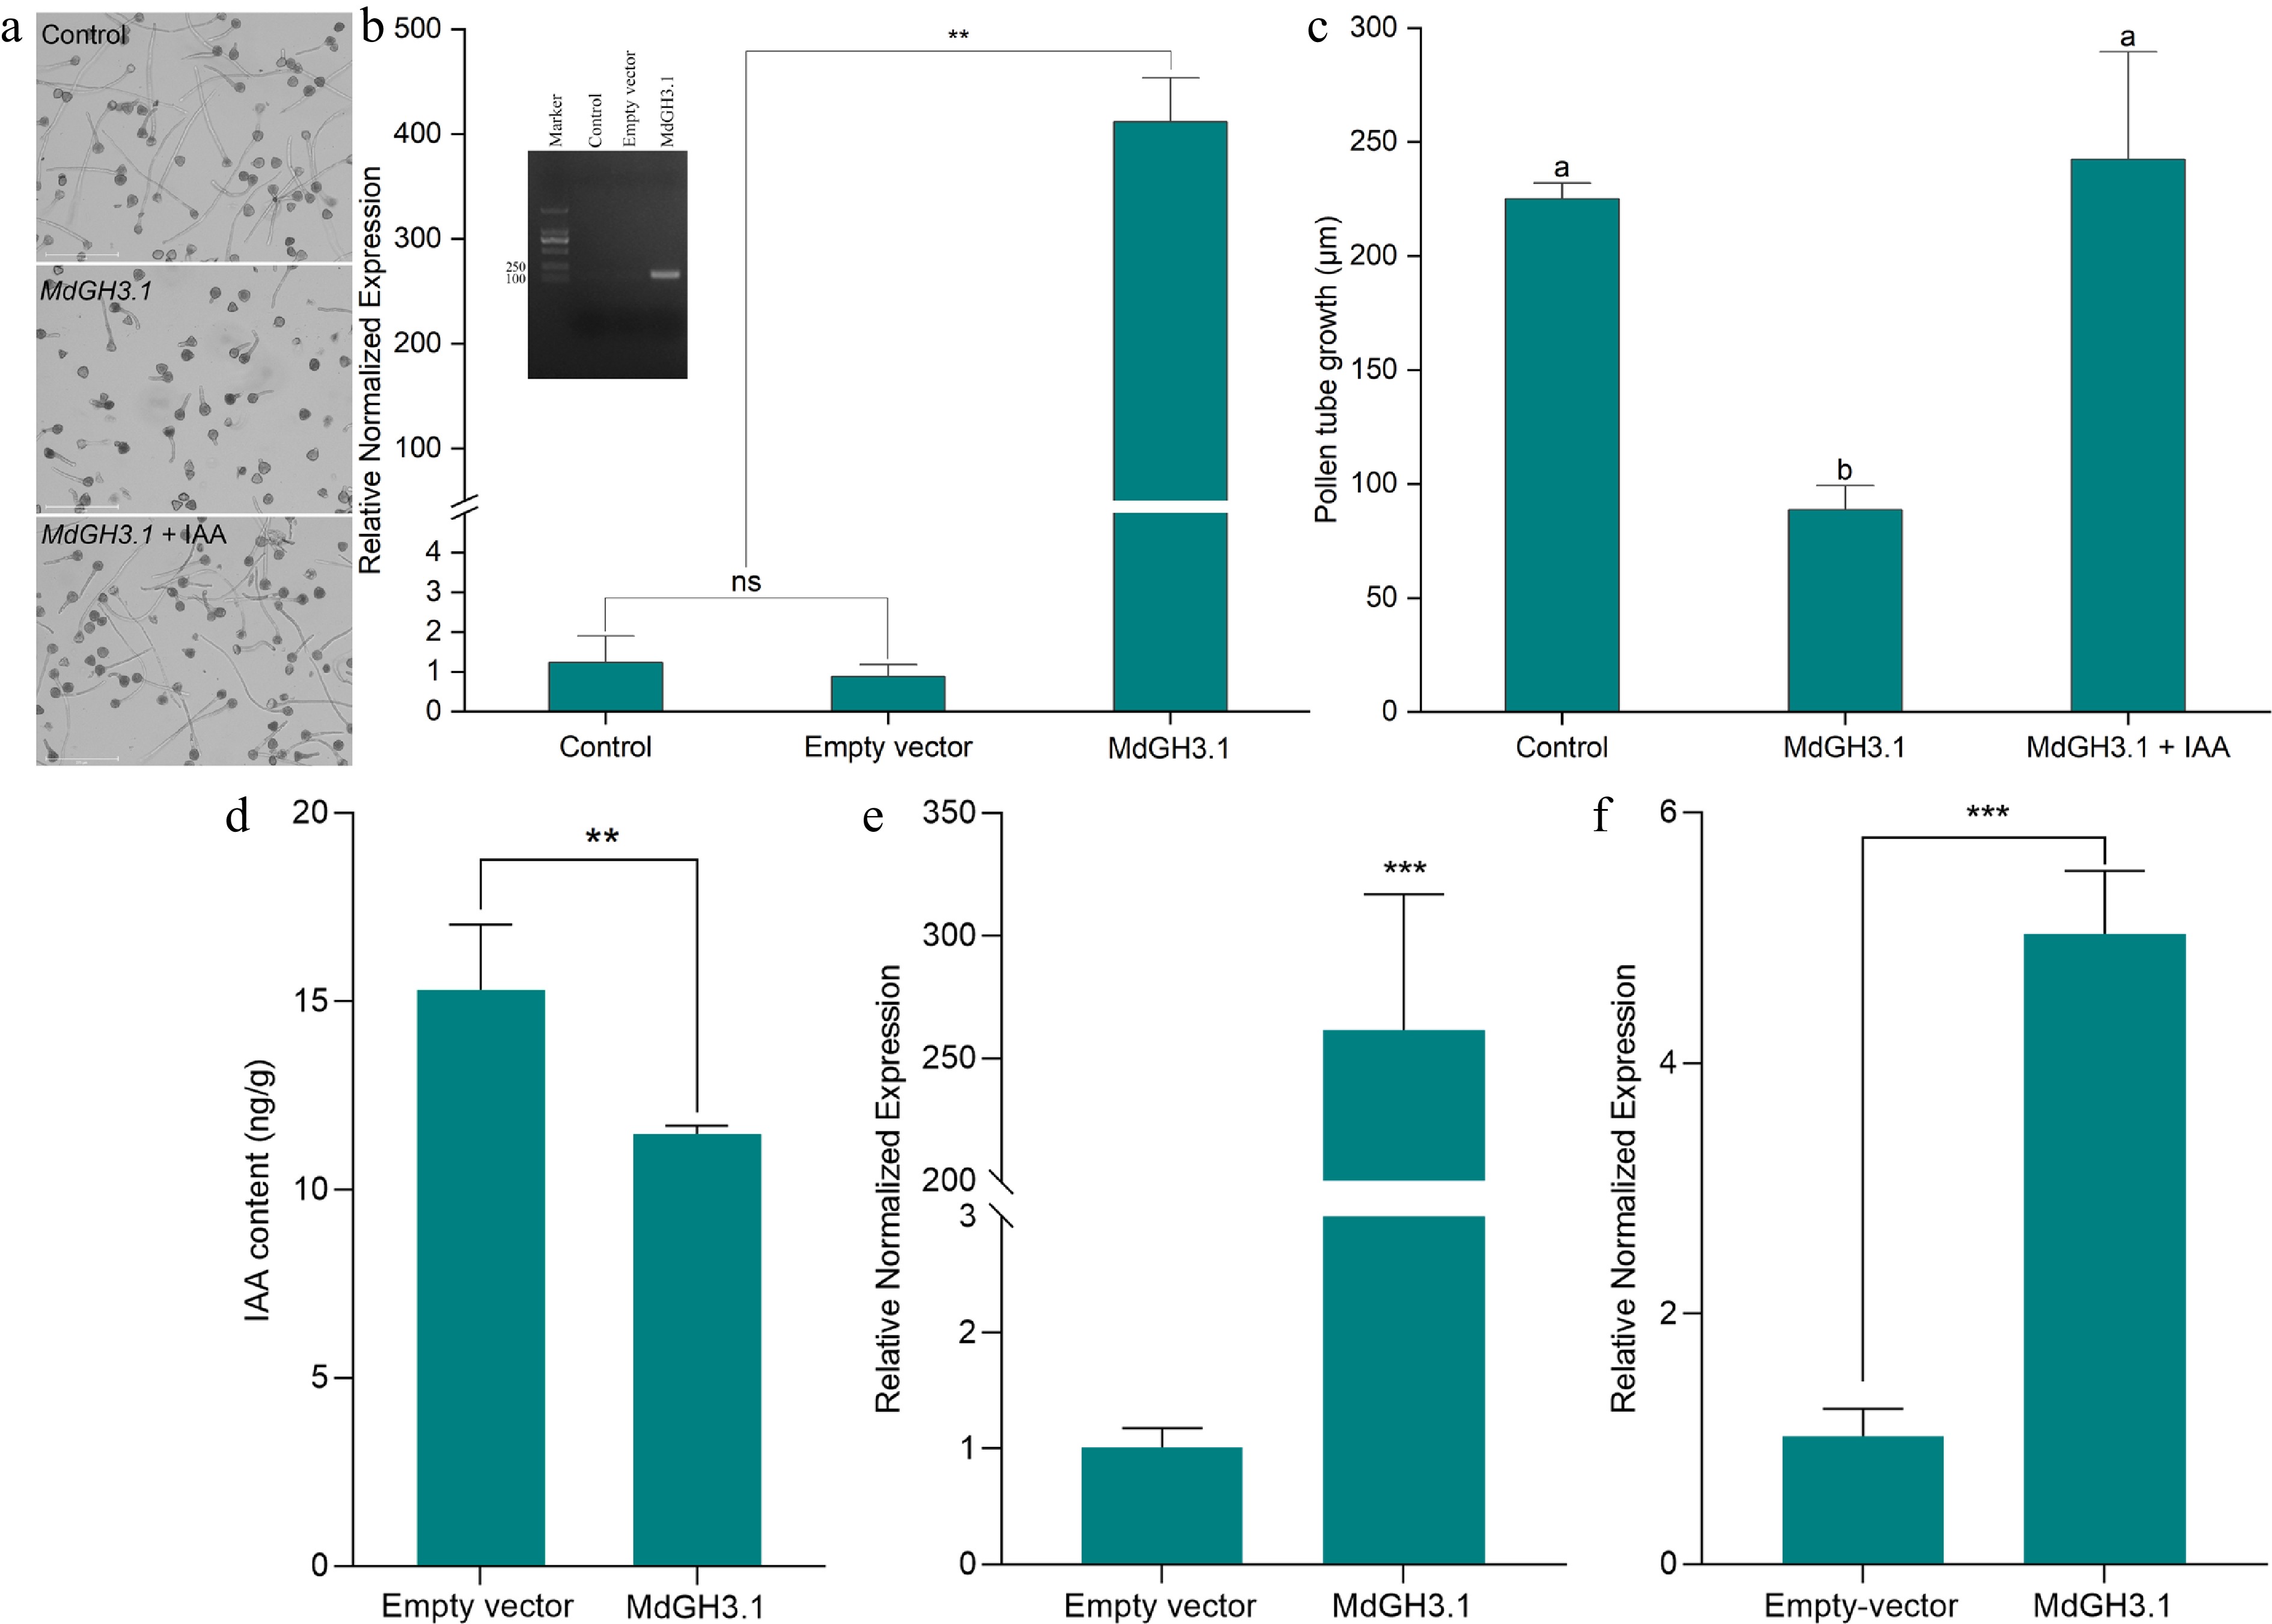
Figure 5.
The MdGH3.1 gene of apple was transformed into 'Wonhwang' pollen for functional verification. (a) Pollen culture in vitro for 3 h. Pollen that was not transformed was used as a control. The MdGH3.1 gene was transformed into 'Wonhwang' pollen via negative pressure infiltration, after which the pollen was cultured on medium (GH3.1). 'Wonhwang' pollen was cultured on medium supplemented with 6 µmol/L IAA after the pollen was transformed with the MdGH3.1 gene (GH3.1 + IAA). (b) Quantitative measurement of MdGH3.1 expression in pollen tubes. The inner image shows the DNA gel electrophoresis bands after quantitative PCR. ns: No significant difference. ** p < 0.01. (c) Statistical analysis of pollen tube length. The data are presented as mean ± standard error. Different letters indicate significant differences (p < 0.05). (d) Statistical analysis of IAA content in pollen tube. The data are presented as mean ± standard error. ** p < 0.01. (e) Quantitative measurement of MdGH3.1 expression in seeds. *** p < 0.001. (f) Quantitative measurement of MdGH3.1 expression in leaves. *** p < 0.001.
Figures
(5)
Tables
(0)