-
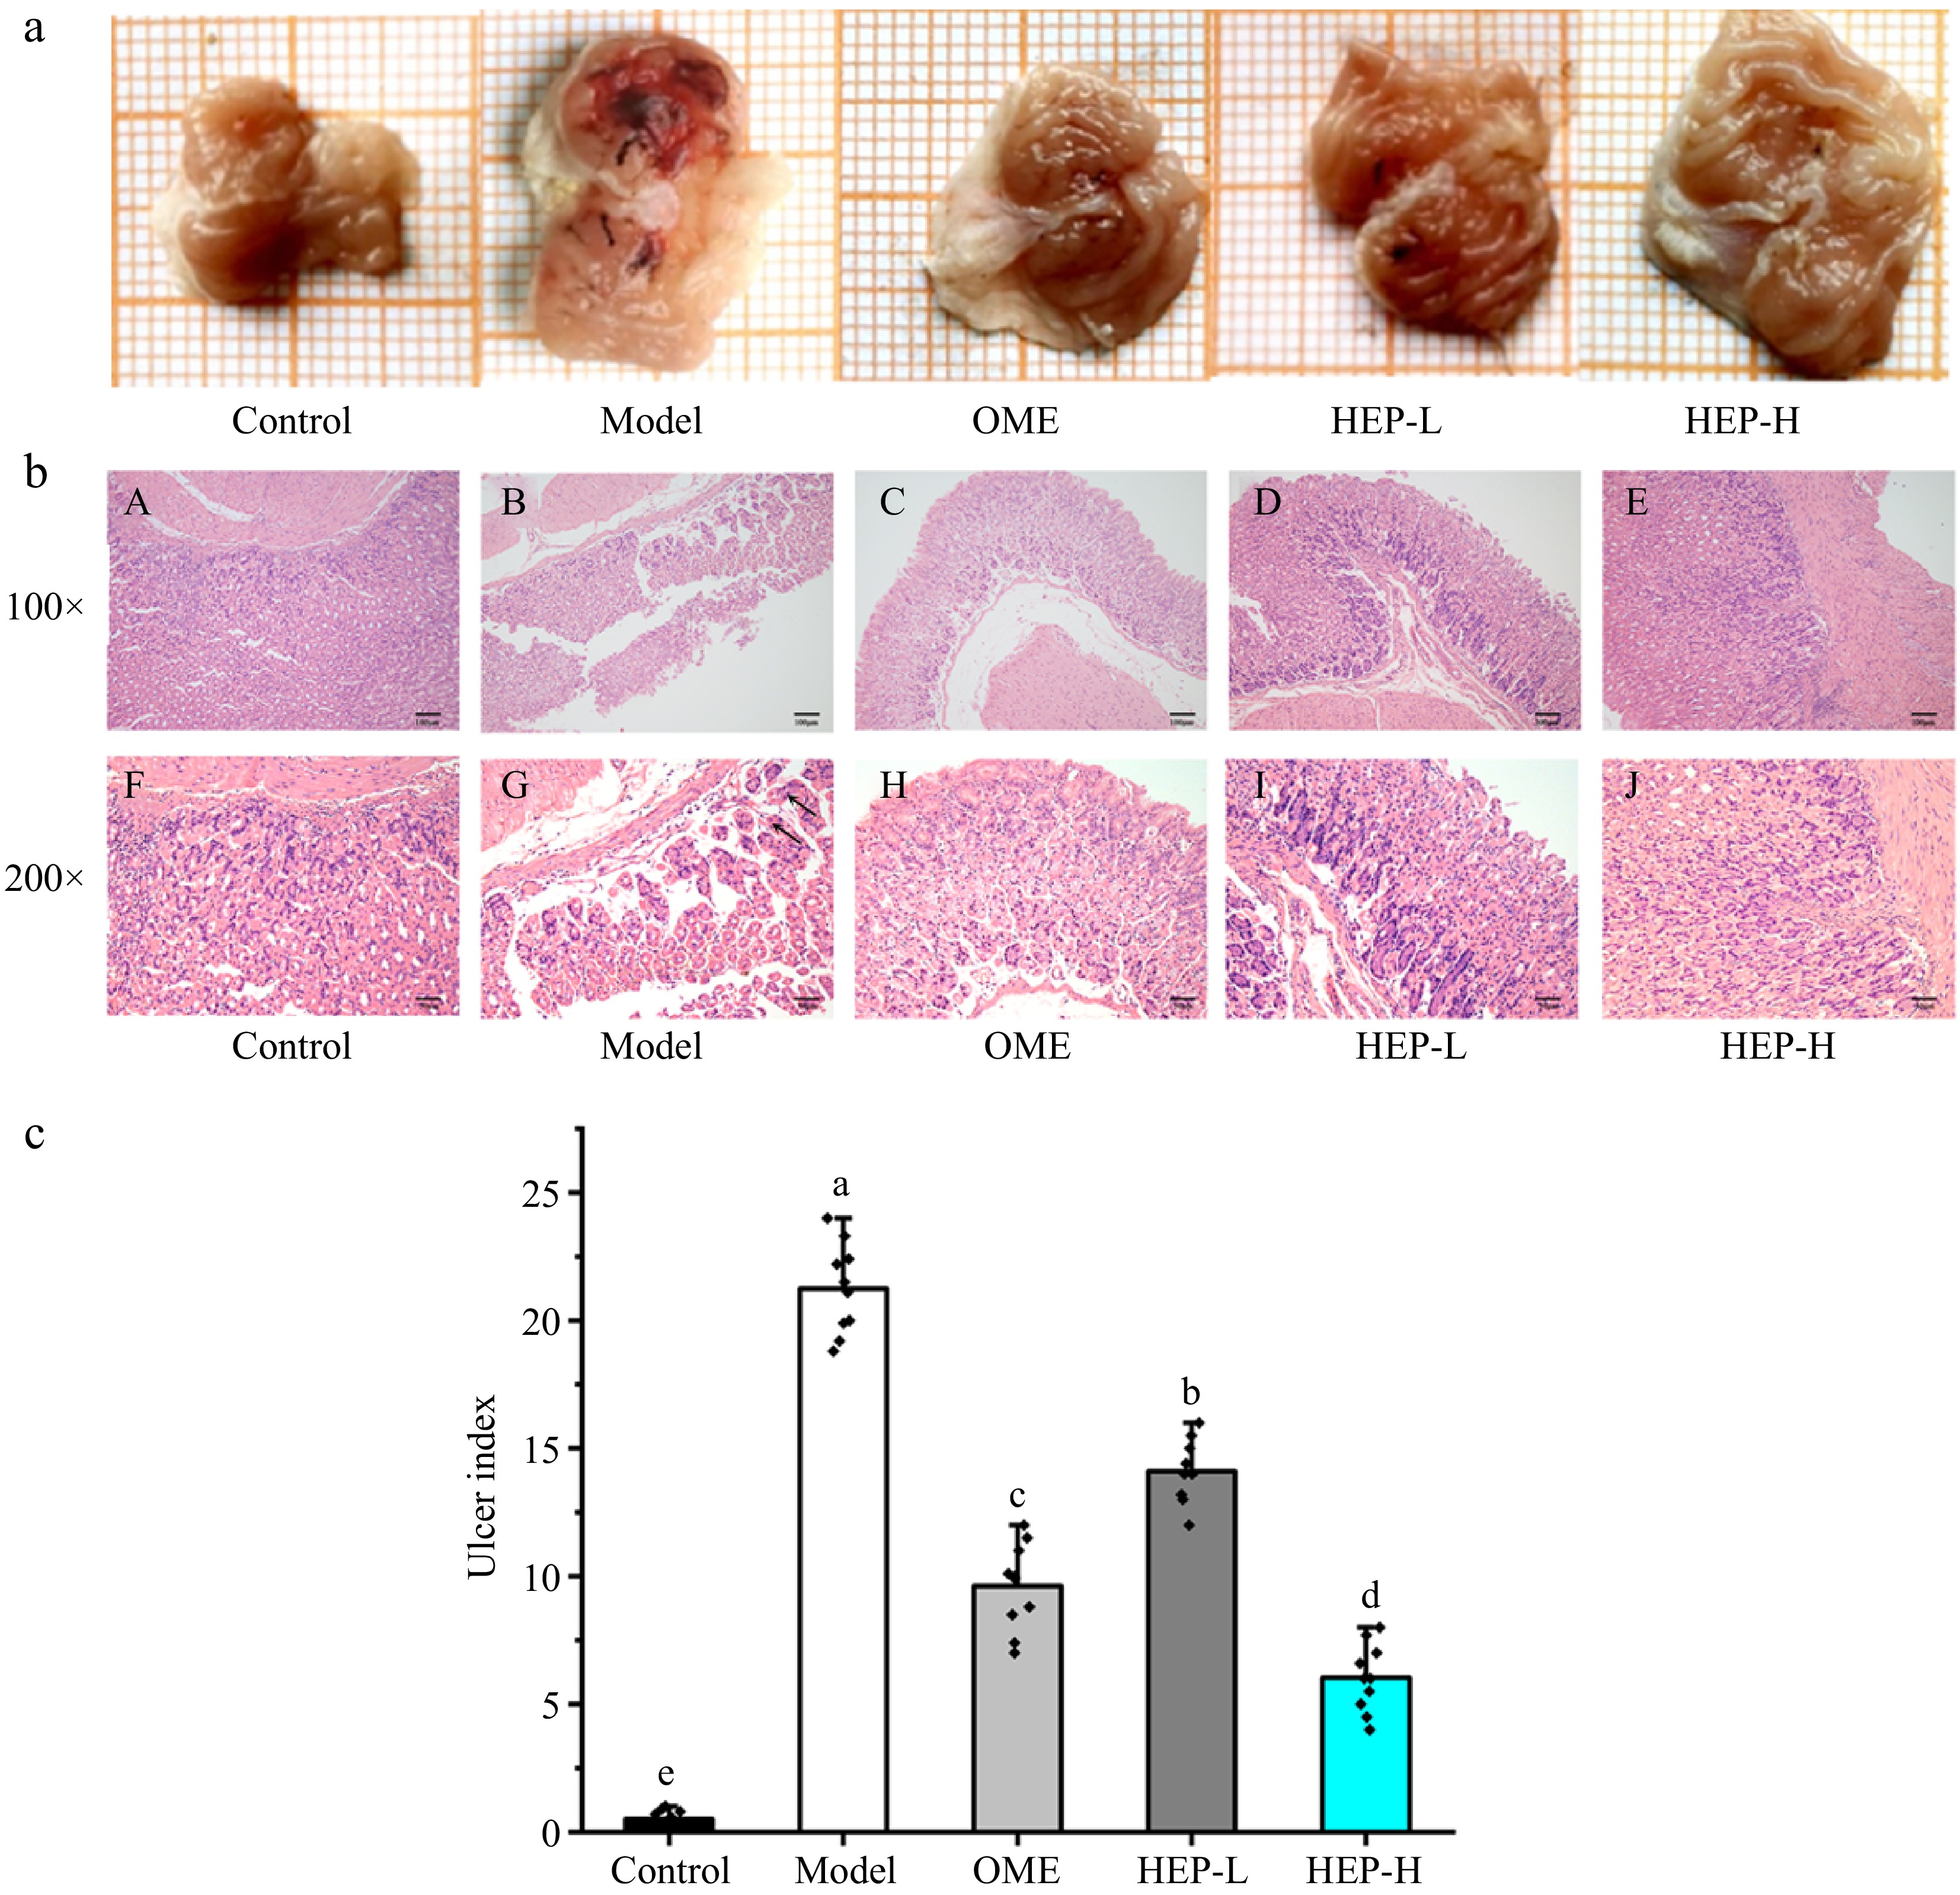
Figure 1.
Macro lesion, ulcer index, and histological evaluation of gastric tissue. (a) Effect of HEP-1 on macromorphology of gastric mucosa. A grid in the figure represents the actual 1 mm2. (b) Histopathological evaluation of the effect of HEP-1. Blank arrow: swelling of epithelial cells, with loose cytoplasm and pale staining. Uppercase letters (A−E) indicated H&E staining of gastric mucosa (100×), (F−J) indicated H&E staining of gastric mucosa (200×). (c) Effect of HEP-1 on ulcer index. Lowercase letters (a−e) indicated significant differences at p < 0.05.
-
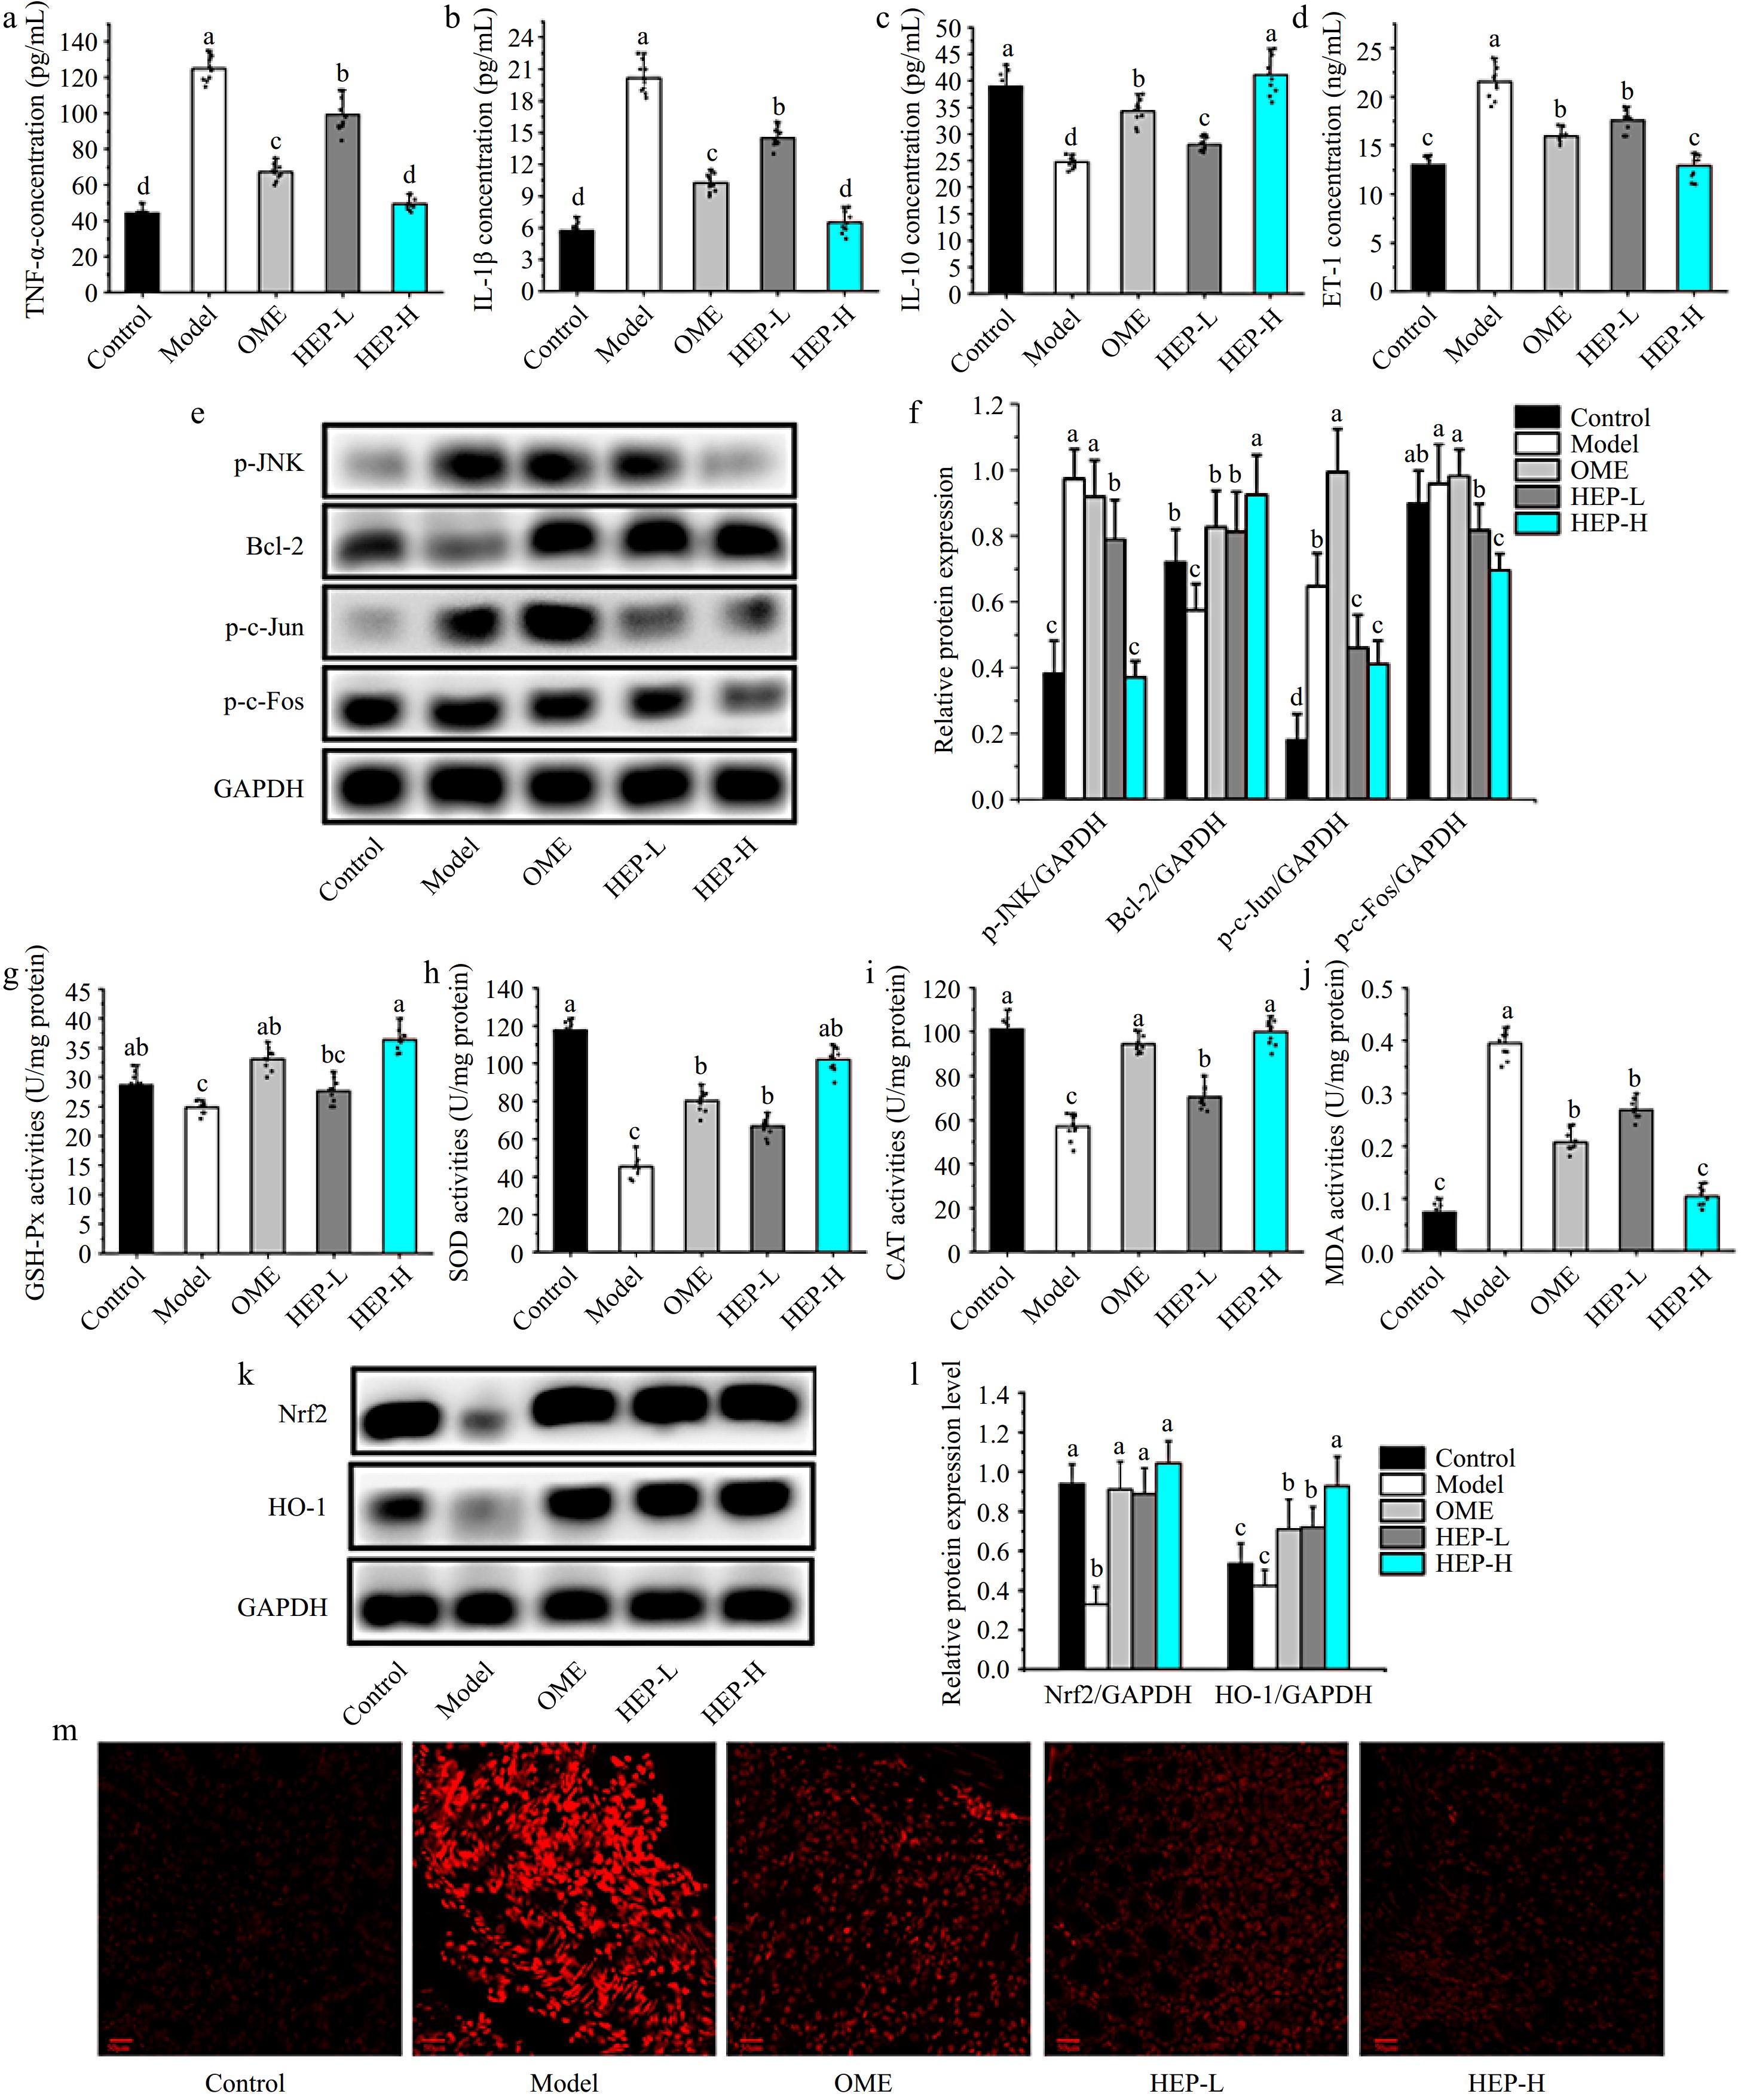
Figure 2.
Effects of HEP-1 on inflammatory responses and oxidative stress in stomach tissue. (a) Tumor necrosis factor-α (TNF-α). (b) Interleukin-1β (IL-1β). (c) Interleukin-10 (IL-10). (d) Endothelin-1 (ET-1). (e) Representative immunoblot bands. (f) The relative protein expressions. (g) Glutathione peroxidase (GSH-Px). (h) Superoxide dismutase (SOD). (i) Catalase (CAT). (j) Malondialdehyde (MDA). (k) Representative immunoblot bands. (l) The relative protein expressions. (m) ROS fluorescence staining.
-
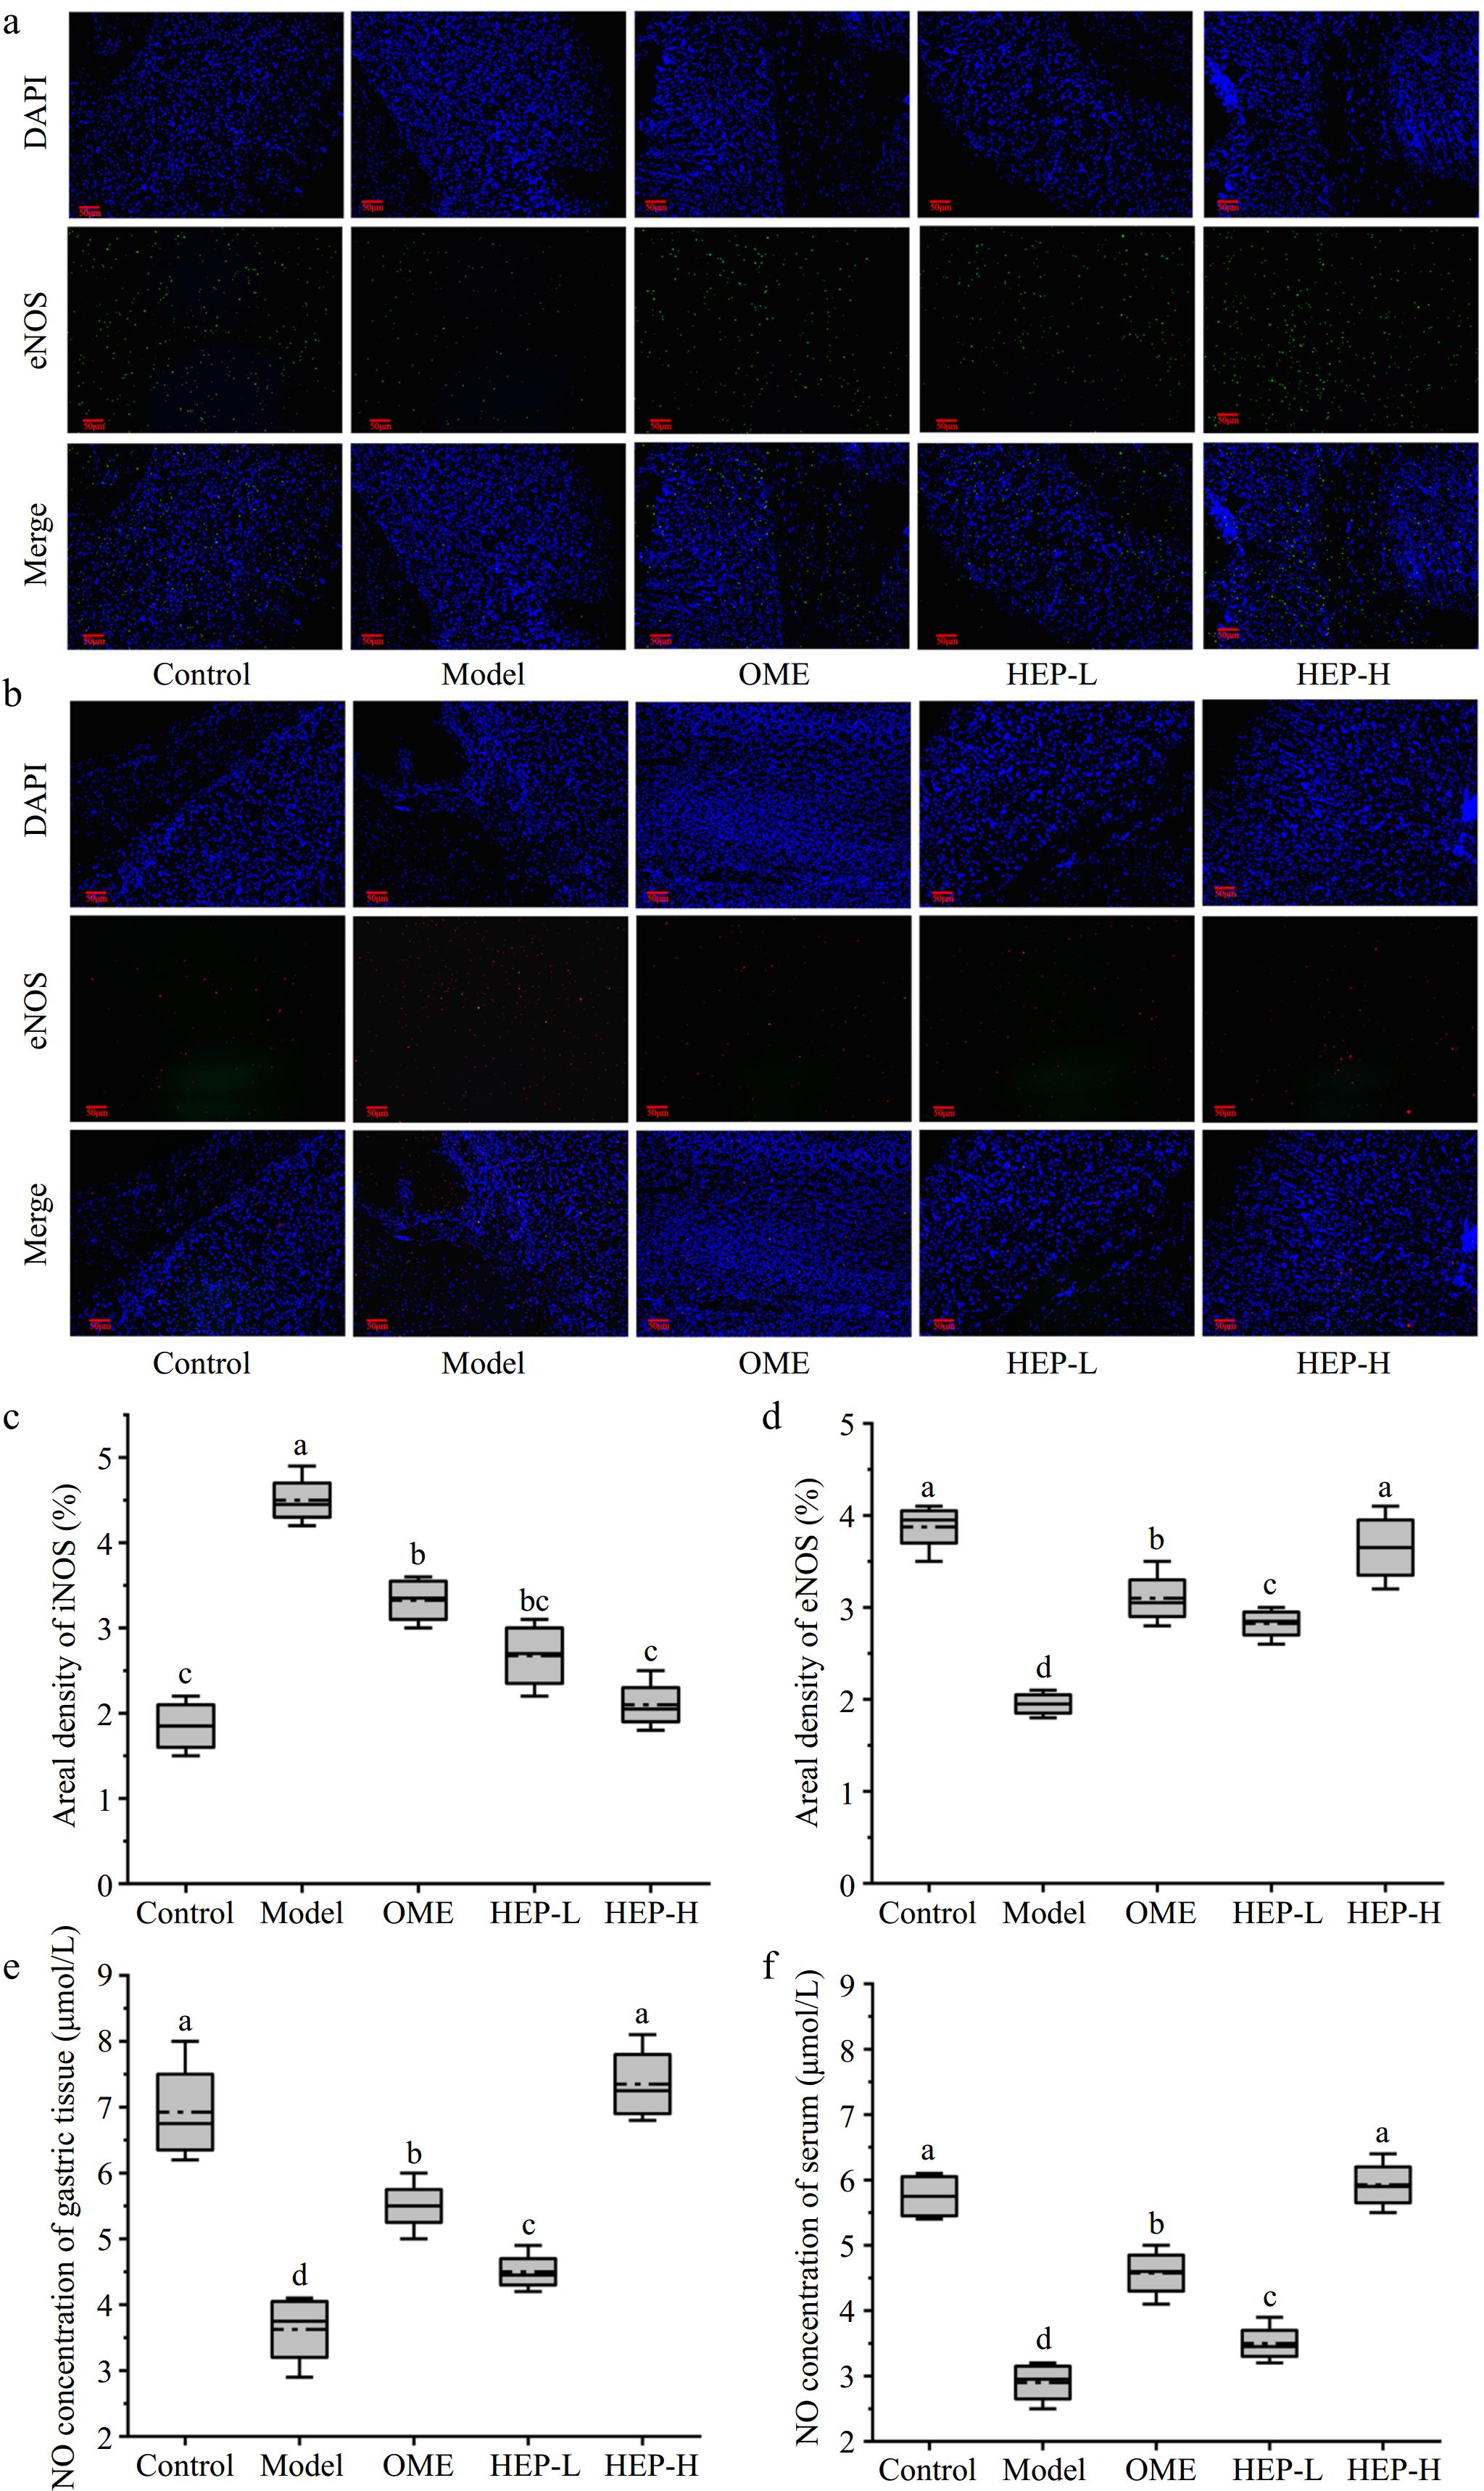
Figure 3.
The levels of eNOS and iNOS in the gastric tissue of mice analyzed by immunofluorescence. (a) Endothelial nitric oxide synthase (eNOS). (b) Induction nitric oxide synthase (iNOS). (c) Areal density of iNOS. (d) Areal density of eNOS. (e) The NO of gastric tissue. (f) The NO of serum.
-
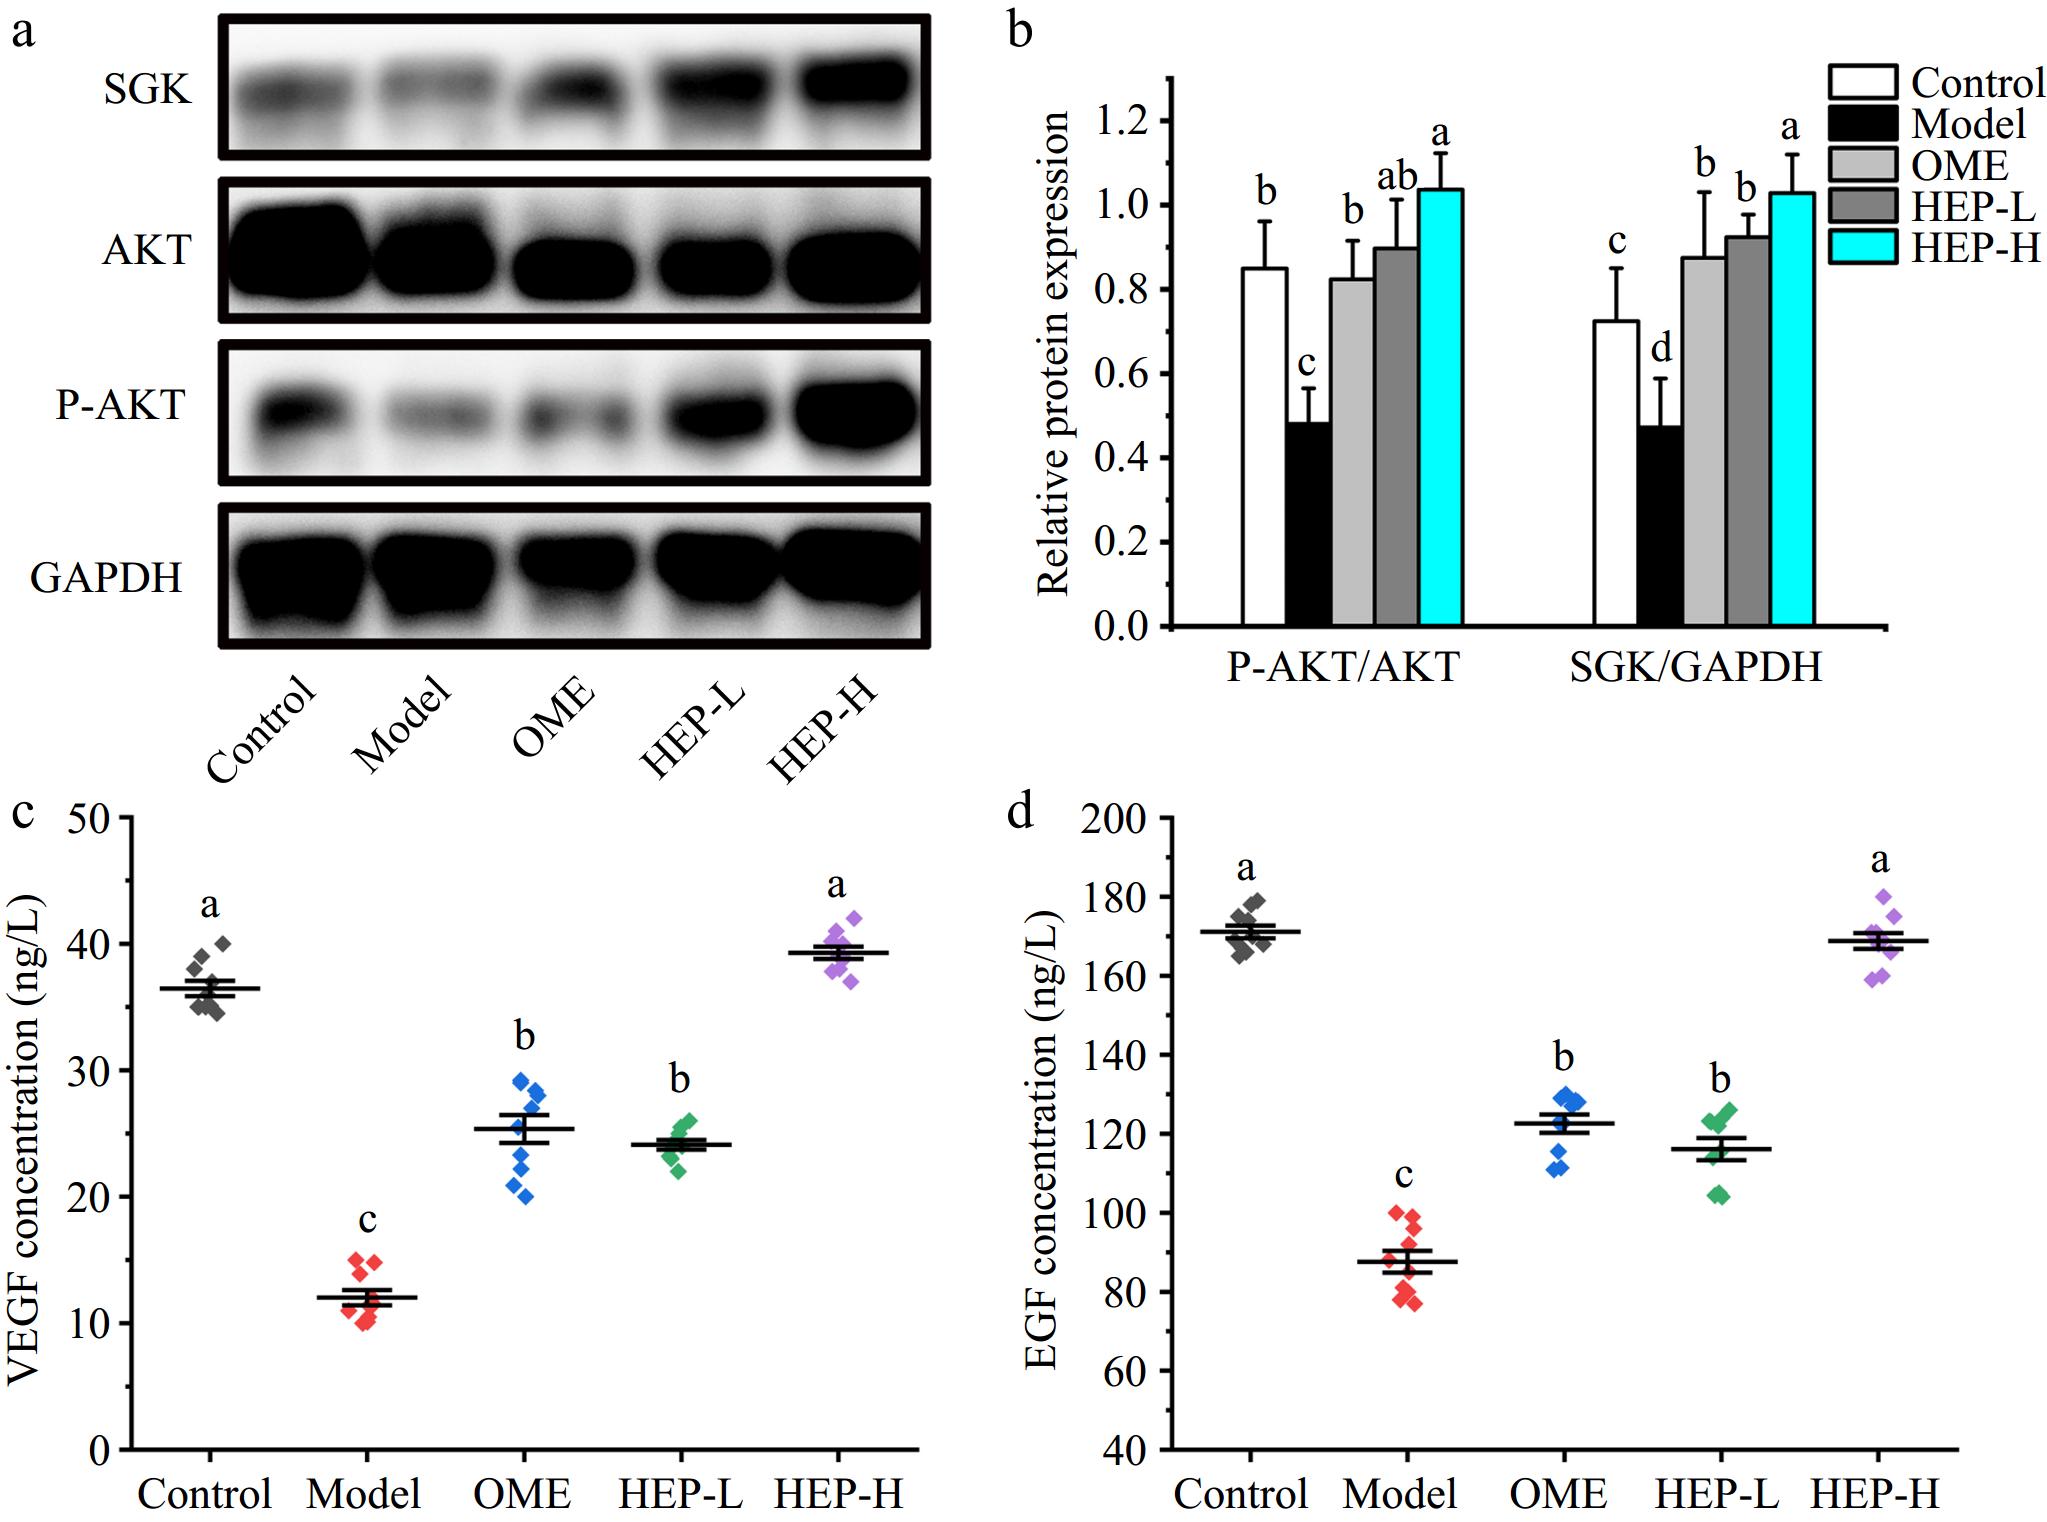
Figure 4.
Effects of HEP-1 on levels of PI3K-AKT signaling pathway-related proteins in ethanol-induced gastric injury. (a), (b) Western blot images of SGK, P-AKT, AKT, and GAPDH. (c) VEGF level in gastric tissue. (d) Epidermal growth factor (EGF) level in gastric tissue. The gray quantitative data of western blotting was determined by image J software.
-
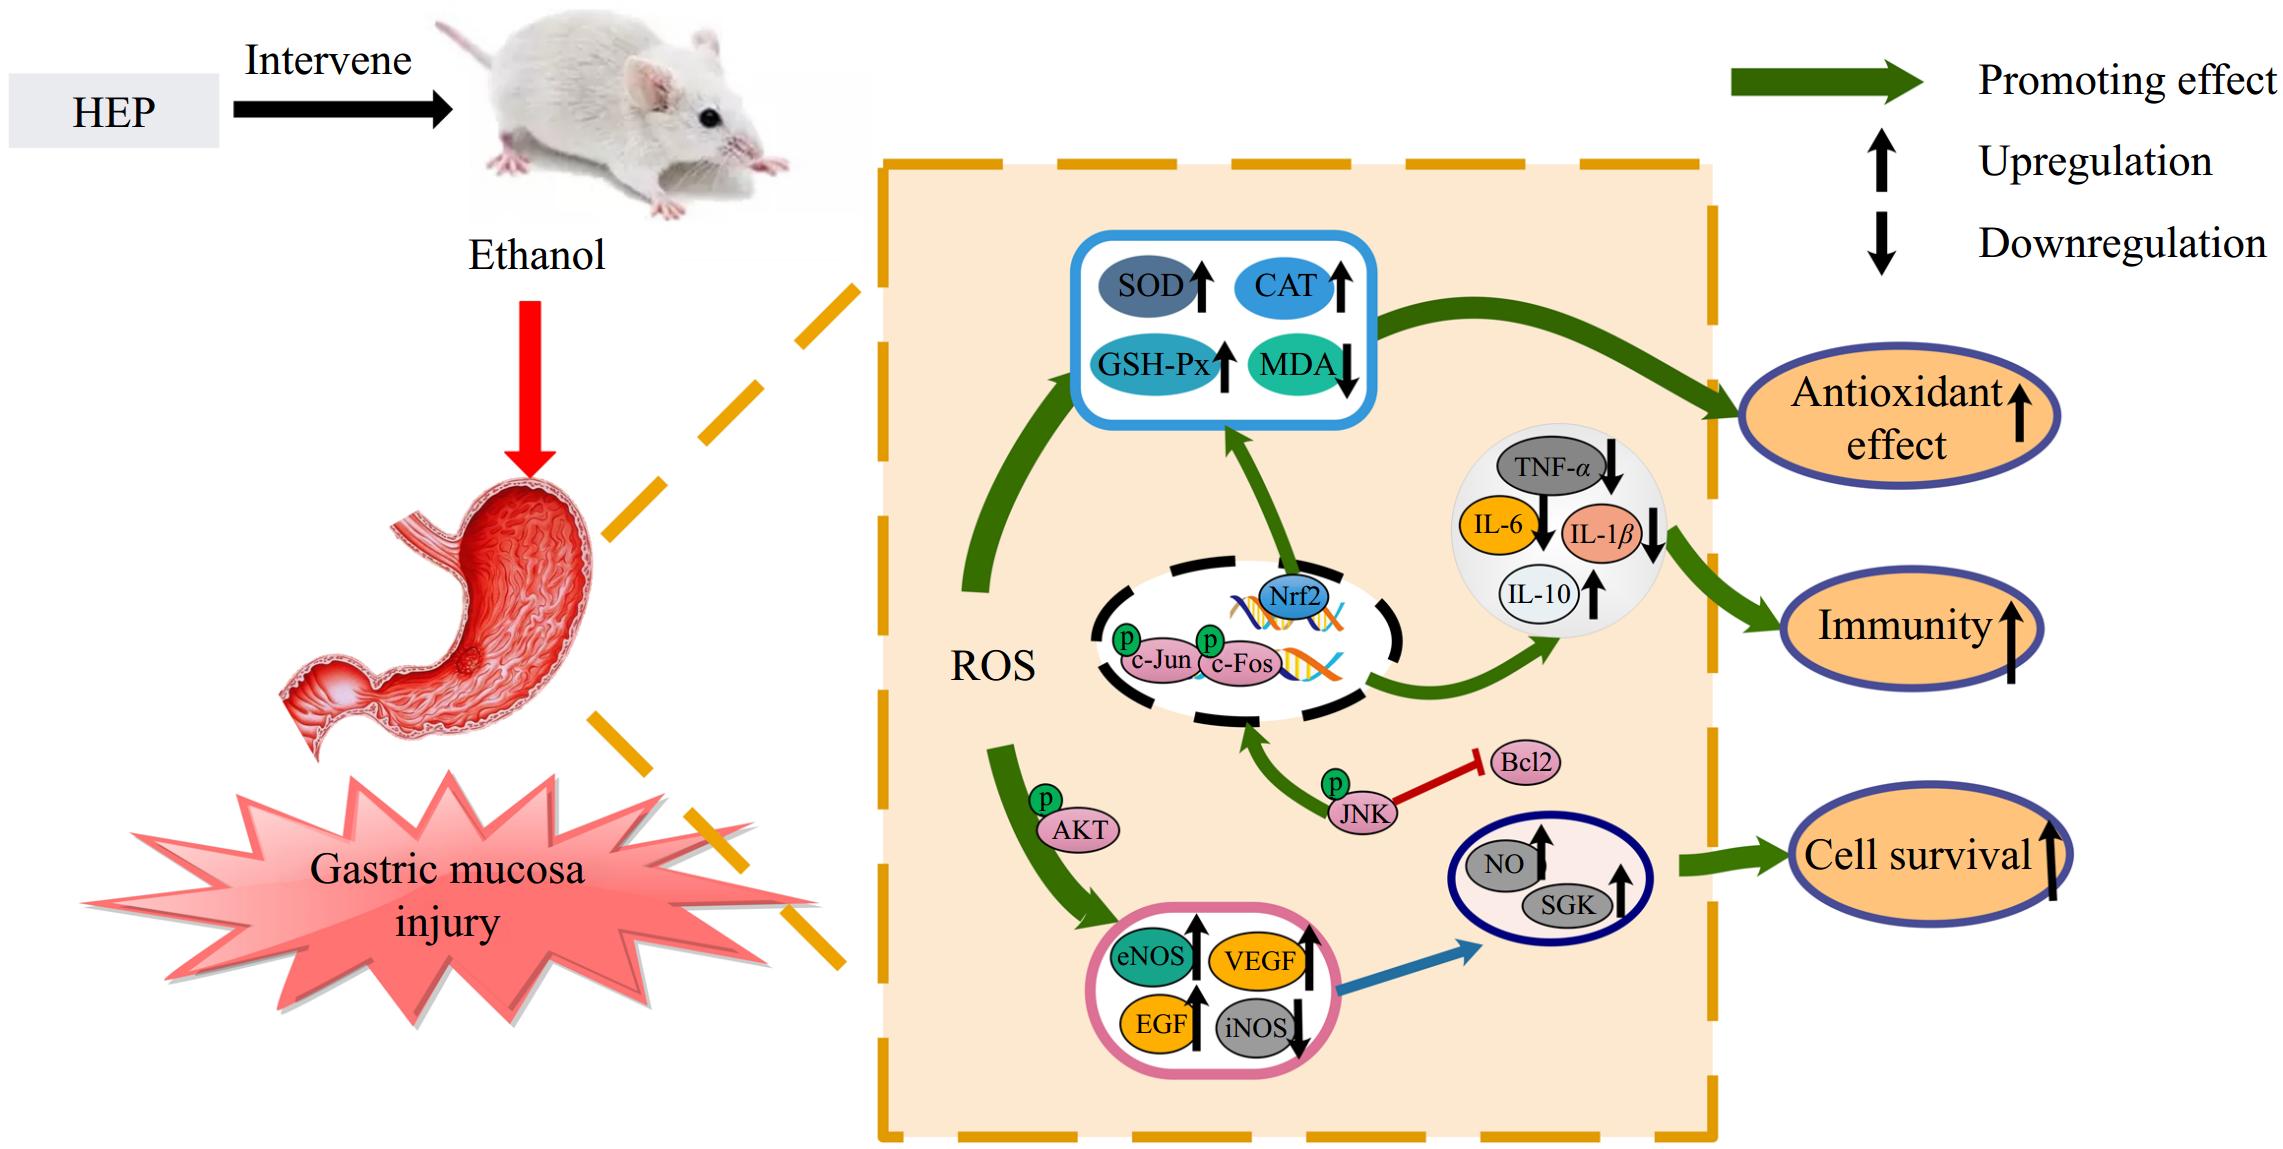
Figure 5.
HEP protect against gastric mucosa injury via modulating inflammatory factors, promoting antioxidant activity, and activating the PI3K-AKT pathway.
-
Group Dose level Male number Duration
(weeks)Control 0.9% Saline (gavage) 10 2 Model 0.9% Saline (gavage) 10 2 OME Omeprazole (10 mg/kg b.w., gavage) 10 2 HEP-L HEP-1 (200 mg/kg b.w., gavage) 10 2 HEP-H HEP-1 (400 mg/kg b.w., gavage) 10 2 Table 1.
Mice grouping and dose level.
-
Group Liver index
(mg/g)Spleen index
(mg/g)Kidney index
(mg/g)Thymus index
(mg/g)Control 38.62 ± 1.39 2.38 ± 0.23 15.41 ± 0.23 1.52 ± 0.25 Model 41.37 ± 1.42 2.55 ± 0.14 15.63 ± 0.27 1.55 ± 0.27 OME 40.20 ± 2.50 2.52 ± 0.13 15.36 ± 0.25 1.53 ± 0.26 HEP-L 40.39 ± 1.16 2.56 ± 0.25 15.54 ± 0.29 1.57 ± 0.23 HEP-H 40.82 ± 1.18 2.51 ± 0.21 15.37 ± 0.30 1.51 ± 0.28 Table 2.
Organ index of mice in each group.
Figures
(5)
Tables
(2)