-
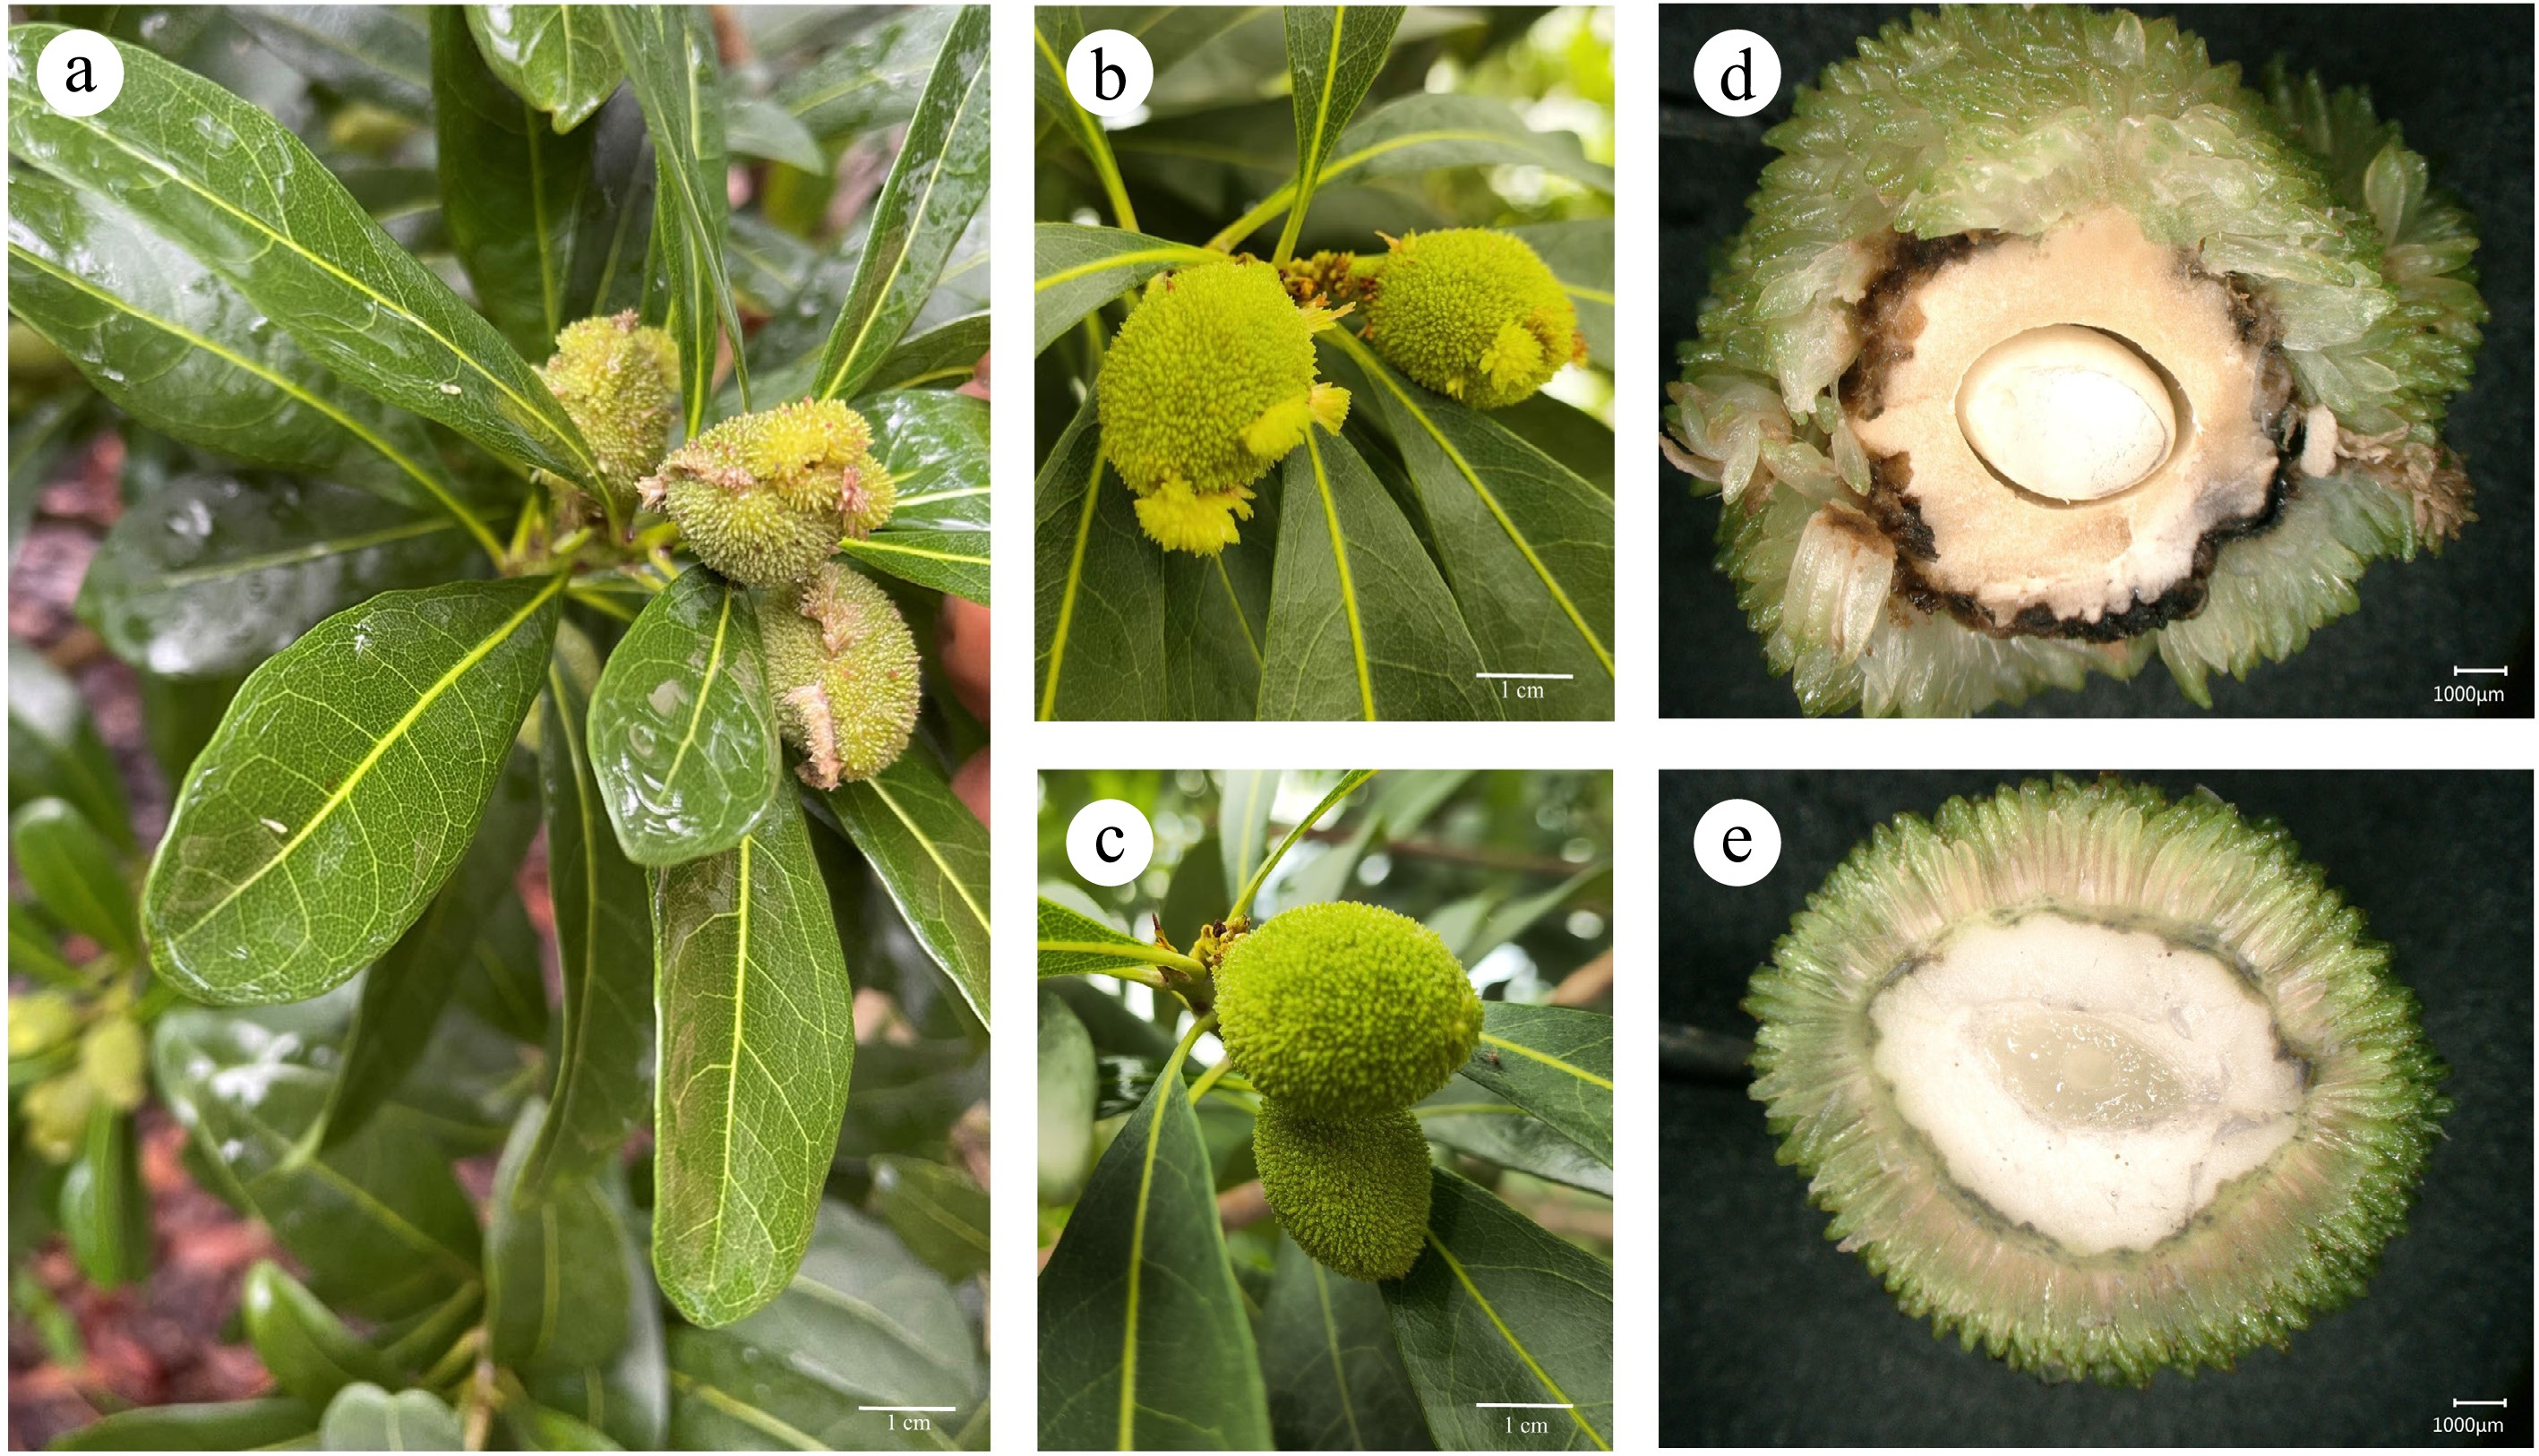
Figure 1.
The phenotype of Roucongbing disease in bayberry fruit. (a) The disease occurs in large areas, (b) morphology of diseased fruits, and (c) healthy fruits, the anatomical observation of (d) diseased fruit, and (e) control fruit.
-

Figure 2.
Hormone content analysis of healthy and diseased fruits. (a) Heatmap and cluster analysis of all endogenous hormones, and the quantitative comparison of (b) 1-aminocyclopropanecarboxylic acid, (c) indole-3-acetic acid, (d) salicylic acid, (e) jasmonic acid, (f) abscisic acid, and (g) gibberellin A3 were analyzed in healthy and diseased fruits. Error bars indicate standard error from three biological replicates (n = 3). Different lowercase letters indicate significant differences (Student's t-test; p < 0.05).
-

Figure 3.
Transcriptome analysis of healthy and diseased fruits. (a) Heatmap of Pearson correlation analysis. (b) Principal component analysis of all samples. (c) Heatmap clustering, and (d) volcano plot analysis of all differentially expressed genes. (e) Venn diagrams of all genes.
-
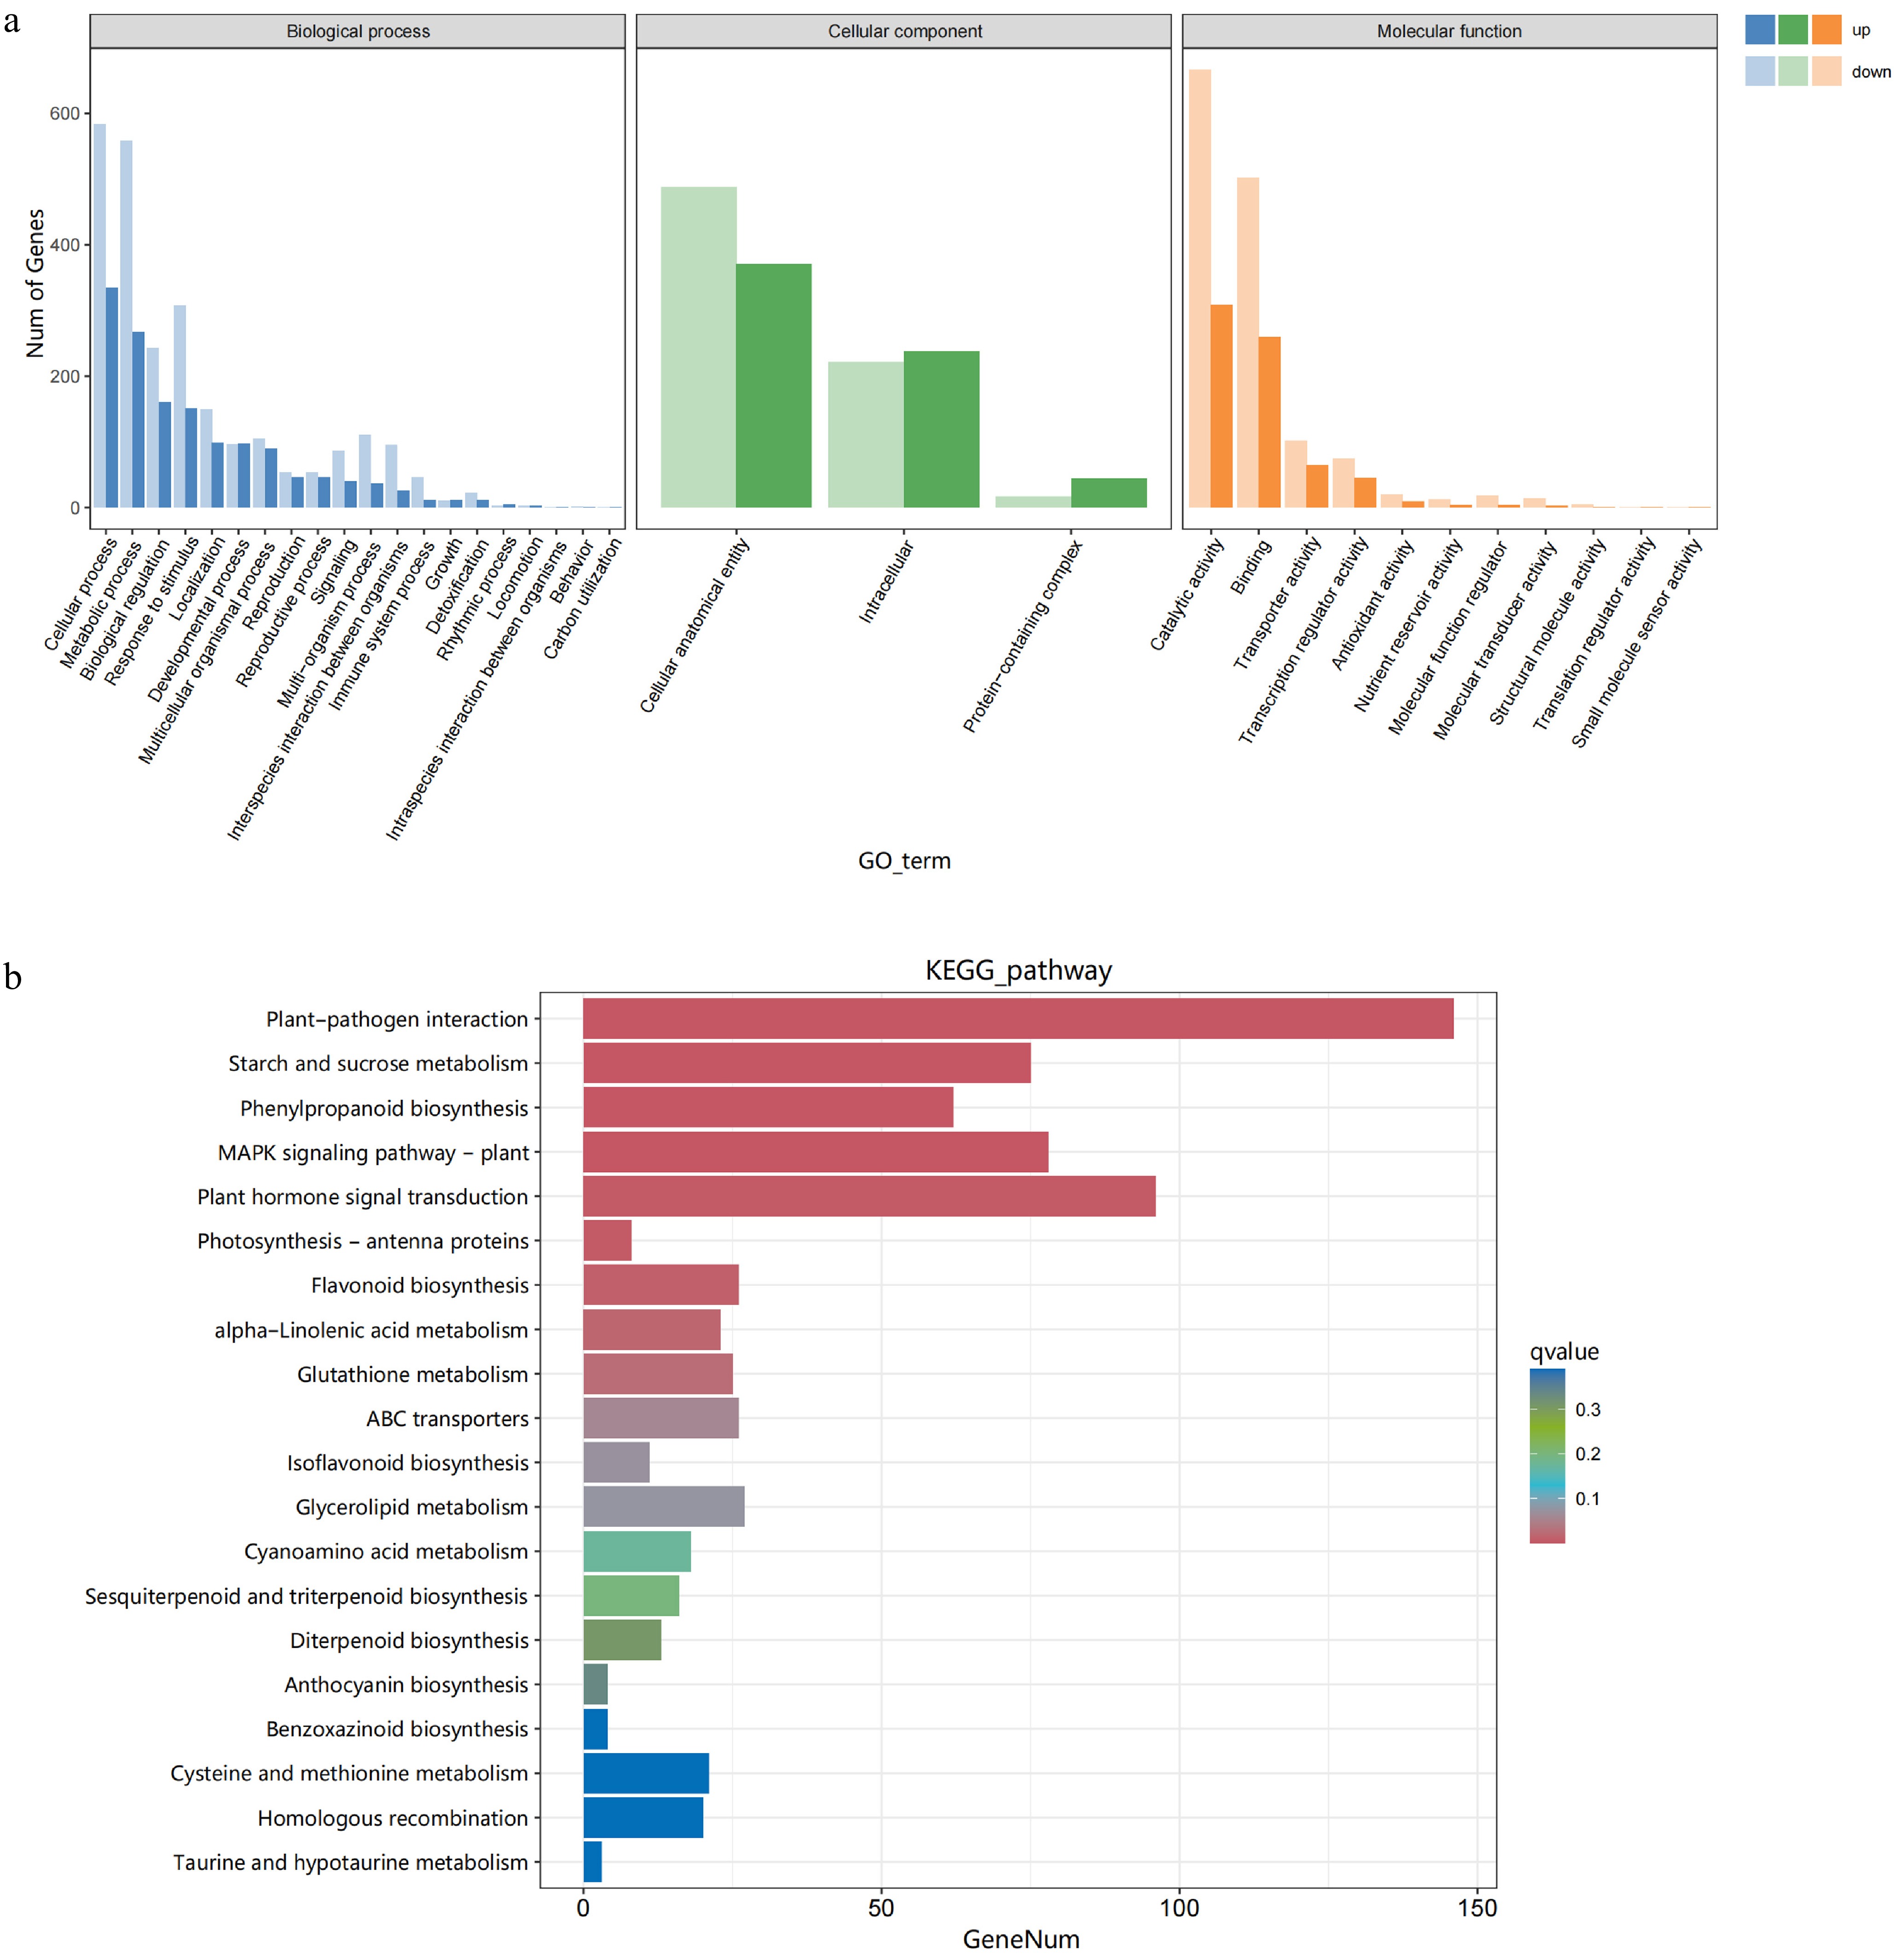
Figure 4.
GO and KEGG analysis. (a) GO enrichment analysis, and (b) the top 20 KEGG pathways of DEGs were analyzed in healthy and diseased fruits.
-
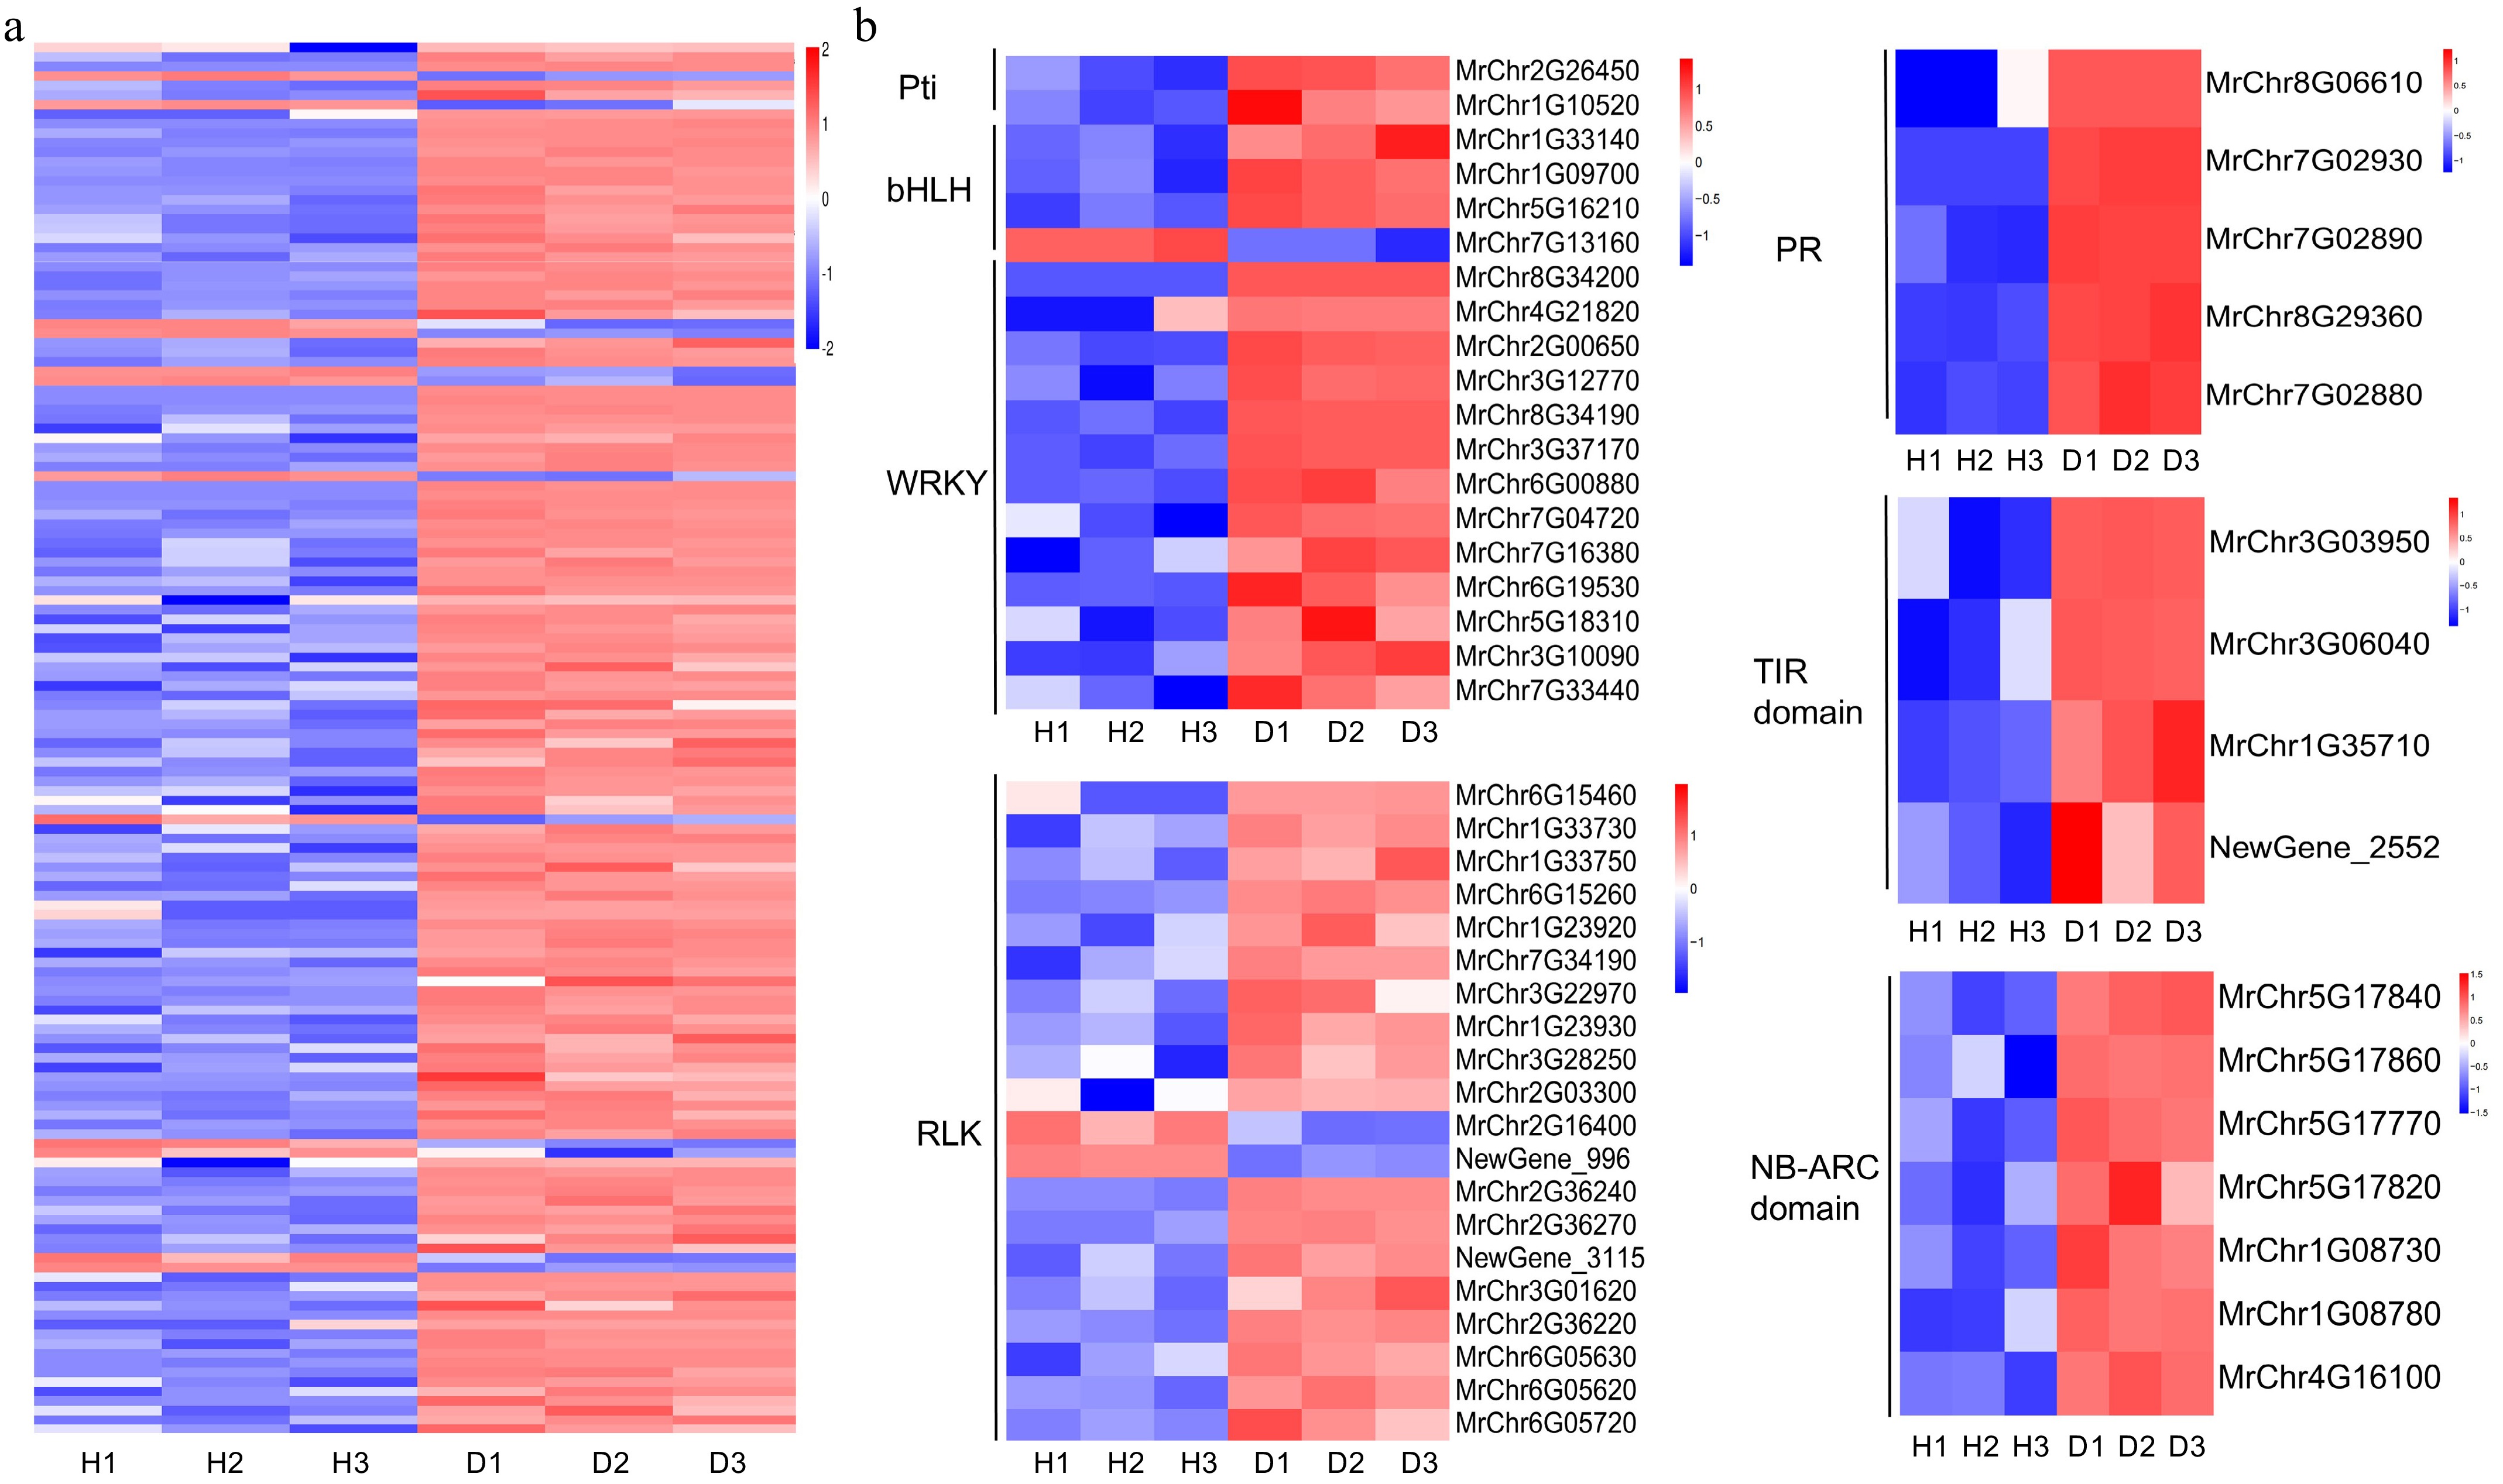
Figure 5.
Heatmap analysis of plant-pathogen interaction pathway. (a) Heatmap of 146 DEGs of the plant-pathogen interaction pathway. (b) Gene expression analysis of some transcription factors families and disease resistance related genes in this pathway.
-
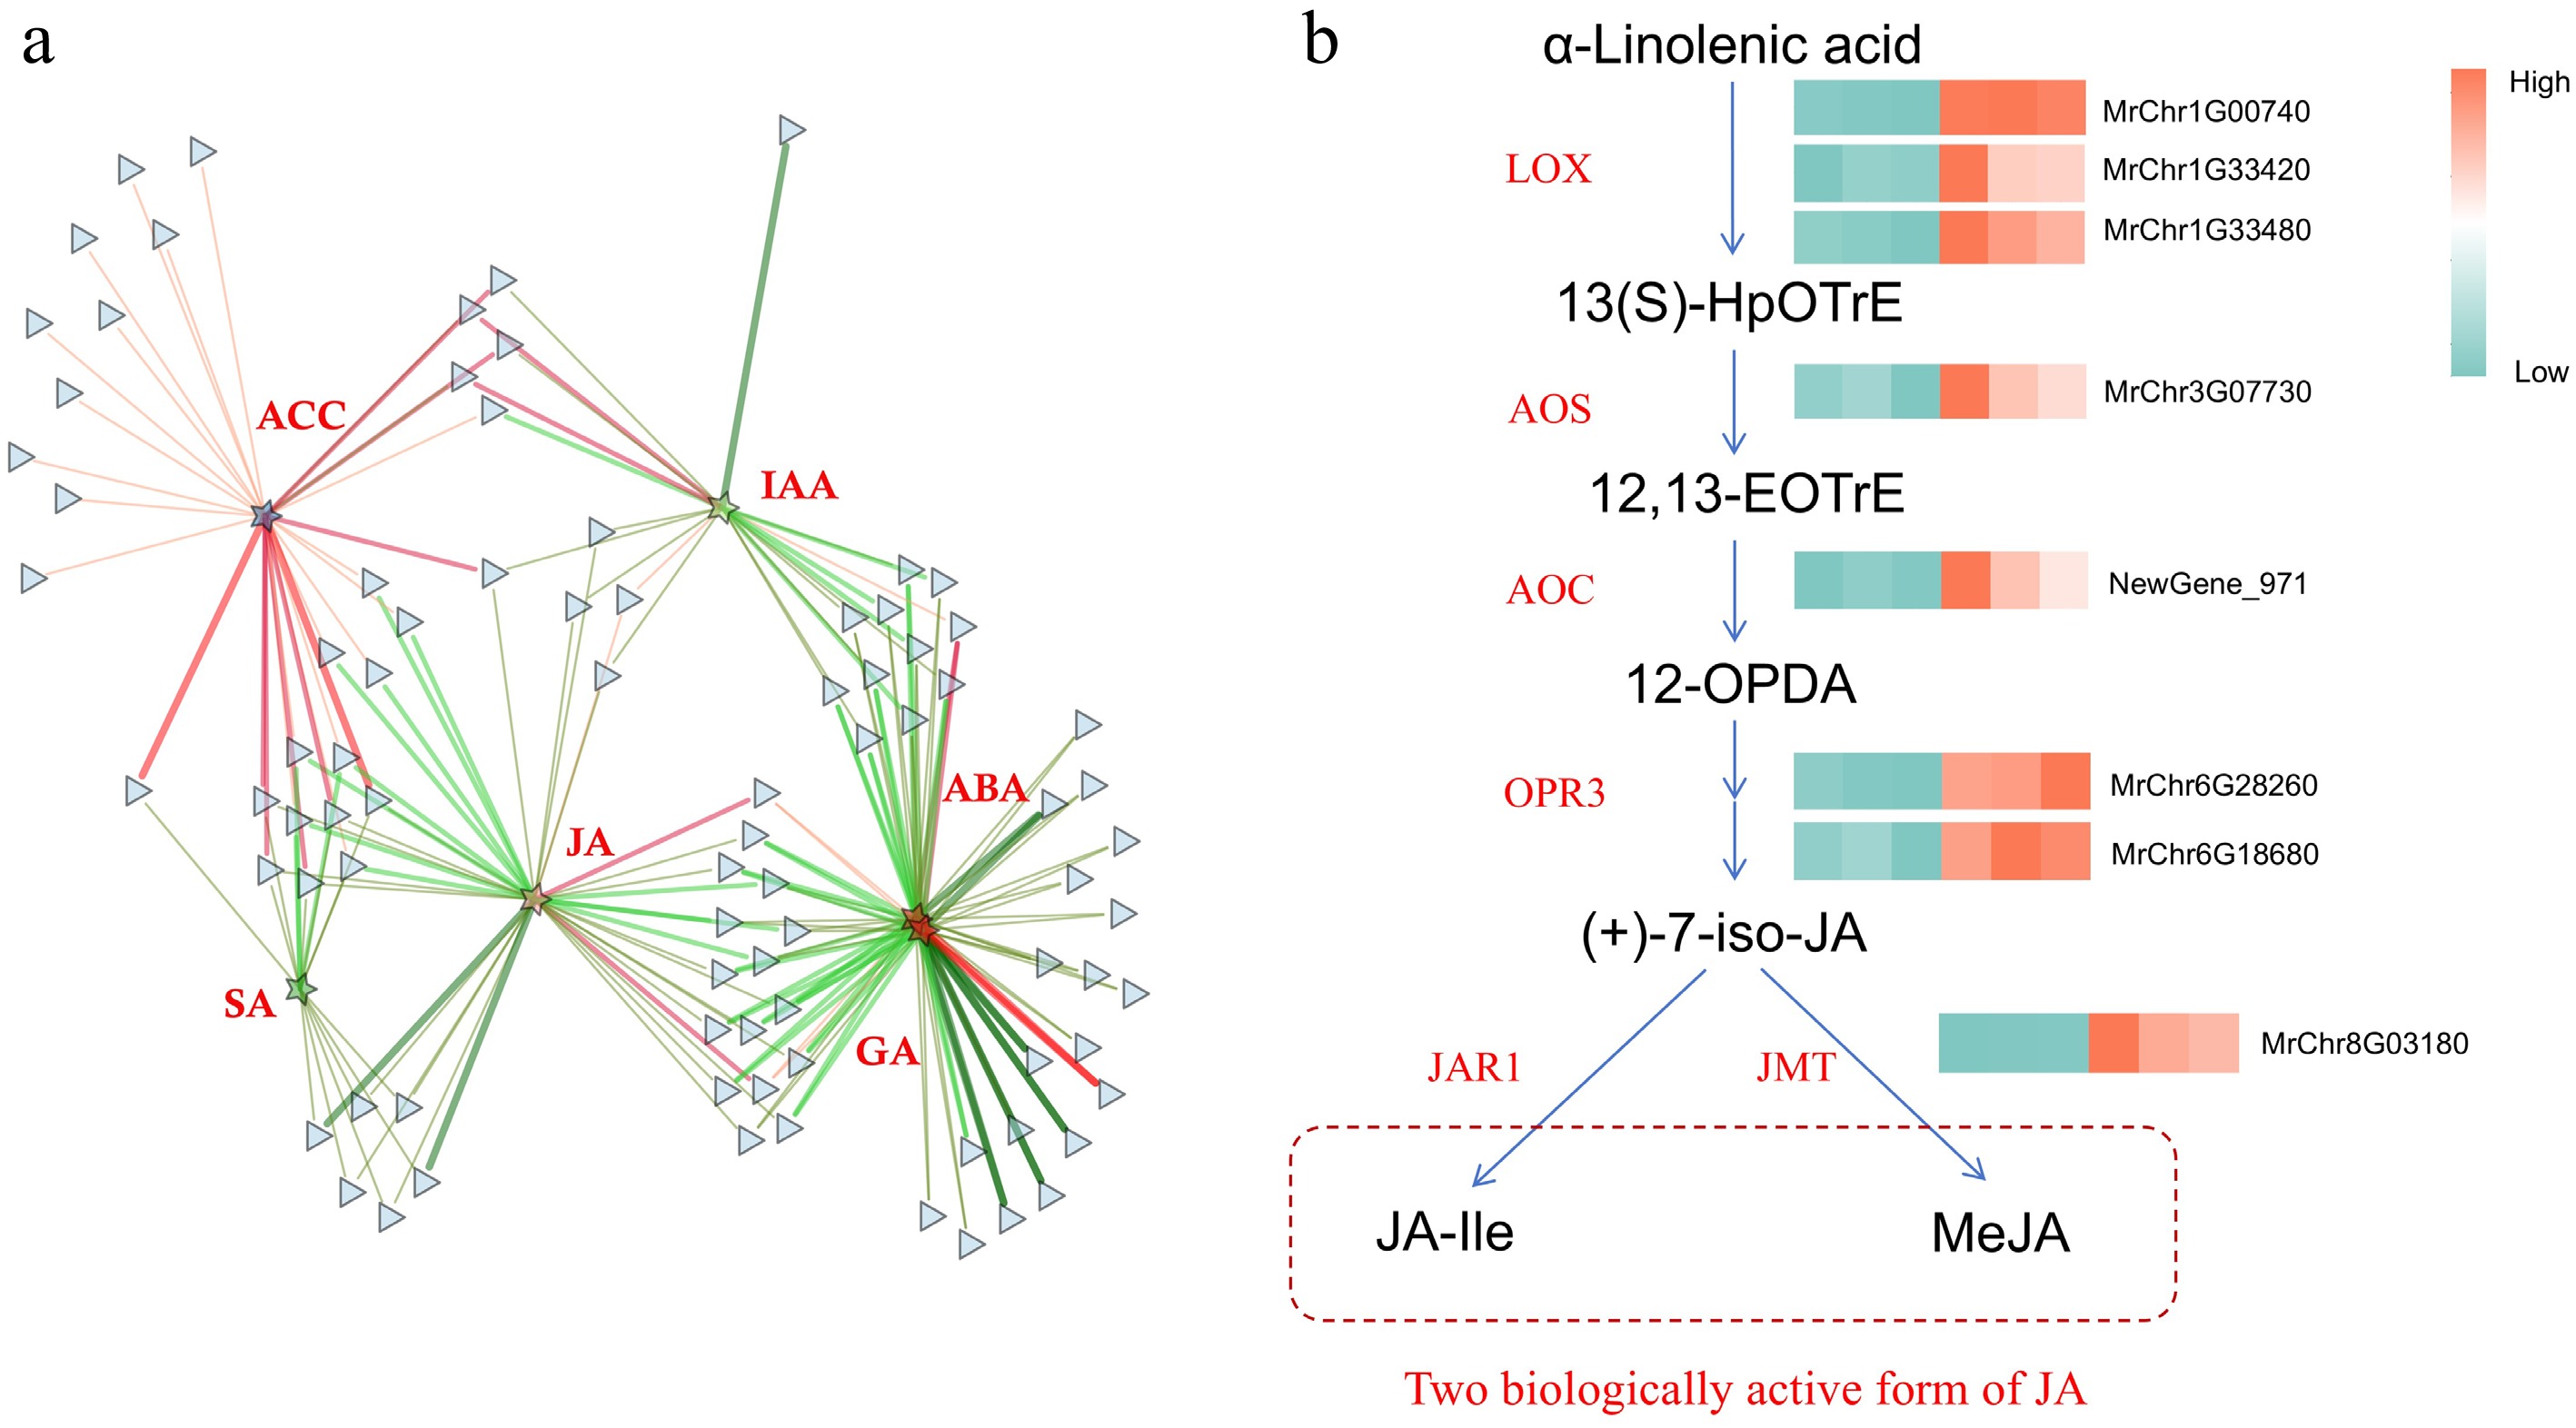
Figure 6.
The role of JA in Roucongbing disease resistance. (a) Correlation network diagram of the plant-pathogen interaction pathway and six major hormones. (b) Transcriptome analysis of the expression patterns of JA synthesis related genes. Green to red color indicates the gene expression increasing in abundance.
-
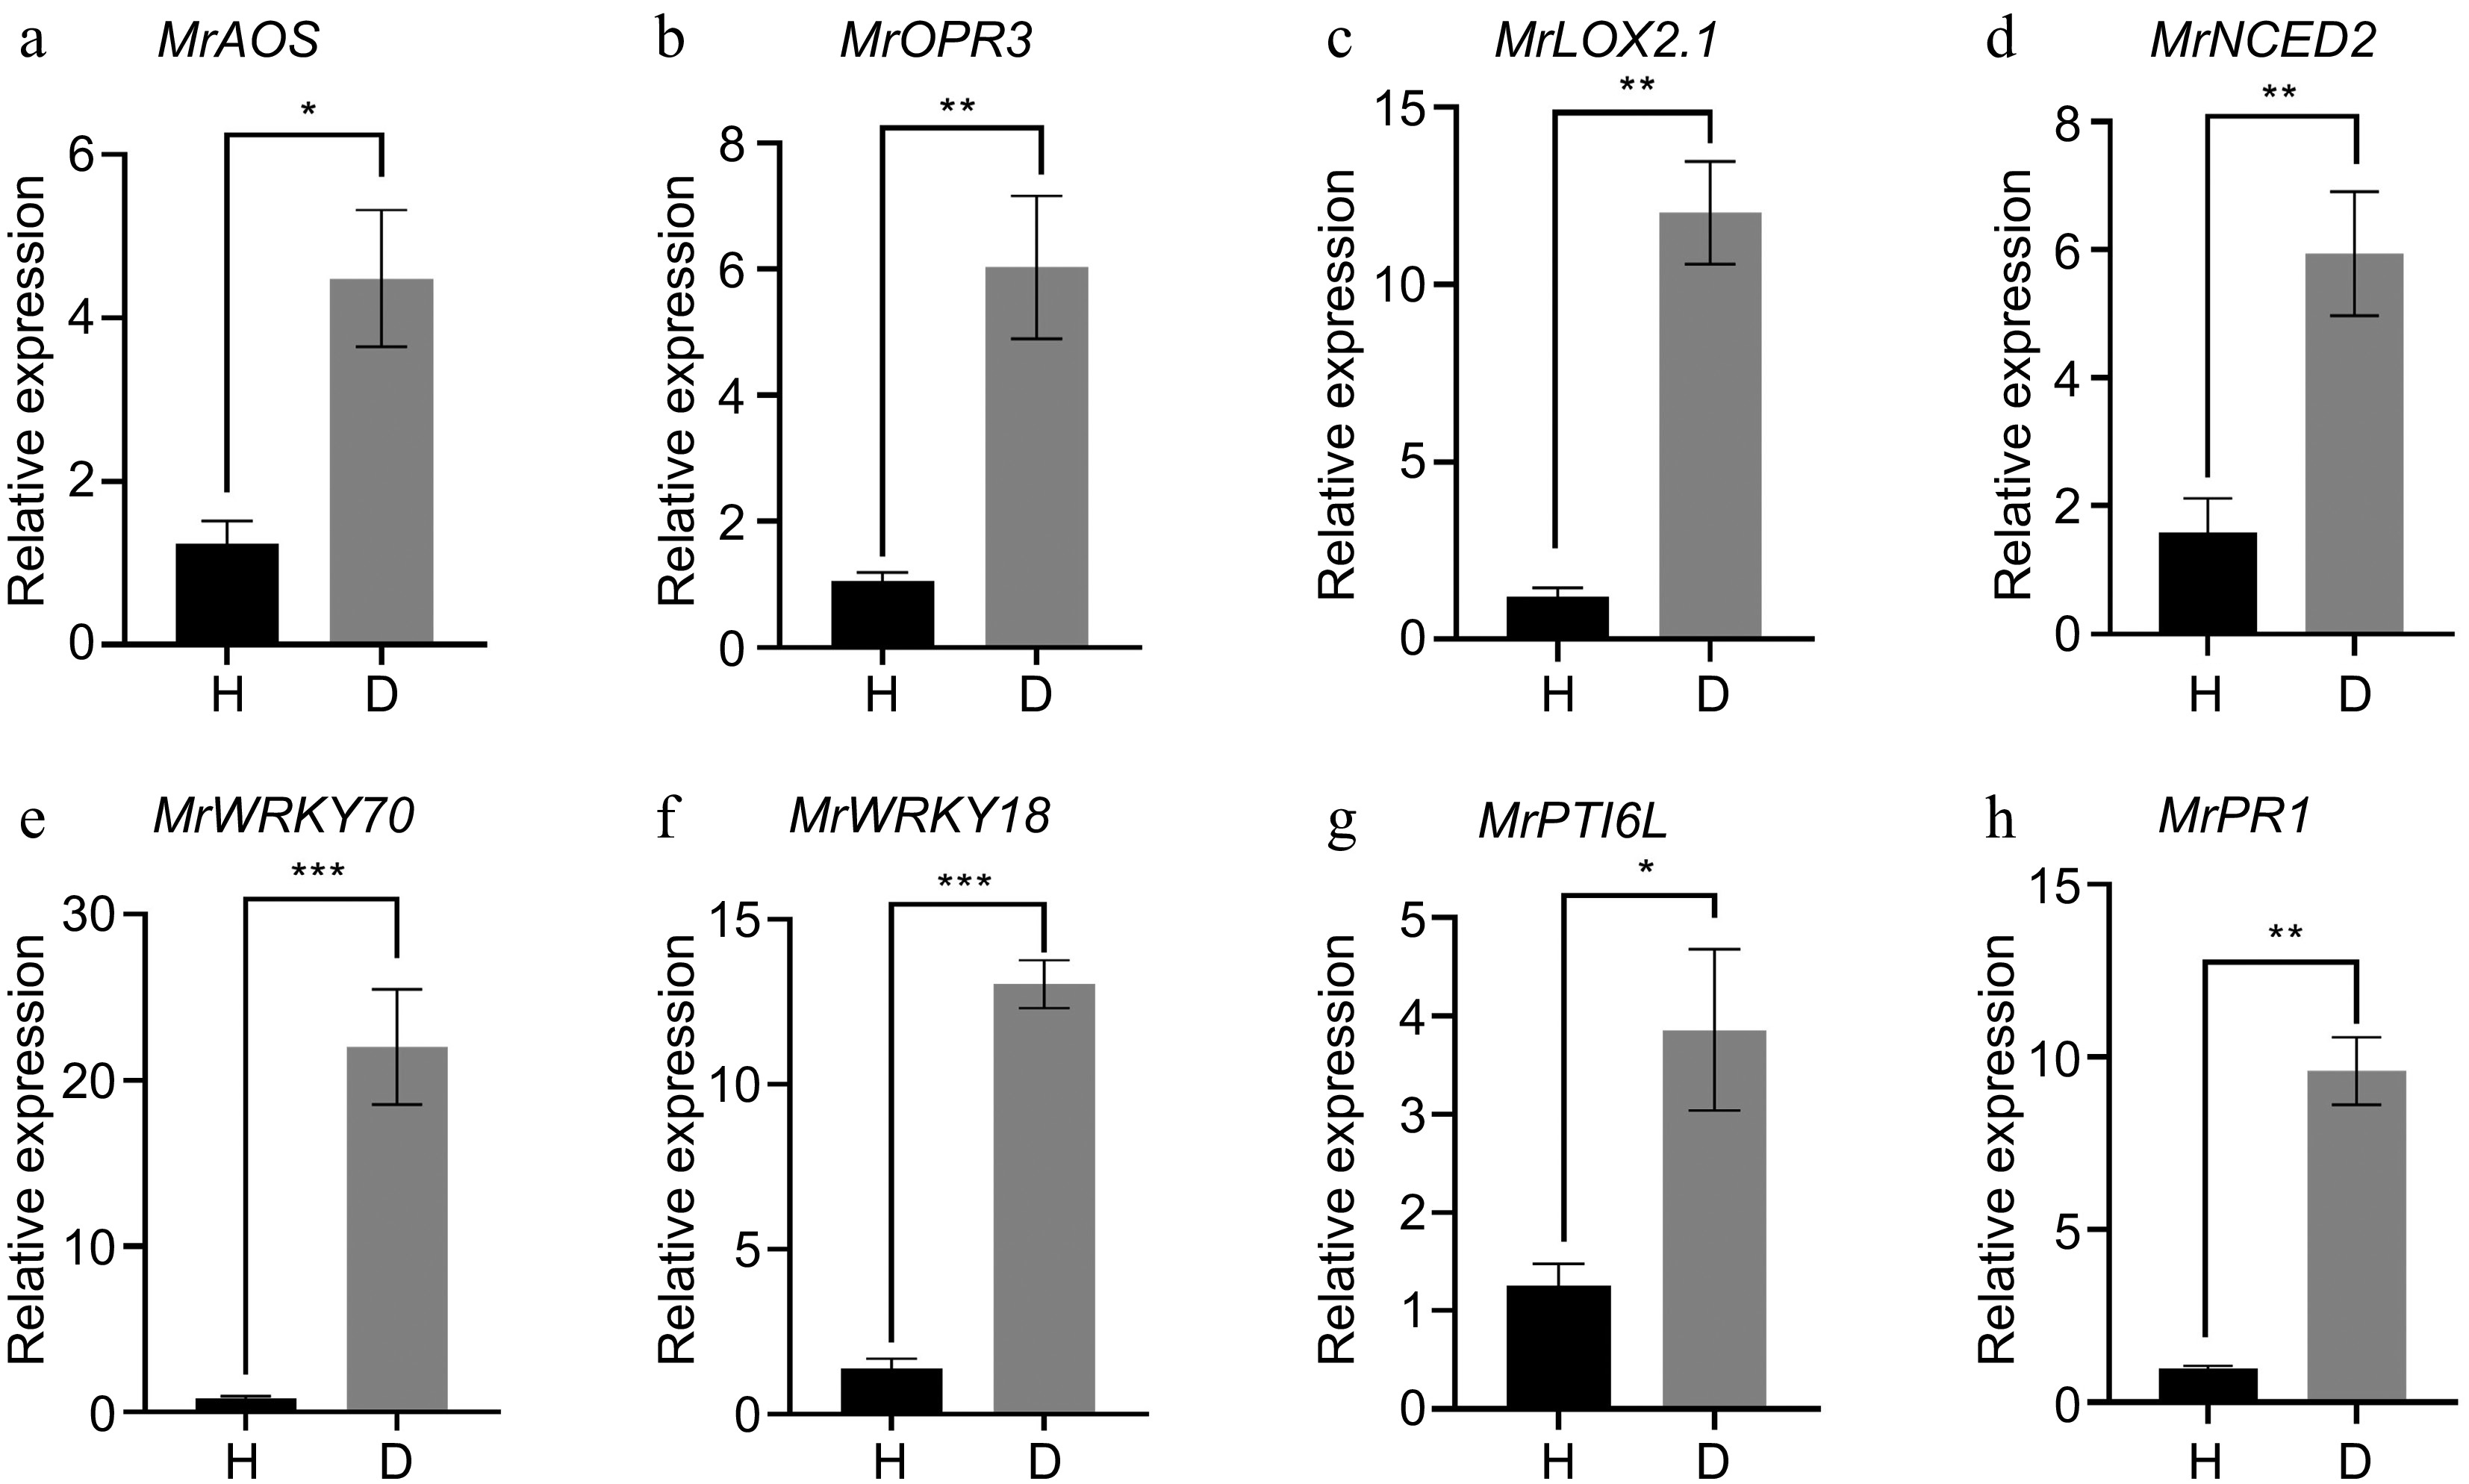
Figure 7.
qRT-PCR analysis of DEGs identified from RNA-Seq. (a) MrAOS: allene oxide synthase 1; (b) MrOPR3: 12-oxophytodienoate reductase 3; (c) MrLOX2.1: Linoleate 13S-lipoxygenase 2-1; (d) MrNCED2: 9-cis-epoxycarotenoid dioxygenase 2; (e) MrWRKY70: transcripdion factor WRKY70; (f) MrWRKY18: transcripdion factor WRKY18; (g) MrPTI6L: pathogenesis-related genes transcriptional activator PTI6-like; (h) MrPR1: Pathogenesis-related protein PR1. Error bars indicate standard error from three biological replicates (n = 3). An asterisk indicates statistically significant differences compared with the control (Student's t-test; * p < 0.05, ** p < 0.01, *** p < 0.001).
-
Leave Fruit CK H D CK H D N (g/kg) 13.51 ± 0.39 b 14.75 ± 0.38 a 13.37 ± 0.34 b 18.89 ± 0.03 c 21.04 ± 0.20 b 22.49 ± 0.07 a K (g/kg) 5.84 ± 0.10 a 5.28 ± 0.11 c 5.57 ± 0.02 b 10.12 ± 0.17 b 12.35 ± 0.43 a 13.56 ± 0.69 a Ca (g/kg) 9.74 ± 0.31 b 10.47 ± 0.36 b 14.13 ± 0.34 a 2.33 ± 0.03 b 2.68 ± 0.09 a 2.76 ± 0.12 a P (g/kg) 0.44 ± 0.01 b 0.40 ± 0.01 c 0.47 ± 0.02 a 1.09 ± 0.04 b 1.30 ± 0.06 a 1.33 ± 0.03 a Mg (g/kg) 1.15 ± 0.05 c 1.27 ± 0.03 b 1.54 ± 0.04 a 0.98 ± 0.04 b 1.13 ± 0.09 a 1.15 ± 0.08 a Mn (mg/kg) 1,256.21 ± 14.70 a 495.29 ± 5.18 b 488.18 ± 7.87 b 197.15 ± 5.63 a 74.75 ± 2.36 b 66.72 ± 0.15 b Fe (mg/kg) 253.88 ± 10.41 a 276.57 ± 12.43 a 252.80 ± 10.04 a 432.43 ± 18.17 a 392.91 ± 21.62 a 400.75 ± 18.47 a Zn (mg/kg) 60.31 ± 0.73 c 88.79 ± 1.40 a 77.30 ± 2.25 b 35.35 ± 0.67 a 35.31 ± 0.93 a 36.63 ± 0.34 a B (mg/kg) 38.92 ± 3.08 a 32.77 ± 1.90 a 35.99 ± 4.15 a 0.75 ± 0.13 a 0.72 ± 0.13 a 0.66 ± 0.09 a Data in the table are expressed as mean ± SE. CK: the leaves and fruits from the trees with no diseased fruits; D: the diseased fruits and surrounding leaves in diseased trees (with more than 20% of diseased fruit); H: the healthy fruits and surrounding leaves from the same trees as D group. Different letters indicate statistically significant differences in one-way ANOVA (p < 0.05). Table 1.
Mineral element contents of leaves and fruits in different groups.
-
#Sample ID ReadSum BaseSum GC (%) N (%) Q20 (%) Q30 (%) H-1 20031820 5981473950 48.12 0 97.92 94.57 H-2 20965481 6269407182 47.99 0 98.04 94.84 H-3 20704915 6179849928 47.96 0 97.87 94.45 D-1 20425378 6102338718 48.64 0 97.29 93.46 D-2 21524247 6421989748 48.15 0 97.66 94.19 D-3 21018045 6268115810 48.17 0 97.59 94 Table 2.
Statistical analysis of transcriptome sequencing data.
Figures
(7)
Tables
(2)