-
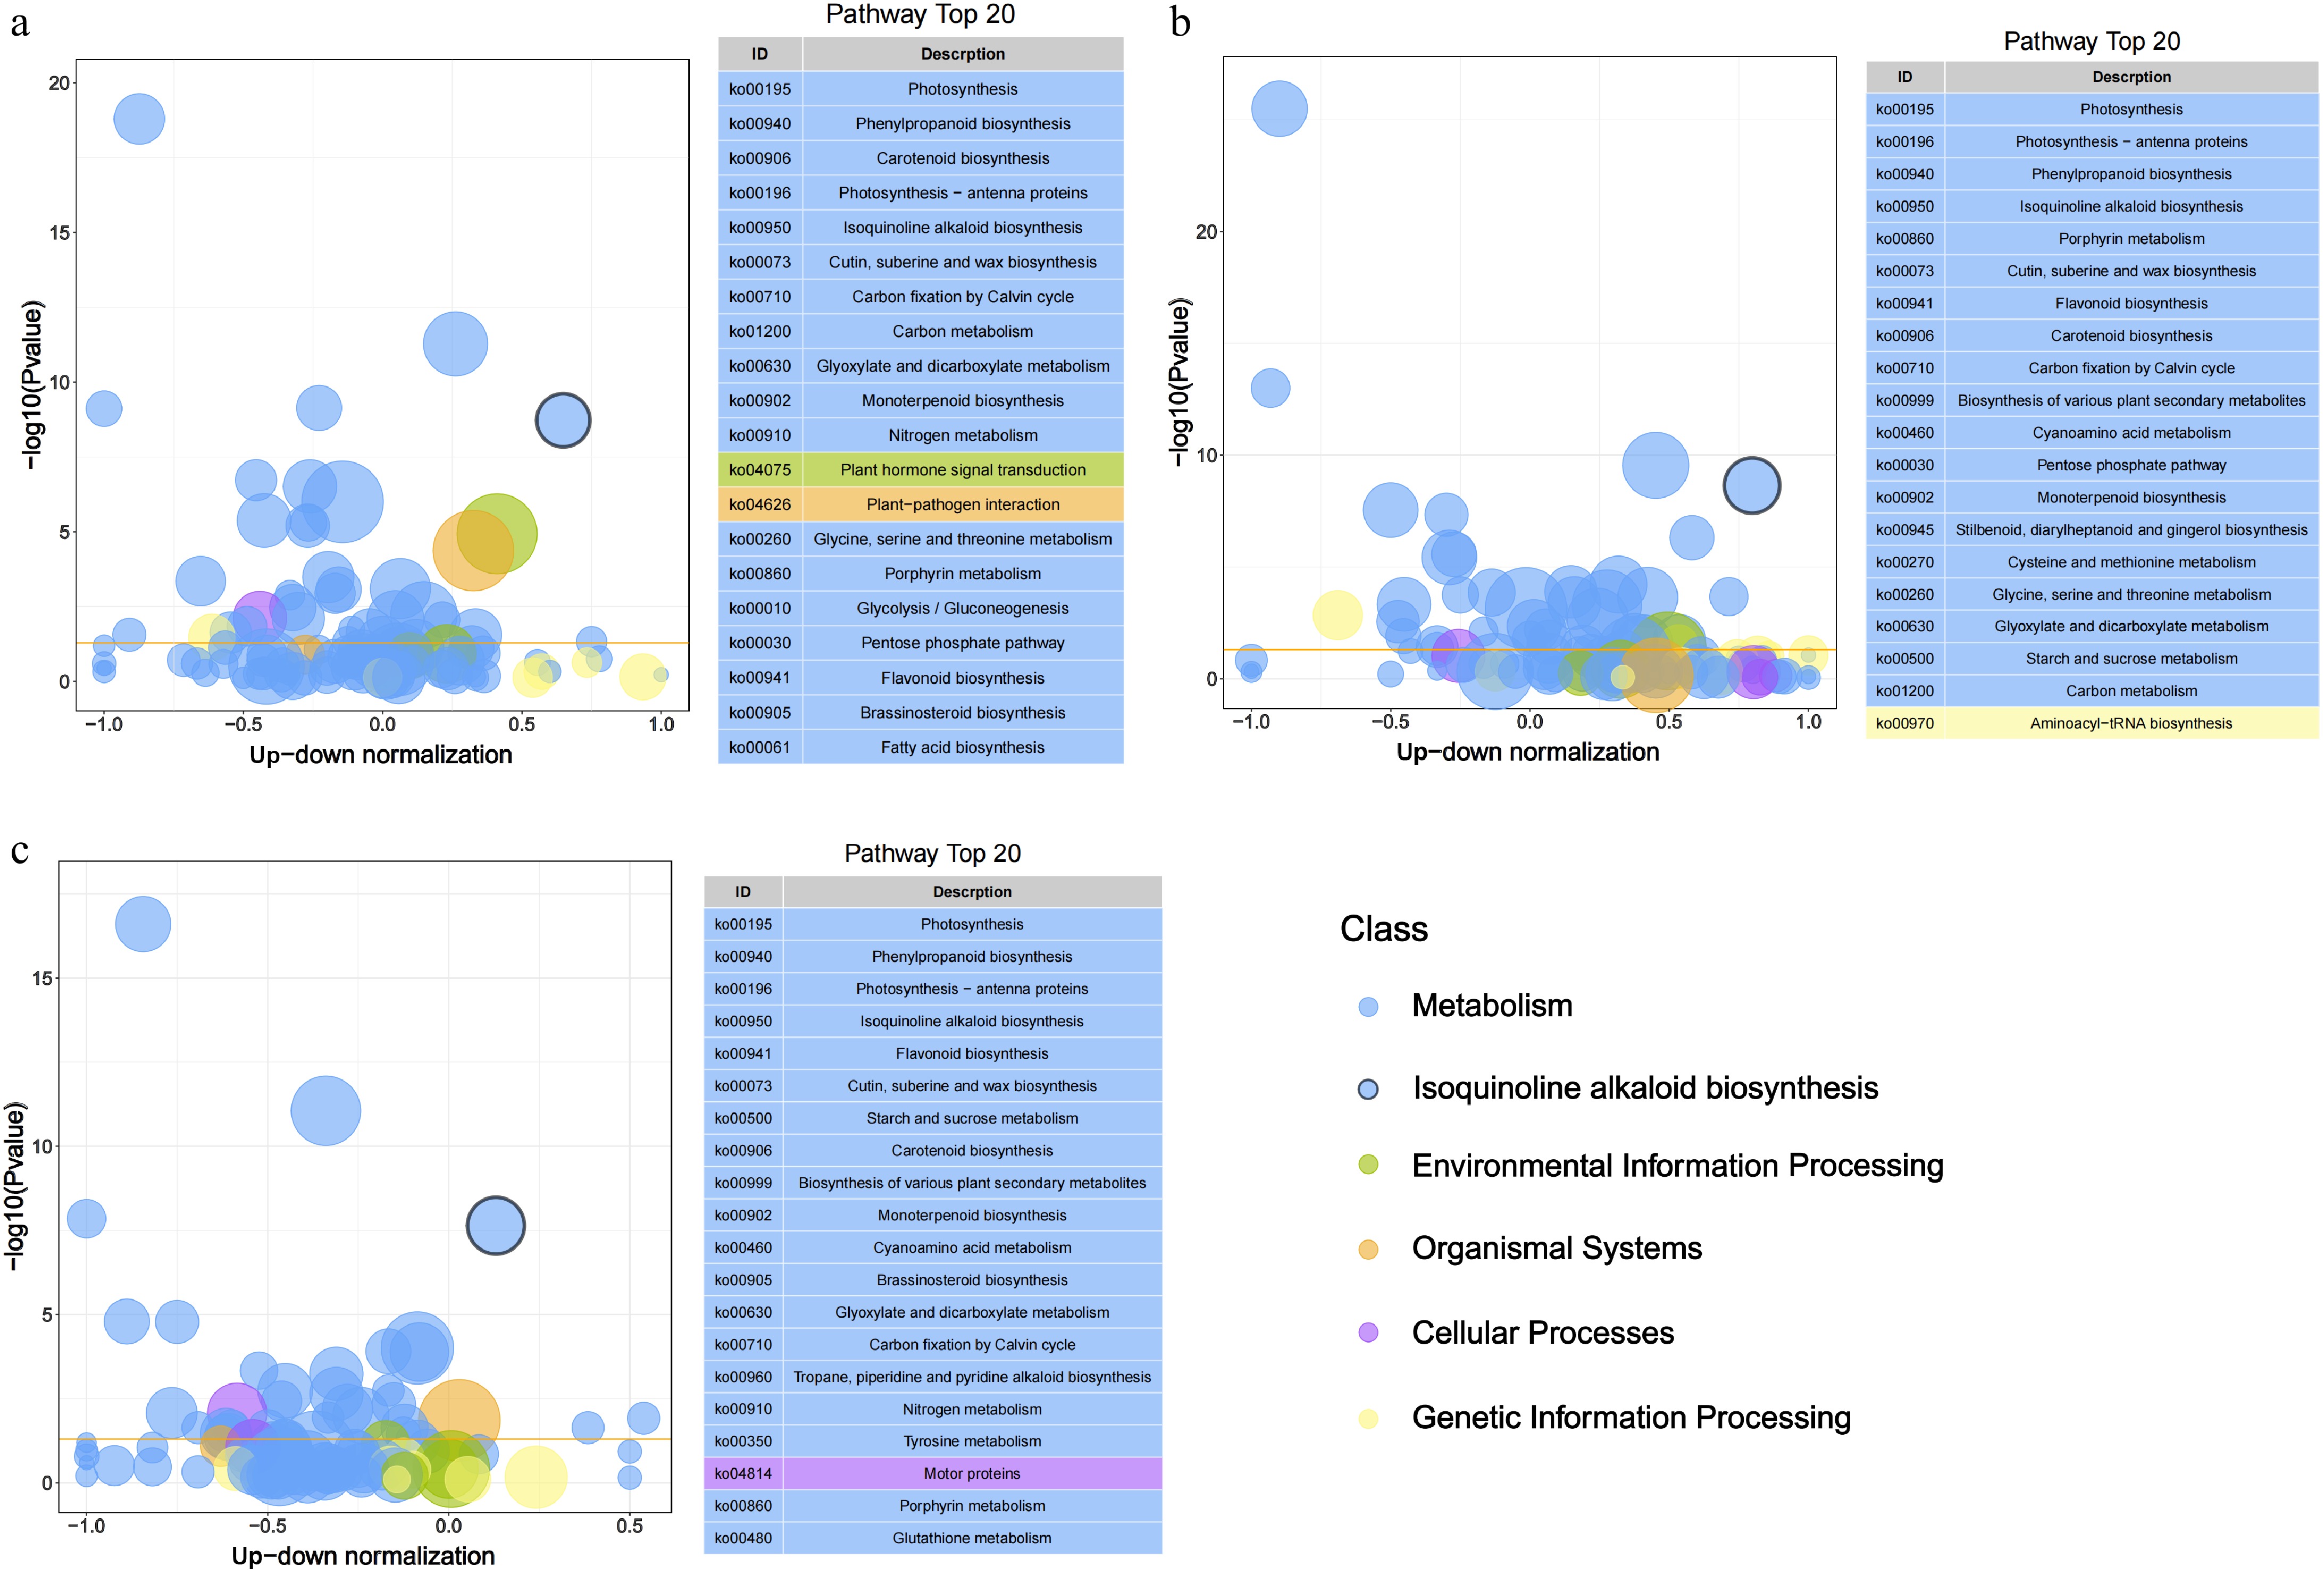
Figure 1.
Bubble plot of KEGG pathway enrichment analysis based on DEGs across tissues. The x-axis represents the up-down normalization value calculated as (Number of up-regulated genes − Number of down-regulated genes)/(Number of up-regulated genes + Number of down-regulated genes), reflecting the directional bias of pathway regulation. Bubble size indicates the number of DEGs per pathway, while color denotes different pathway classes. The yellow line represents the threshold value of p value = 0.05. On the right is the path list of the top 20 with p values.
-
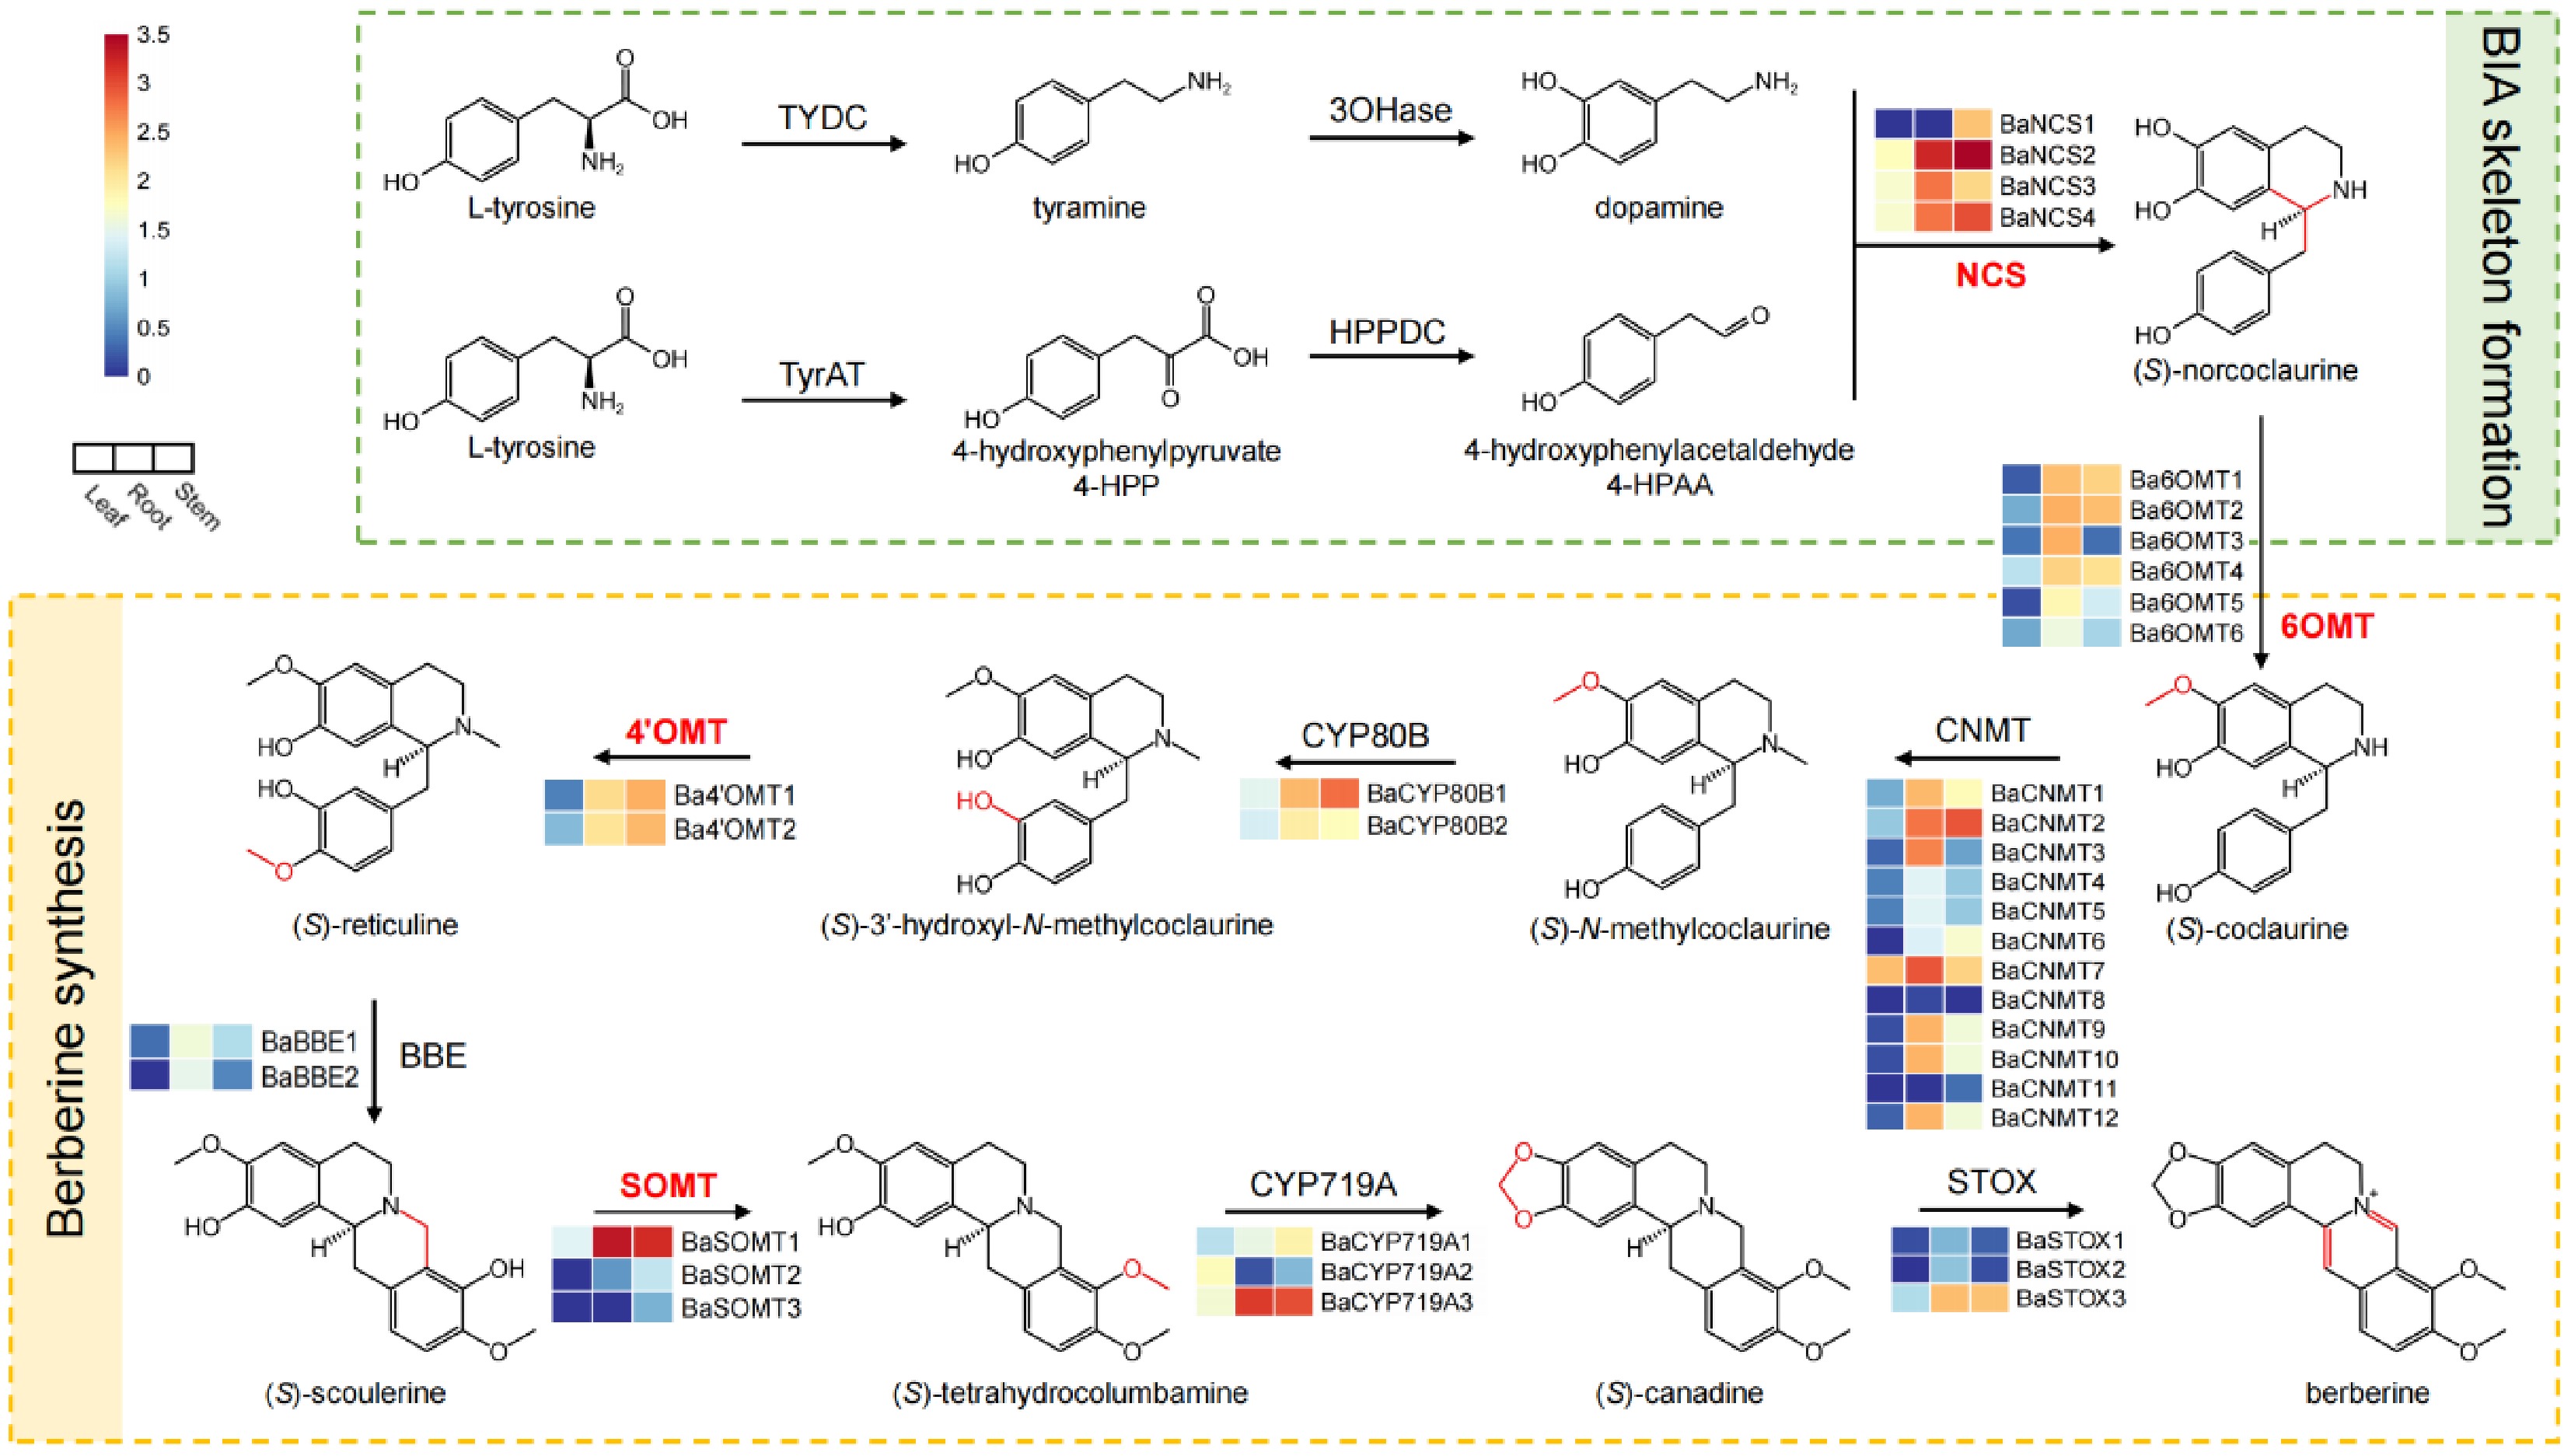
Figure 2.
Gene expression in the biosynthetic pathway of berberine in B. amurensis. The columns from left to right in each heat map display the expression levels of the leaf, root, and stem of B. amurensis. The log10(FPKM+1) values were used for normalization.
-
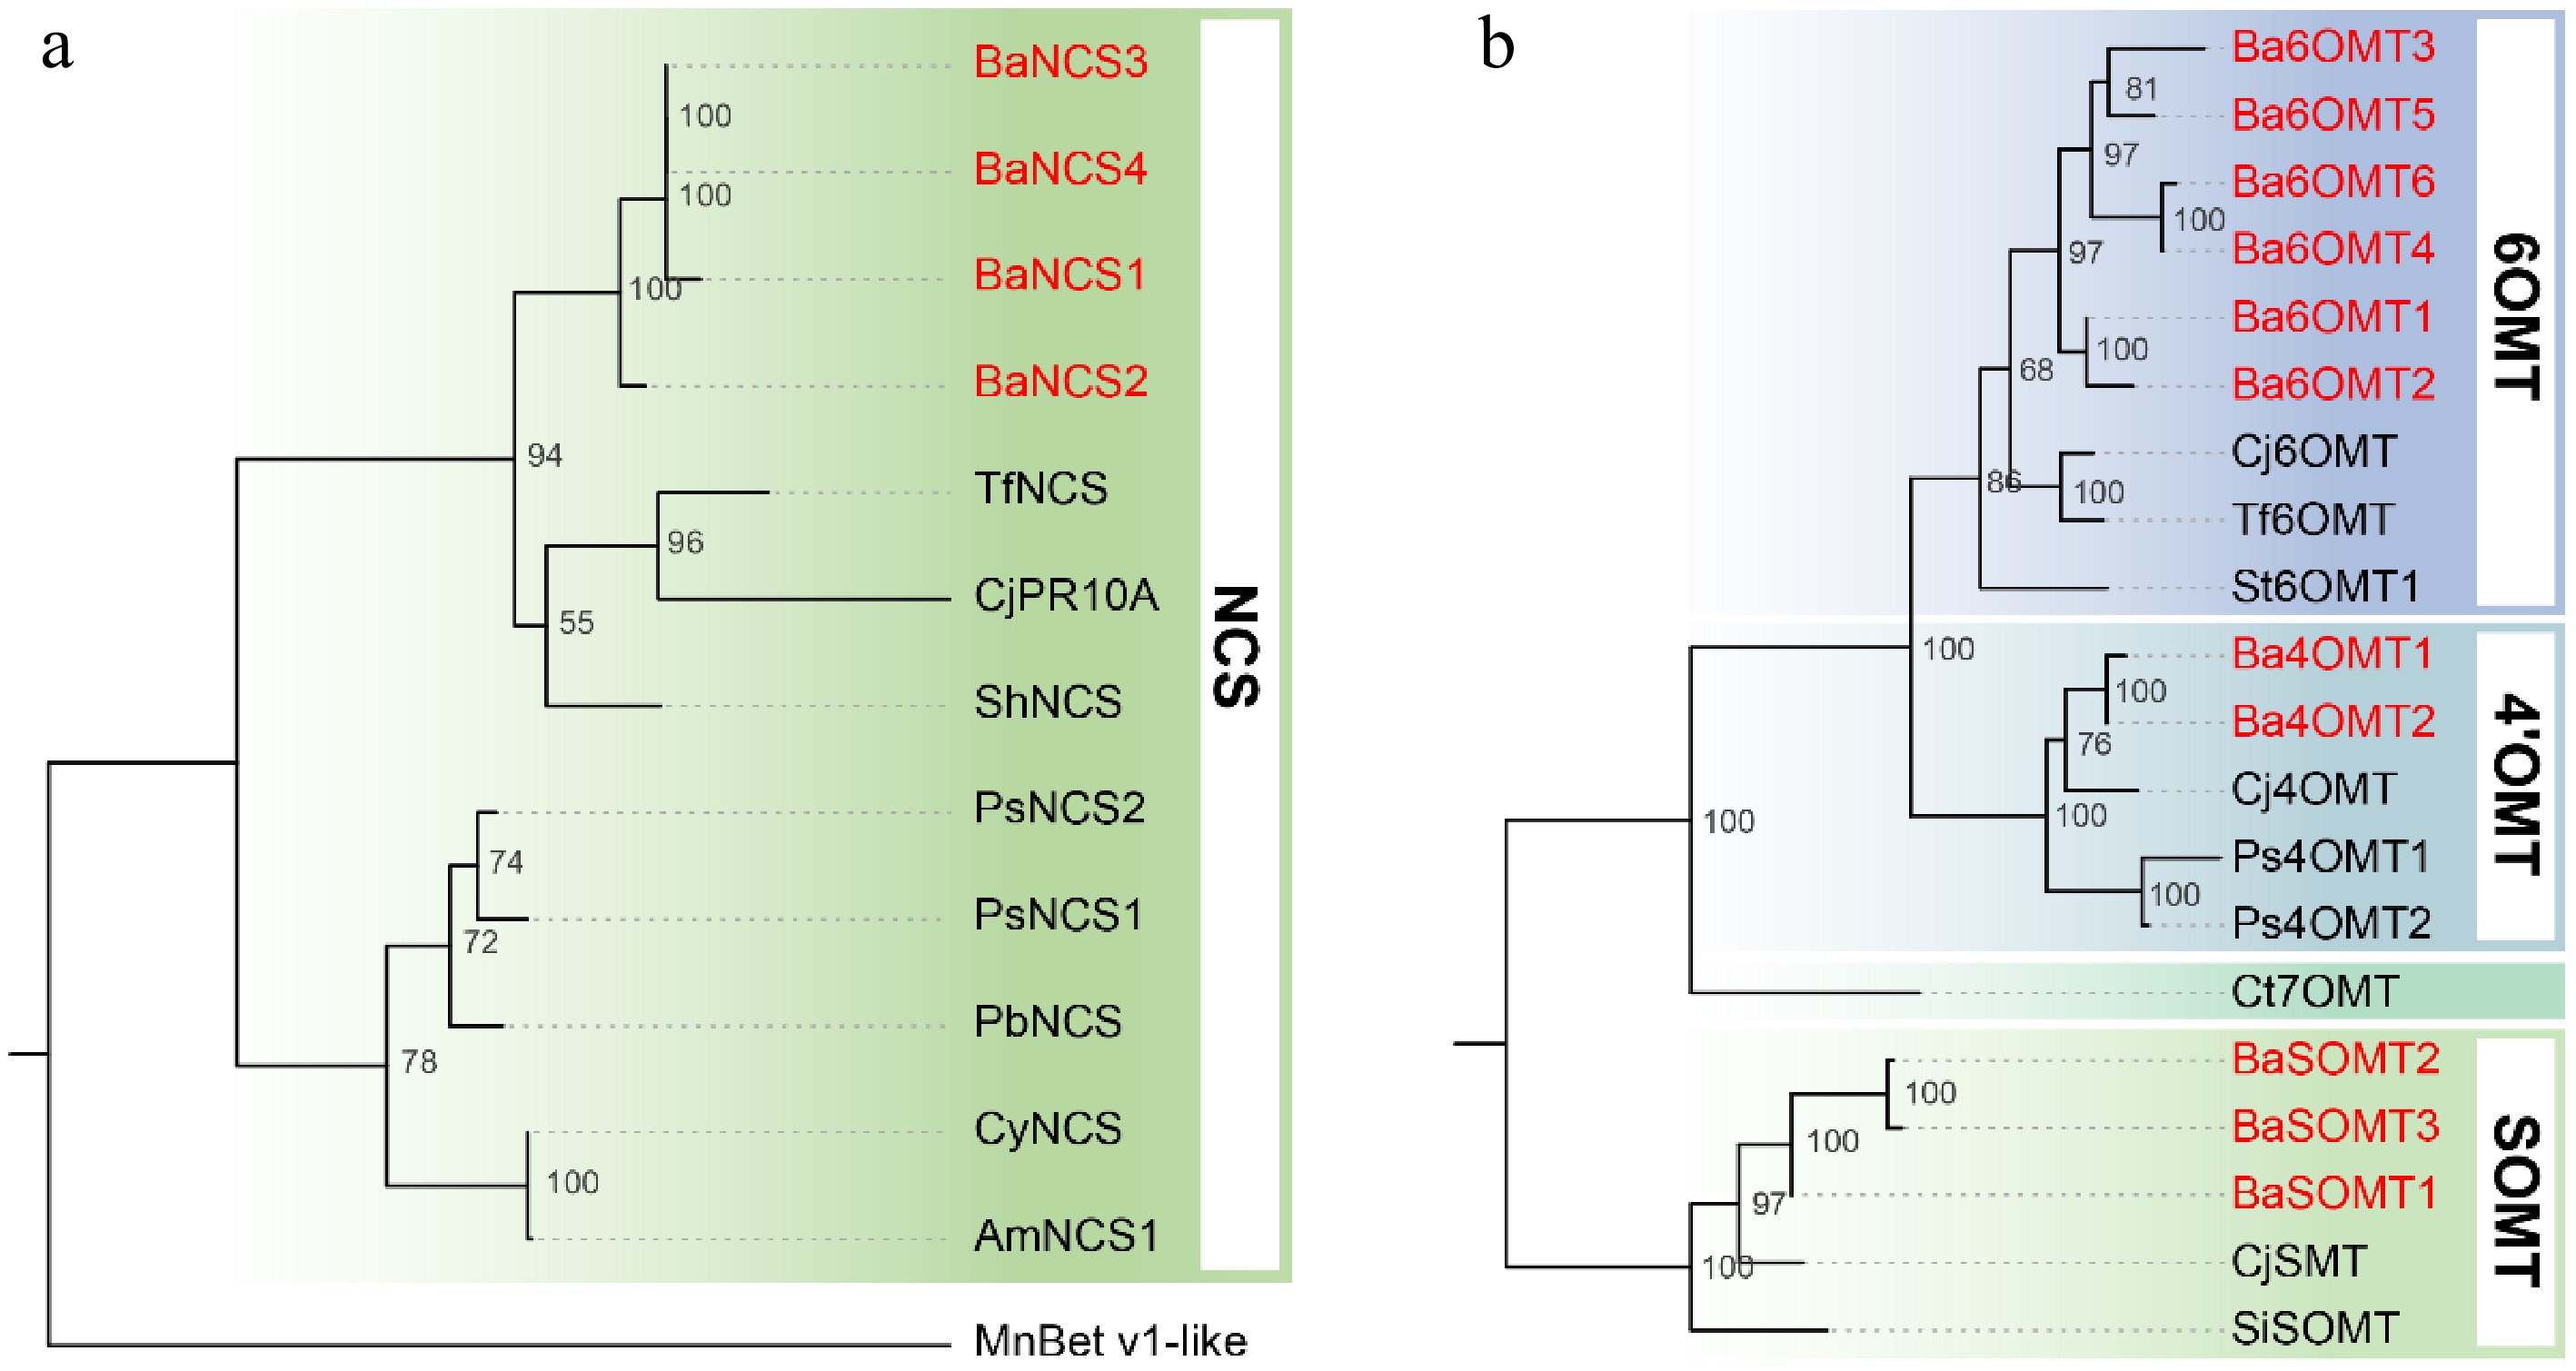
Figure 3.
Phylogenetic analysis of (a) NCS, and (b) OMT protein sequences. The maximum-likelihood tree was constructed using aligned amino acid sequences from B. amurensis (highlighted in red) and homologous enzymes from other plant species. Bootstrap values (1000 replicates) are shown at branch nodes. A higher value indicates that the branch is more reliable. Abbreviations and GenBank accession numbers for the sequences are listed as follows: TfNCS (ACO90248.1), CjPR10A (BAF45338.2), ShNCS (AIT42265.1), PsNCS2 (AAX56304.1), PsNCS1 (AAX56303.1), PbNCS (ACO90258.1), CyNCS (WDS97777.1), AmNCS1 (ACJ76785.1), MnBet_v1-like (EXB29146.1), Cj6OMT (BAB08004.1), Tf6OMT (AAU20765.1), St6OMT1 (6OMT from S. tetrandra)[48], Cj4'OMT (BAB08005.1), Ps4'OMT1 (AAP45313.1), Ps4'OMT2 (AAP45314.1), CjSMT (BAA06192.1), and SiSOMT (MK749415).
-
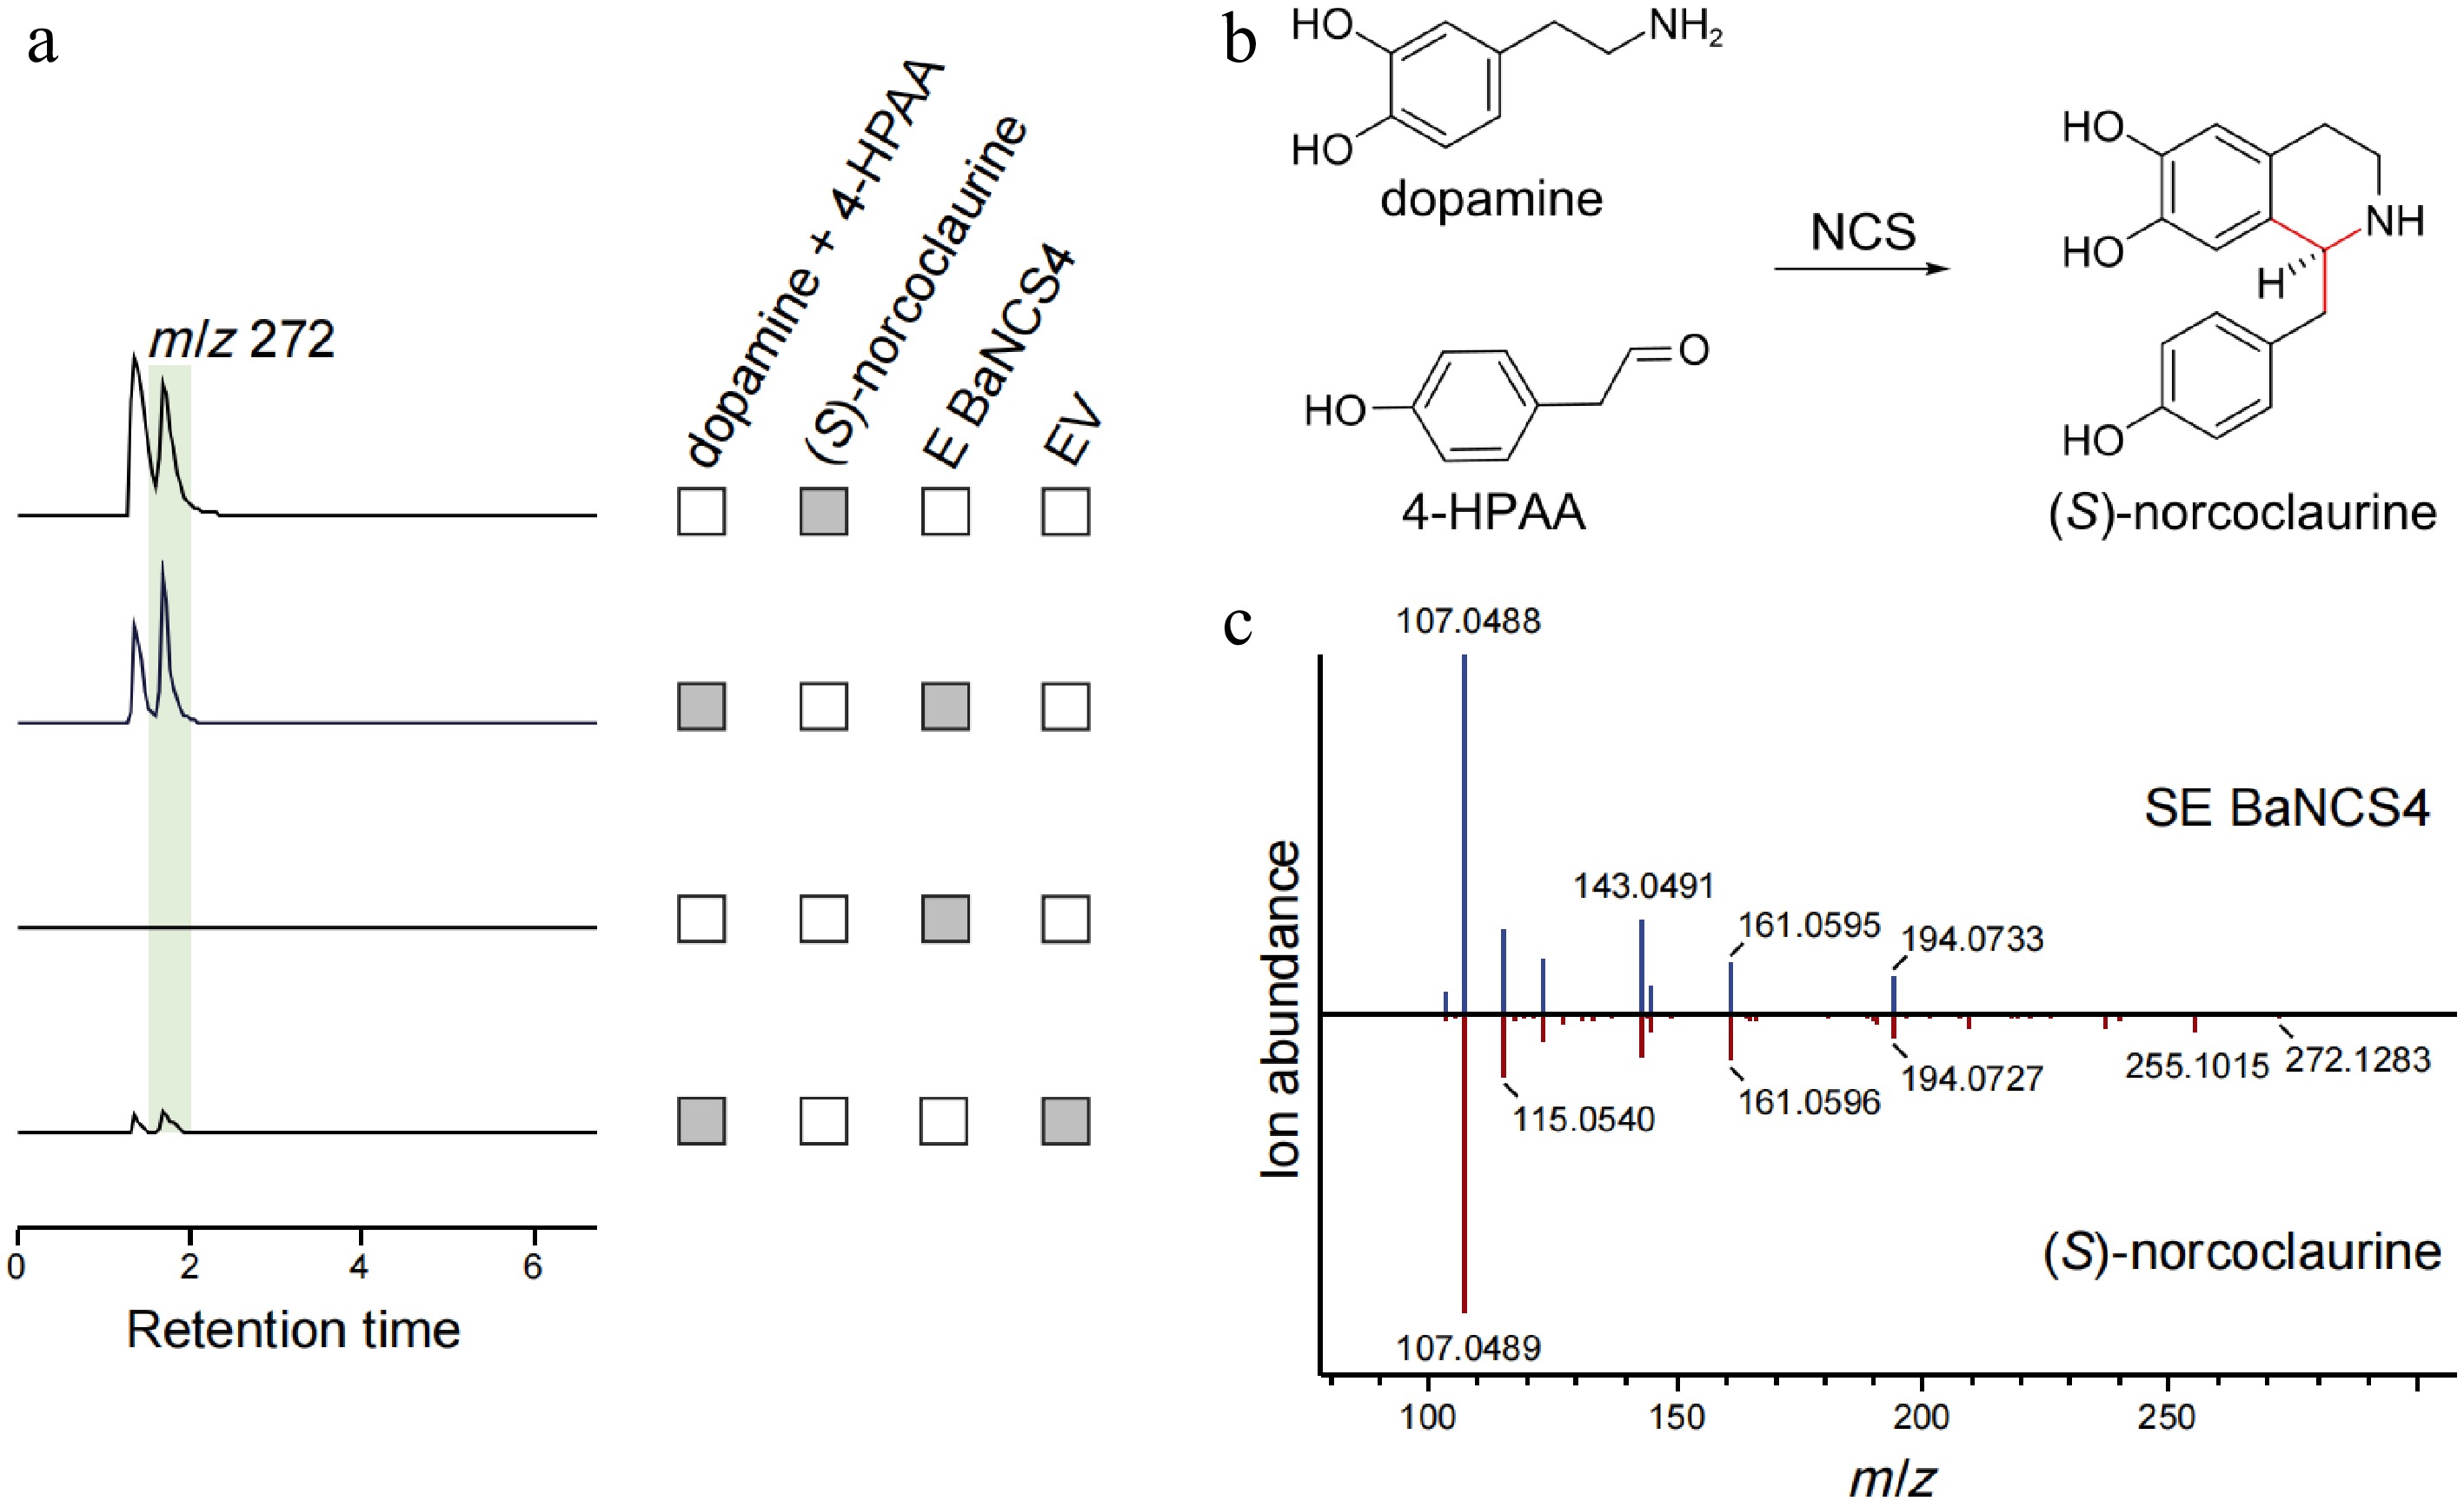
Figure 4.
Functional characterization of BaNCS related to berberine biosynthesis in B. amurensis. (a) The LC-MS extracted ion chromatogram at m/z 272 represents the catalytic product generated by BaNCS. The reaction system without substrate and pET-28a (+) empty vector (EV) was used as the negative control. (b) NCS mediates the Pictet-Spengler condensation of dopamine and 4-HPAA, yielding (S)-norcoclaurine. (c) Comparison of MS/MS fragments between the product from BaNCS (above) and authentic (S)-norcoclaurine (below).
-
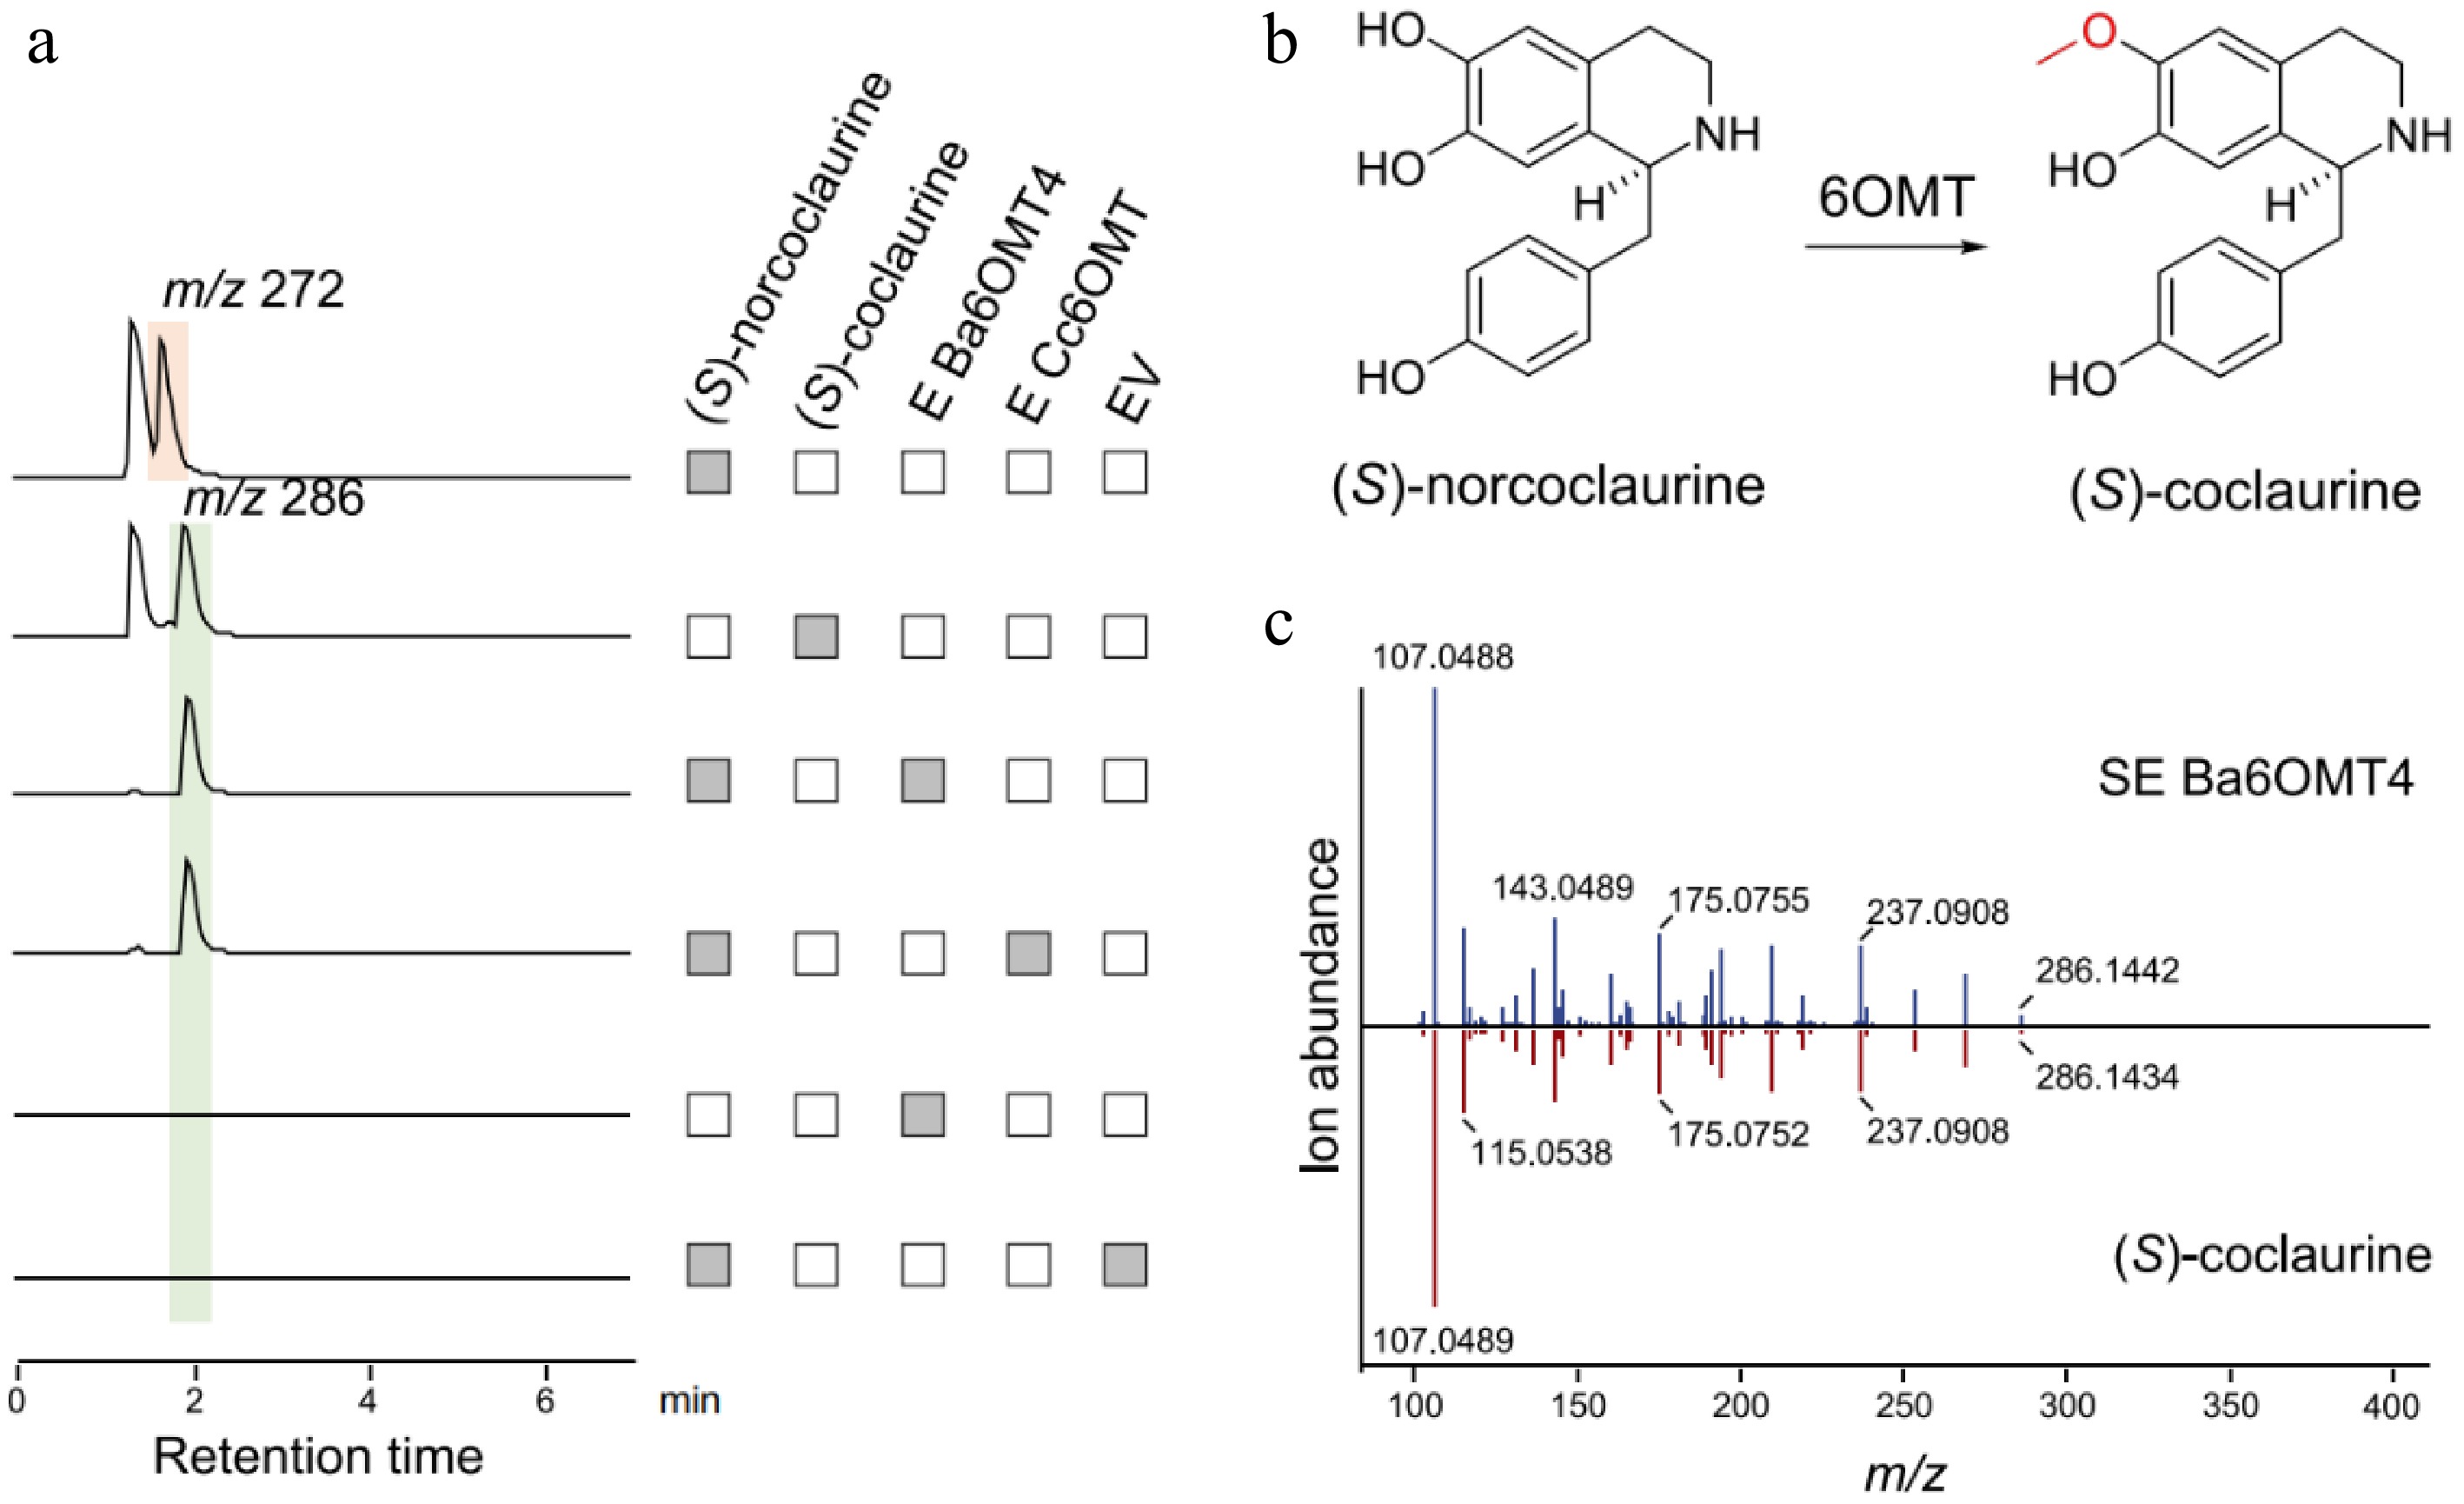
Figure 5.
Functional characterization of Ba6OMT related to berberine synthesis in B. amurensis. (a) The LC-MS extracted ion chromatogram at m/z 272 and 286 represent the substrate (S)-norcoclaurine and the catalytic product generated by Ba6OMT, respectively. The pET-28a (+) empty vector (EV) was used as the negative control. (b) The synthesis of (S)-coclaurine catalyzed by 6OMT. (c) Comparison of MS/MS fragments between the product from Ba6OMT (above) and authentic (S)-coclaurine standard (below).
-
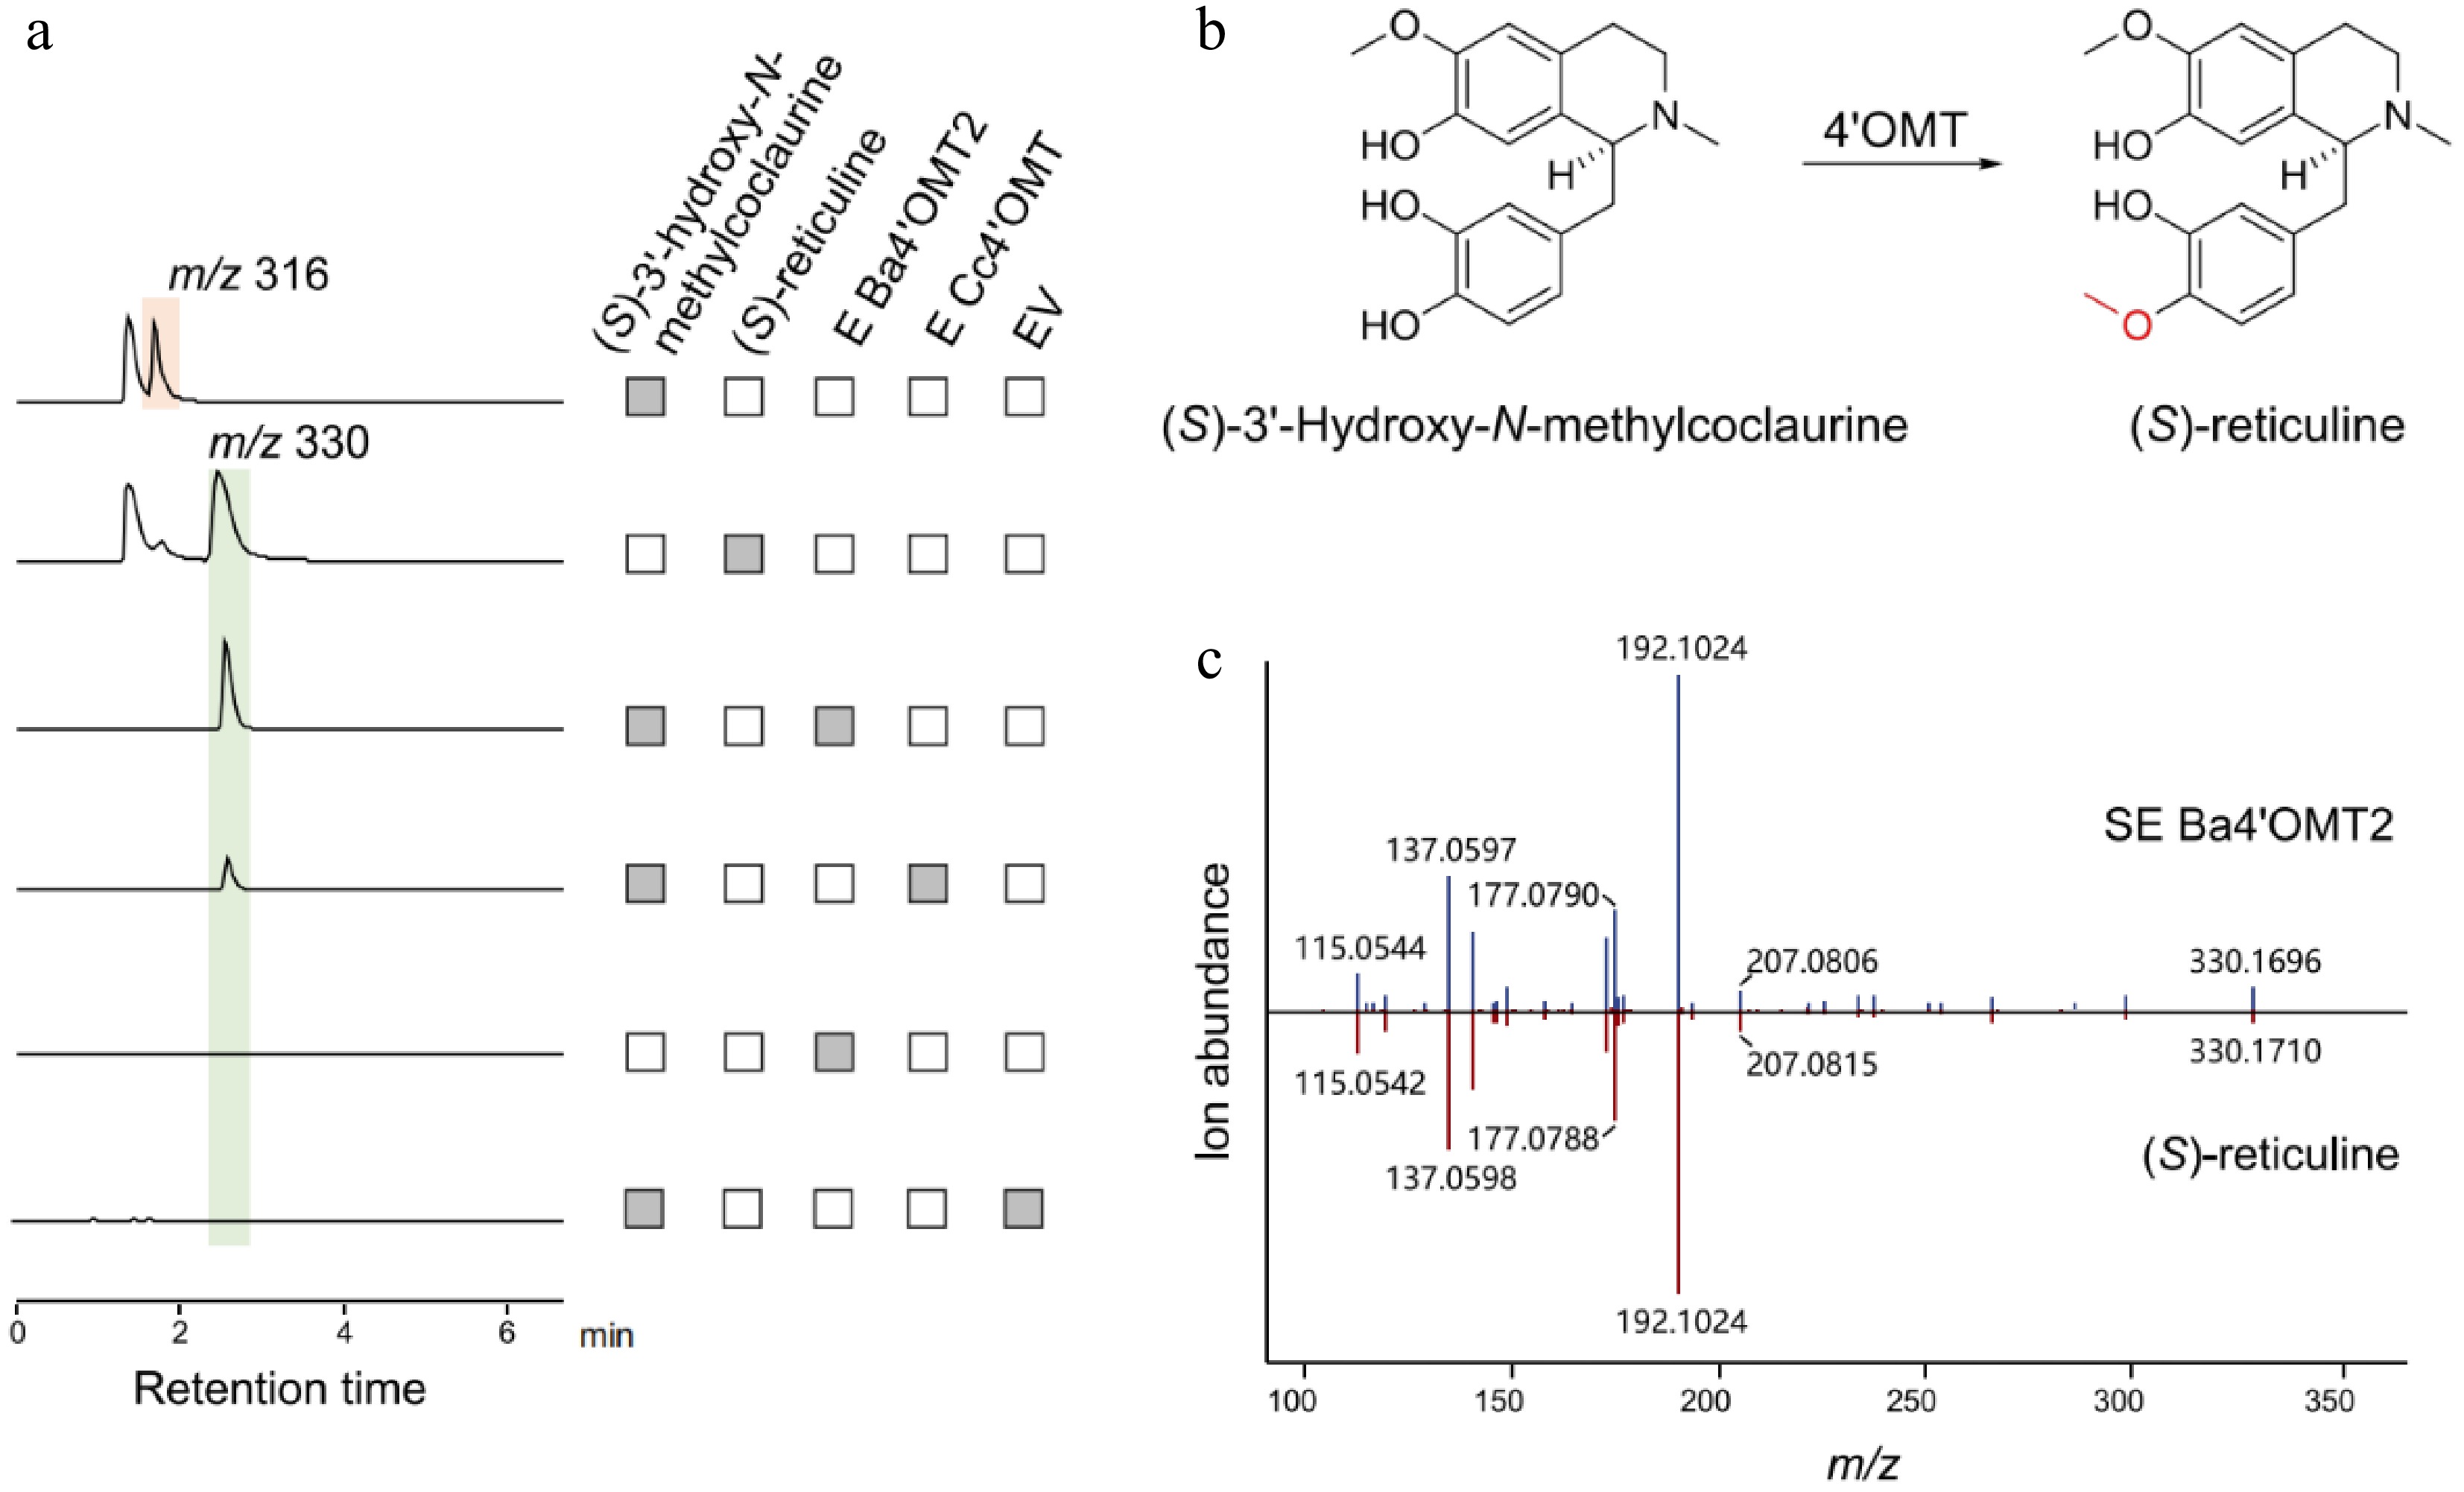
Figure 6.
Functional characterization of Ba4'OMT2 related to berberine biosynthesis in B. amurensis. (a) The LC-MS extracted ion chromatogram at m/z 316 and m/z 330 represent the substrate (S)-3'-hydroxy-N-methylcoclaurine and the catalytic product generated by Ba4'OMT2 enzymes, respectively. (b) The synthesis of (S)-reticuline catalyzed by 4'OMT. (c) Comparison of MS/MS fragments between the product from Ba4'OMT2 (above) and authentic (S)-reticuline (below).
-
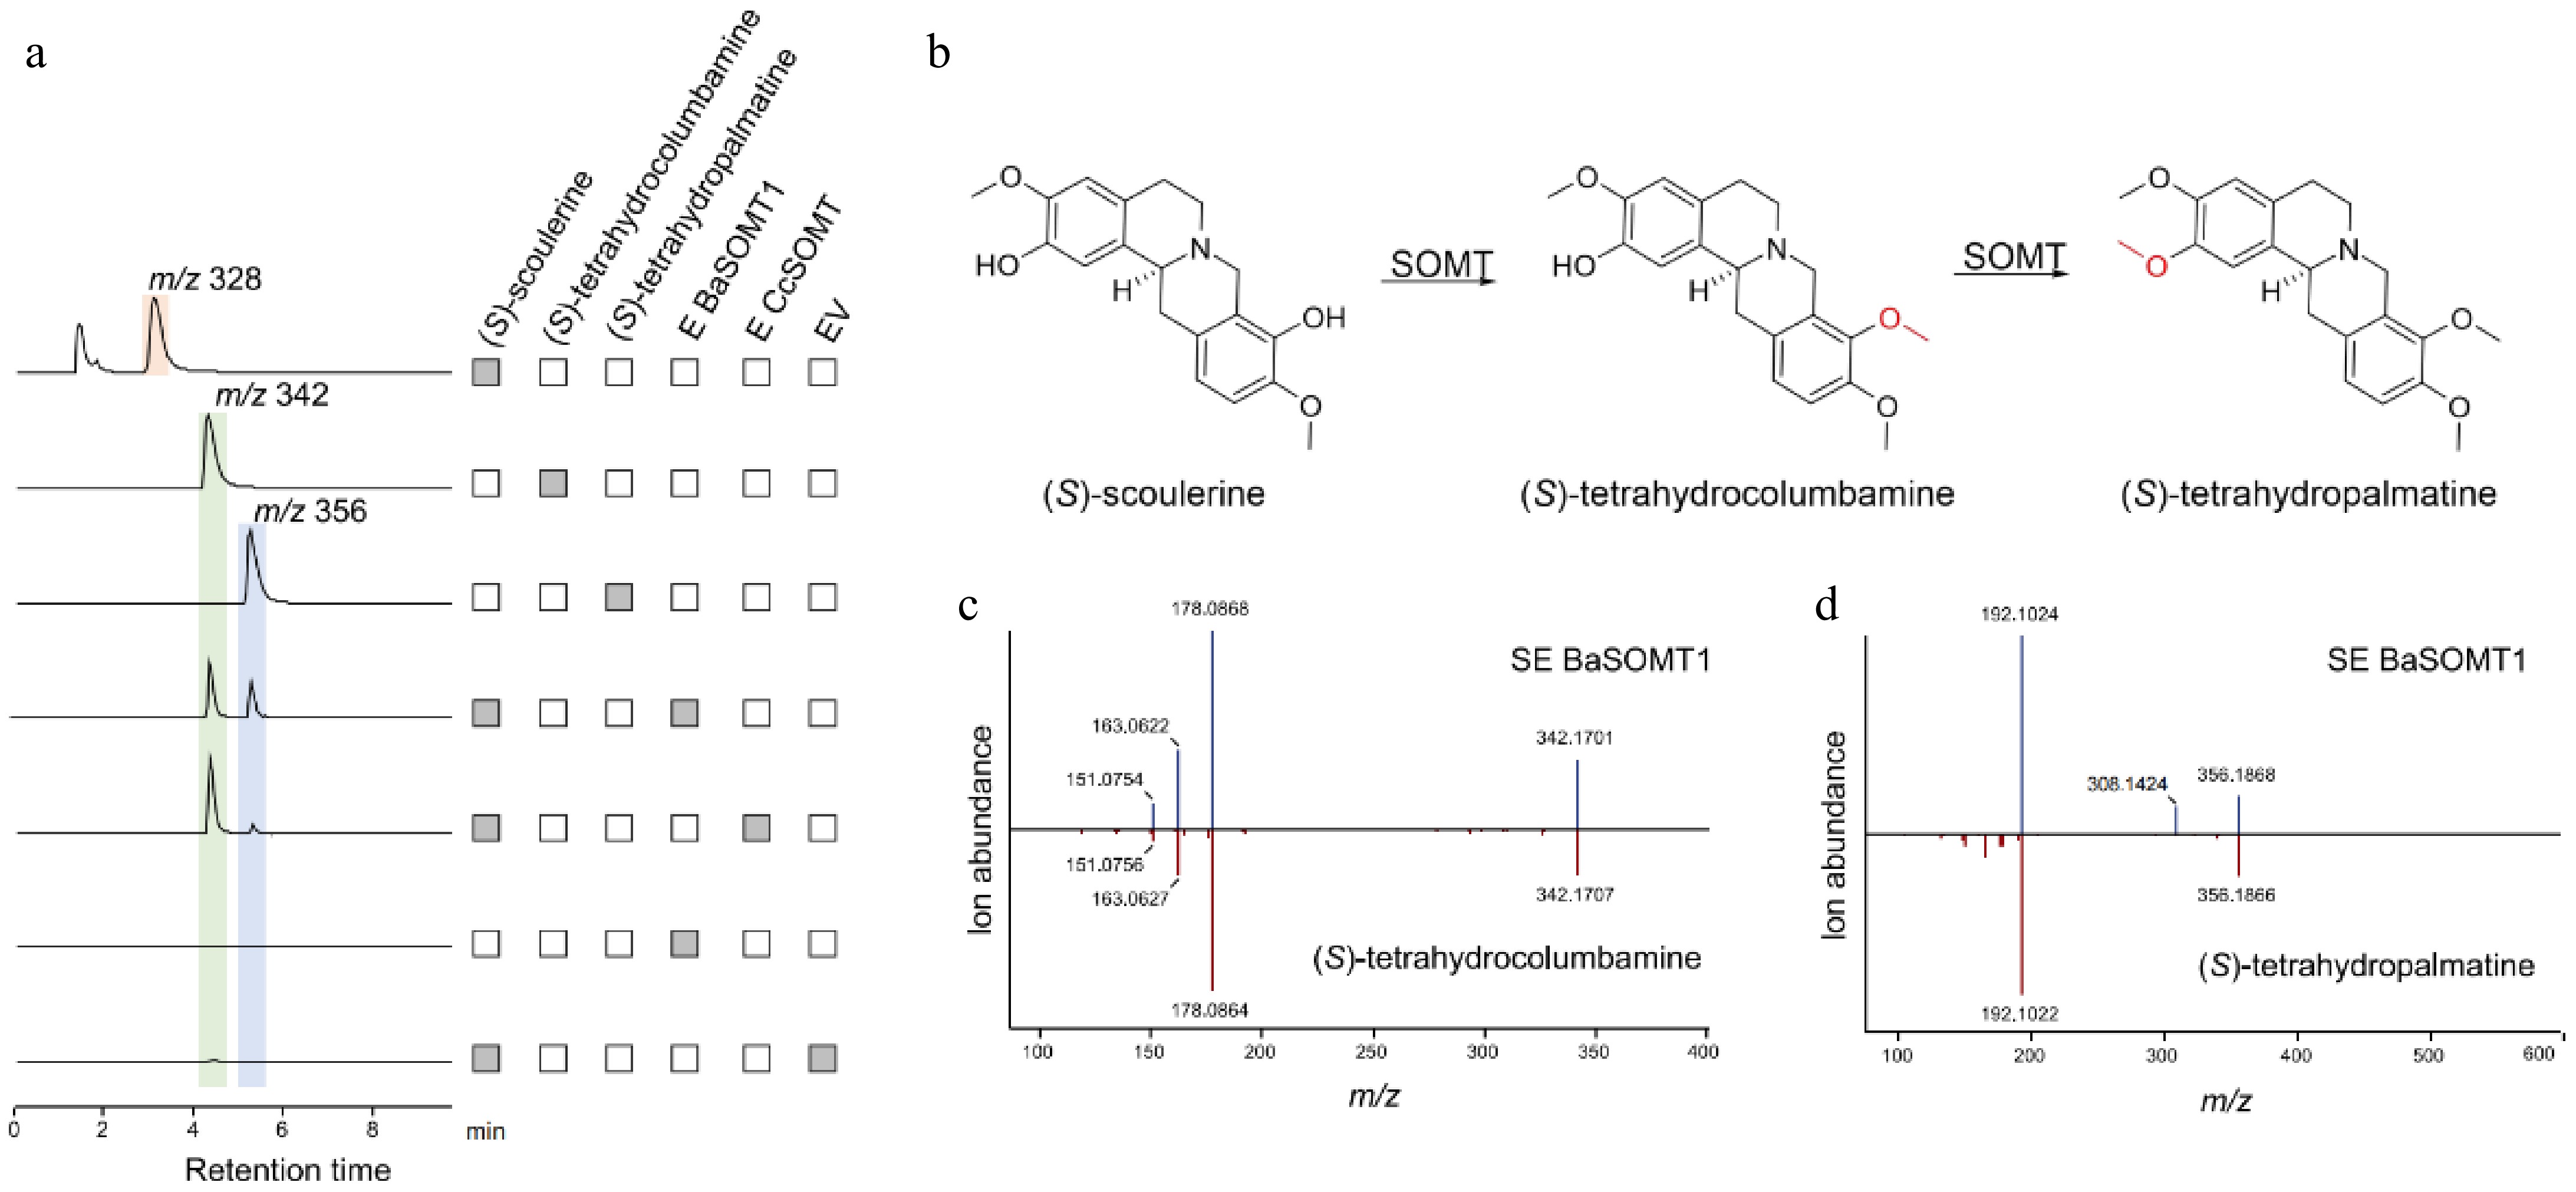
Figure 7.
Functional characterization of BaSOMT related to berberine synthesis in B. amurensis. (a) The LC-MS extracted ion chromatogram at m/z 328, 342, and 356 represent the substrate (S)-scoulerine and two continuous catalytic products generated by BaSOMT, respectively. (b) The synthesis of (S)-tetrahydrocolumbamine and (S)-tetrahydropamatine catalyzed by SOMT. (c), (d) Comparison of MS/MS fragments between the product from BaSOMT (above) and their corresponding standards (below).
-
Item Transcriptome assembly Unigenes (the longest isoform) Coding
genesTotal sequences 325,523 262,191 55,016 Complete BUSCOs 92.40% 92.00% 90.80% Total bases 229,930,964 111,153,438 48,237,144 Min sequence length (bp) 178 201 255 Max sequence length (bp) 18,516 15,698 12,783 Average sequence length (bp) 706.34 423.94 876.78 Median sequence length (bp) 385 294 618 N50 length (bp) 1,186 435 1,170 GC content 41.10% 40.02% 43.83% Table 1.
Overview of de novo assembly statistics.
-
Database Number of genes Percentage KEGG 9,376 17% NR 48,464 88% GO 14,735 34% Pfam 25,133 58% Swiss-Prot 35,005 64% Total 53,926 98% Table 2.
Statistics on the number of gene annotated for function by KEGG, NR, GO, PFAM, and Swissprot databases.
Figures
(7)
Tables
(2)