-
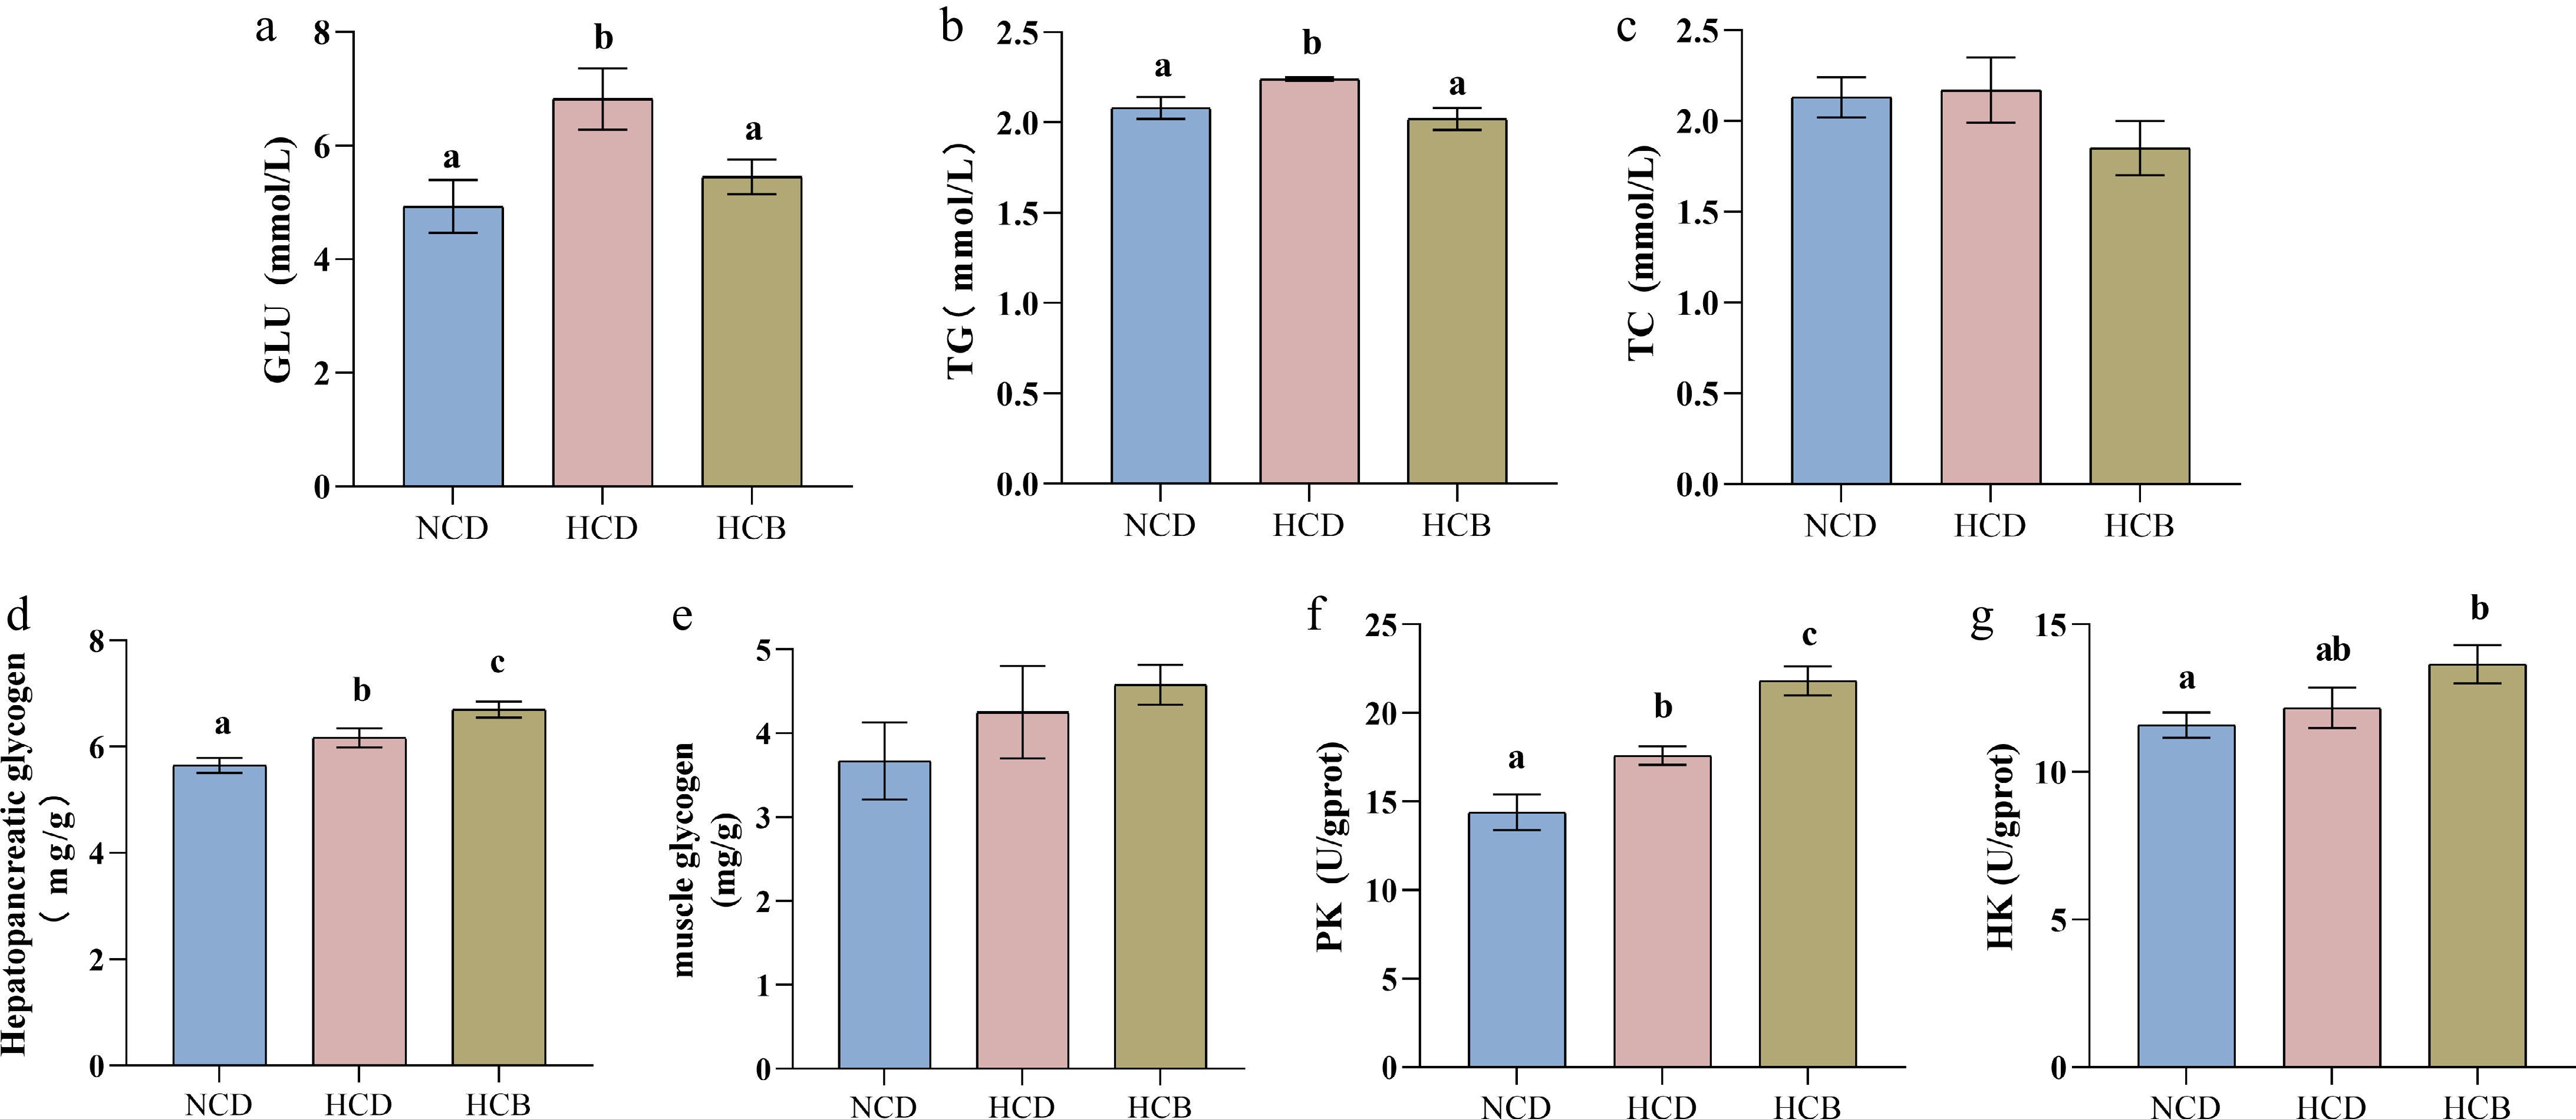
Figure 1.
Effect of BBR on blood biochemistry and glycolysis in Procambarus clarkii. (a), glucose (GLU) in the hemolymph, (b) triglyceride (TG) in the hemolymph, (c) total cholesterol (TC) in the hemolymph, (d) hepatopancreatic glycogen, (e) muscle glycogen, (f) hexokinase (HK) in the hepatopancreas, and (g) pyruvate kinase (PK) in the hepatopancreas. The notable difference of the means of each group in the same indicator is represented by different lowercase letters (p < 0.05) by ANOVA.
-
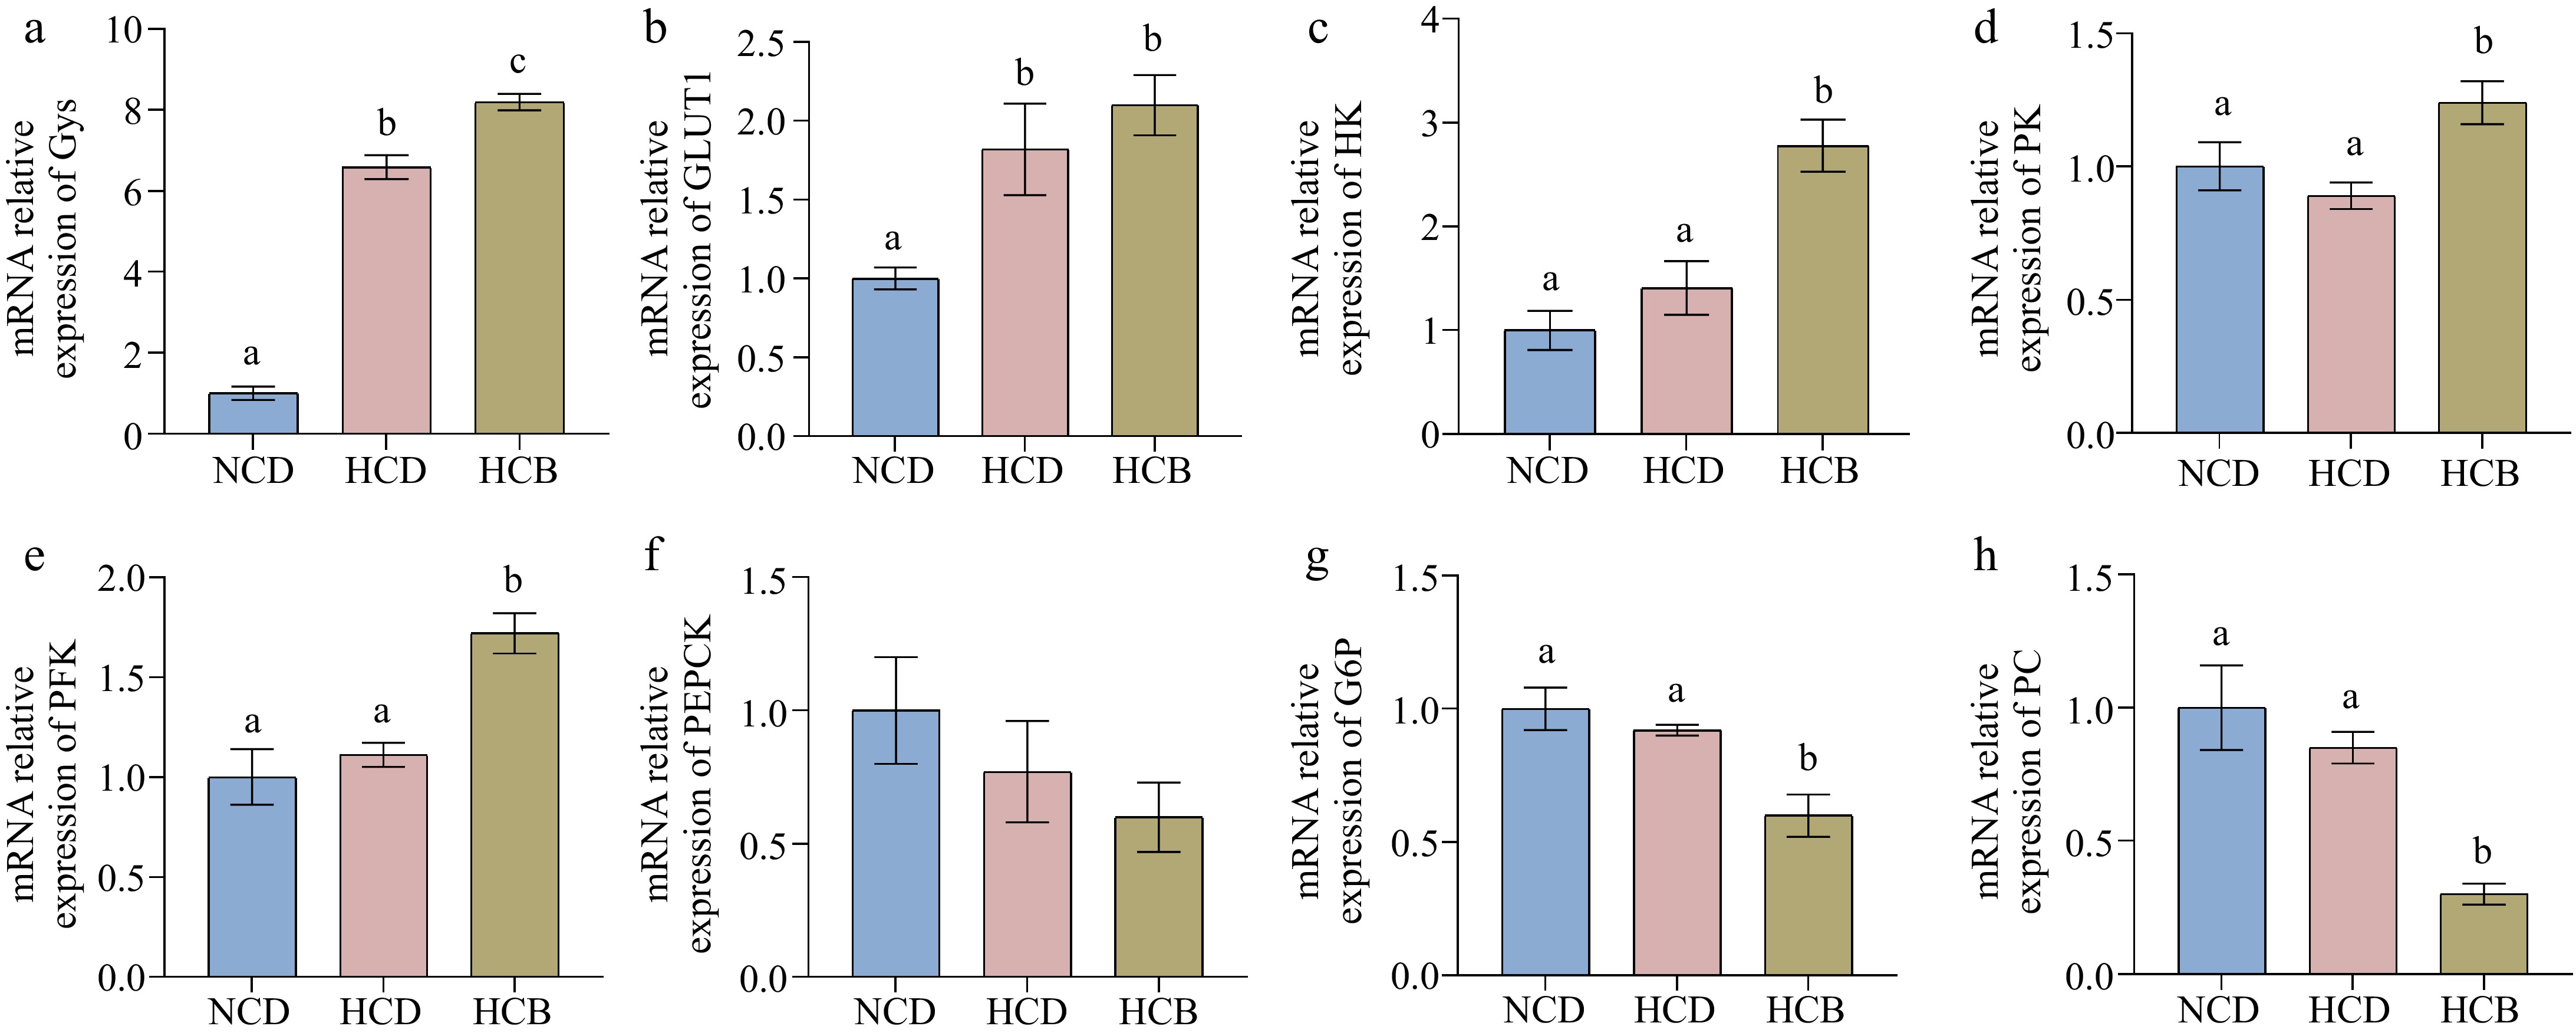
Figure 2.
Effect of BBR on glucose metabolism related genes in the hepatopancreas of Procambarus clarkii. (a) Glycogen synthase (Gys), (b) glucose transporter 1 (Glut1), (c) hexokinase (HK), (d) pyruvate kinase (PK), (e) phosphofructokinase (PFK), (f) phosphoenolpyruvate carboxykinase, (PEPCK), (g) glucose-6-phosphatase (G6P), and (h) pyruvate carboxylase (PC). The notable difference in the means of each group of the same indicator is represented by different lowercase letters (p < 0.05) by ANOVA.
-
NCD HCD HCB Ingredients (% dry weight) Fish meal 14.80 14.80 14.80 Soybean meal 19.80 19.80 19.80 Peanut meal 11.88 11.88 11.88 Cottonseed meal 11.88 11.88 11.88 Corn starch 17.06 25.18 25.18 α-starch 4.96 4.96 4.96 Fish oil 3.25 3.25 3.25 Beef tallow 3.25 3.25 3.25 Calcium dihydrogen phosphate 2.20 2.20 2.20 Sodium chloride 0.40 0.40 0.40 Premixa 1.00 1.00 1.00 Chitin 0.15 0.15 0.15 Cholesterol 0.10 0.10 0.10 Lecithin 0.15 0.15 0.15 Microcrystalline cellulose 8.12 0 0 BBR 0 0 0.005 Sodium carboxymethyl cellulose 0.50 0.50 0.50 Ethoxyquin 0.50 0.50 0.50 Proximate analysis (%) Water content 10.71 10.25 10.43 Crude protein 31.11 30.42 30.47 Crude lipid 6.78 7.15 6.86 Crude ash 7.65 7.51 7.79 Carbohydrate 32.43 40.88 40.91 Energy 19.46 19.87 19.85 a The micronutrients contained in the premix are as follows: vitamins (mg or IU/kg) include: CoCl2·6H2O, 0.1 g; MnSO4·4H2O, 7g; KI, 0.026 g; FeSO4·7H2O, 25 g; Na2SeO3, 0.04 g; ZnSO4·7H2O, 22 g; CuSO4·5H2O, 2 g; minerals (g/kg) include :Vitamin A, 1,500,000 IU; Vitamin E, 5,000 mg; Vitamin K3, 220 mg; Vitamin B2, 1090 mg; Vitamin B12, 15 mg; Vitamin B1, 320 mg; Vitamin B5, 2,000 mg; Vitamin B6, 500 mg; Vitamin C, 14,000 mg; Pantothenate, 1,000 mg; Folic acid, 230 mg; Choline, 60,000 mg; Biotin, 130 mg; Myoinositol 45,000 mg; Niacin, 3,000 mg; Vitamin D, 200,000 IU. Calculated by difference (100 - moisture - crude protein - crude lipid - ash - crude fiber). Table 1.
Formulation and proximate composition of the experimental diets.
-
Target gene Primer sequence (5'-3') Amplicon size (bp) GLUT1 F: TTTTCGAGTTCGTCGGAGGG 100 R: ATCTGGCCGCAGTACACAAA Gys F: AGCTTCGCTGAAGGGAACAA 197 R: CACAGCTTGGCTTGGAACAC HK F: GTGGGGTGCGTTTGGAGATA 147 R: ACCTCCCGATACAGGTCTCC PK F: AGCGGACTGTGTCATGTTGT 76 R: ATTAGCCATTGTTCGCACGC PFK F: GGAATGTACGTAGGGGCTCG 151 R: CCTTGCACCTAGCTGAACCA PEPCK F: TGTCCCATCATTGACCCTGC 120 R: GTGCTTCCAGTCGTAGGCTT G6P F: CGGAGCGGACTGTTCTTCAT 143 R: TTGGACCACTCGCAGAAGAC PC F: ACTCCCCAGGGATGTGCTAT 130 R: AAGCACCGTCAAGGCGAATA Glucose transporter 1, GLUT 1; Glycogen synthase, Gys; Hexokinase, HK; Pyruvate kinase, PK; Phosphofructokinase, PFK; Phosphoenolpyruvate carboxykinase, PEPCK; Glucose-6-phosphatase, G6P; Pyruvate carboxylase, PC. Table 2.
Primer sequences for real-time fluorescence quantification of PCR.
-
Parameter NCD HCD HCB IM (g) 14.19 ± 0.13 14.29 ± 0.14 14.22 ± 0.22 FM (g) 29.92 ± 0.54 29.11 ± 0.48 29.14 ± 0.76 FCR 2.67 ± 0.08 2.87 ± 0.16 2.87 ± 0.14 SR (%) 100 ± 0.00 94.64 ± 3.42 98.21 ± 1.79 MGR (%) 112.01 ± 2.03 104.30 ± 5.24 105.86 ± 6.21 SGR (% day−1) 1.33 ± 0.19 1.27 ± 0.02 1.28 ± 0.07 HI (%) 4.81 ± 0.23 4.47 ± 0.22 4.72 ± 0.10 MY (%) 10.02 ± 0.18 10.42 ± 0.28 9.92 ± 0.20 IM, initial body mass; FM, final body mass; FCR, feed conversion ratio; SR, Survival rate; MGR, mass gain rate; SGR, specific growth rate; HI, hepatopancreas index; MY, meat yield. There were no significant differences by ANOVA. Table 3.
Growth performance of Procambarus clarkii.
-
Whole-body composition NCD HCD HCB Water content 67.06 ± 1.11 67.26 ± 1.82 65.61 ± 1.42 Crude protein 12.84 ± 0.02 12.05 ± 0.03 12.14 ± 0.22 Crude lipid 2.40 ± 0.16 2.27 ± 0.11 2.17 ± 0.06 Crude ash 11.89 ± 0.07 12.20 ± 0.56 12.43 ± 0.25 Energy 14.70 ± 0.02 15.15 ± 0.19 14.70 ± 0.14 There were no significant differences among the groups by ANOVA. Table 4.
Body composition of Procambarus clarkii (wet mass basis, %).
-
Parameter NCD HCD HCB Hemolymph ACP (KA unit/100 ml) 2.08 ± 0.07 1.93 ± 0.09 2.01 ± 0.06 AKP (KA unit/100 ml) 1.28 ± 0.05 1.20 ± 0.05 1.28 ± 0.09 ALT (U/L) 17.81 ± 0.62 19.46 ± 0.45 19.12 ± 0.68 AST (U/L) 1.26 ± 0.17 1.49 ± 0.14 1.28 ± 0.20 Hepatopancreas SOD (U/mg protein) 53.08 ± 1.09a 46.28 ± 1.47b 55.90 ± 2.45a GSH-px (U/mg protein) 2.27 ± 0.24a 5.03 ± 0.26b 2.67 ± 0.56a MDA (nmol/mg protein) 2.27 ± 0.24a 5.03 ± 0.26b 2.67 ± 0.56a ACP, phosphatase; AKP, alkaline phosphatase; ALT, alanine aminotransferase; AST, aspartate aminotransferase; SOD, superoxide dismutase; GSH-px, glutathione peroxidase; MDA, malondialdehyde. Means in the same rows with different superscripts were significantly different (p < 0.05) by ANOVA. Table 5.
The immunity and antioxidant capacity of Procambarus clarkii.
Figures
(2)
Tables
(5)