-
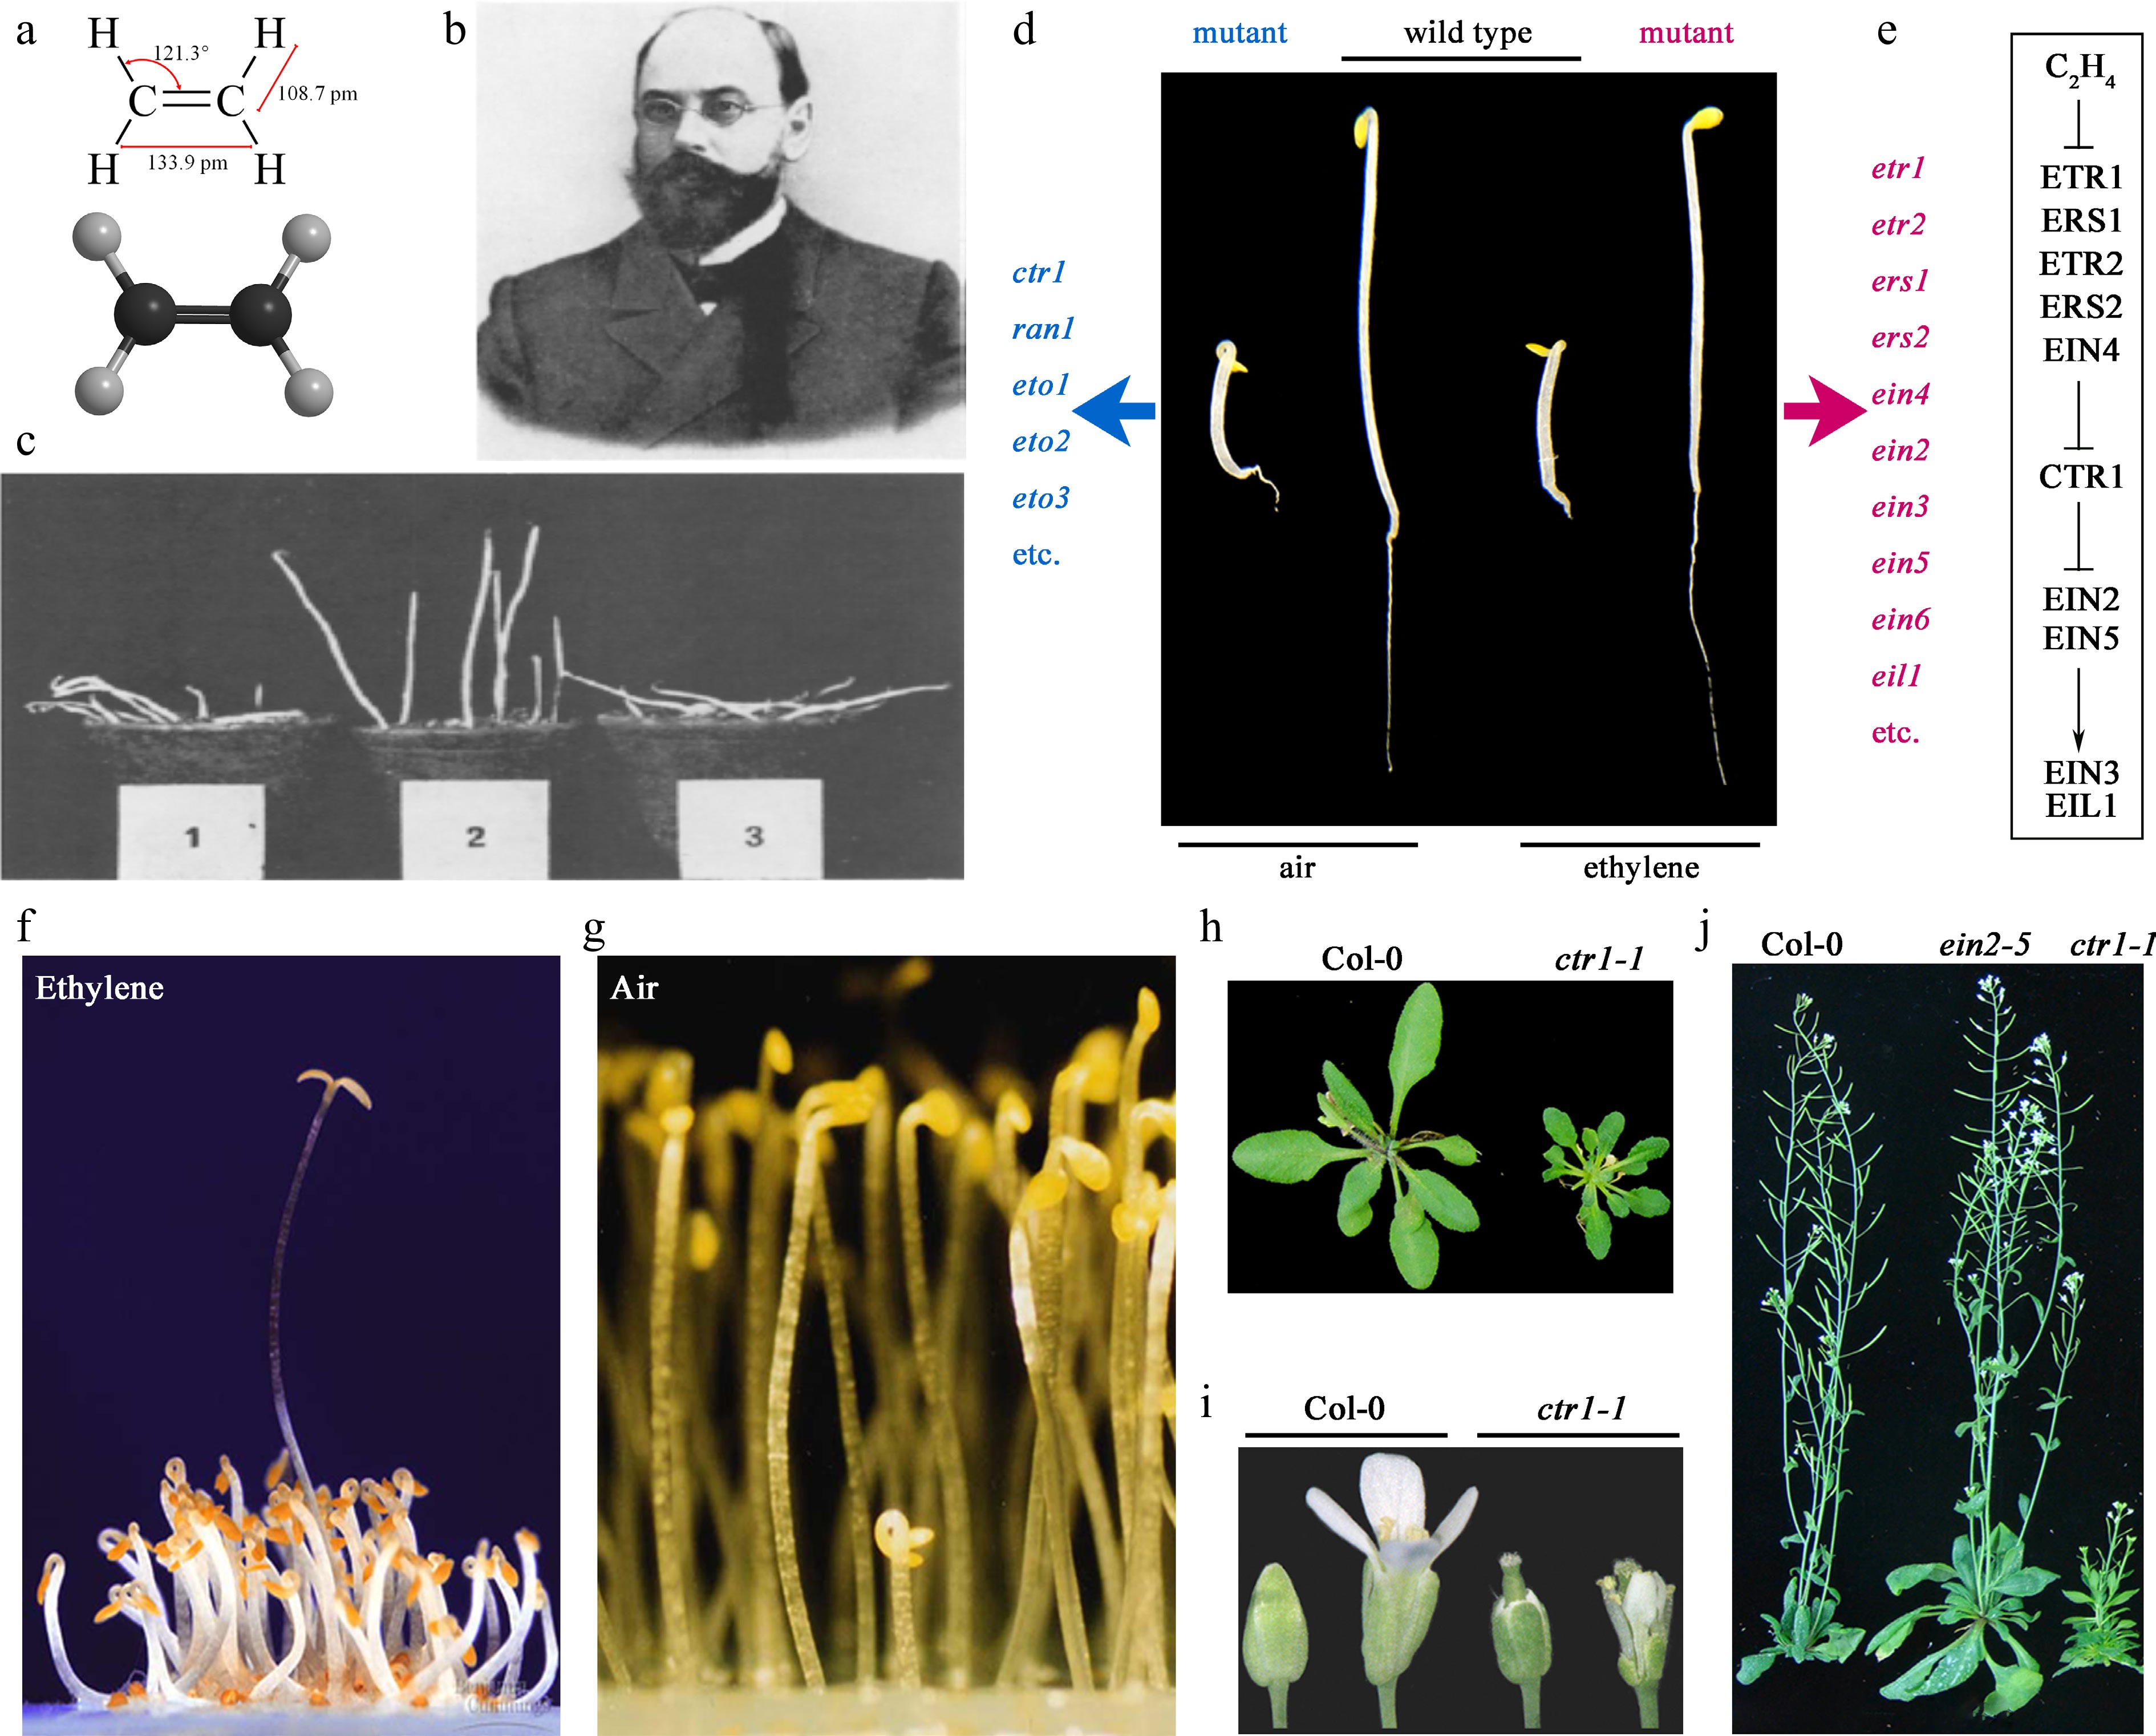
Figure 1.
Arabidopsis 'triple response' phenotype and mutant screening. (a) Chemical structure of ethylene. The upper panel shows a planar diagram with red text indicating bond angles and lengths; the lower panel illustrates a three-dimensional structure with black and gray spheres representing carbon and hydrogen atoms, respectively. (b) Russian botanist Dimitry Nikolayevich Neljubov (1876−1926)[7] (Copyright 1973, Elsevier Science & Technology Journals). (c) Pea seedlings exhibiting abnormal growth due to the influence of illuminating gas[8] (Copyright 1973, Elsevier Science & Technology Journals). Samples 1, 2, and 3 correspond to pea seedlings germinating and growing in greenhouse gas, greenhouse gas filtered through heated CuO, and greenhouse gas filtered through unheated CuO, respectively. (d) Triple response and mutant screening. Etiolated seedlings of wild-type Arabidopsis thaliana (Col-0) grown in the dark for 3 d on Murashige and Skoog (MS) medium in air and in air containing 10 μL·L−1 ethylene[17,23] (Copyright 2010, Oxford University Press). (e) A linear model of the ethylene signaling pathway. (f) Etiolated Arabidopsis seedlings grown for 3 d in the presence of 5 μL·L−1 ethylene. The tallest seedling is the etr1-1 mutant[16] (Copyright 1988, The American Association for the Advancement of Science), which shows no 'triple response'. (g) Etiolated Arabidopsis seedlings grown in air for 3 d. The shortest seedling in the middle, exhibiting the 'triple response' is the ctr1-1 mutant[19] (Copyright 2018, Oxford University Press). (h)–(j) ein2 represents the ethylene-insensitive mutant, while ctr1 represents the constitutive ethylene response mutant[23] (Copyright 2010, Oxford University Press). The mutant phenotypes are distinctly different from the wild type in various aspects such as etiolated seedlings, rosette leaves, floral organs, and mature plants. For example, the ctr1 mutant exhibits a severe constitutive ethylene response phenotype throughout its growth stages. This includes the triple response in air-grown etiolated seedling, delayed hook and cotyledons opening under light, darker green cotyledons, smaller rosette leaves, delayed bolting, smaller inflorescences, early sterility in flowers, and underdeveloped root systems.
-
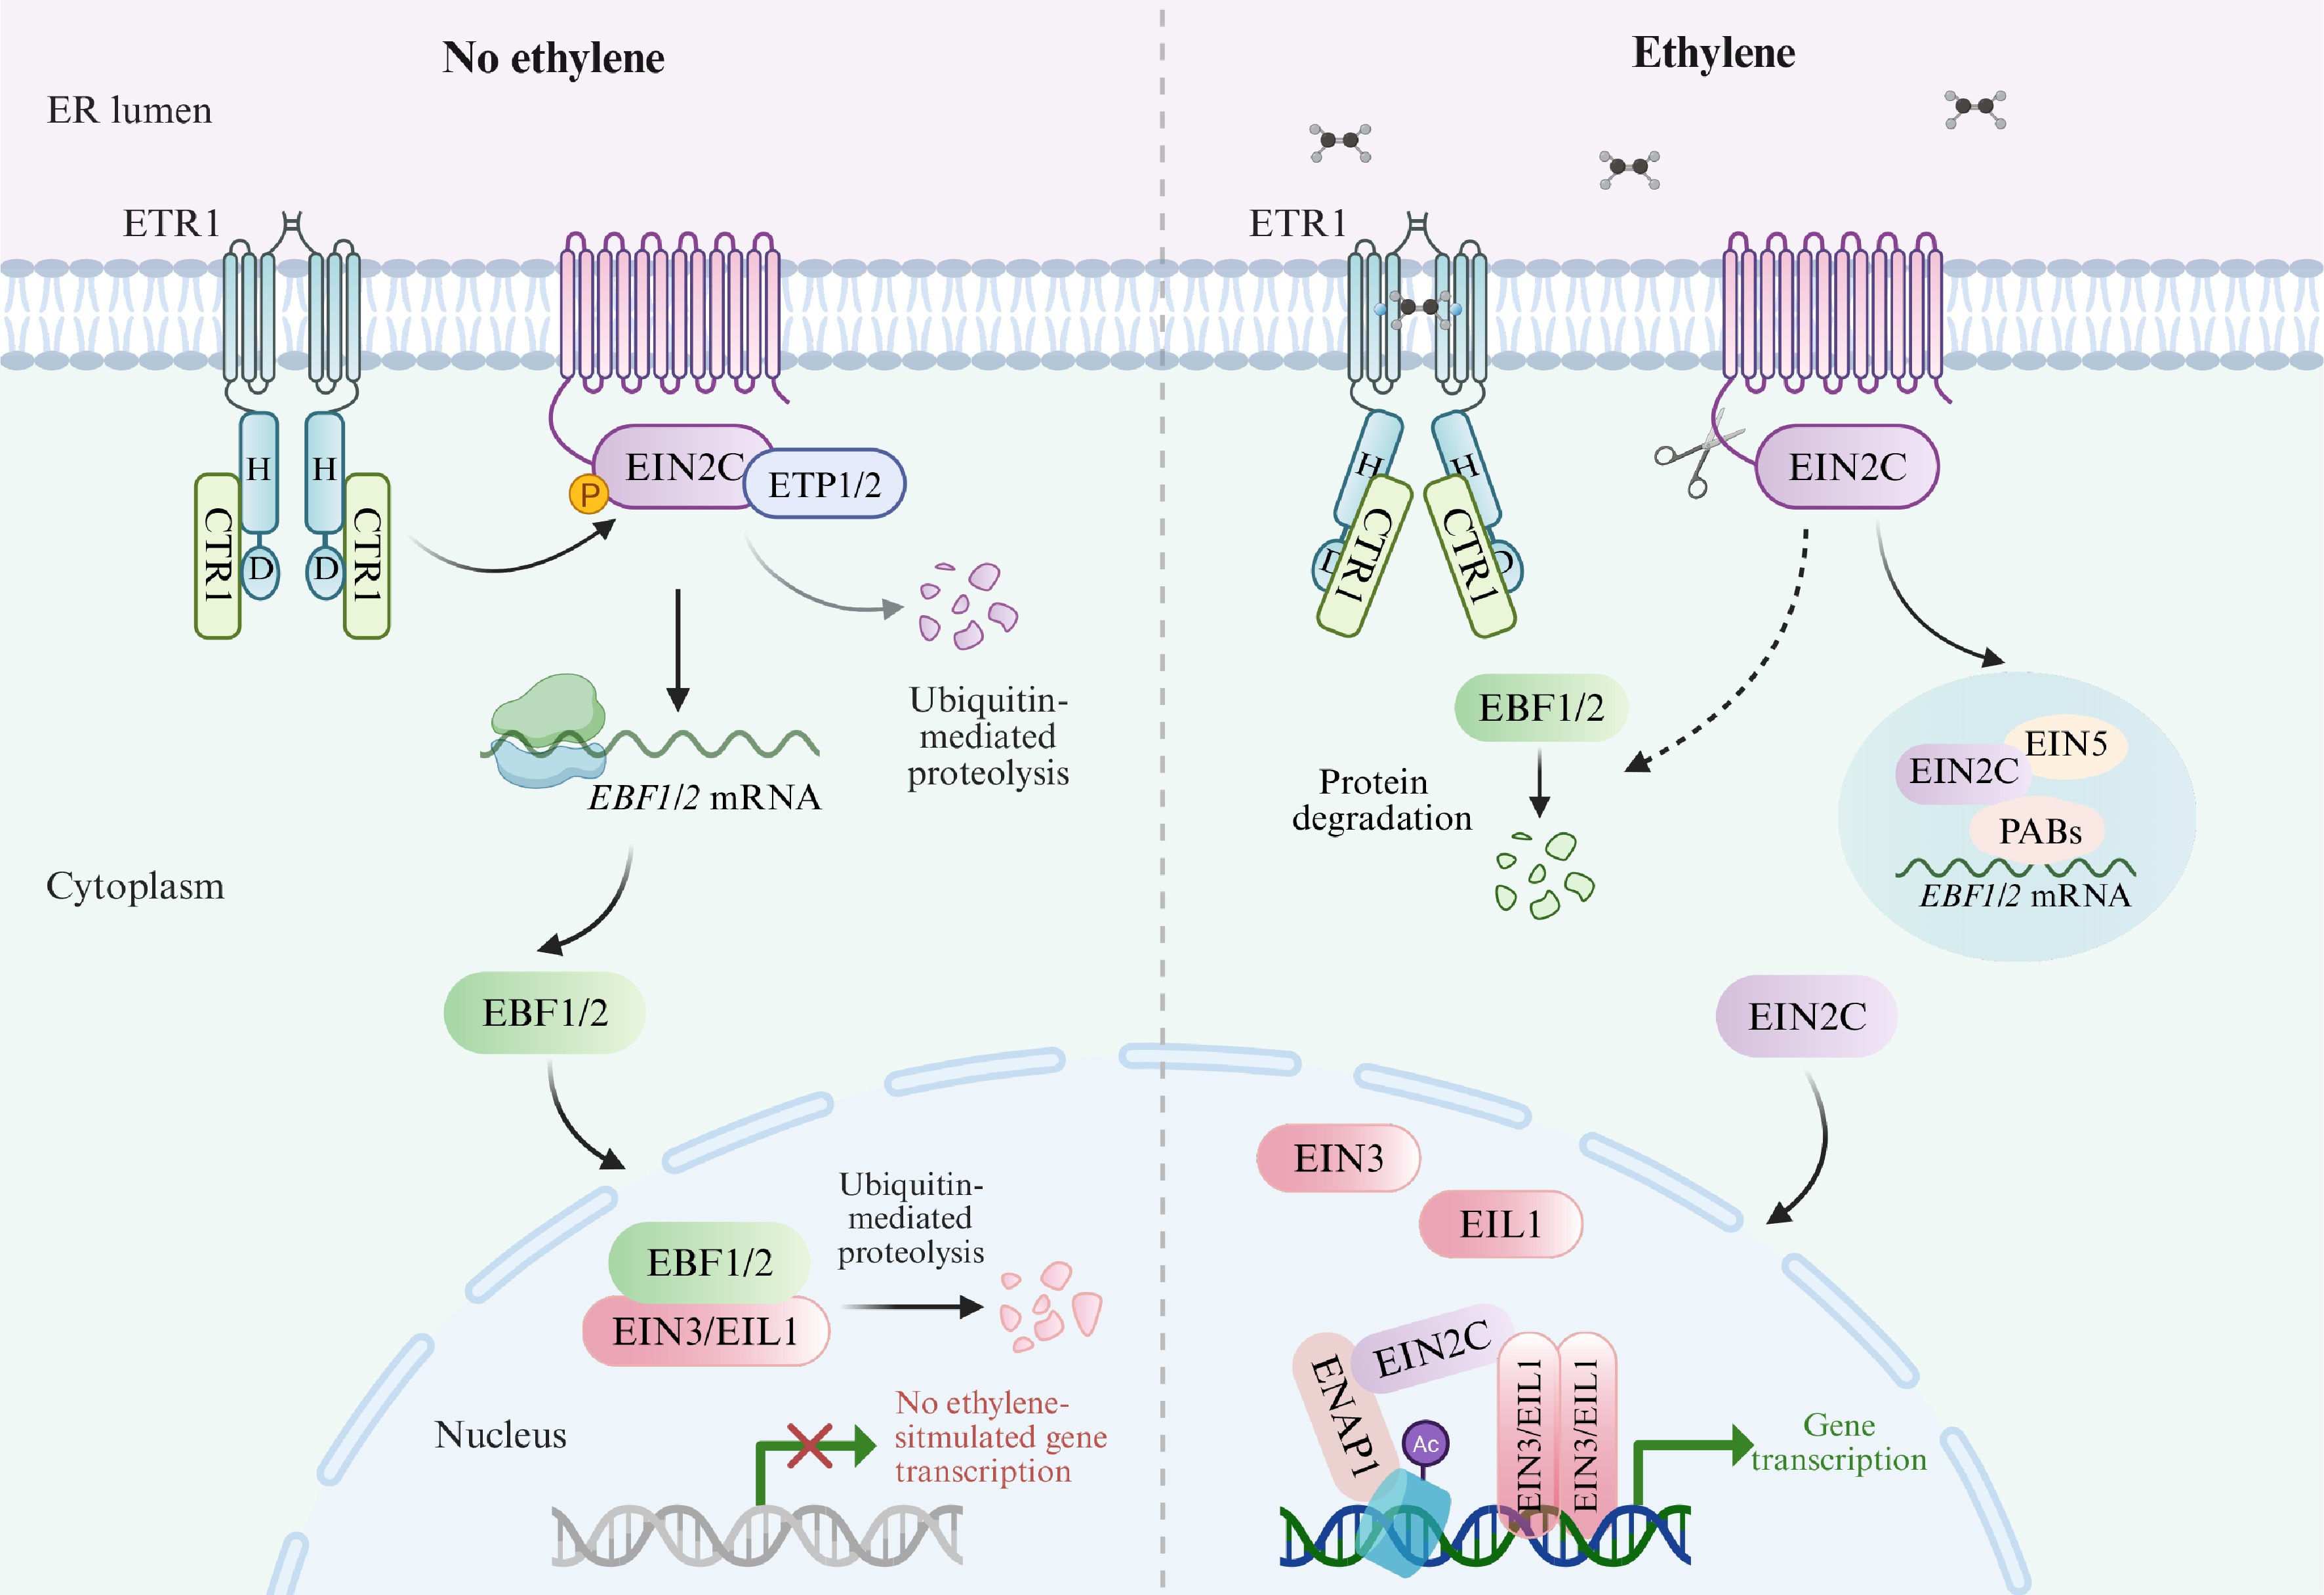
Figure 2.
Schematic diagram of the ethylene signaling pathway in Arabidopsis. In the absence of ethylene, EIN2 is phosphorylated by CTR1, resulting in degradation of EIN3/EIL1 via the EBF1/EBF2-mediated 26S proteasome pathway. Upon ethylene binding, the activities of the receptors and CTR1 are inhibited. Dephosphorylated EIN2 is then cleaved, and the resulting C-terminal fragment is released from the ER membrane to function in the cytoplasm and nucleus. In the cytoplasm, EIN2 targets EBF1/EBF2 mRNAs to P-bodies, suppressing their translation and thereby promoting EIN3/EIL1 accumulation. In the nucleus, EIN2 interacts with ENAP1 to mediate ethylene-induced changes in histone acetylation, regulating expression of EIN3/EIL1 target genes. Additionally, ethylene increases EIN2 abundance by inhibiting ETP1/ETP2-mediated EIN2 destabilization, and also induces proteasomal degradation of EBF1/EBF2 in an EIN2-dependent manner. This figure was created using the BioRender online tool (
BioRender.com ). -
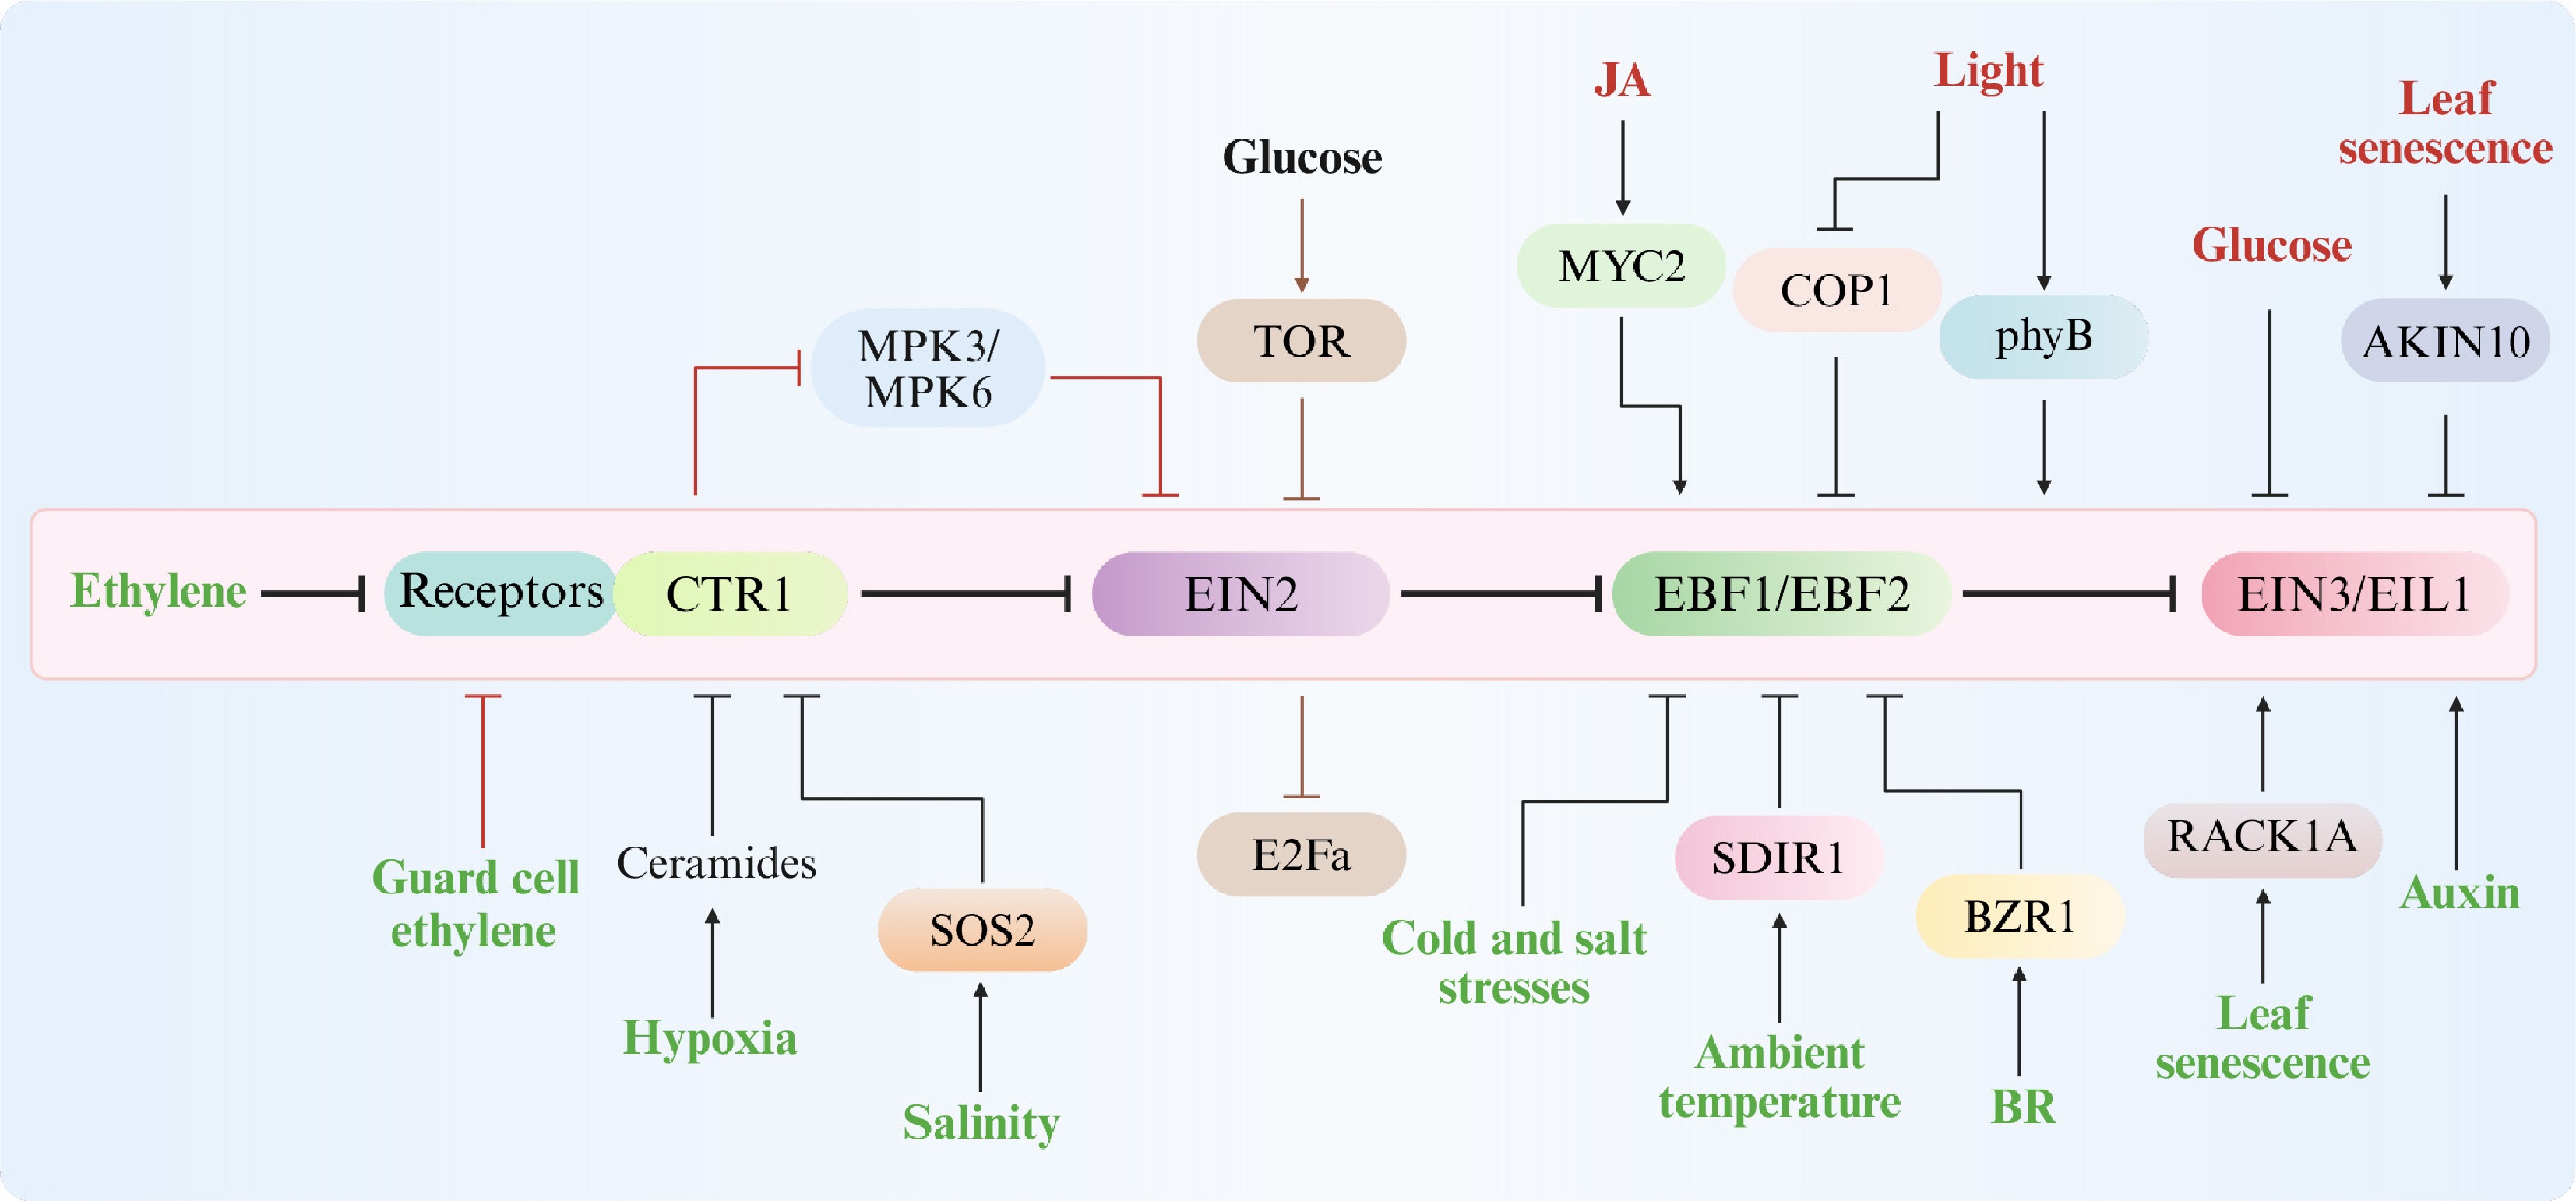
Figure 3.
Signaling networks centered on EIN3 protein stability. This figure illustrates the regulatory network of diverse signals modulating EIN3 protein stability, excluding the TOR-mediated pathway. Most signals regulate EIN3 accumulation by targeting EBF1/EBF2, while others act through upstream ethylene signaling components, such as CTR1 and EIN2, ultimately influencing EIN3 protein levels. The final effects on EIN3 accumulation are indicated in green and red, representing promotion and inhibition, respectively. The red lines represent the stomatal-specific pathway mediated by MPK3/MPK6, while the brown lines indicate the TOR-mediated regulation of EIN2, utilizing E2Fa rather than EIN3/EIL1 as downstream signaling components. This figure was created using the BioRender online tool (
BioRender.com ). -
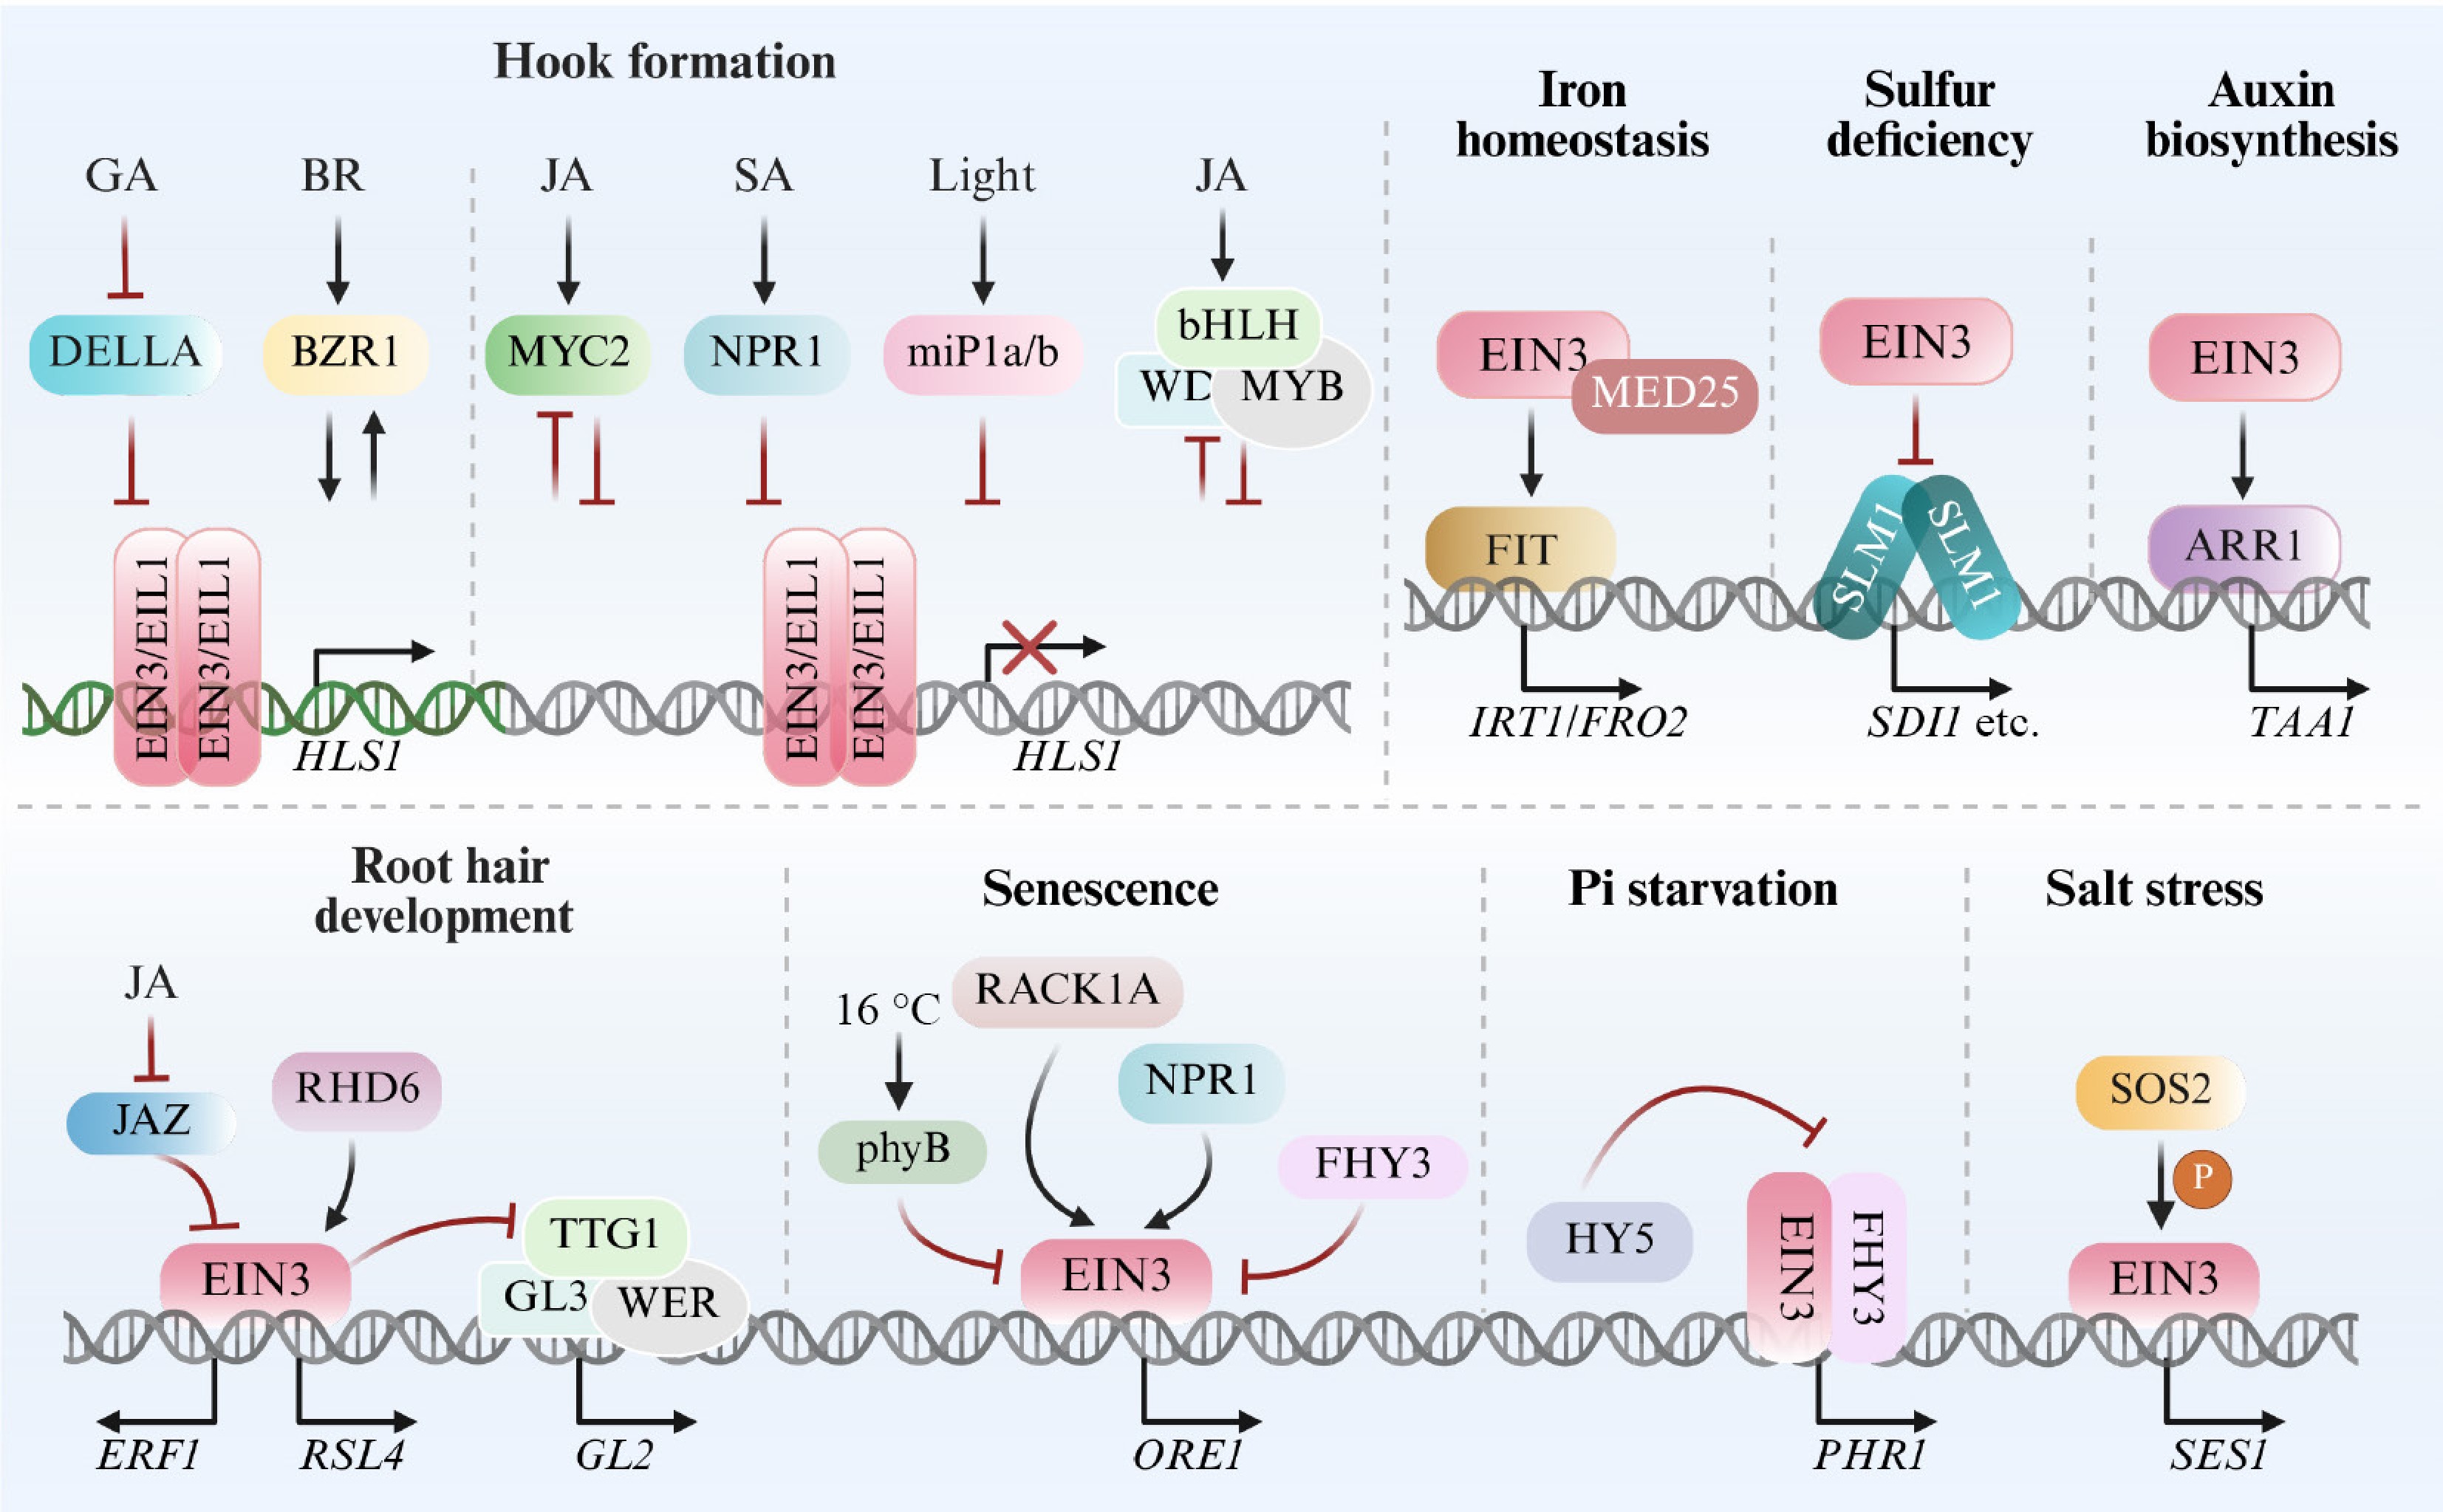
Figure 4.
Transcriptional activity regulatory networks mediated by EIN3. These signaling networks are involved in apical hook formation, root hair development, leaf senescence, and various stress responses. In addition to the upstream regulation of EIN3 activity, the figure also illustrates the influences of EIN3 on other transcription factors. Abbreviations: IRT1, IRON-REGULATED TRANSPORTER 1; FRO2, FERRIC REDUCTION OXIDASE 2; SDI1, SULPHUR DEFICIENCY-INDUCED 1. This figure was created using the BioRender online tool (BioRender.com).
Figures
(4)
Tables
(0)