-
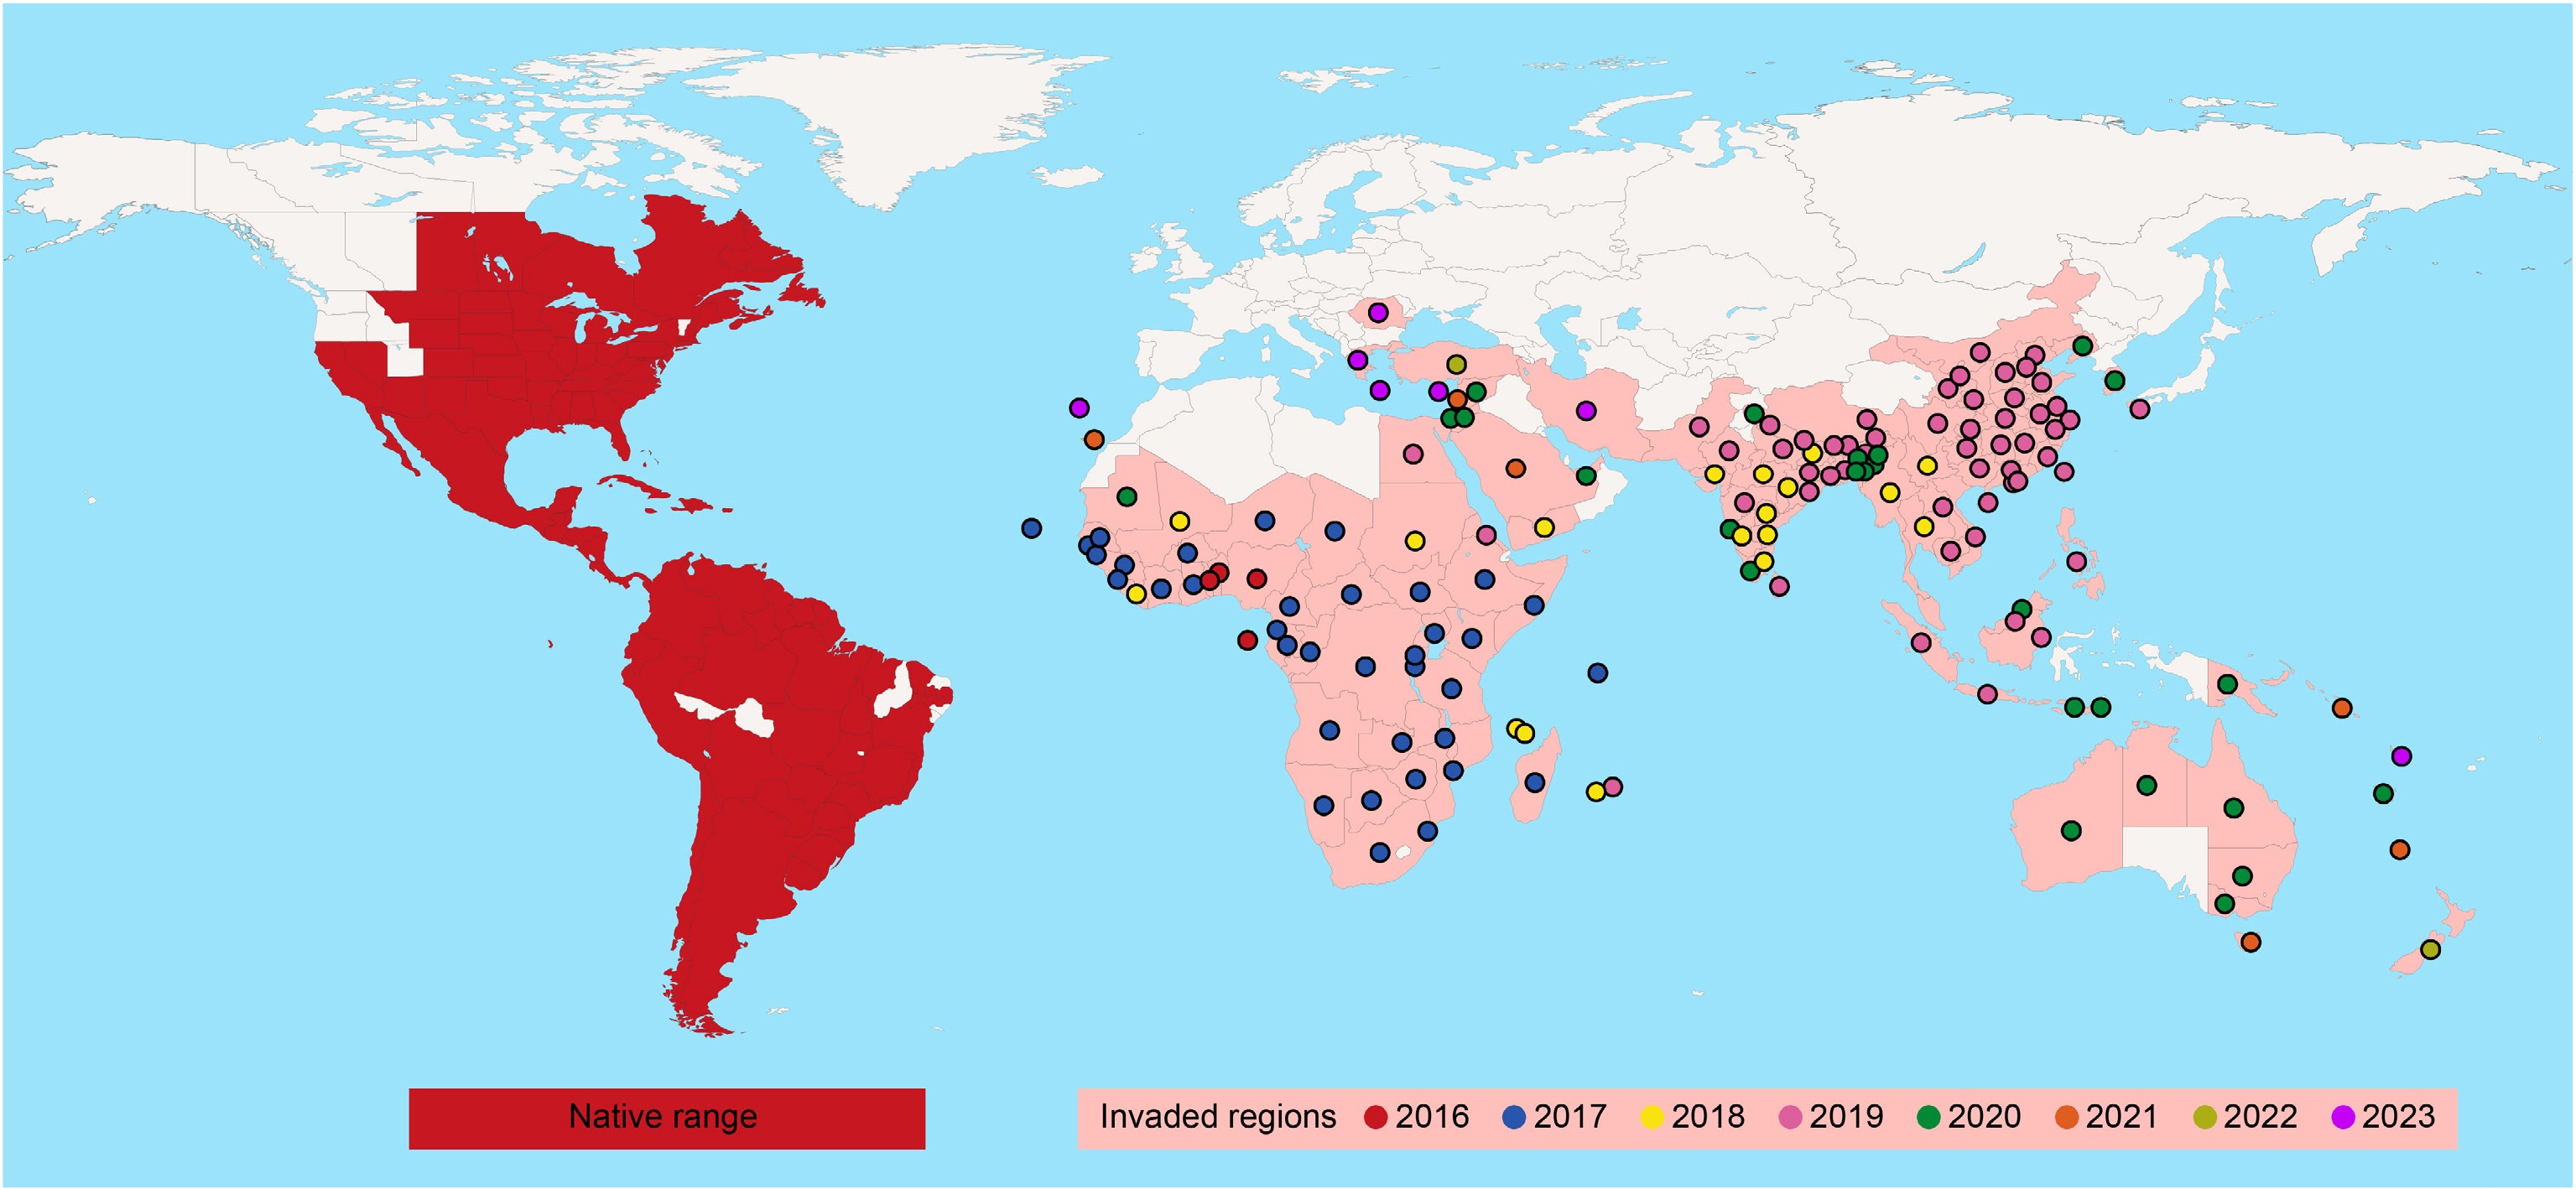
Figure 1.
Schematic map of the global distribution and invasion spread of the fall armyworm. Colored dots indicate the first recorded year of fall armyworm detection in each region. The data were primarily sourced from the European and Mediterranean Plant Protection Organization (EPPO) Global Database (last updated February 27, 2025) and supplemented with relevant published literature and reports.
-
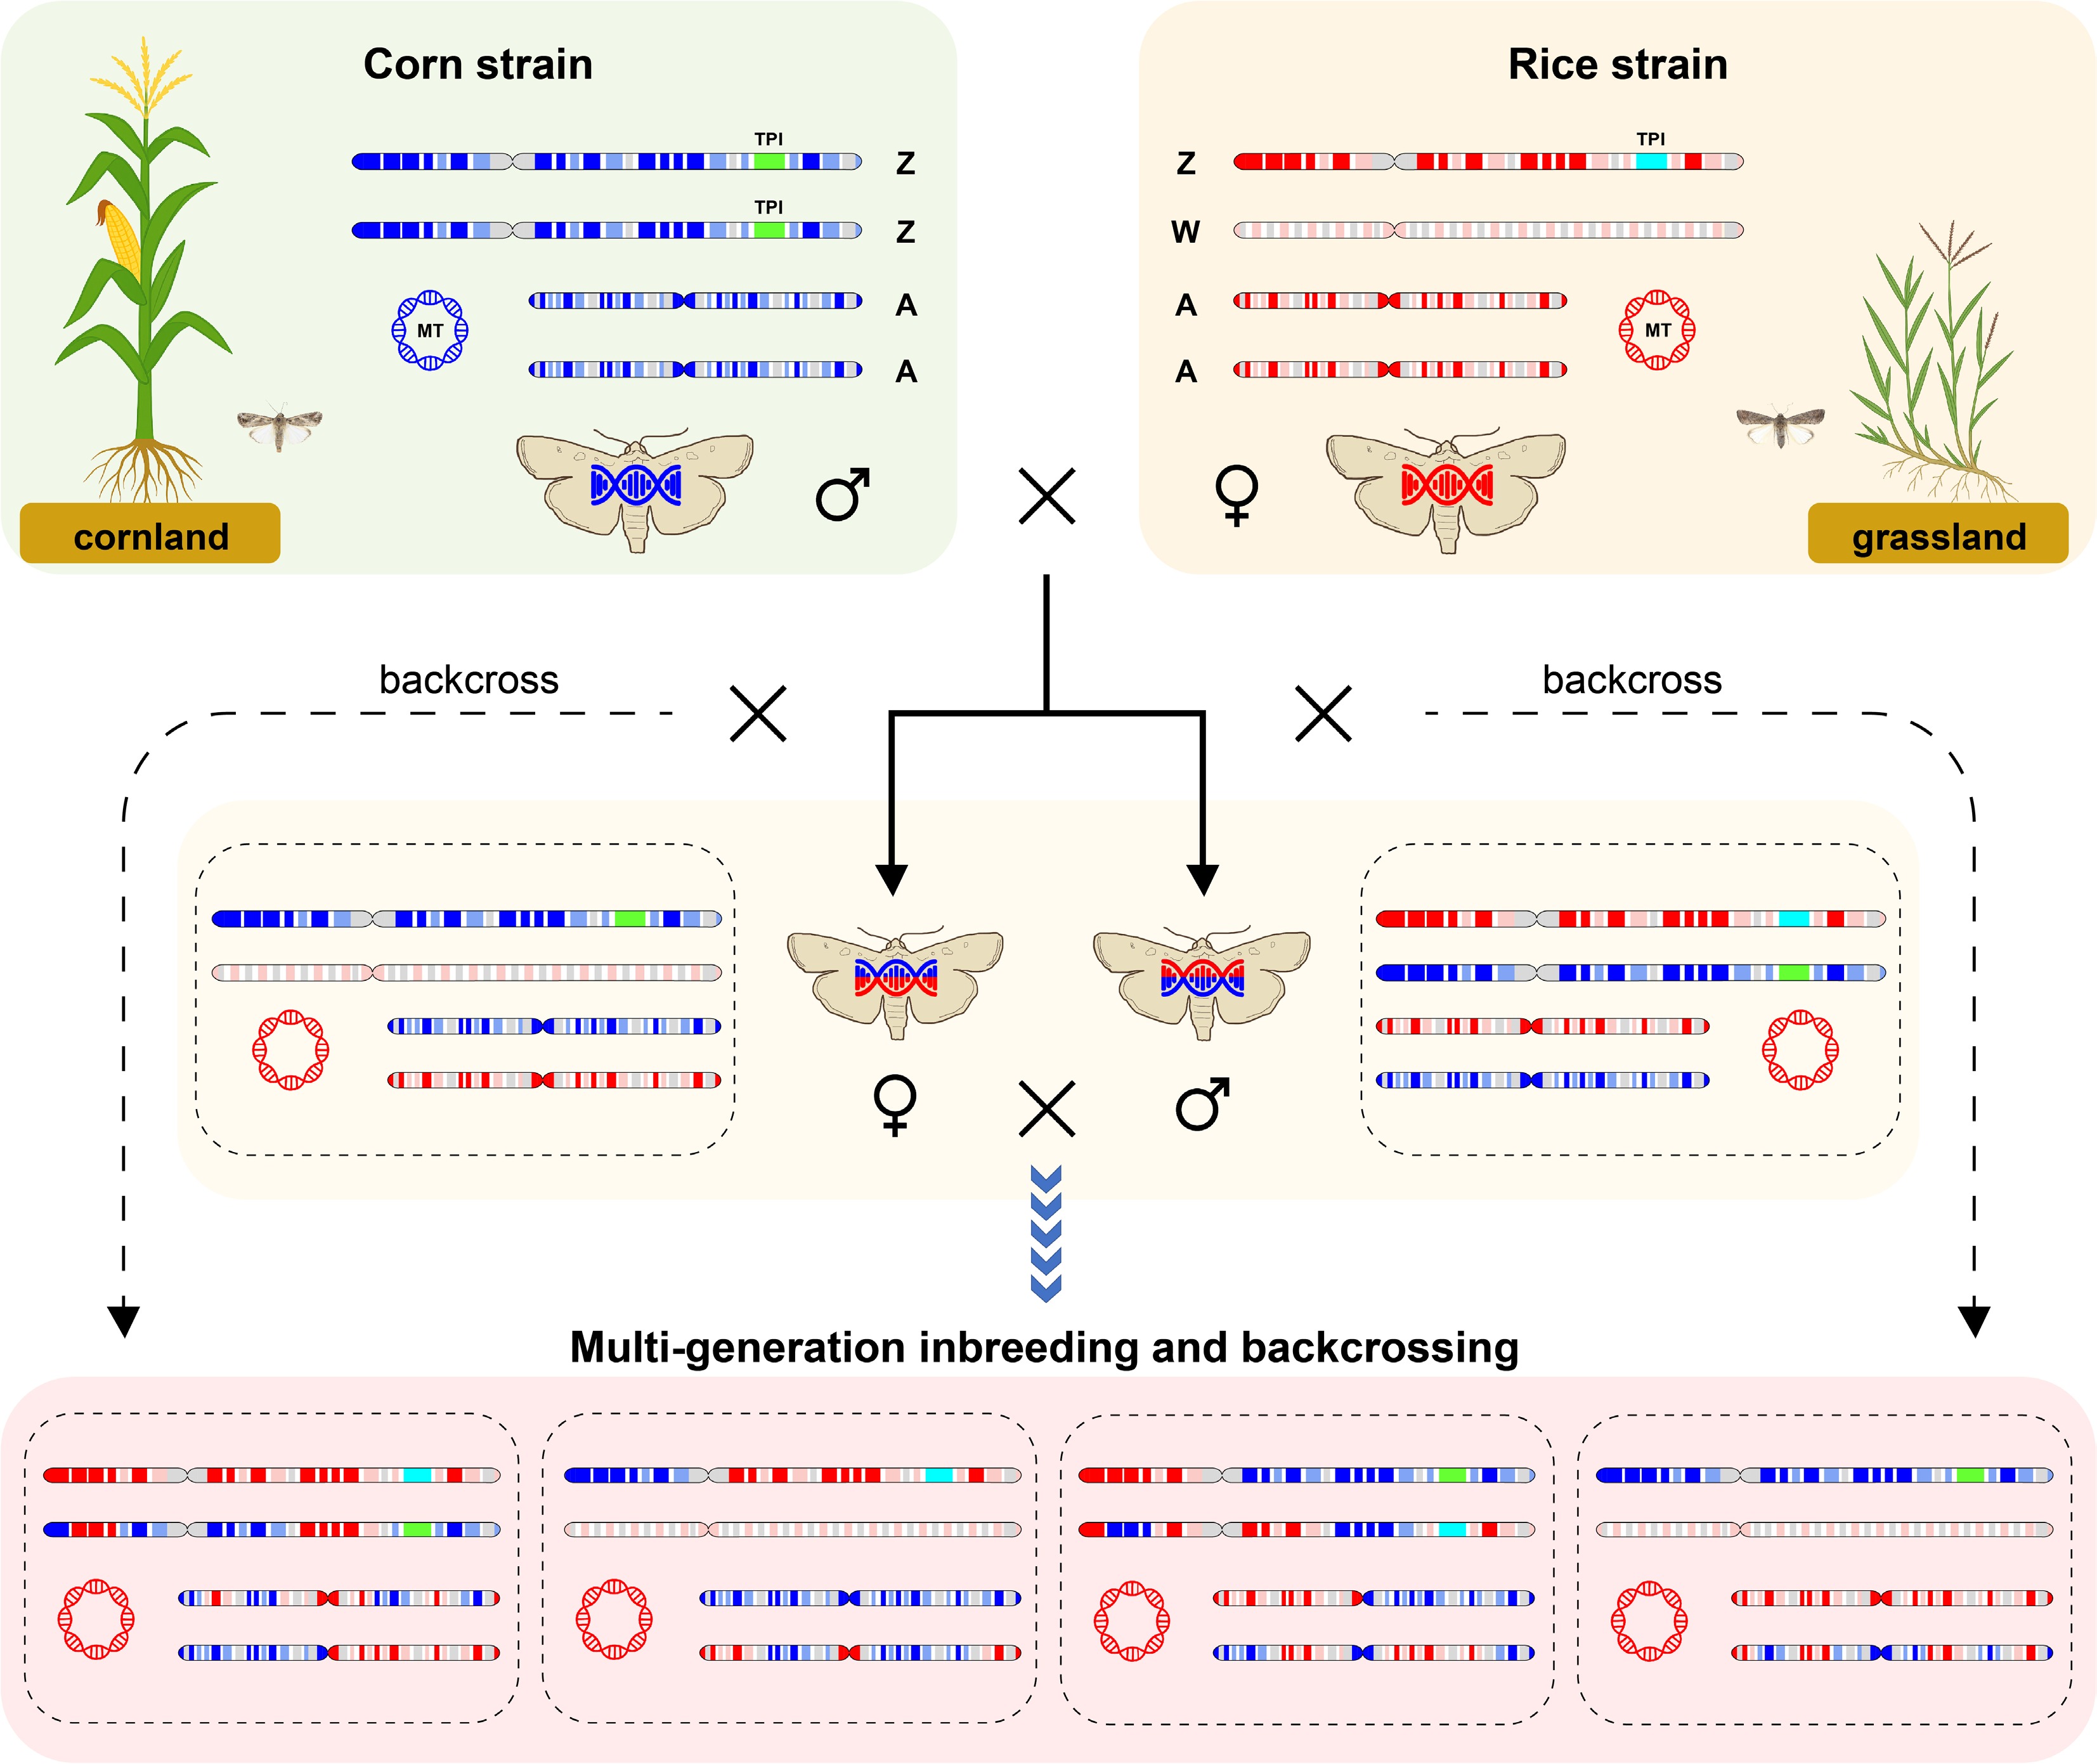
Figure 2.
Schematic illustration of the interstrain evolutionary patterns of the two fall armyworm strains. The corn-strain genetic background is represented in blue, and the rice-strain background is shown in red. MT and TPI denote the mitochondrial (COI) and nuclear (Tpi) molecular markers, respectively.
Figures
(2)
Tables
(0)