-
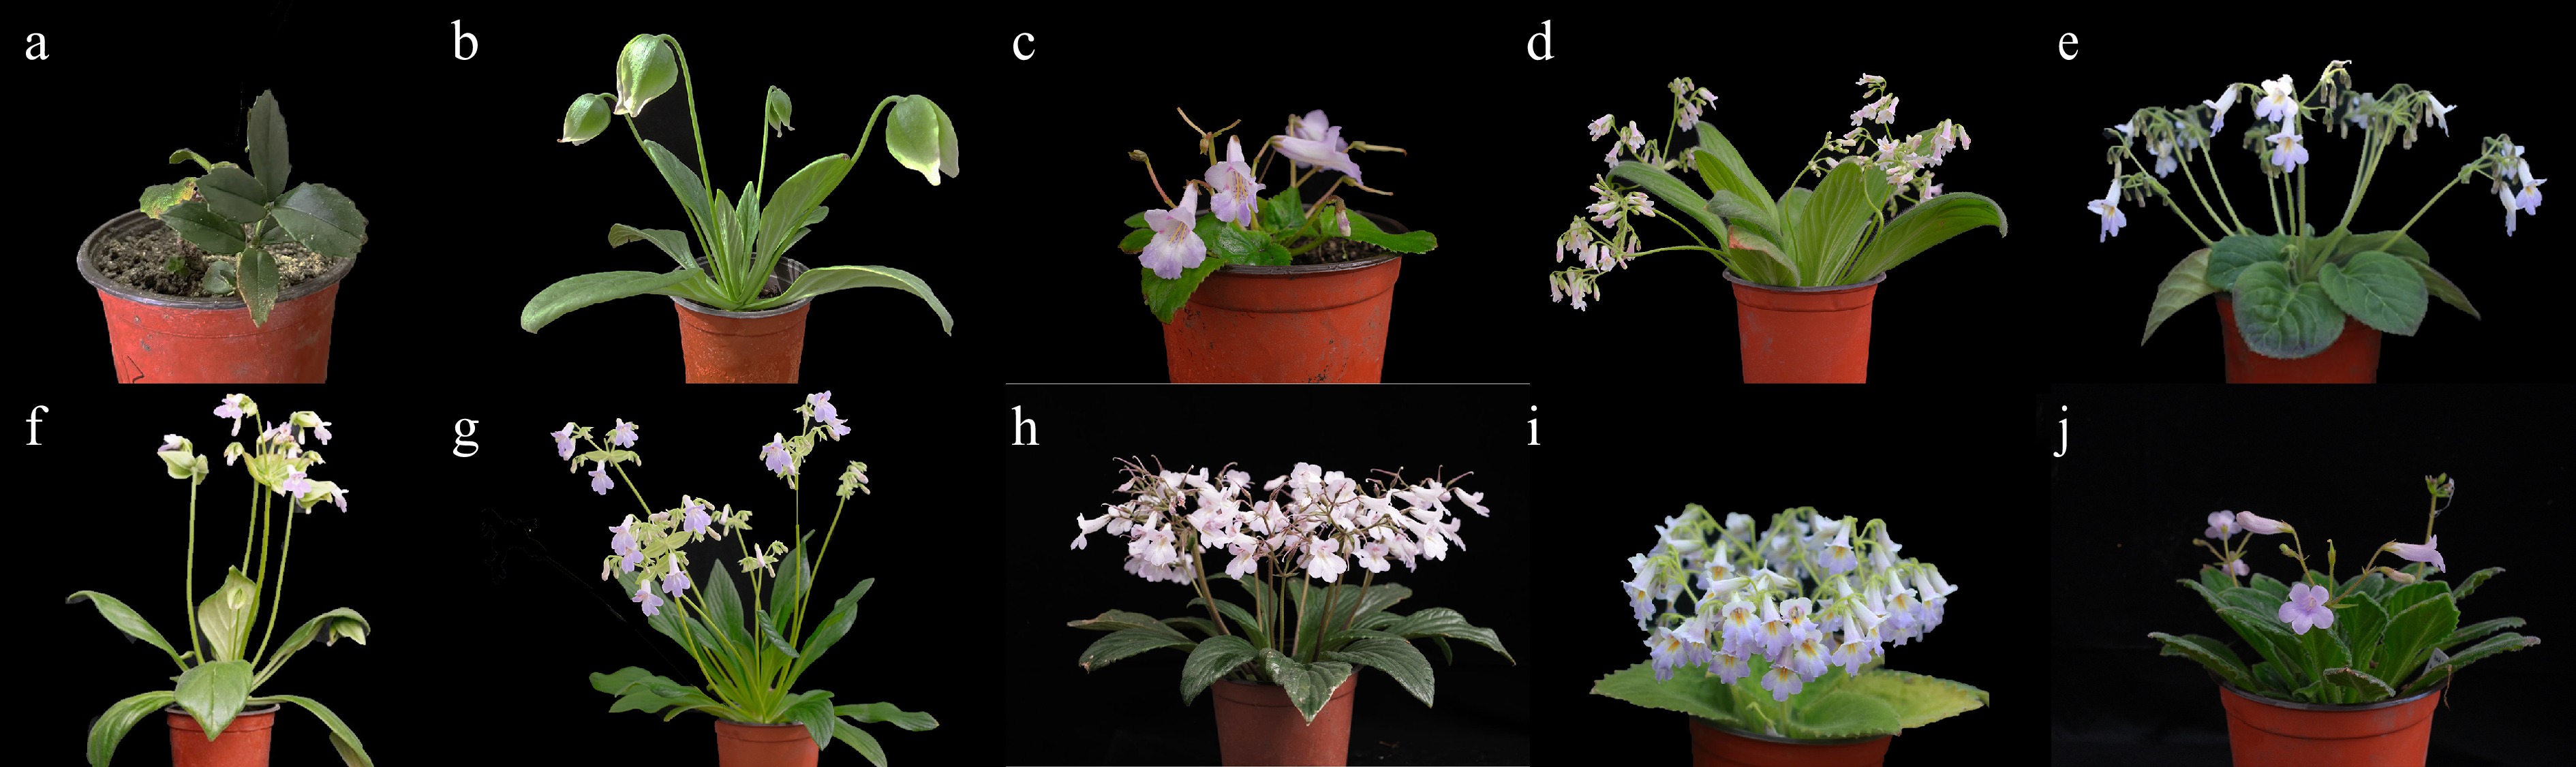
Figure 1.
The ten taxa of Gesneriaceae used in this study. (a) L. pauciflorus, (b) P. eburnea, (c) P. fimbrisepala, (d) P. medica, (e) P. 'Nandia Dreams', (f) P. 'Venus', (g) P. 'The Smurfs', (h) P. 'Spring of Beilin', (i) P. 'Purple Sundae', (j) P. 'Four Seasons'.
-
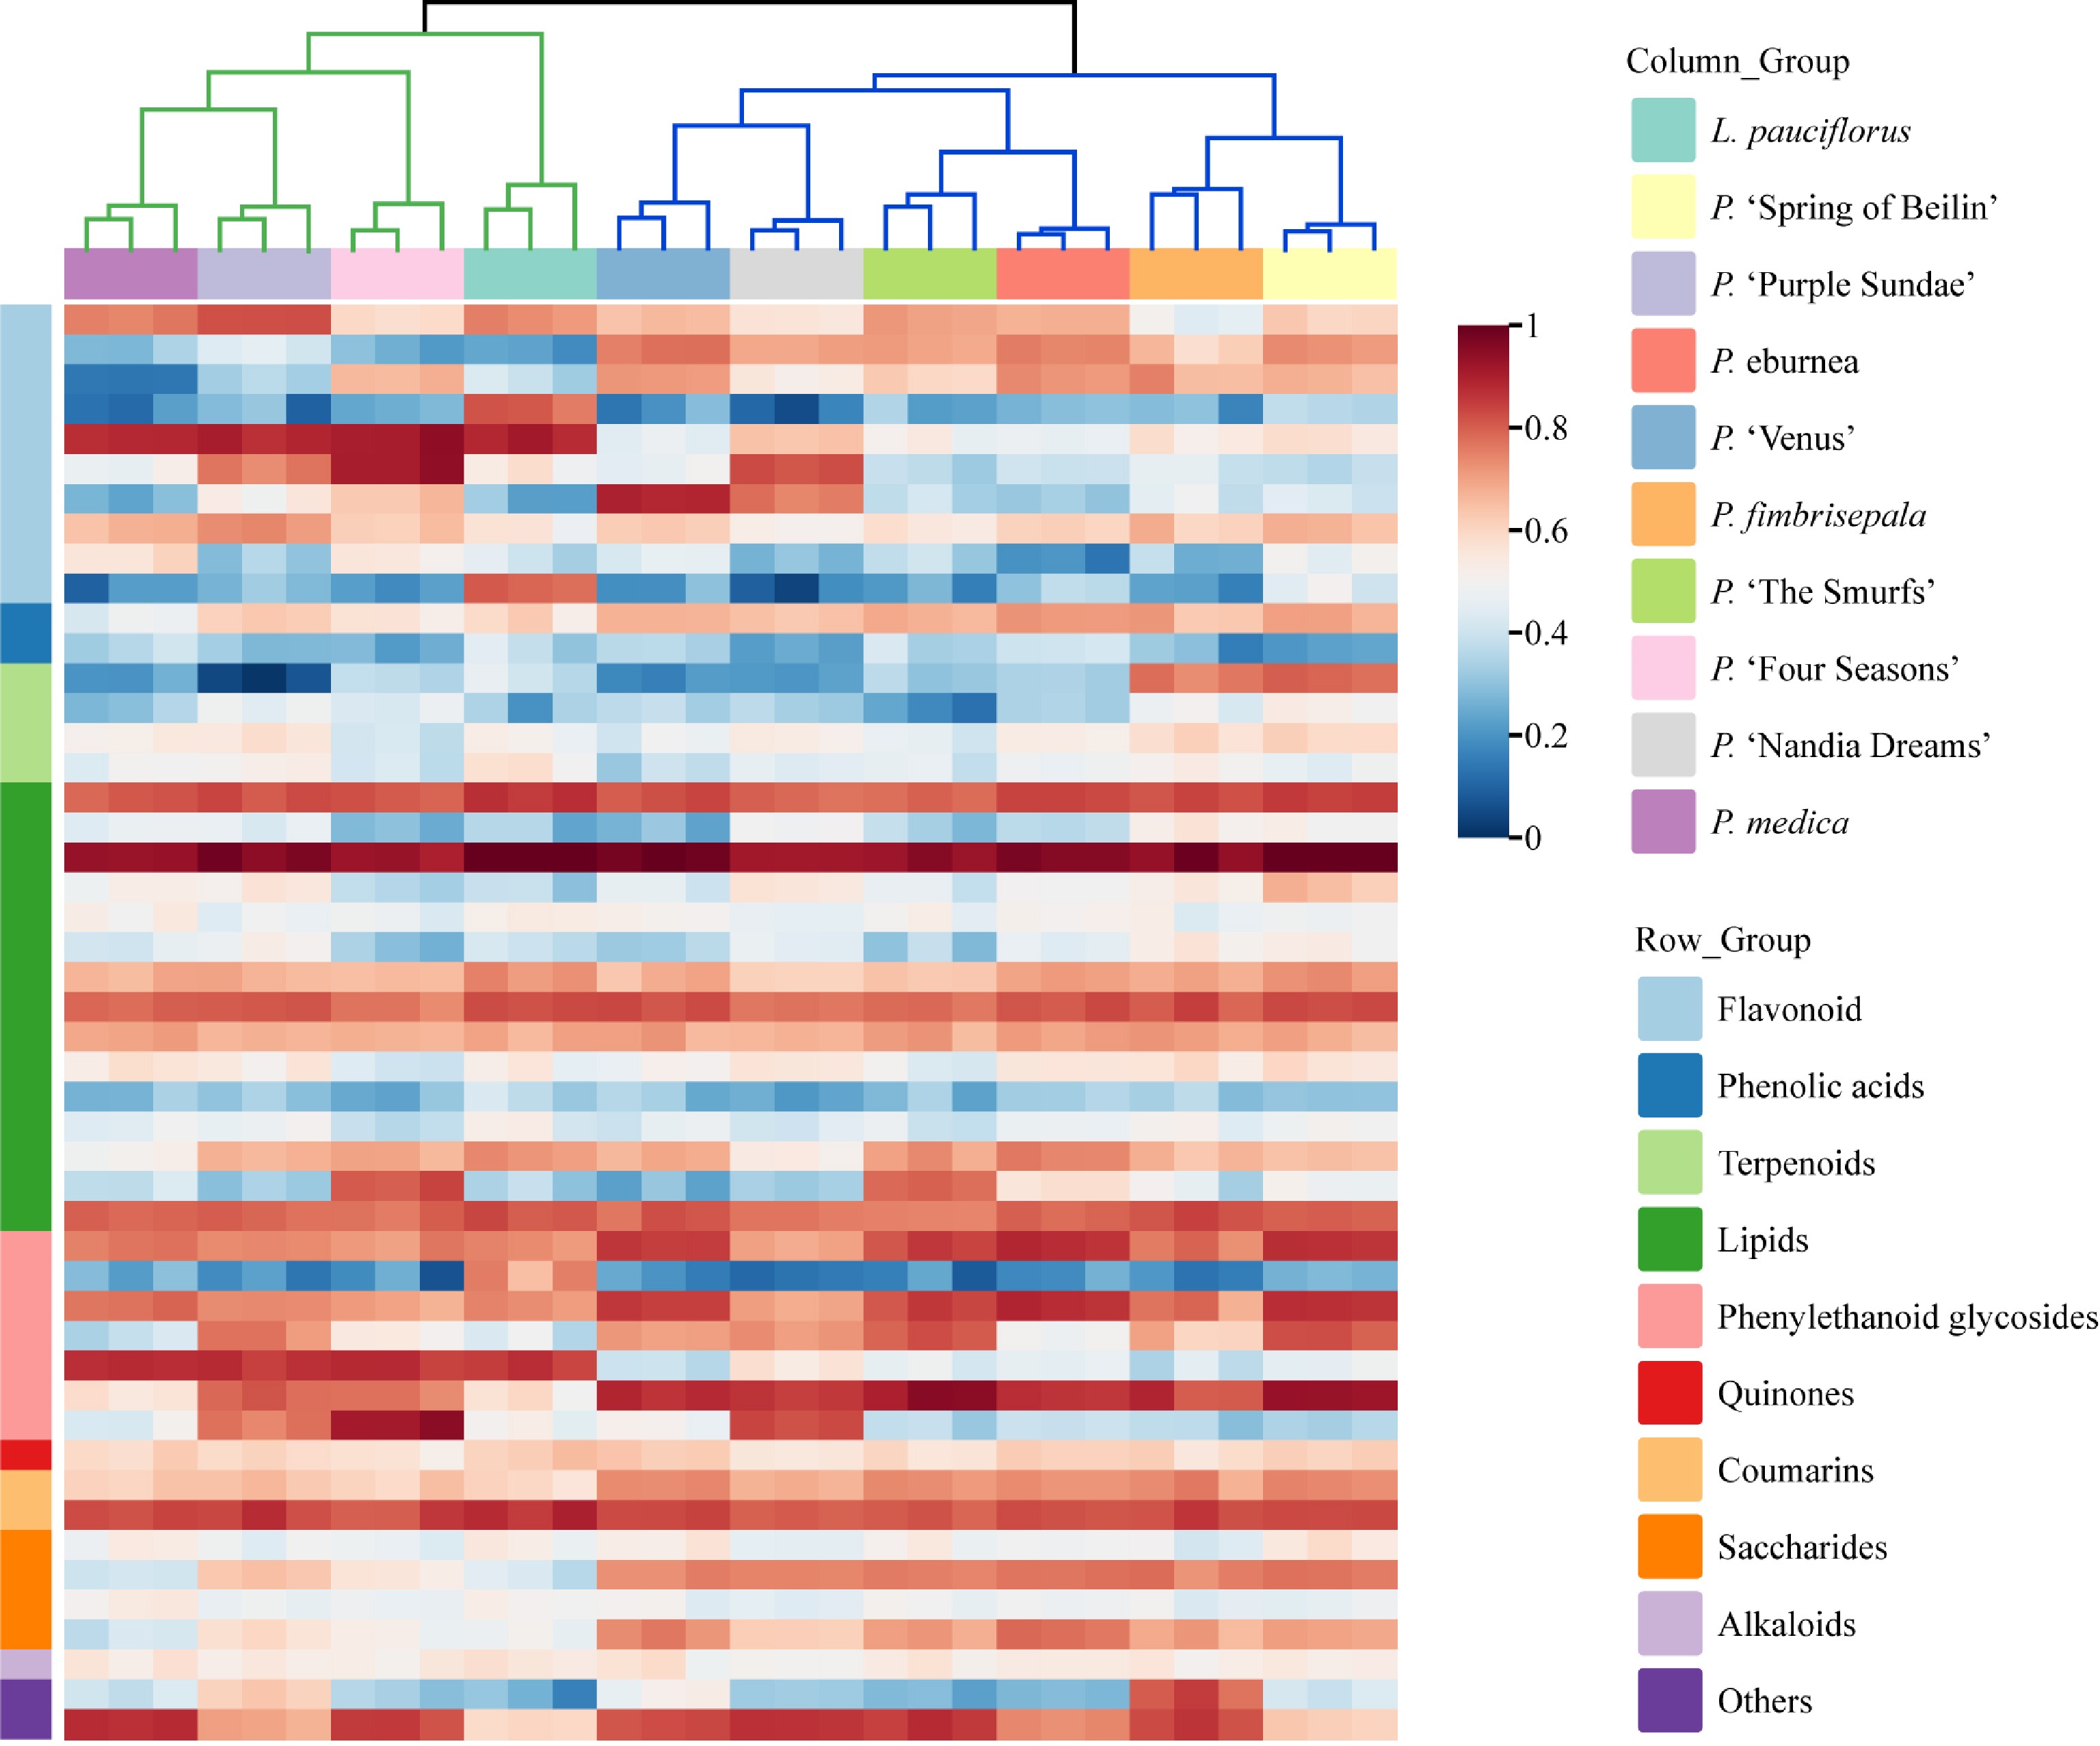
Figure 2.
Heat map analysis of metabolite clustering in the leaves of ten Gesneriaceae taxa.
-
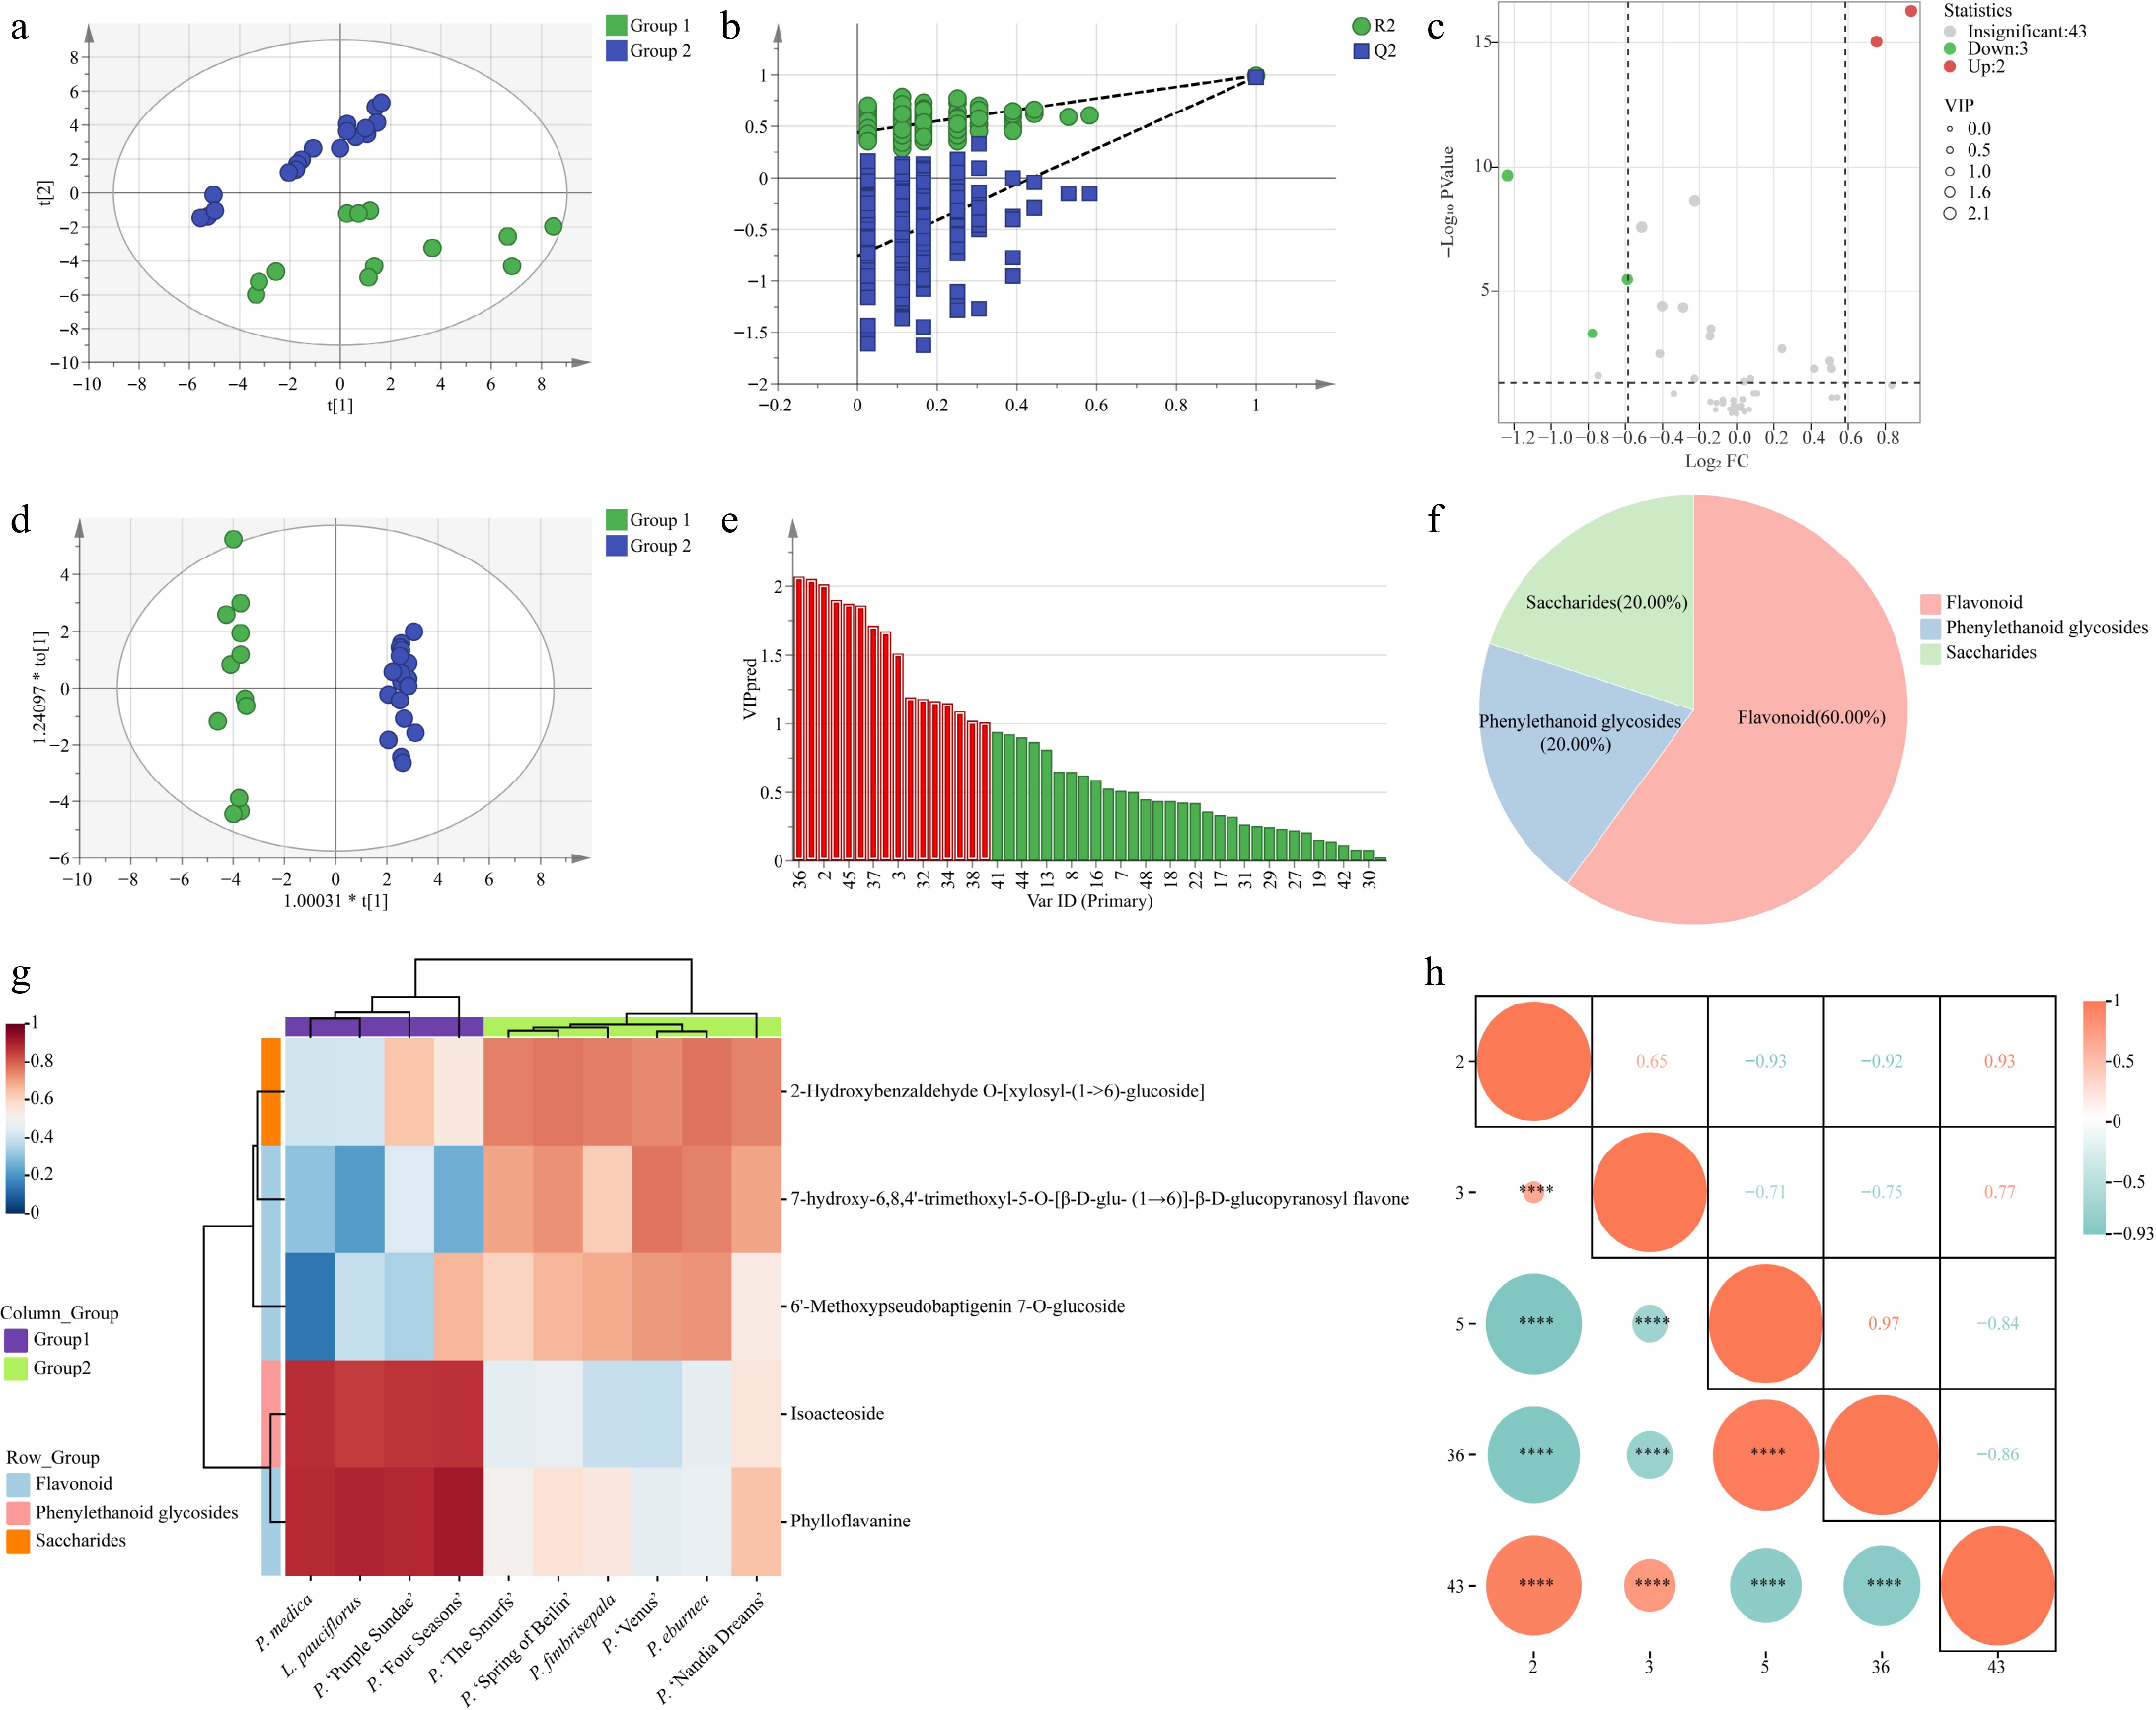
Figure 3.
Multivariate statistical analyses of metabolites in the leaves of ten Gesneriaceae taxa. (a) Scatter plot of PCA scores. (b) Model replacement test plot. (c) Volcano diagram. (d) Scatter plot of OPLS-DA scores. (e) VIP values of metabolites. (f) DAMs pie chart. (g) DAMs clustering heat map. Group 1: P. medica, P. 'Purple Sundae,' P. 'Four Seasons', L. pauciflorus; Group 2: P. fimbrisepala, P. 'Spring of Beilin', P. 'The Smurfs', P. eburnea, P. 'Nandia Dreams', and P. 'Venus'. (h) DAMs correlation analysis. 2: 7-hydroxy-6,8,4'-trimethoxyl-5-O-[β-D-glu-(1→6)]-β-D-glucopyranosyl flavone; 3: 6'-Methoxypseudobaptigenin 7-O-glucoside; 5: Phylloflavanine; 36: Isoacteoside; 43: 2-Hydroxybenzaldehyde O-[xylosyl-(1→6)-glucoside].
-
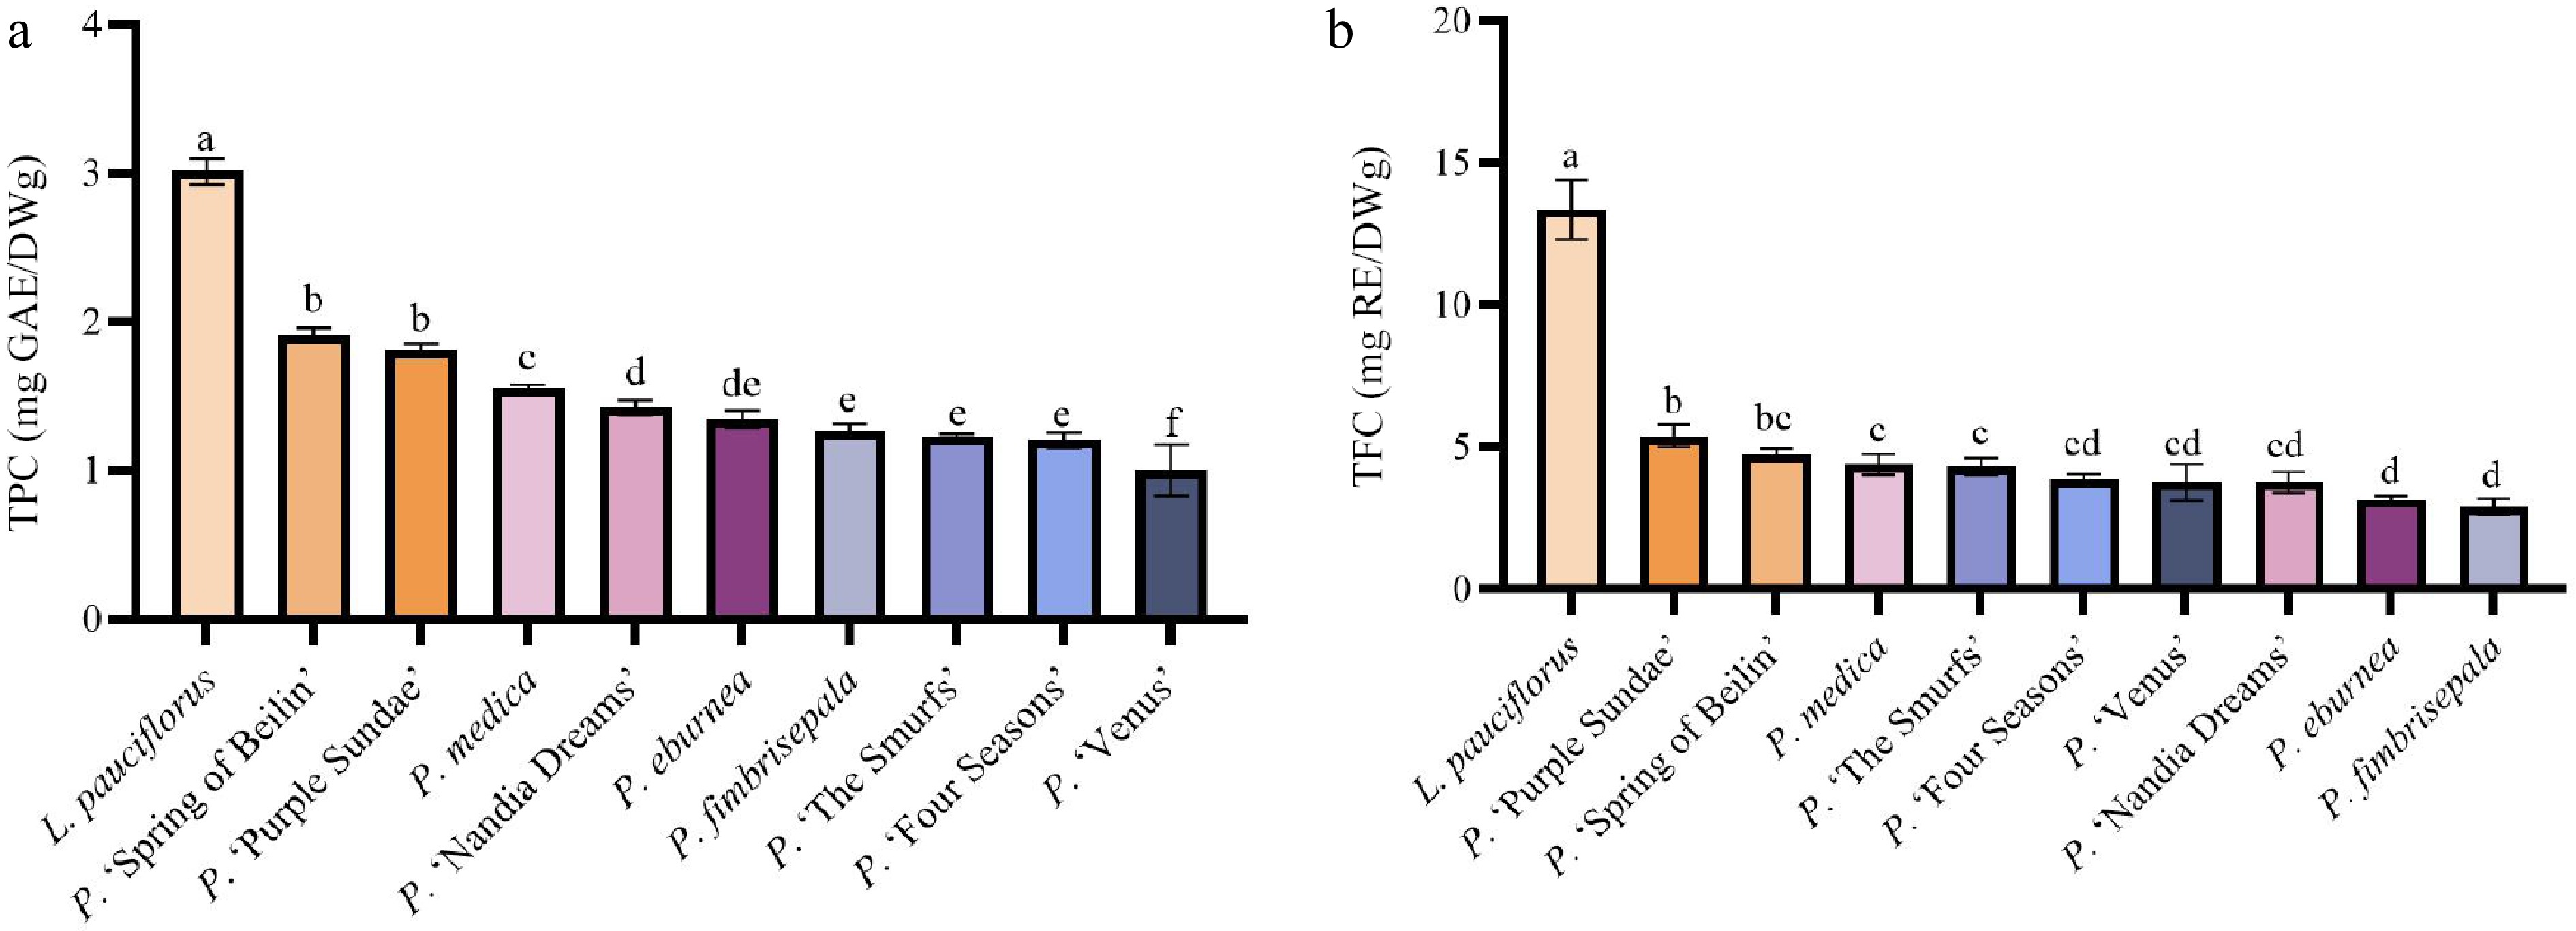
Figure 4.
Bioactive components in the leaves of ten Gesneriaceae taxa. (a) Total phenolic content (TPC) results. (b) Total flavonoid content (TFC) results. Data with no or the same letter indicate no significant difference at p > 0.05; those with different letters indicate a significant difference at p < 0.05.
-
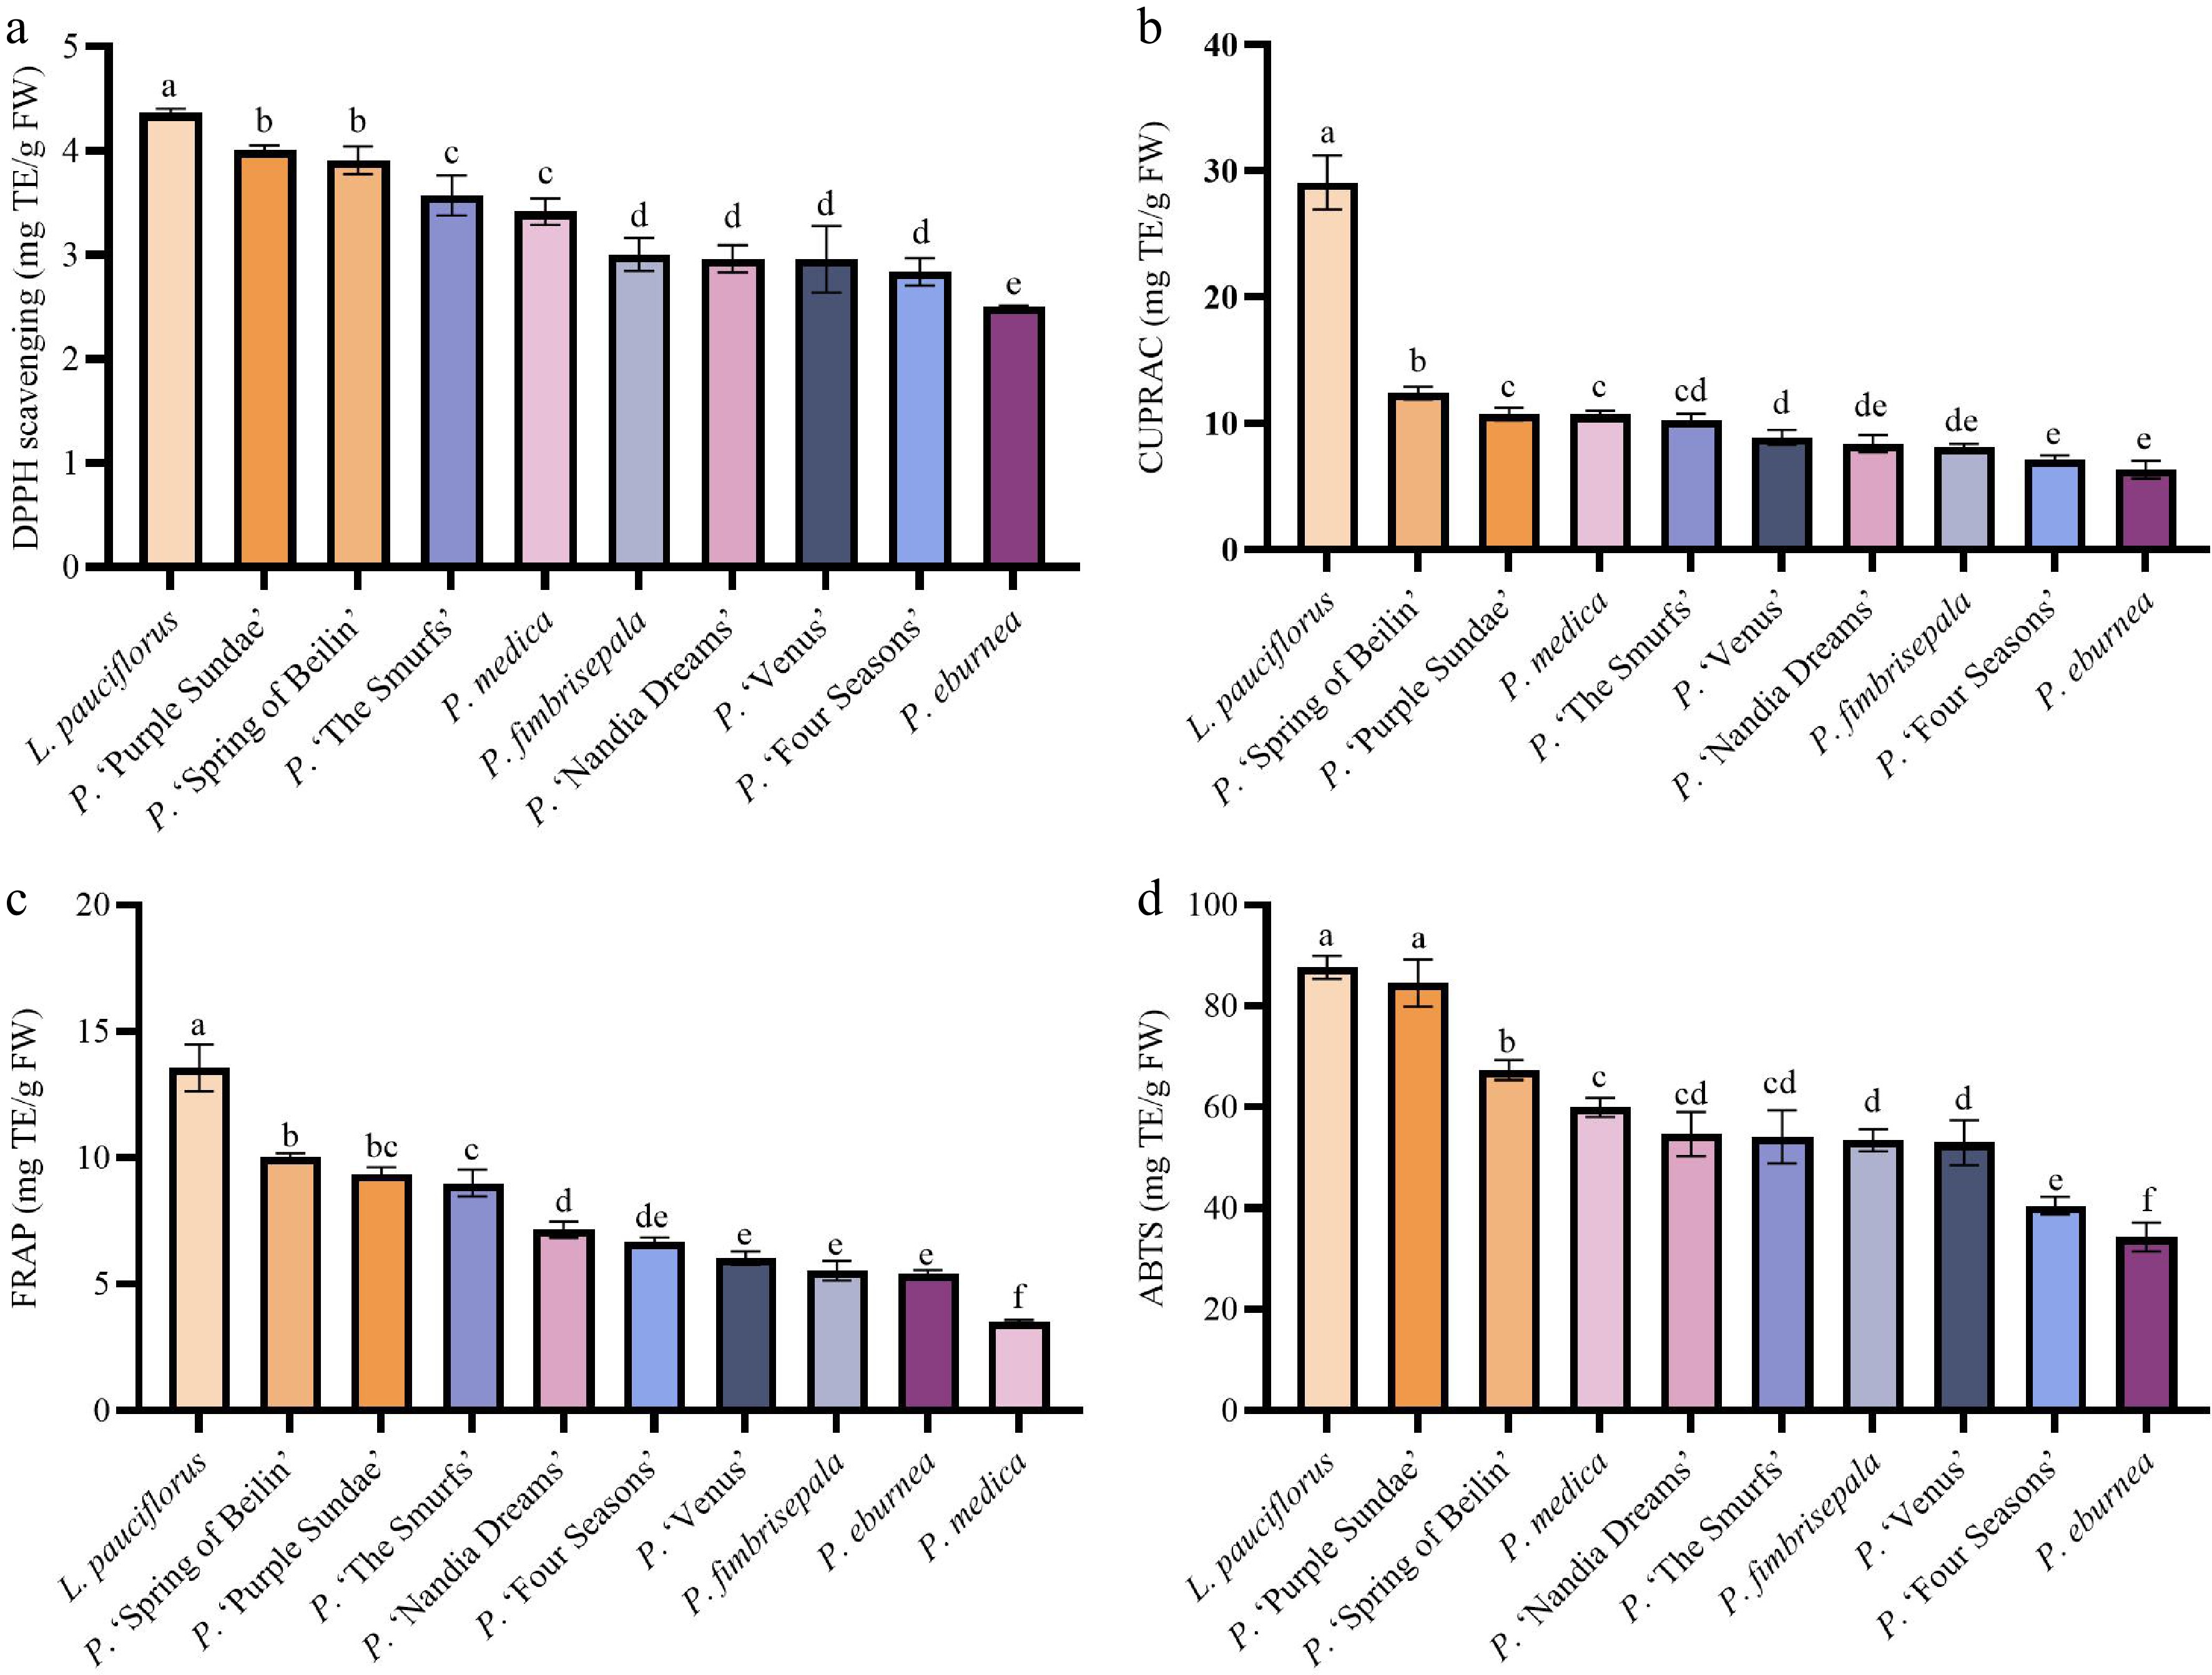
Figure 5.
Bioactive components in the leaves of ten Gesneriaceae taxa. (a) DPPH results. (b) CUPRAC results. (c) FRAP results. (d) ABTS results. Data with no or the same letter indicate no significant difference at p > 0.05; those with different letters indicate a significant difference at p < 0.05.
-
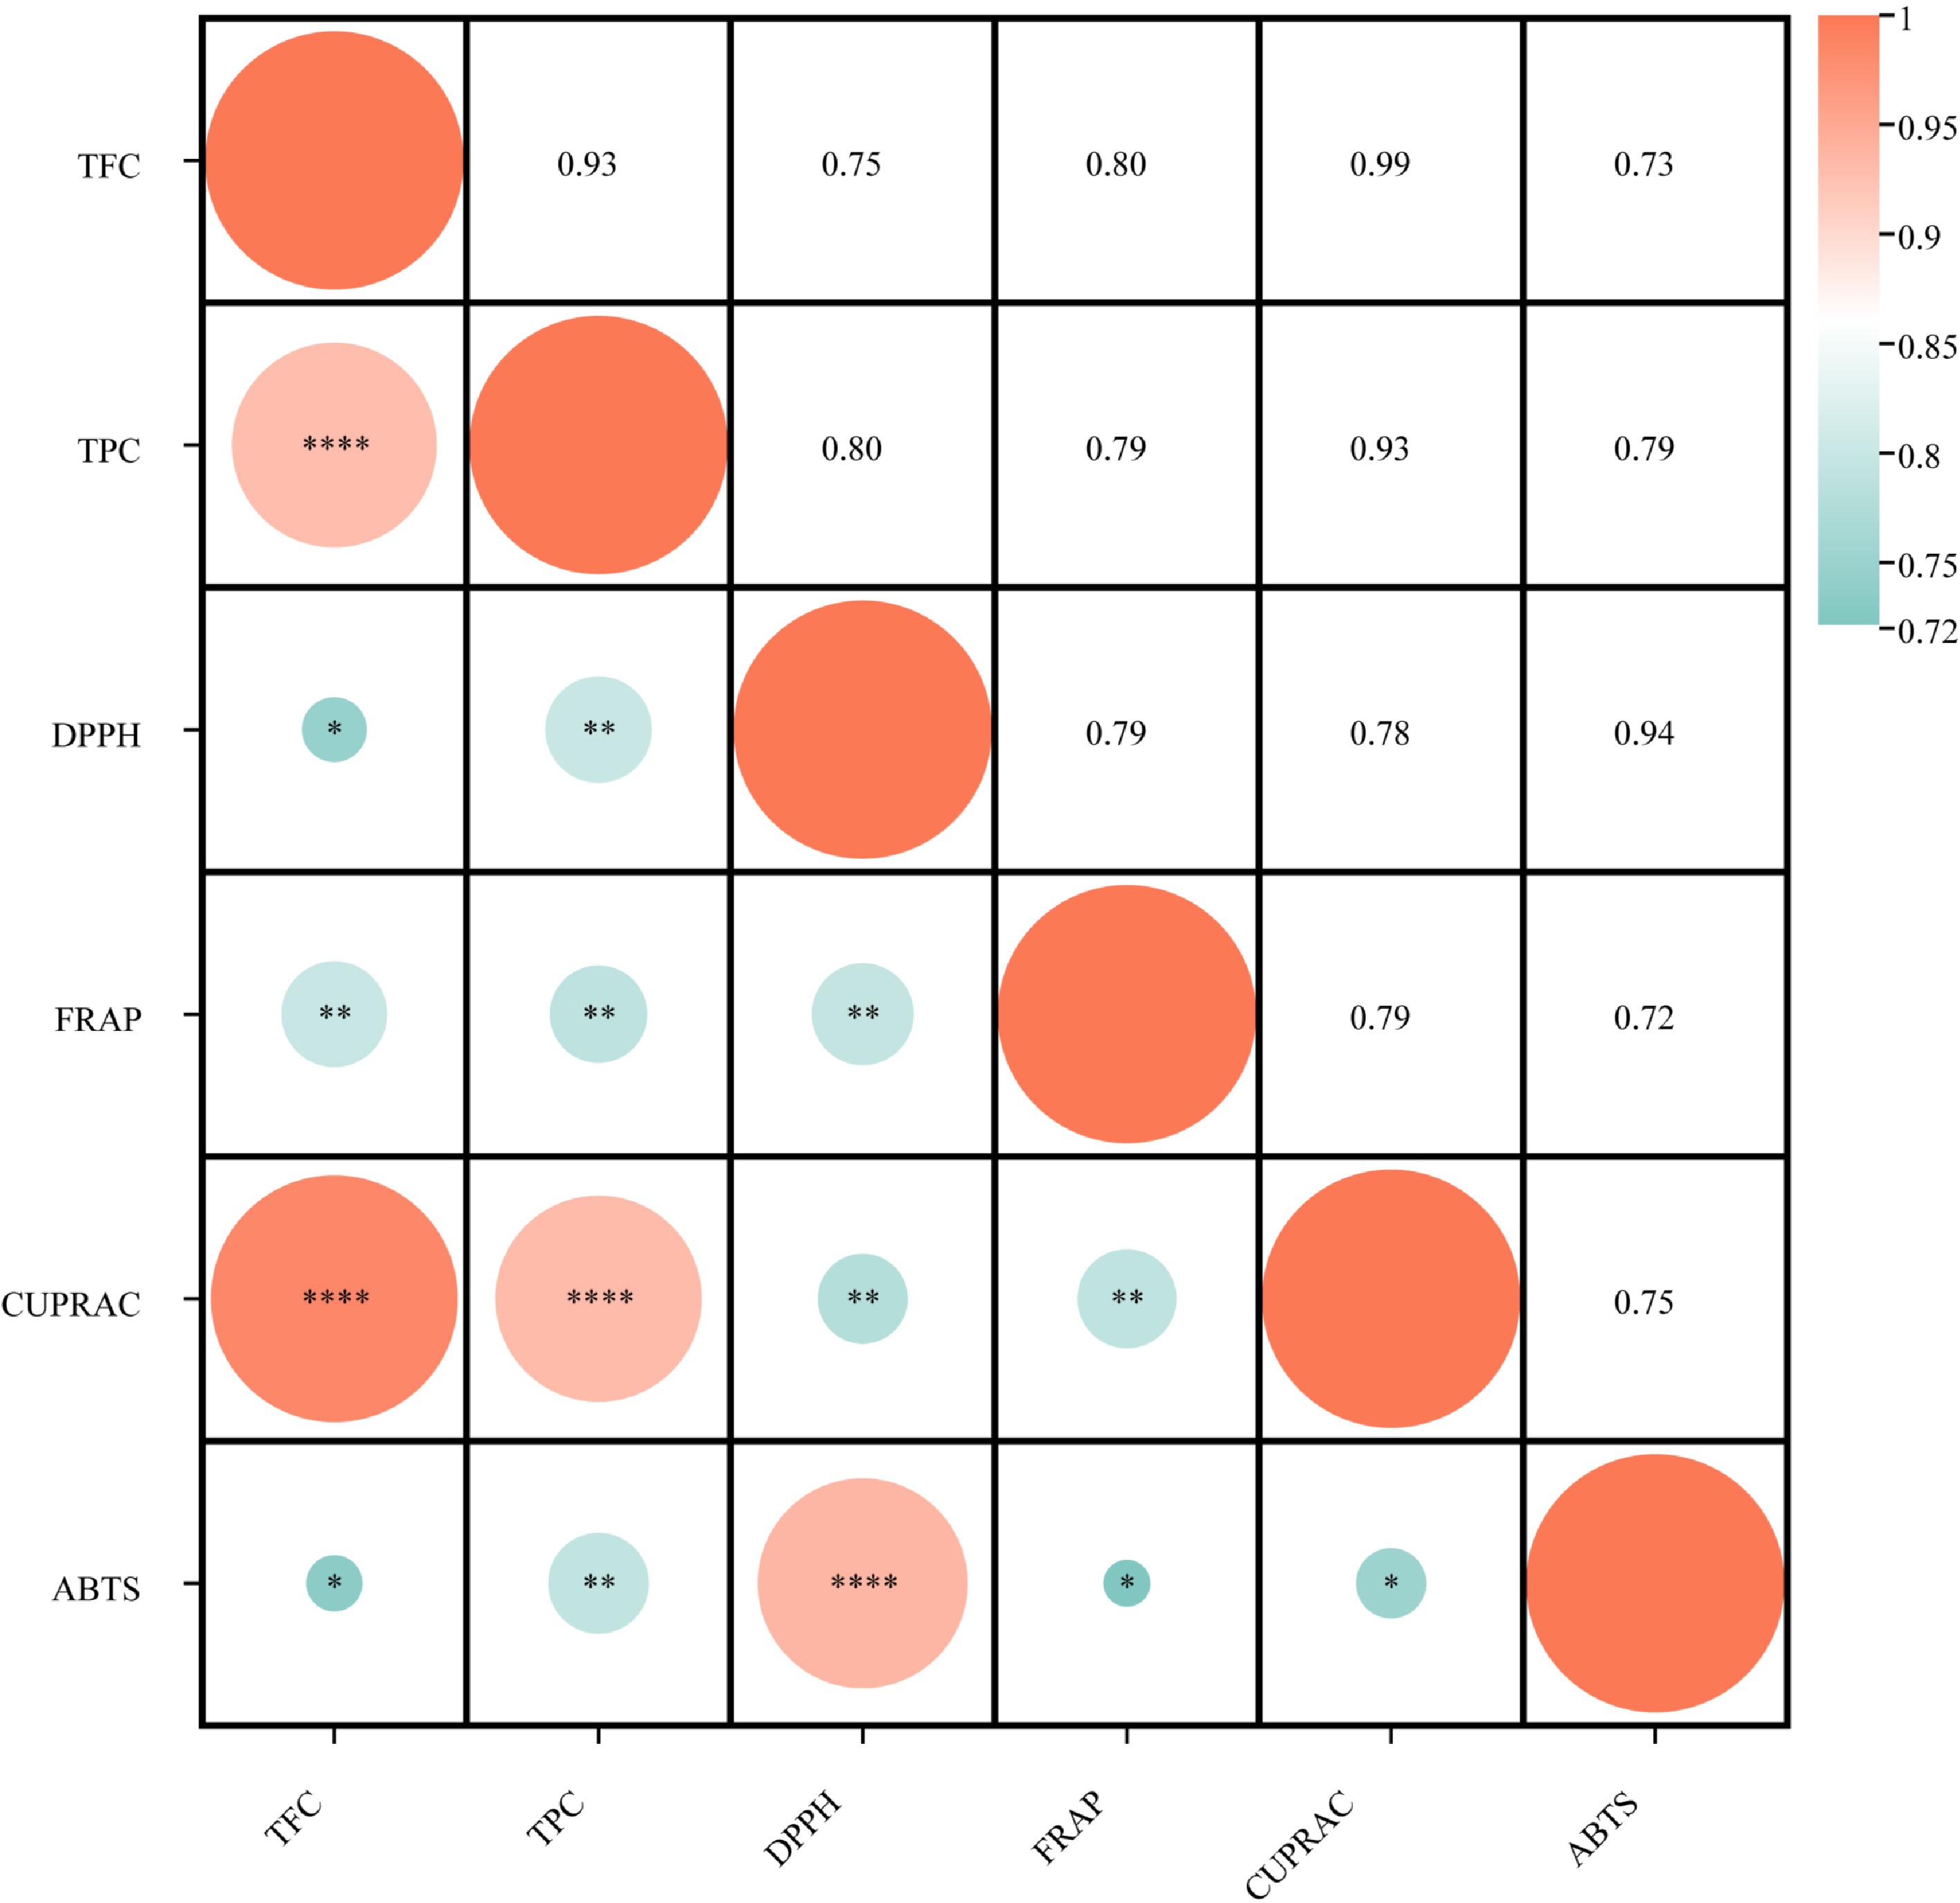
Figure 6.
Correlation between TPC, TFC, and DPPH, ABTS, CUPRAC, and FRAP (* p < 0.05, ** p < 0.01, *** p < 0.001, and **** p < 0.0001).
-
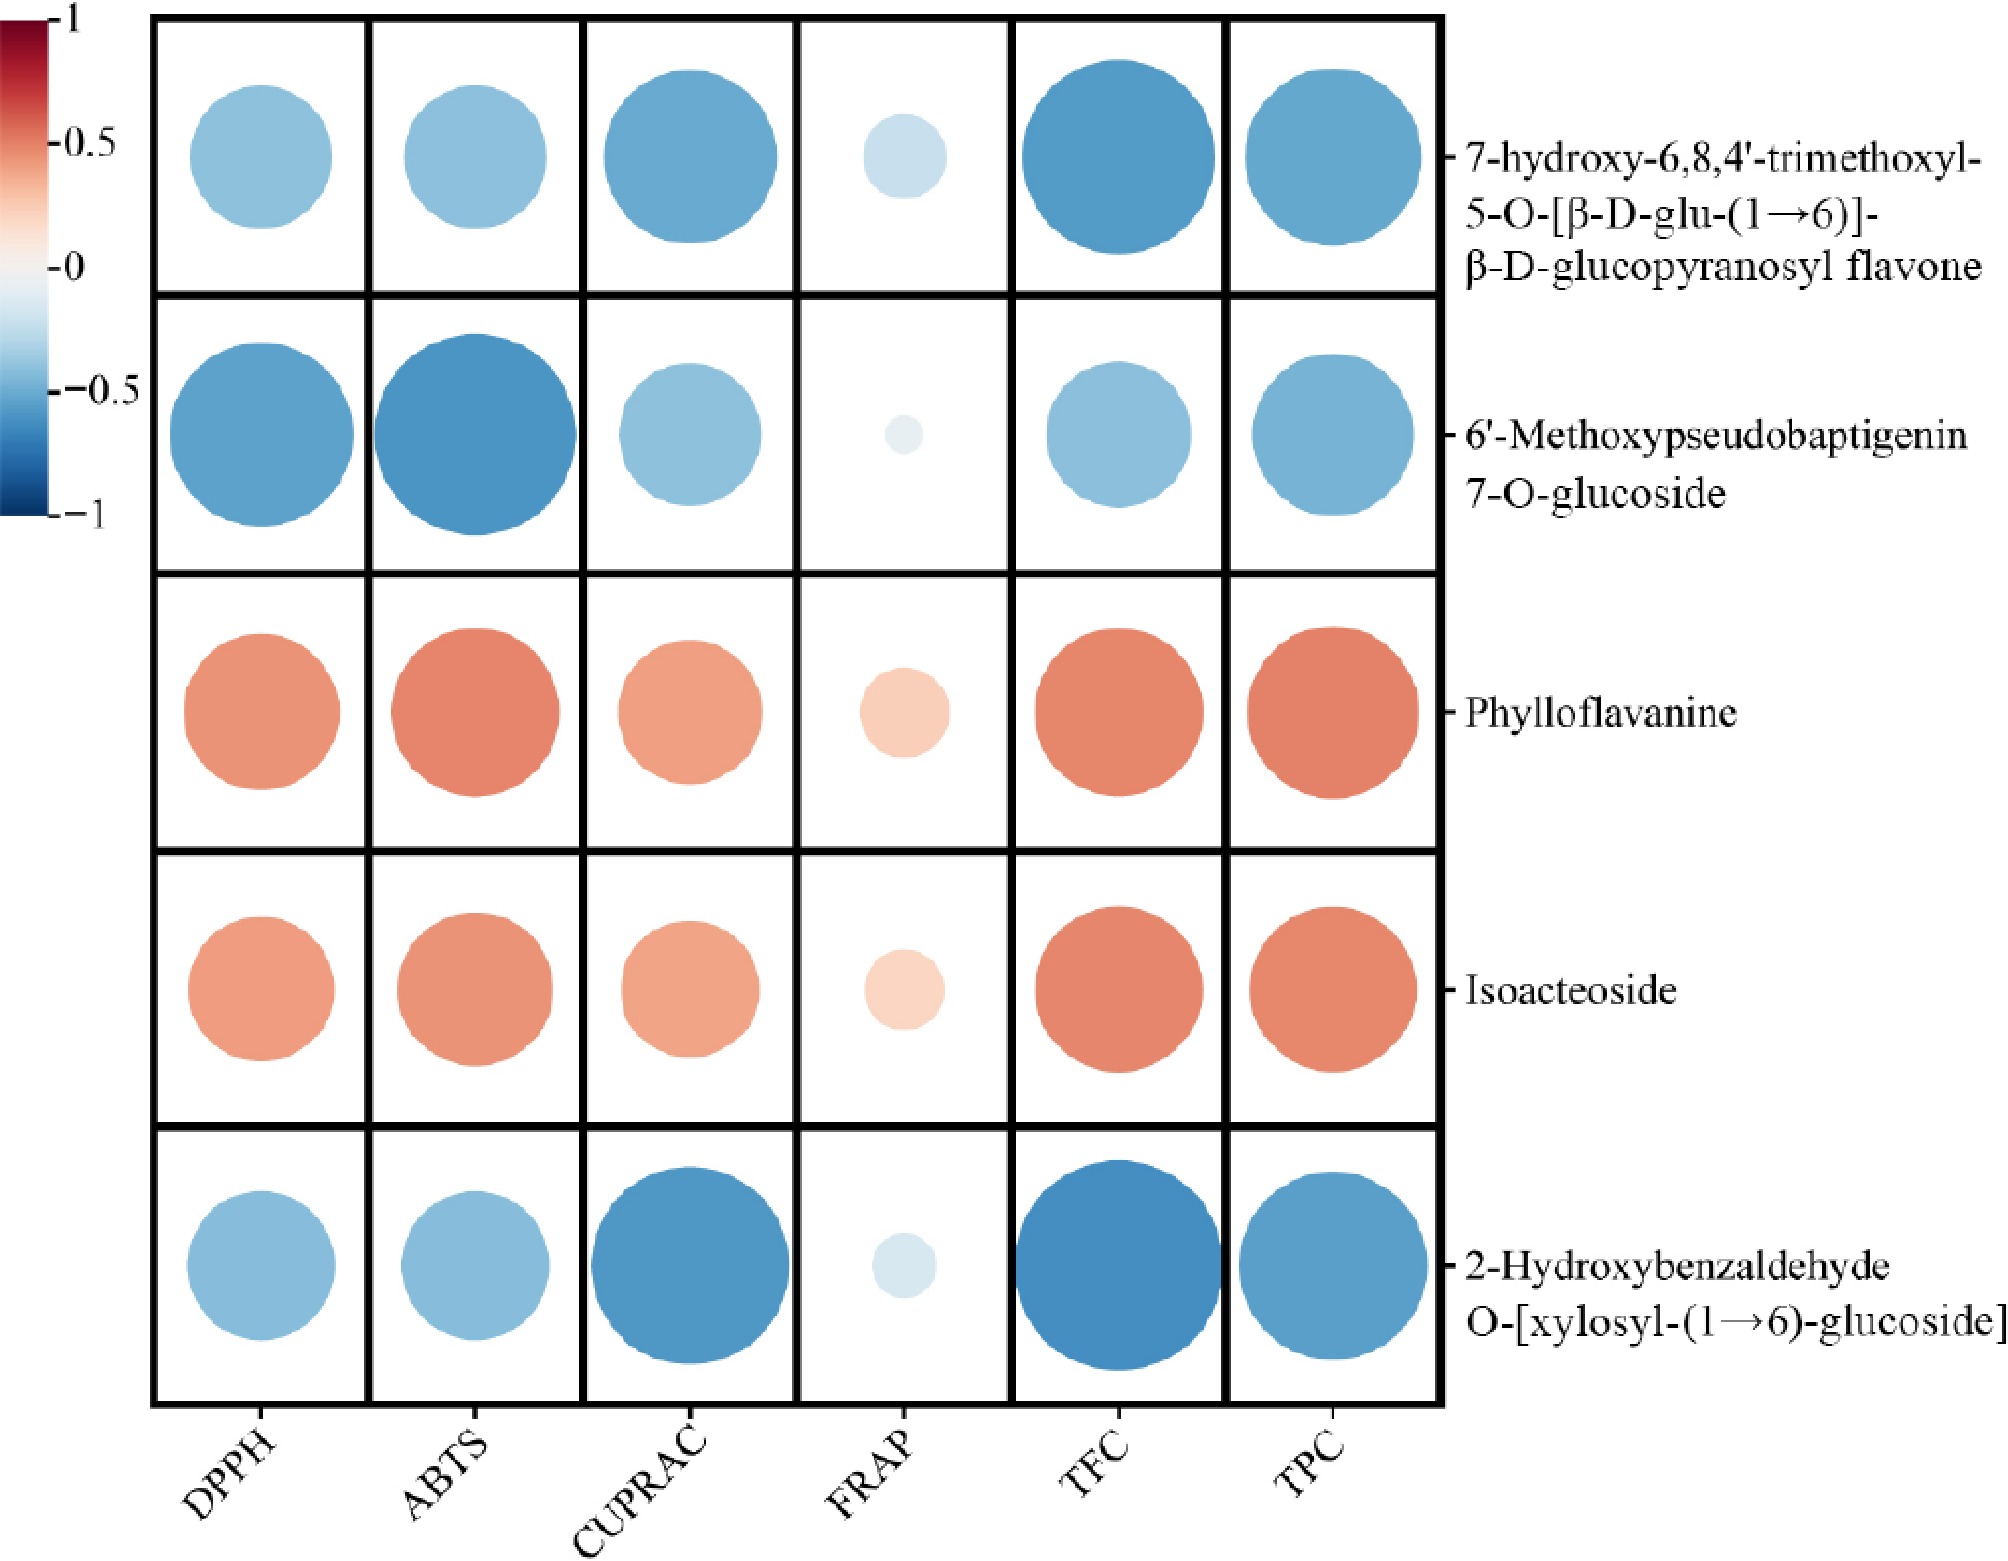
Figure 7.
Correlation analysis of metabolites with total flavonoid content (TFC), total phenolic content (TPC), and antioxidant activity in leaves of Gesneriaceae.
-
Name Membership function values D value Rank TFC TPC DPPH FRAP CUPRAC ABTS L. pauciflorus 1.00 1.00 1.00 1.00 1.00 1.00 1.00 1 P. 'Purple Sundae' 0.24 0.40 0.81 0.58 0.19 0.94 0.43 2 P. 'Spring of Beilin' 0.18 0.45 0.76 0.65 0.27 0.62 0.41 3 P. 'The Smurfs' 0.13 0.11 0.58 0.54 0.17 0.37 0.27 4 P. medica 0.14 0.27 0.49 0.00 0.19 0.48 0.22 5 P. 'Nandia Dreams' 0.08 0.21 0.25 0.36 0.09 0.38 0.20 6 P. 'Venus' 0.08 0.00 0.25 0.25 0.11 0.35 0.15 7 P. fimbrisepala 0.00 0.13 0.27 0.20 0.08 0.36 0.13 8 P. 'Four Seasons' 0.09 0.10 0.18 0.31 0.03 0.12 0.12 9 P. eburnea 0.02 0.17 0.00 0.19 0.00 0.00 0.06 10 Weight 0.25 0.15 0.07 0.16 0.24 0.12 Table 1.
Membership function values and composite evaluation values of ten Gesneriaceae taxa.
Figures
(7)
Tables
(1)