-

Figure 1.
Comparative analysis of yield and sucrose content across five different K application levels (K1–K5). (a) The log-transformed yield (kg/hm2) at varying K application levels. Data points represent the mean ± standard error (SE), lowercase letters represent significant differences indicated by different K application levels. Statistical analyses were performed using one-way ANOVA with post-hoc Tukey's test. (b) The sugarcane sucrose under the five different K application levels.
-
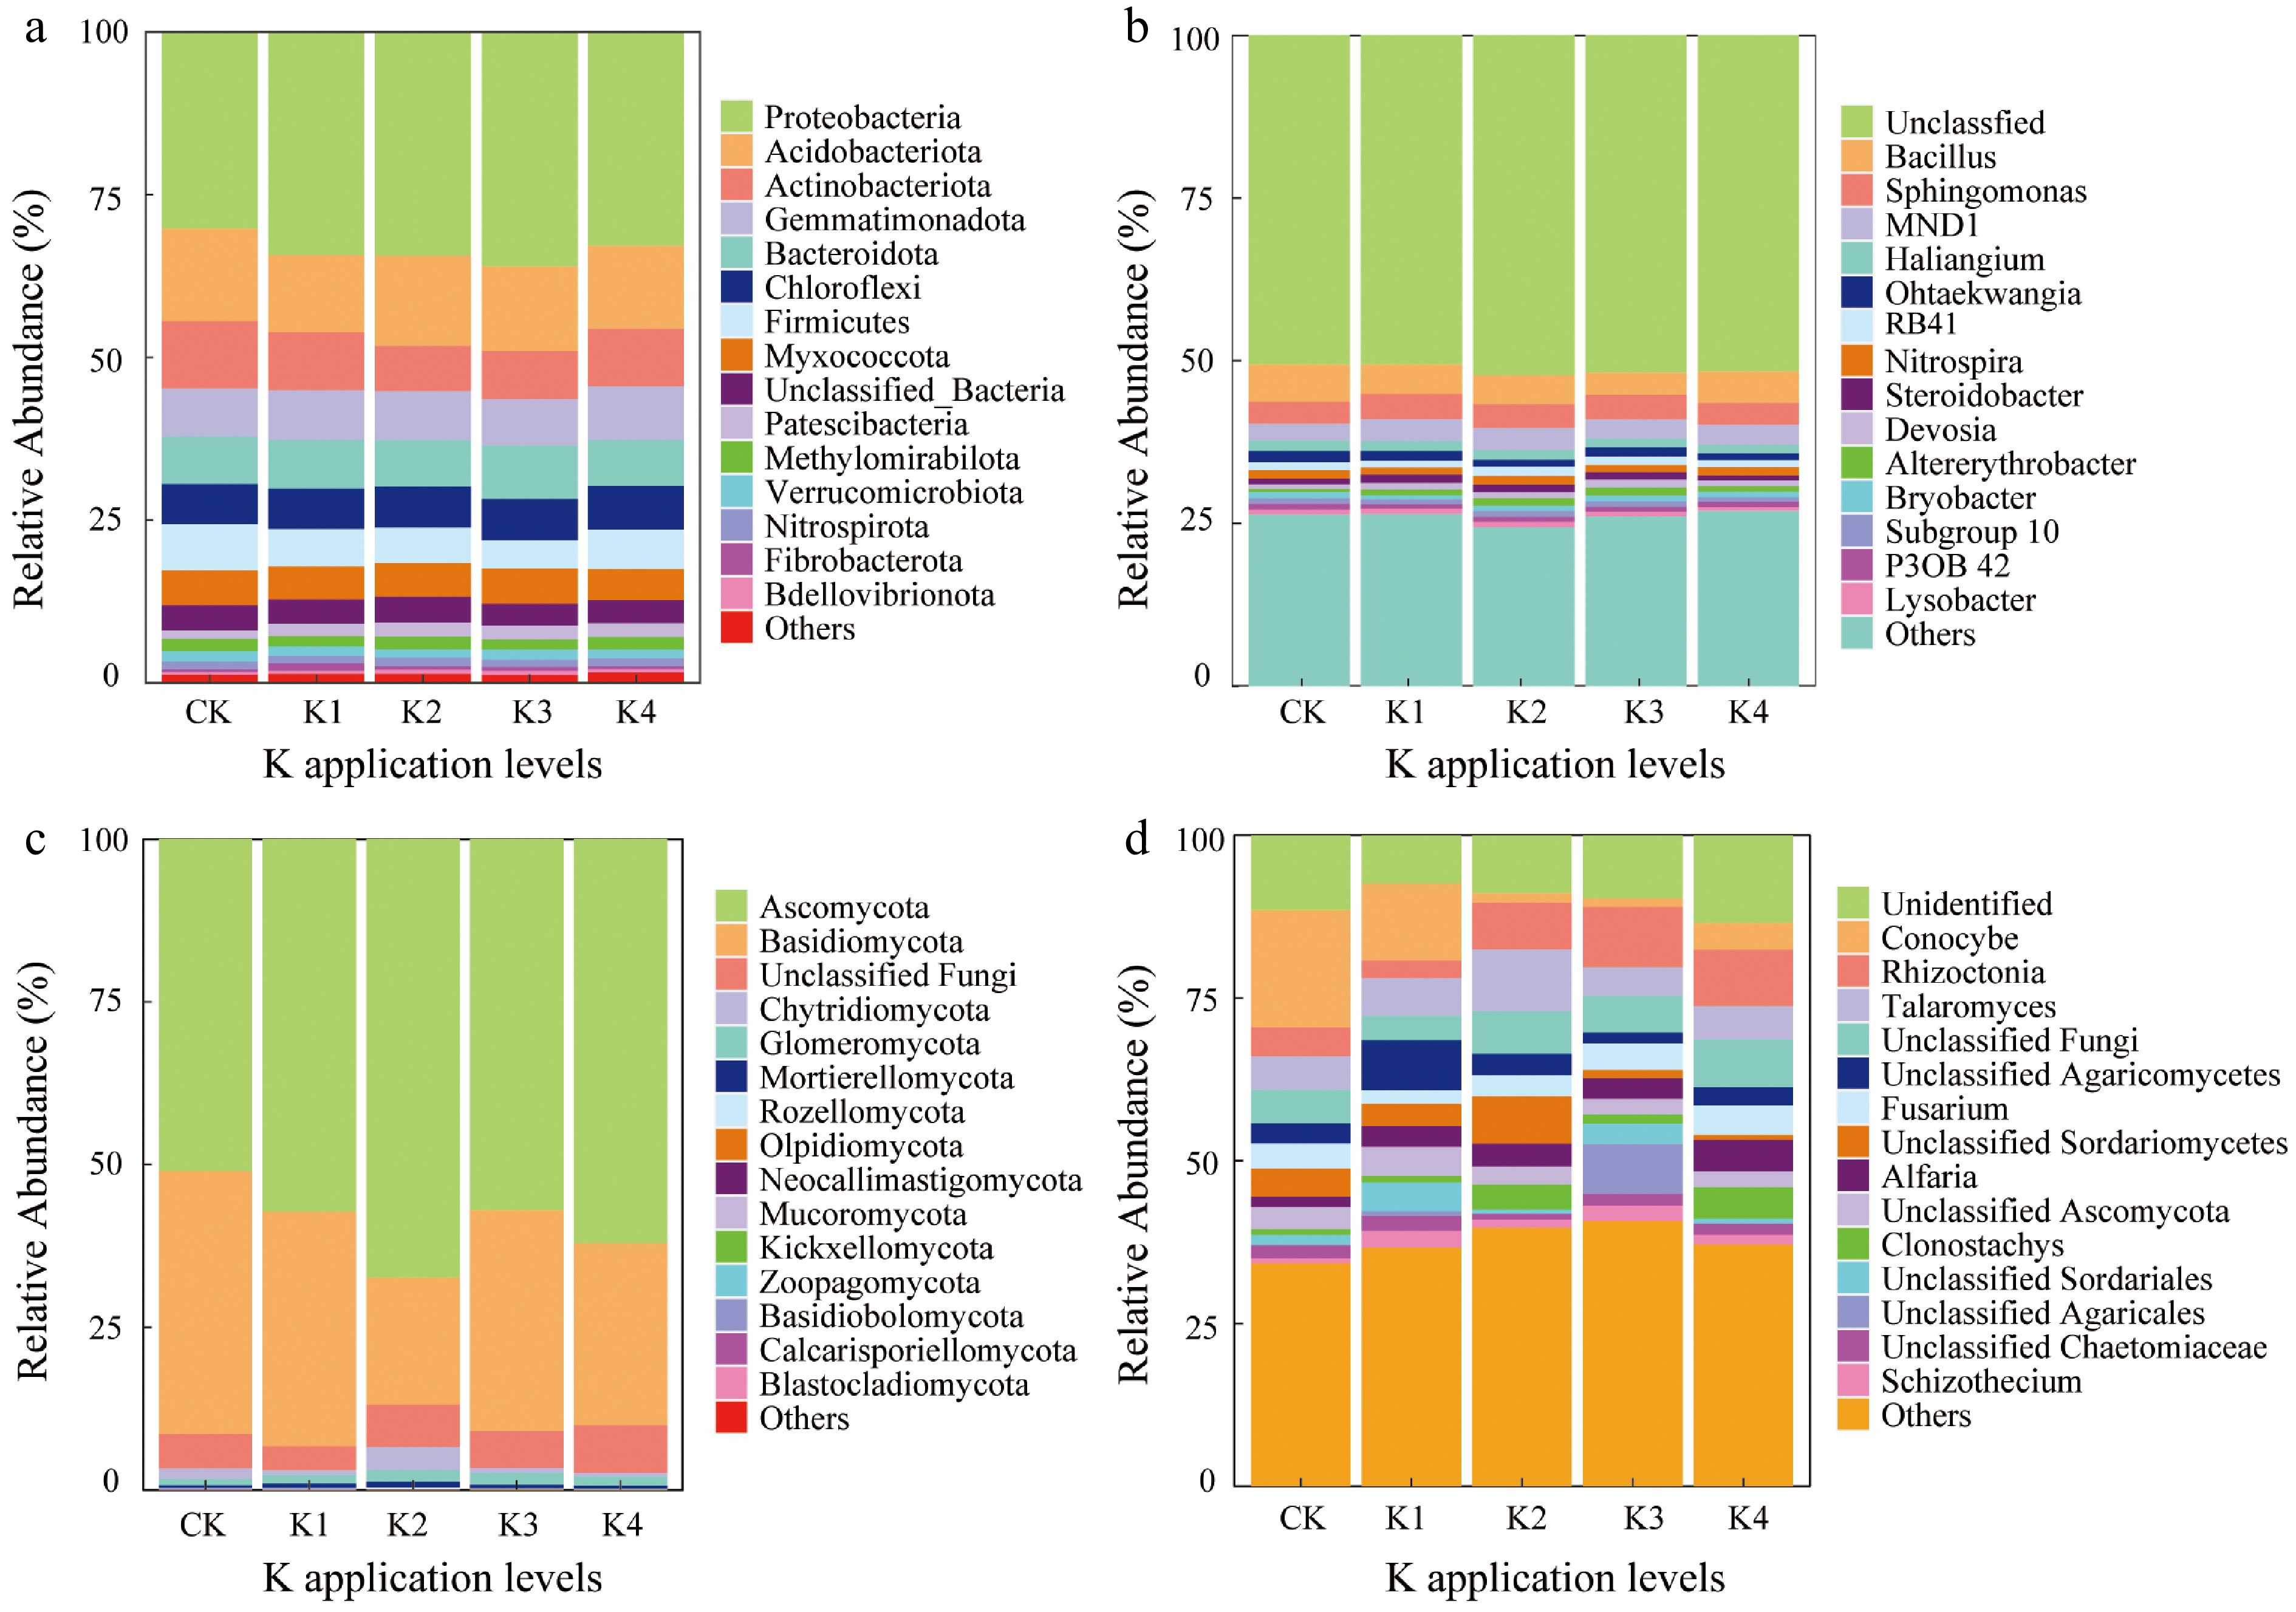
Figure 2.
Relative abundance of the top 15 microbial communities at different taxonomic levels across five different K application levels. (a), (b) Bacterial and fungal community composition at the phylum and genus level, respectively. (c), (d) Fungal community composition at the phylum and genus level, respectively. 'Others' represented the sum of low abundance taxa.
-
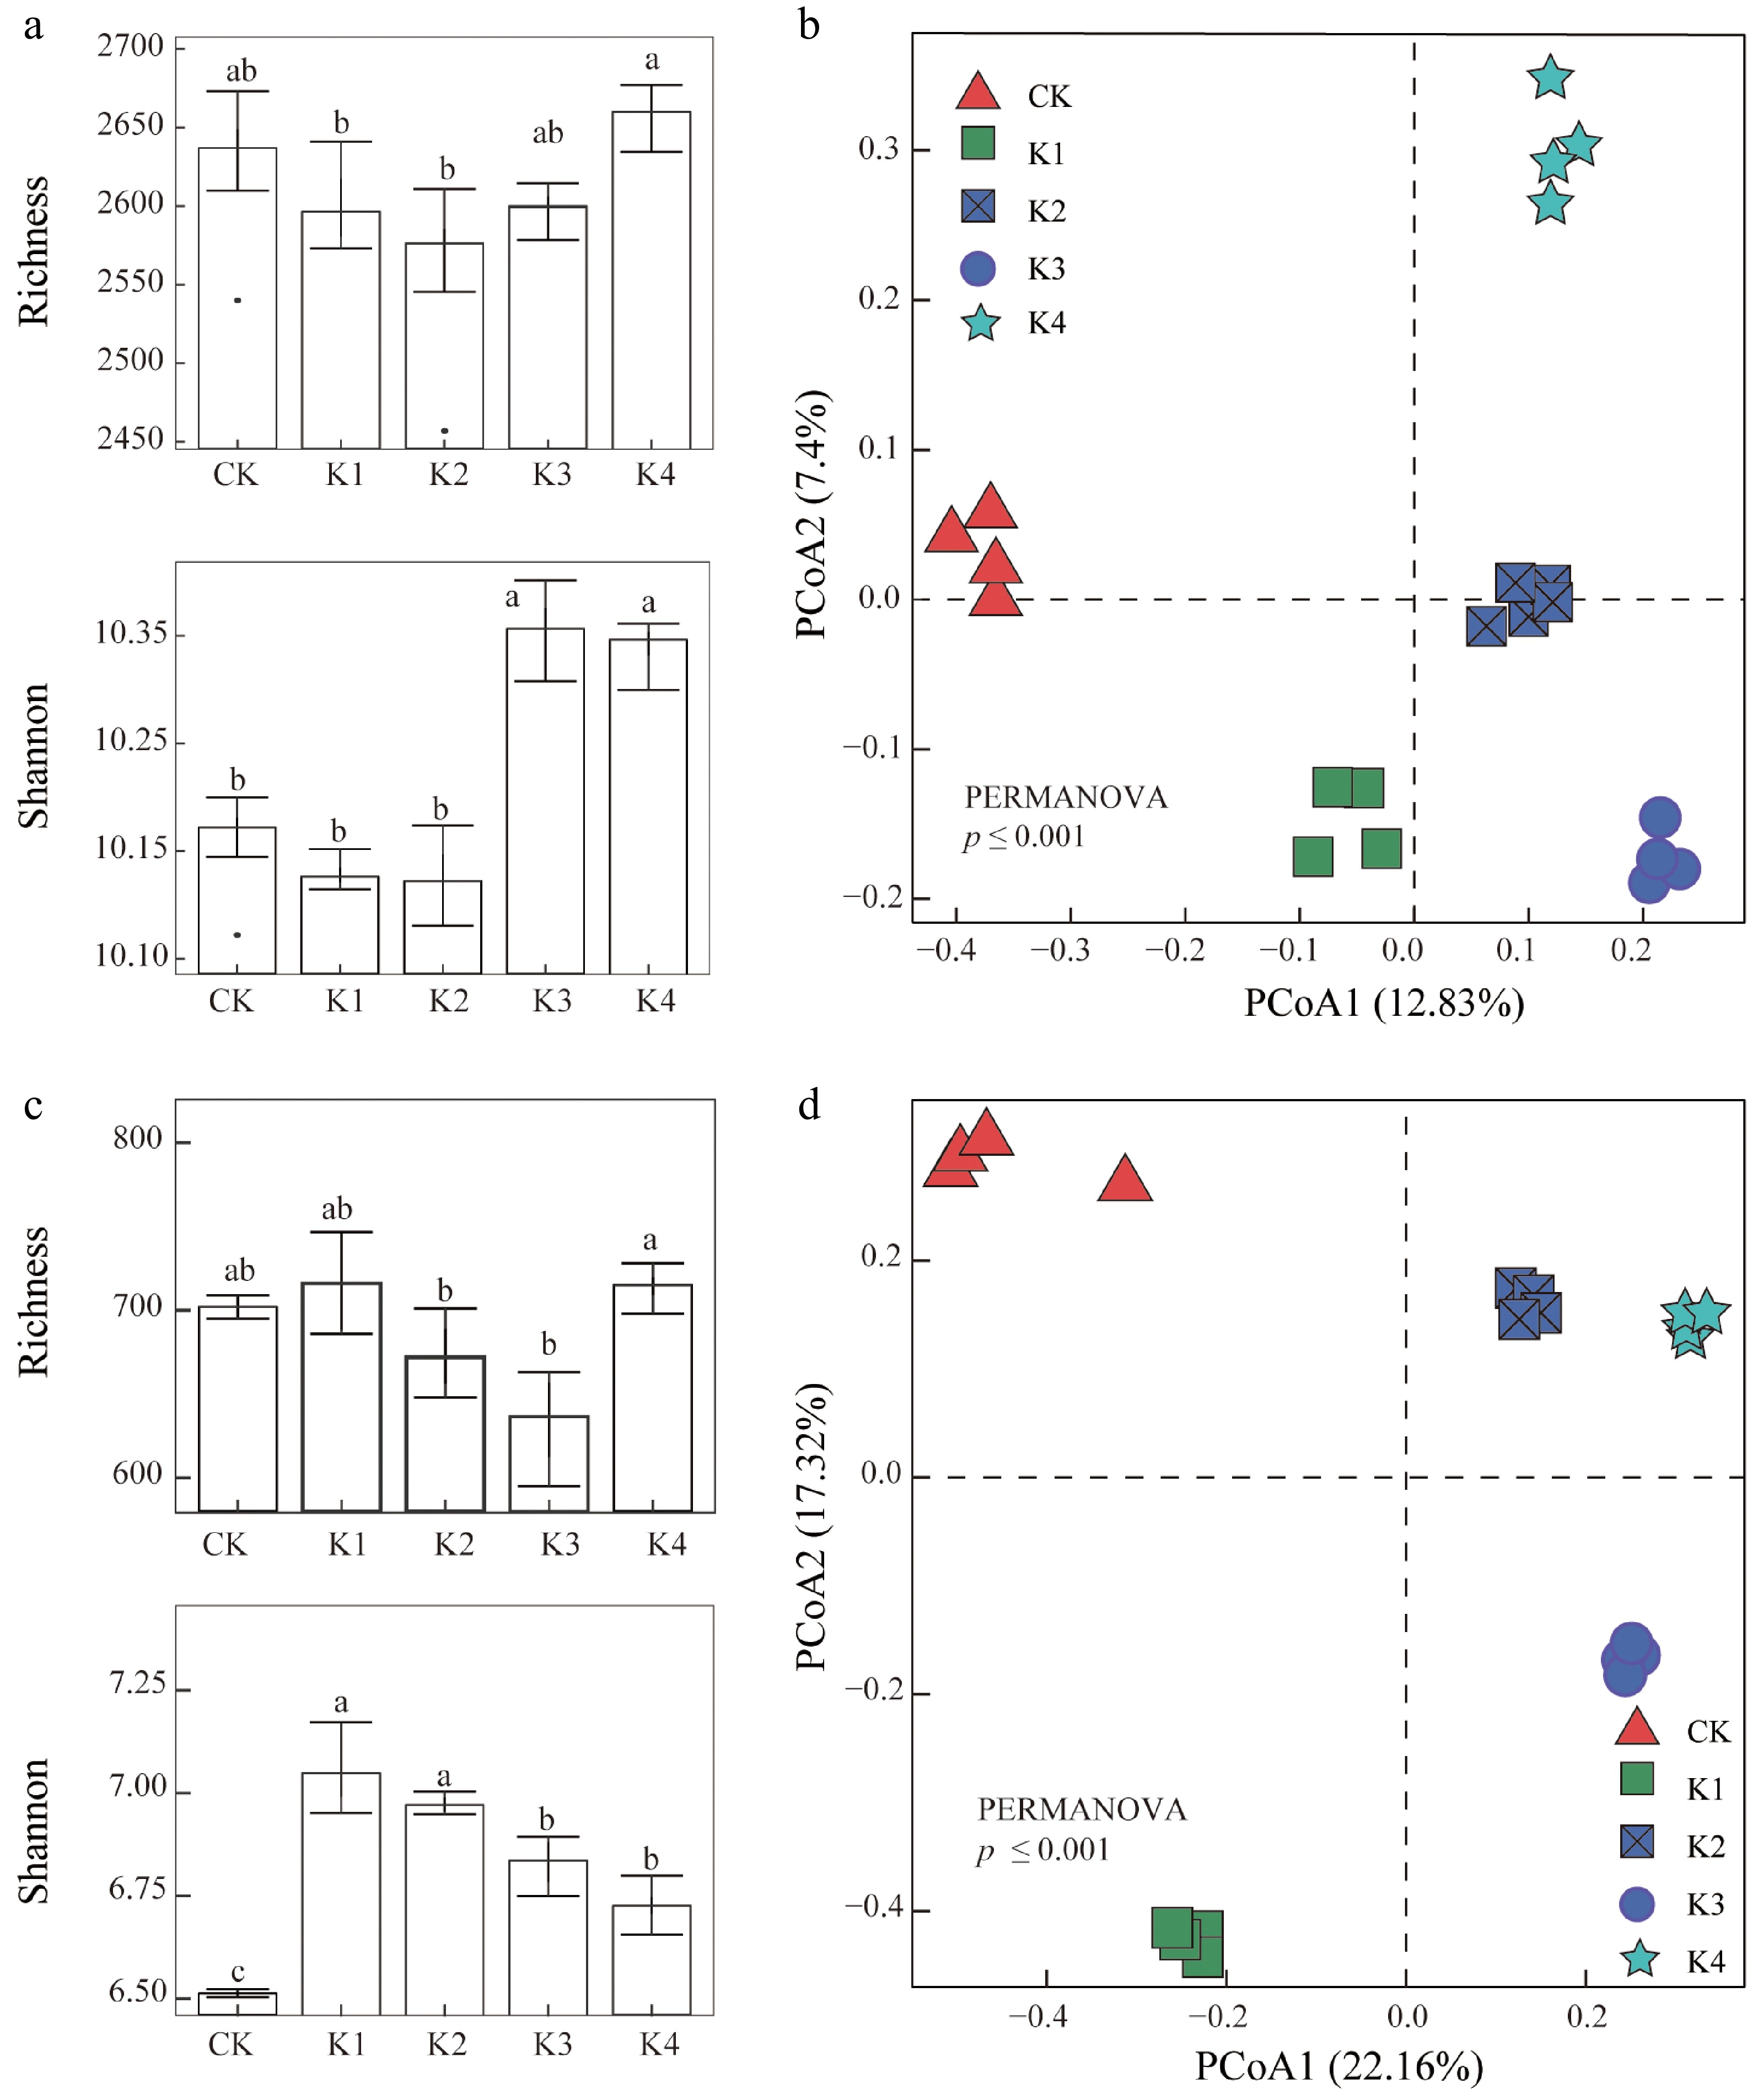
Figure 3.
The alpha and beta diversity of microbial communities across five different K application levels. (a), (b) Show bacterial richness and Shannon diversity index, with significant differences indicated by different lowercase letters (p < 0.05). (c), (d) Show fungal richness and Shannon diversity index, with similar statistical annotations. (e), (f) Display PCoA plots based on bacterial and fungal community composition using Bray-Curtis dissimilarity, with significant differences in microbial community structure identified by PERMANOVA.
-
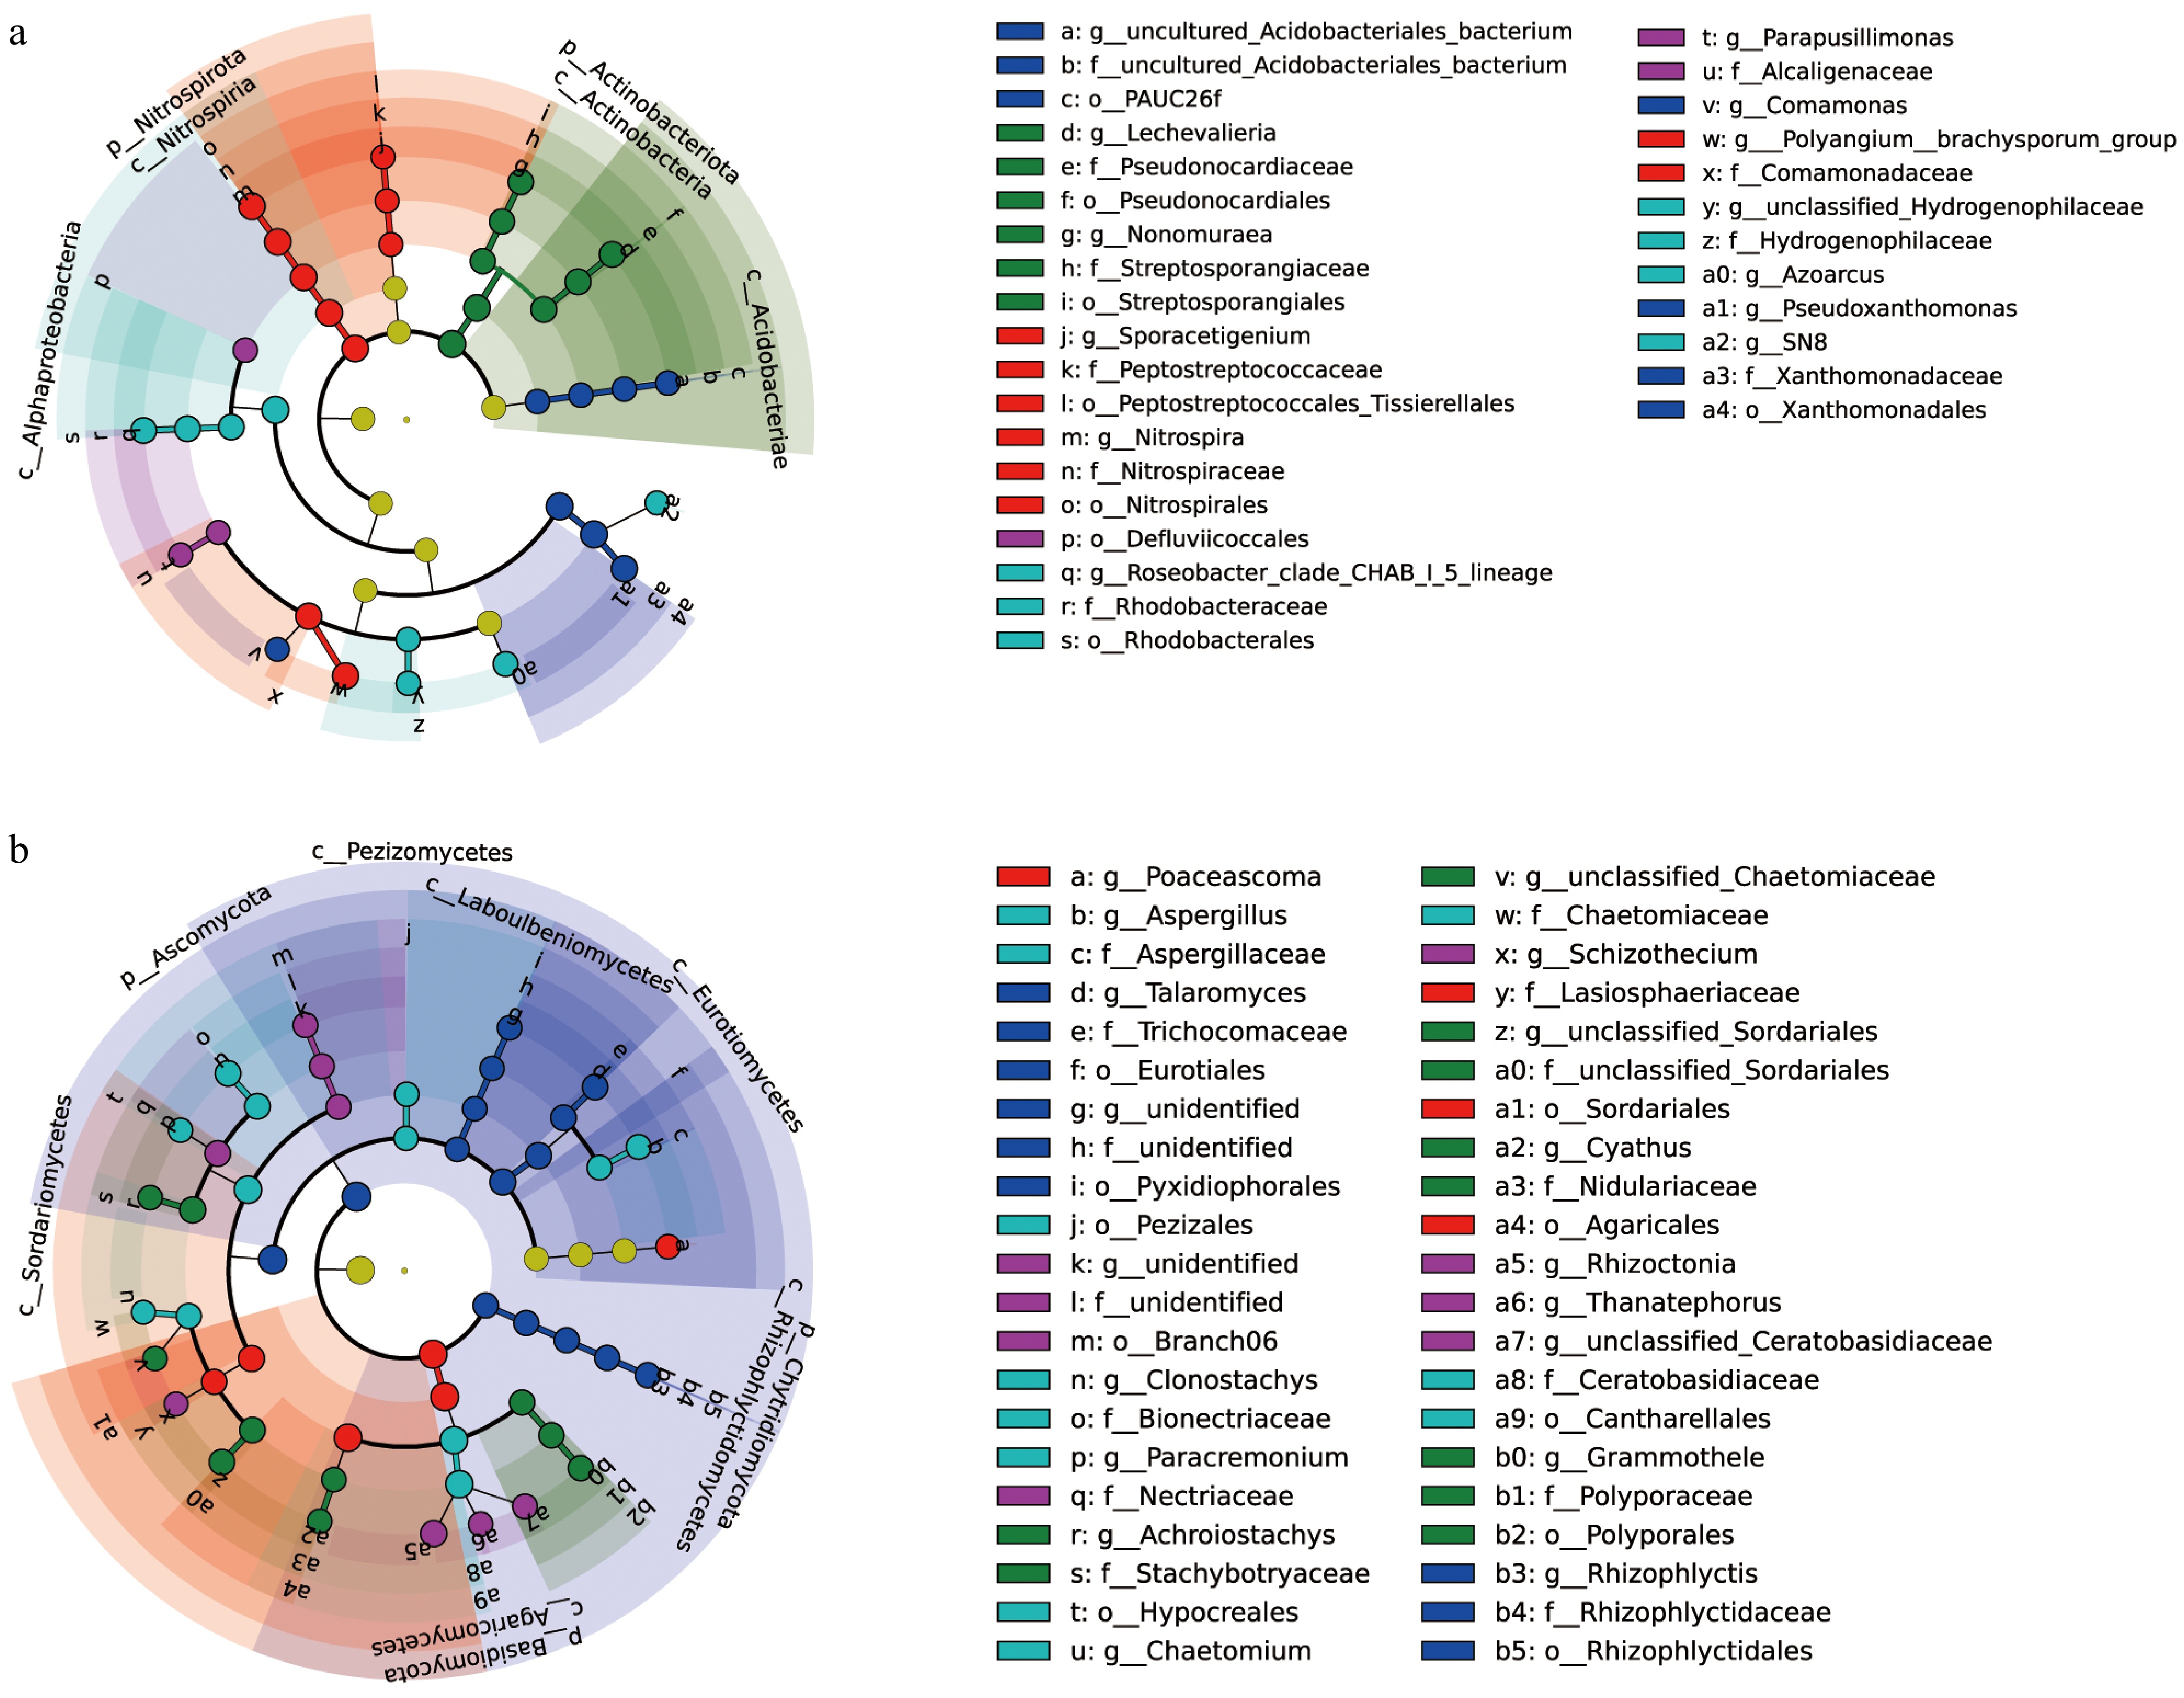
Figure 4.
LEfSe analysis of samples is shown. (a), (b) Display the LDA scores (log10) for differentially enriched bacterial and fungal taxa across five different K application levels. Higher LDA scores indicate a greater contribution to group differences. Each node represents a taxon, with node size reflecting abundance, and colors represent different bacterial/fungal phyla.
-
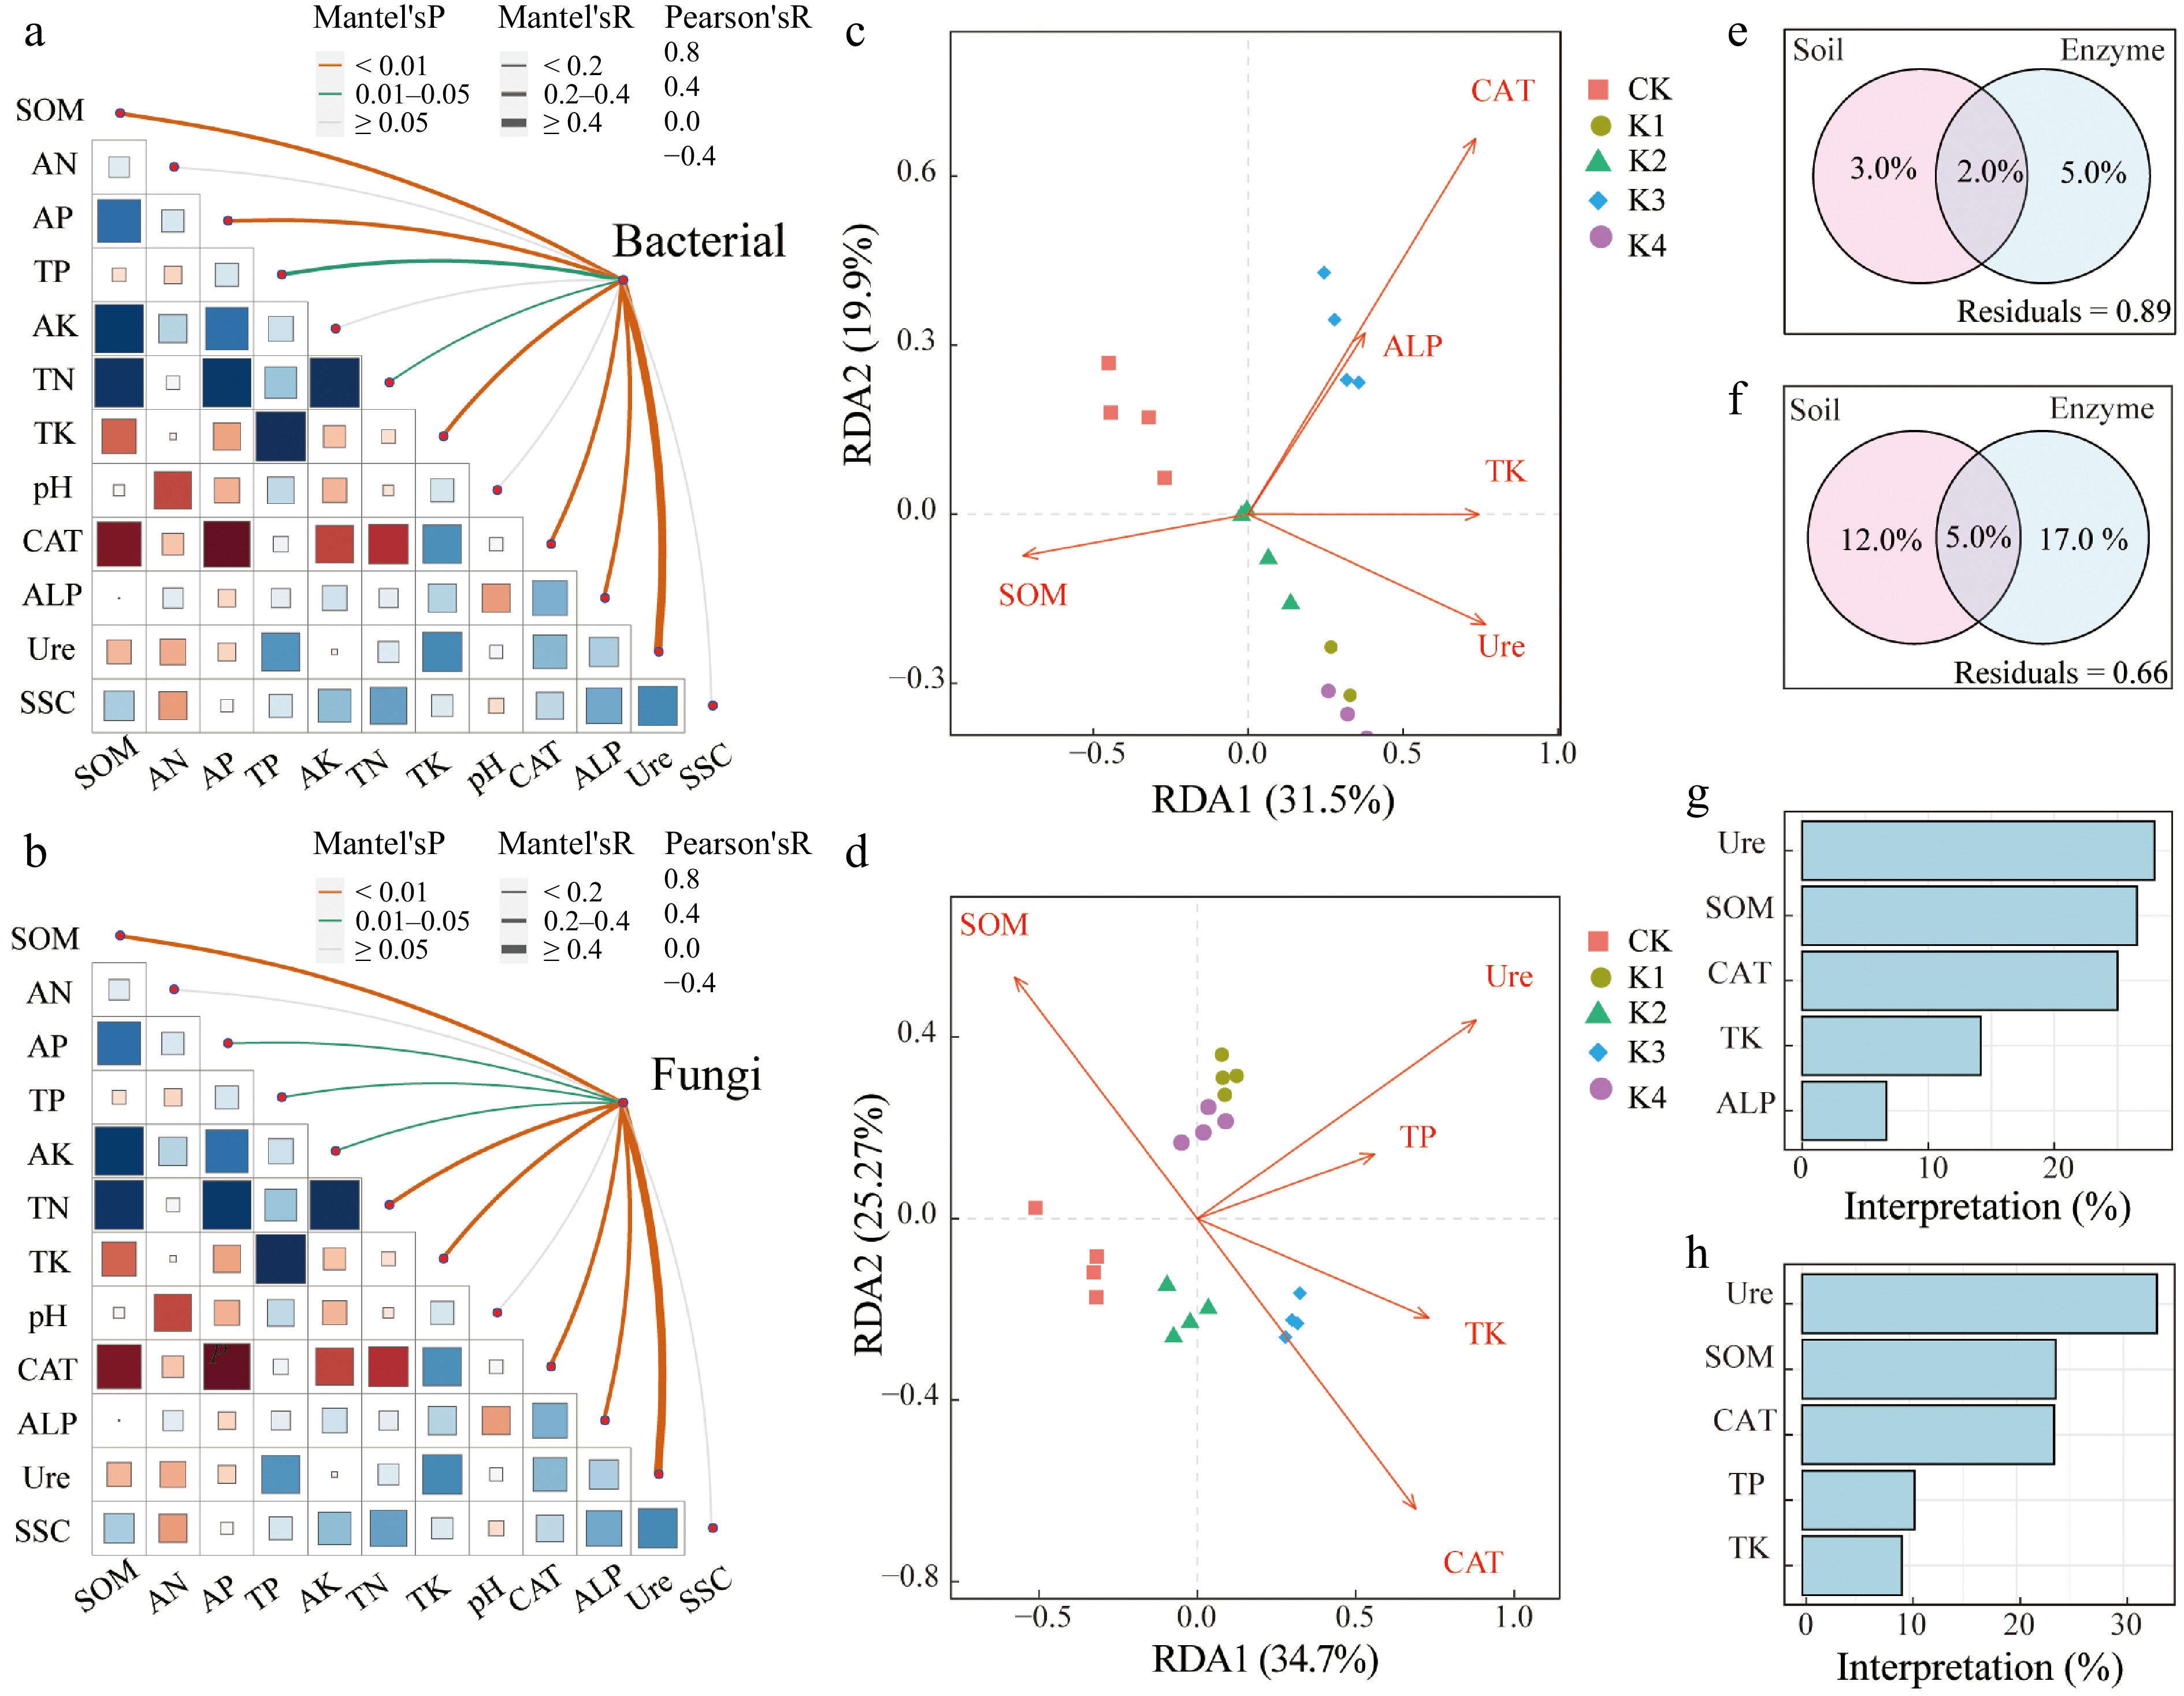
Figure 5.
Relationships between environmental factors and microbial community for bacteria and fungal. (a), (b) Show mantel testing in bacterial and fungal. (c), (d) Represent redundancy analysis (RDA) plots in bacterial and fungal communities, with significant environmental variables. (e), (g) Show variance partitioning analysis diagrams in bacterial and fungal communities. (f), (h) Show hierarchical partitioning analysis in bacterial and fungal communities.
-
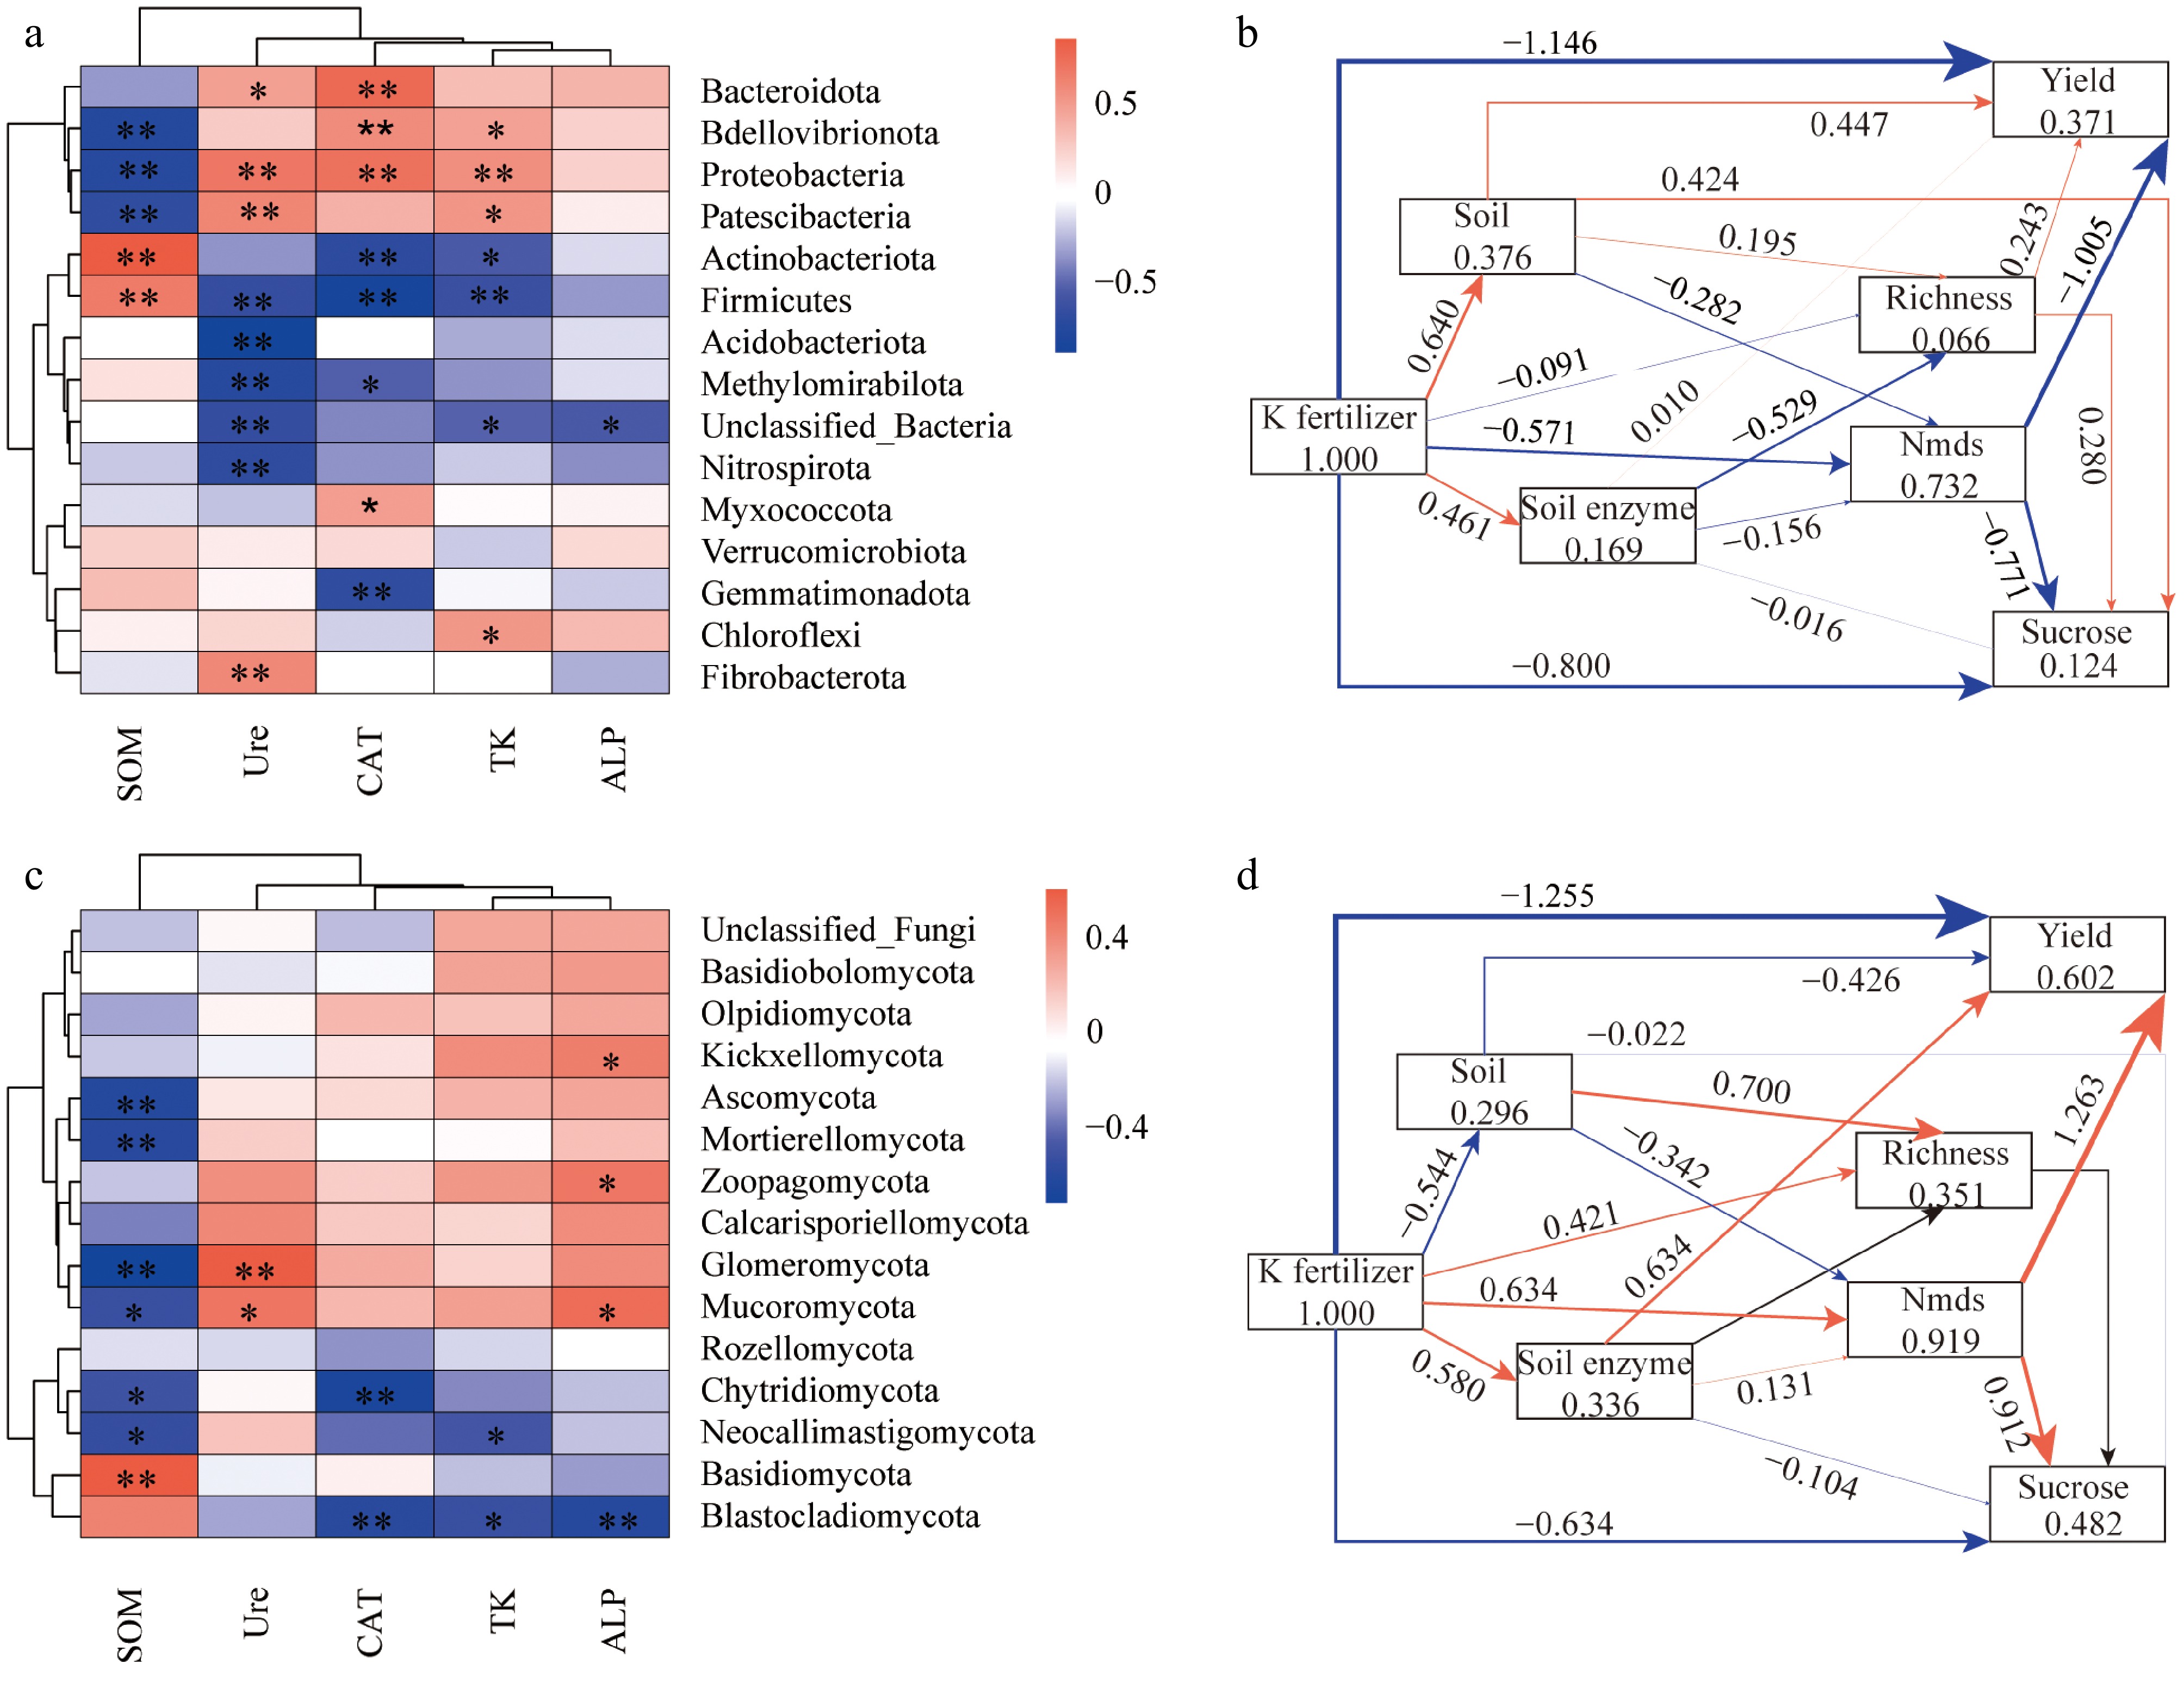
Figure 6.
Relationships between microbial taxa with environmental factors. (a), (b) Heatmaps display correlations between bacterial and fungal phyla with environmental factors. The color intensity indicates correlation strength, with red for positive and blue for negative correlations. Significant correlations are marked with *p < 0.05 and **p < 0.01. (c), (d) Show Partial Least Squares Path Modeling (PLS-PM) illustrating soil properties, microbial richness, and enzymatic activities impact on yield. Arrows indicate significant pathways, with thickness representing relationship strength, and direct/indirect effects on yield are shown in red and blue.
Figures
(6)
Tables
(0)