-
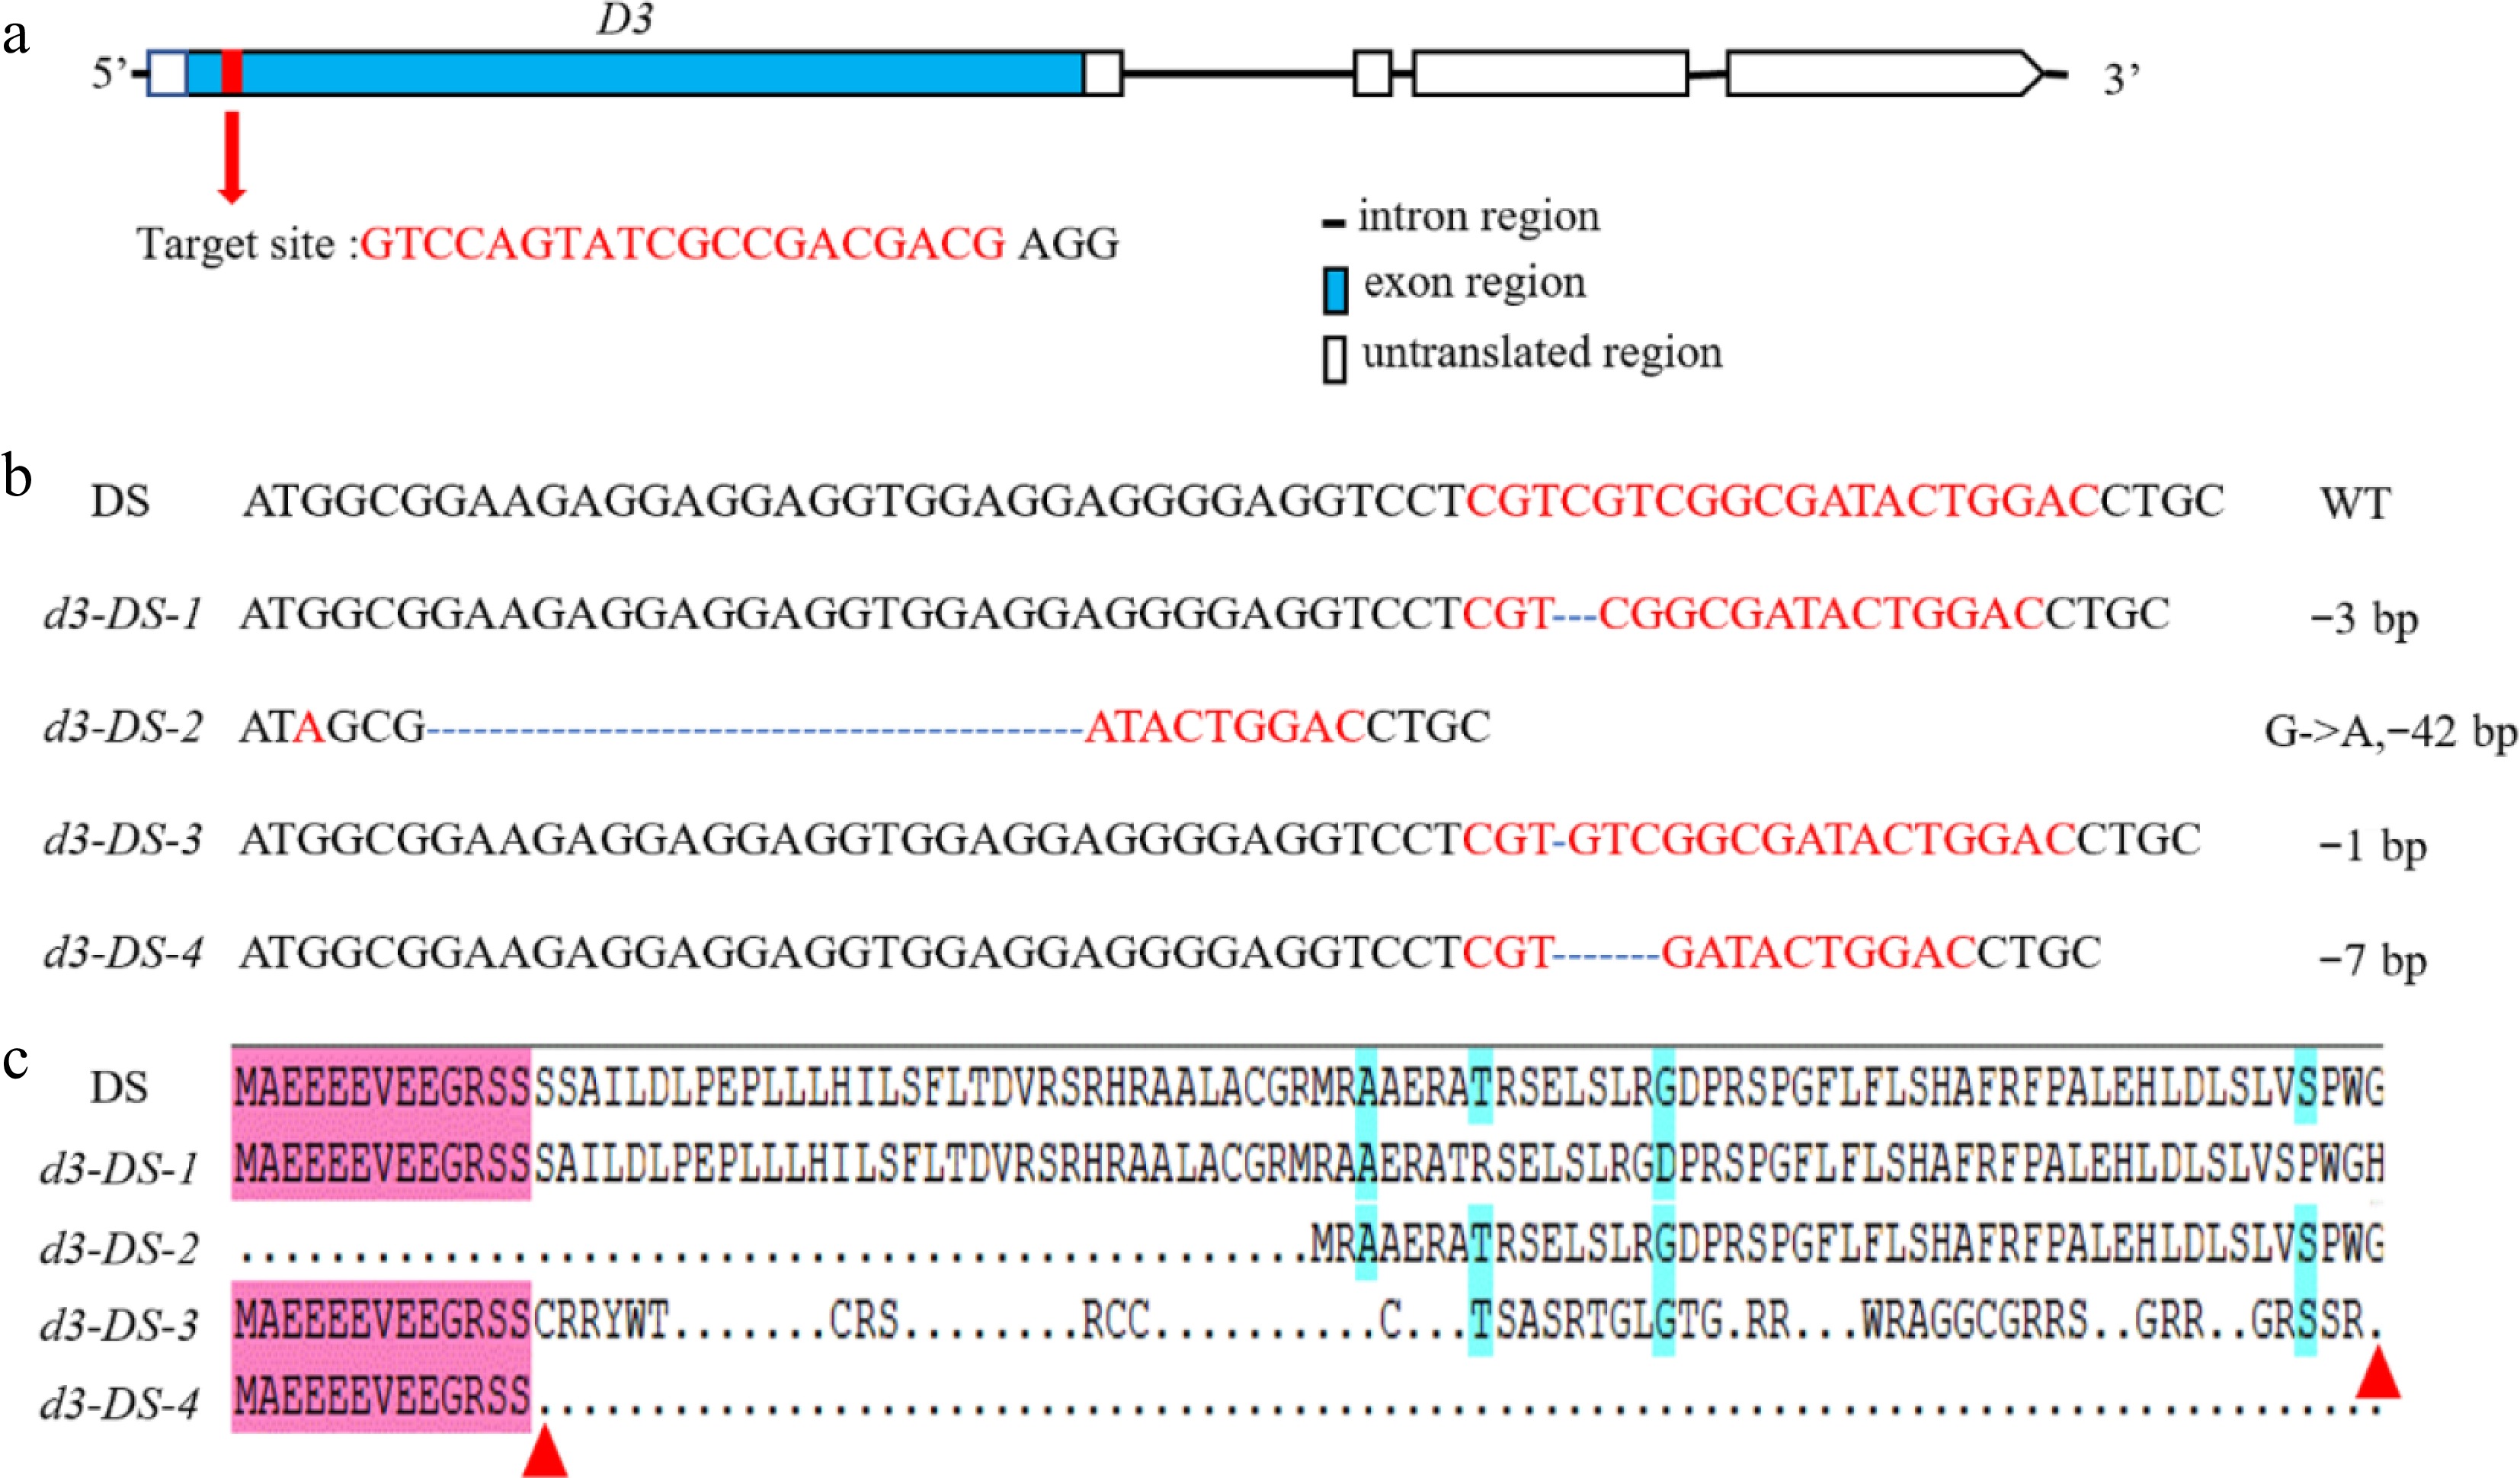
Figure 1.
Loss-of-function mutations of D3 by CRISPR/Cas9. (a) The gene structure of D3 and the location of the target site. Introns are represented by straight lines, exons are represented by blue boxes, untranslated regions are shown as white boxes, and the target site is marked with a red box. (b) Sequence alignment illustrating mutations of four types of d3 mutants. '-' indicates deletion, and numbers indicate nucleotides. (c) Amino acid sequence alignment using DNAMAN. The red triangle indicates the termination site.
-
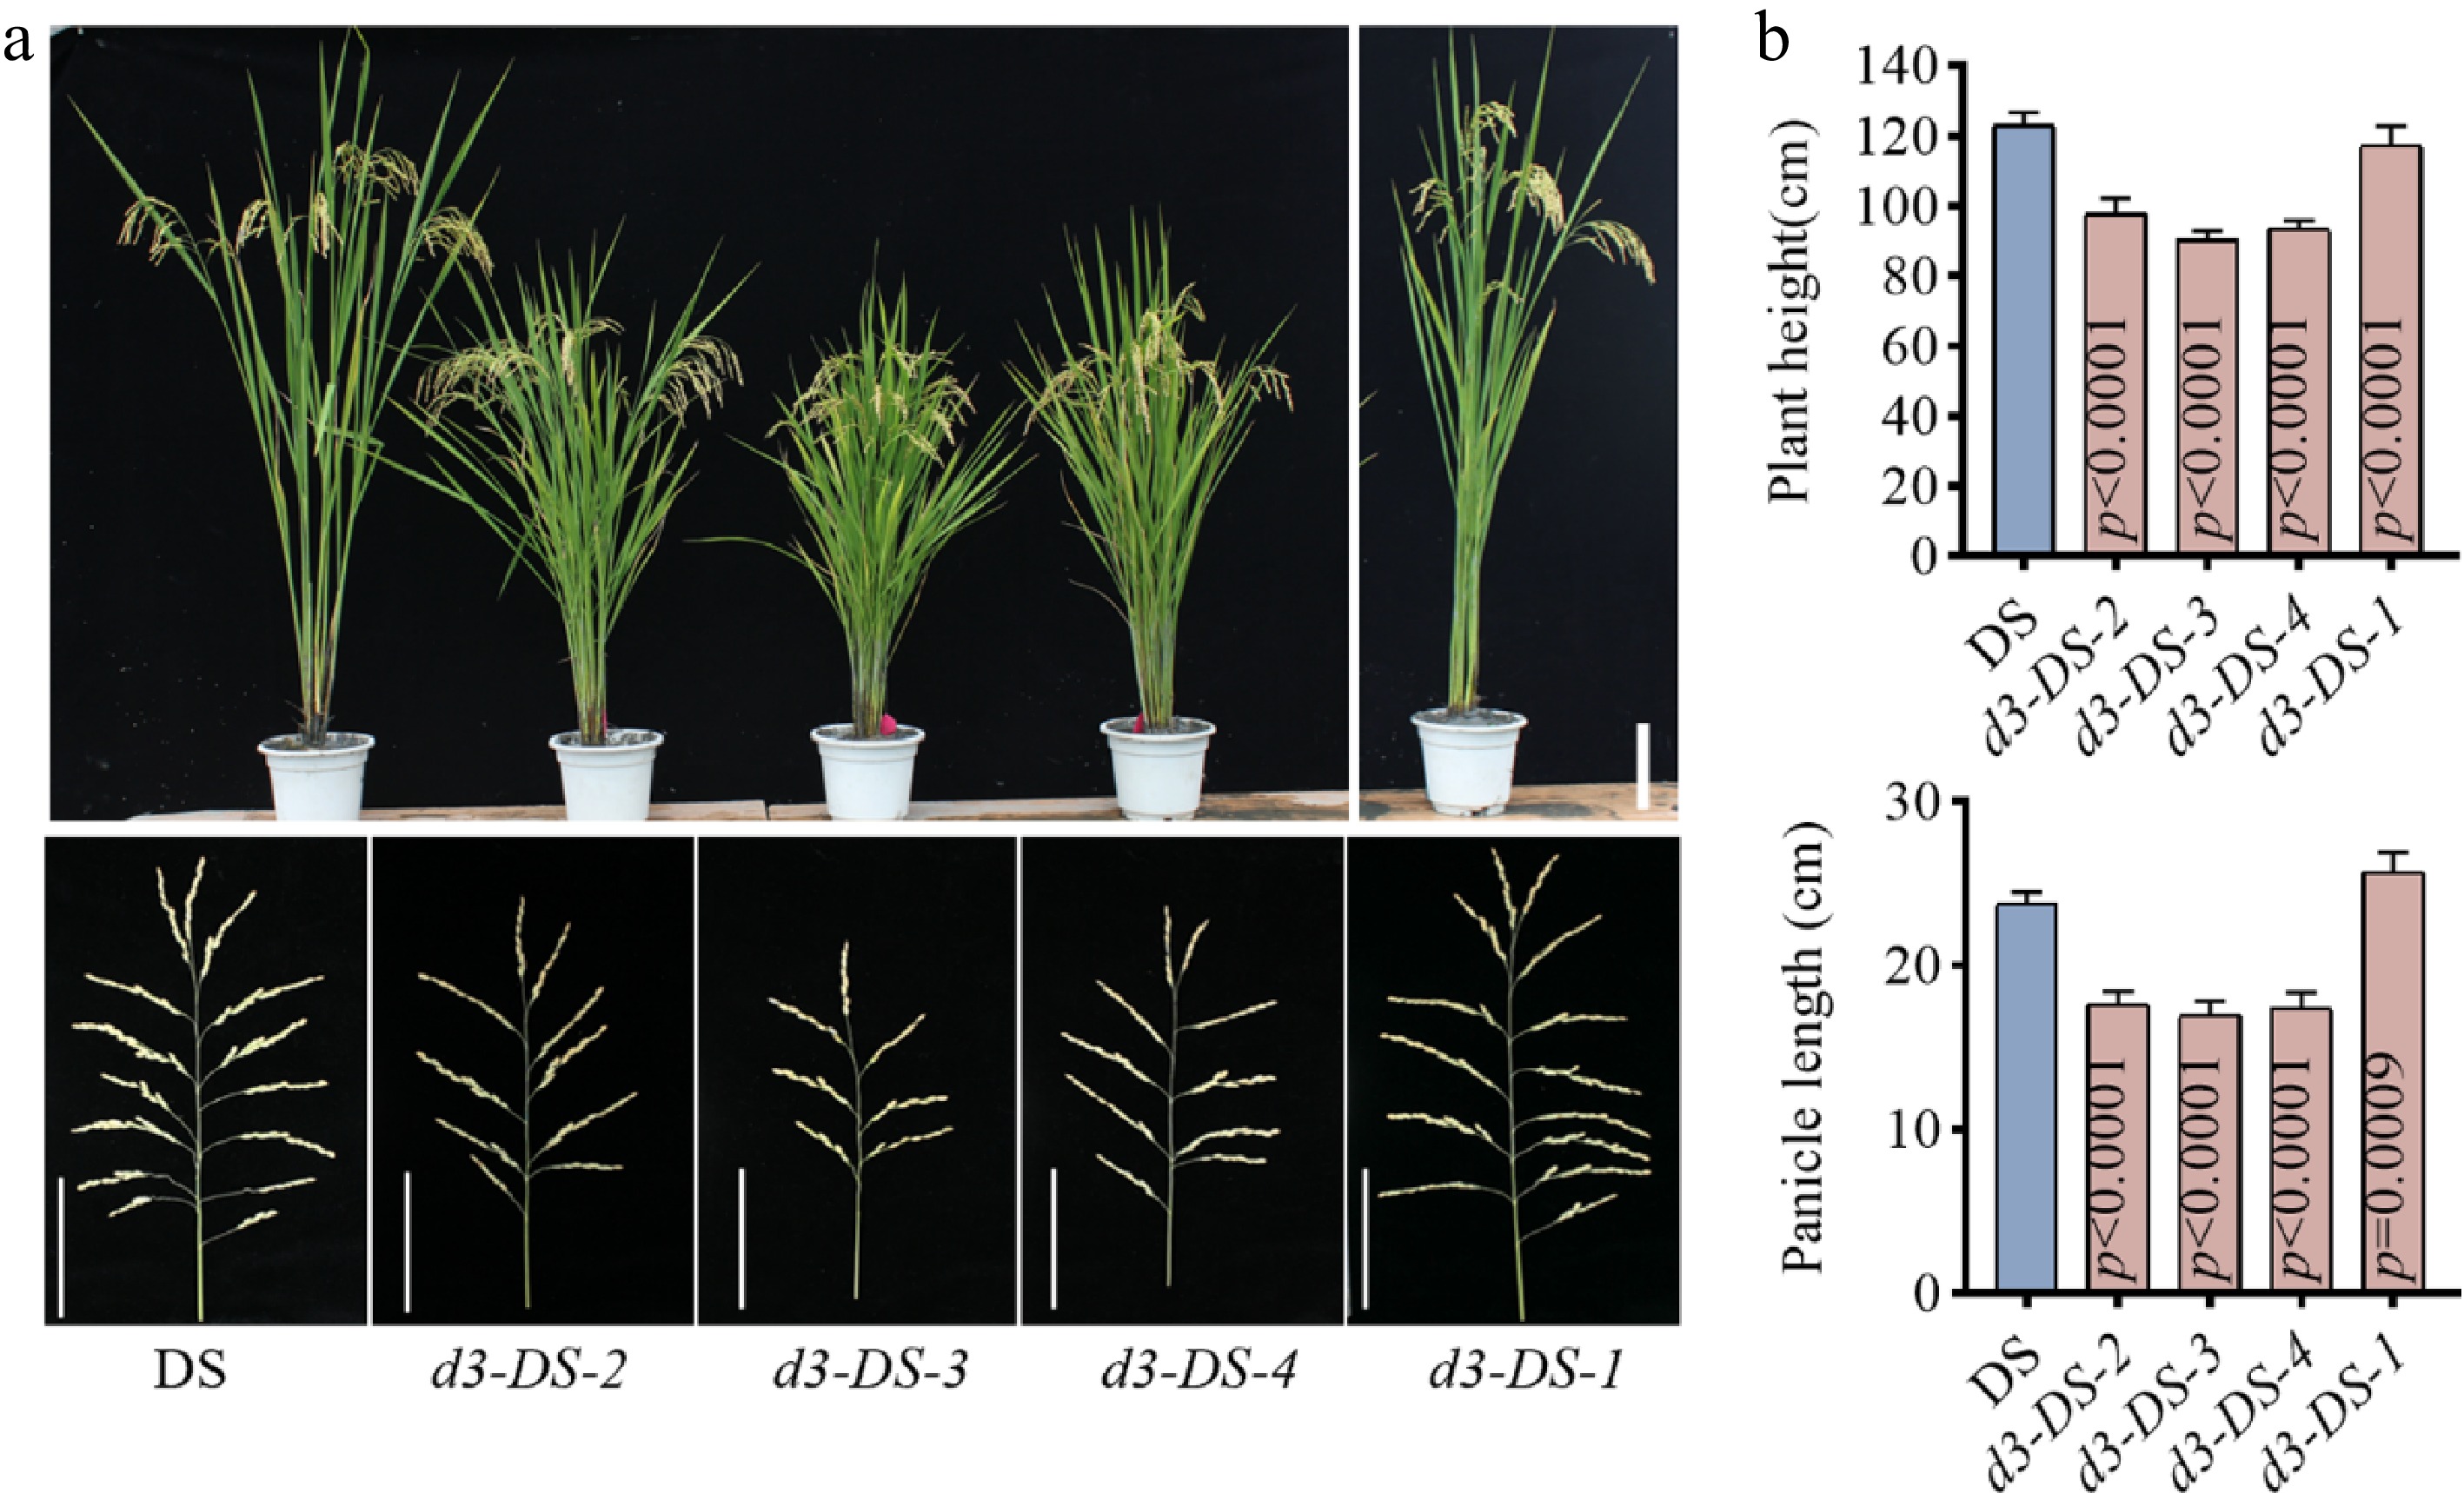
Figure 2.
Phenotypes of d3 mutants. (a) The upper and lower parts of the figure are the plant morphology and panicle morphology of the T2 generation d3 mutants and the wild type DS, respectively. The upper scale bar represents 15 cm, while the lower scale denotes 9 cm. (b) Plant height and panicle length. All P values were determined by unpaired Student's t-test, compared to DS.
-
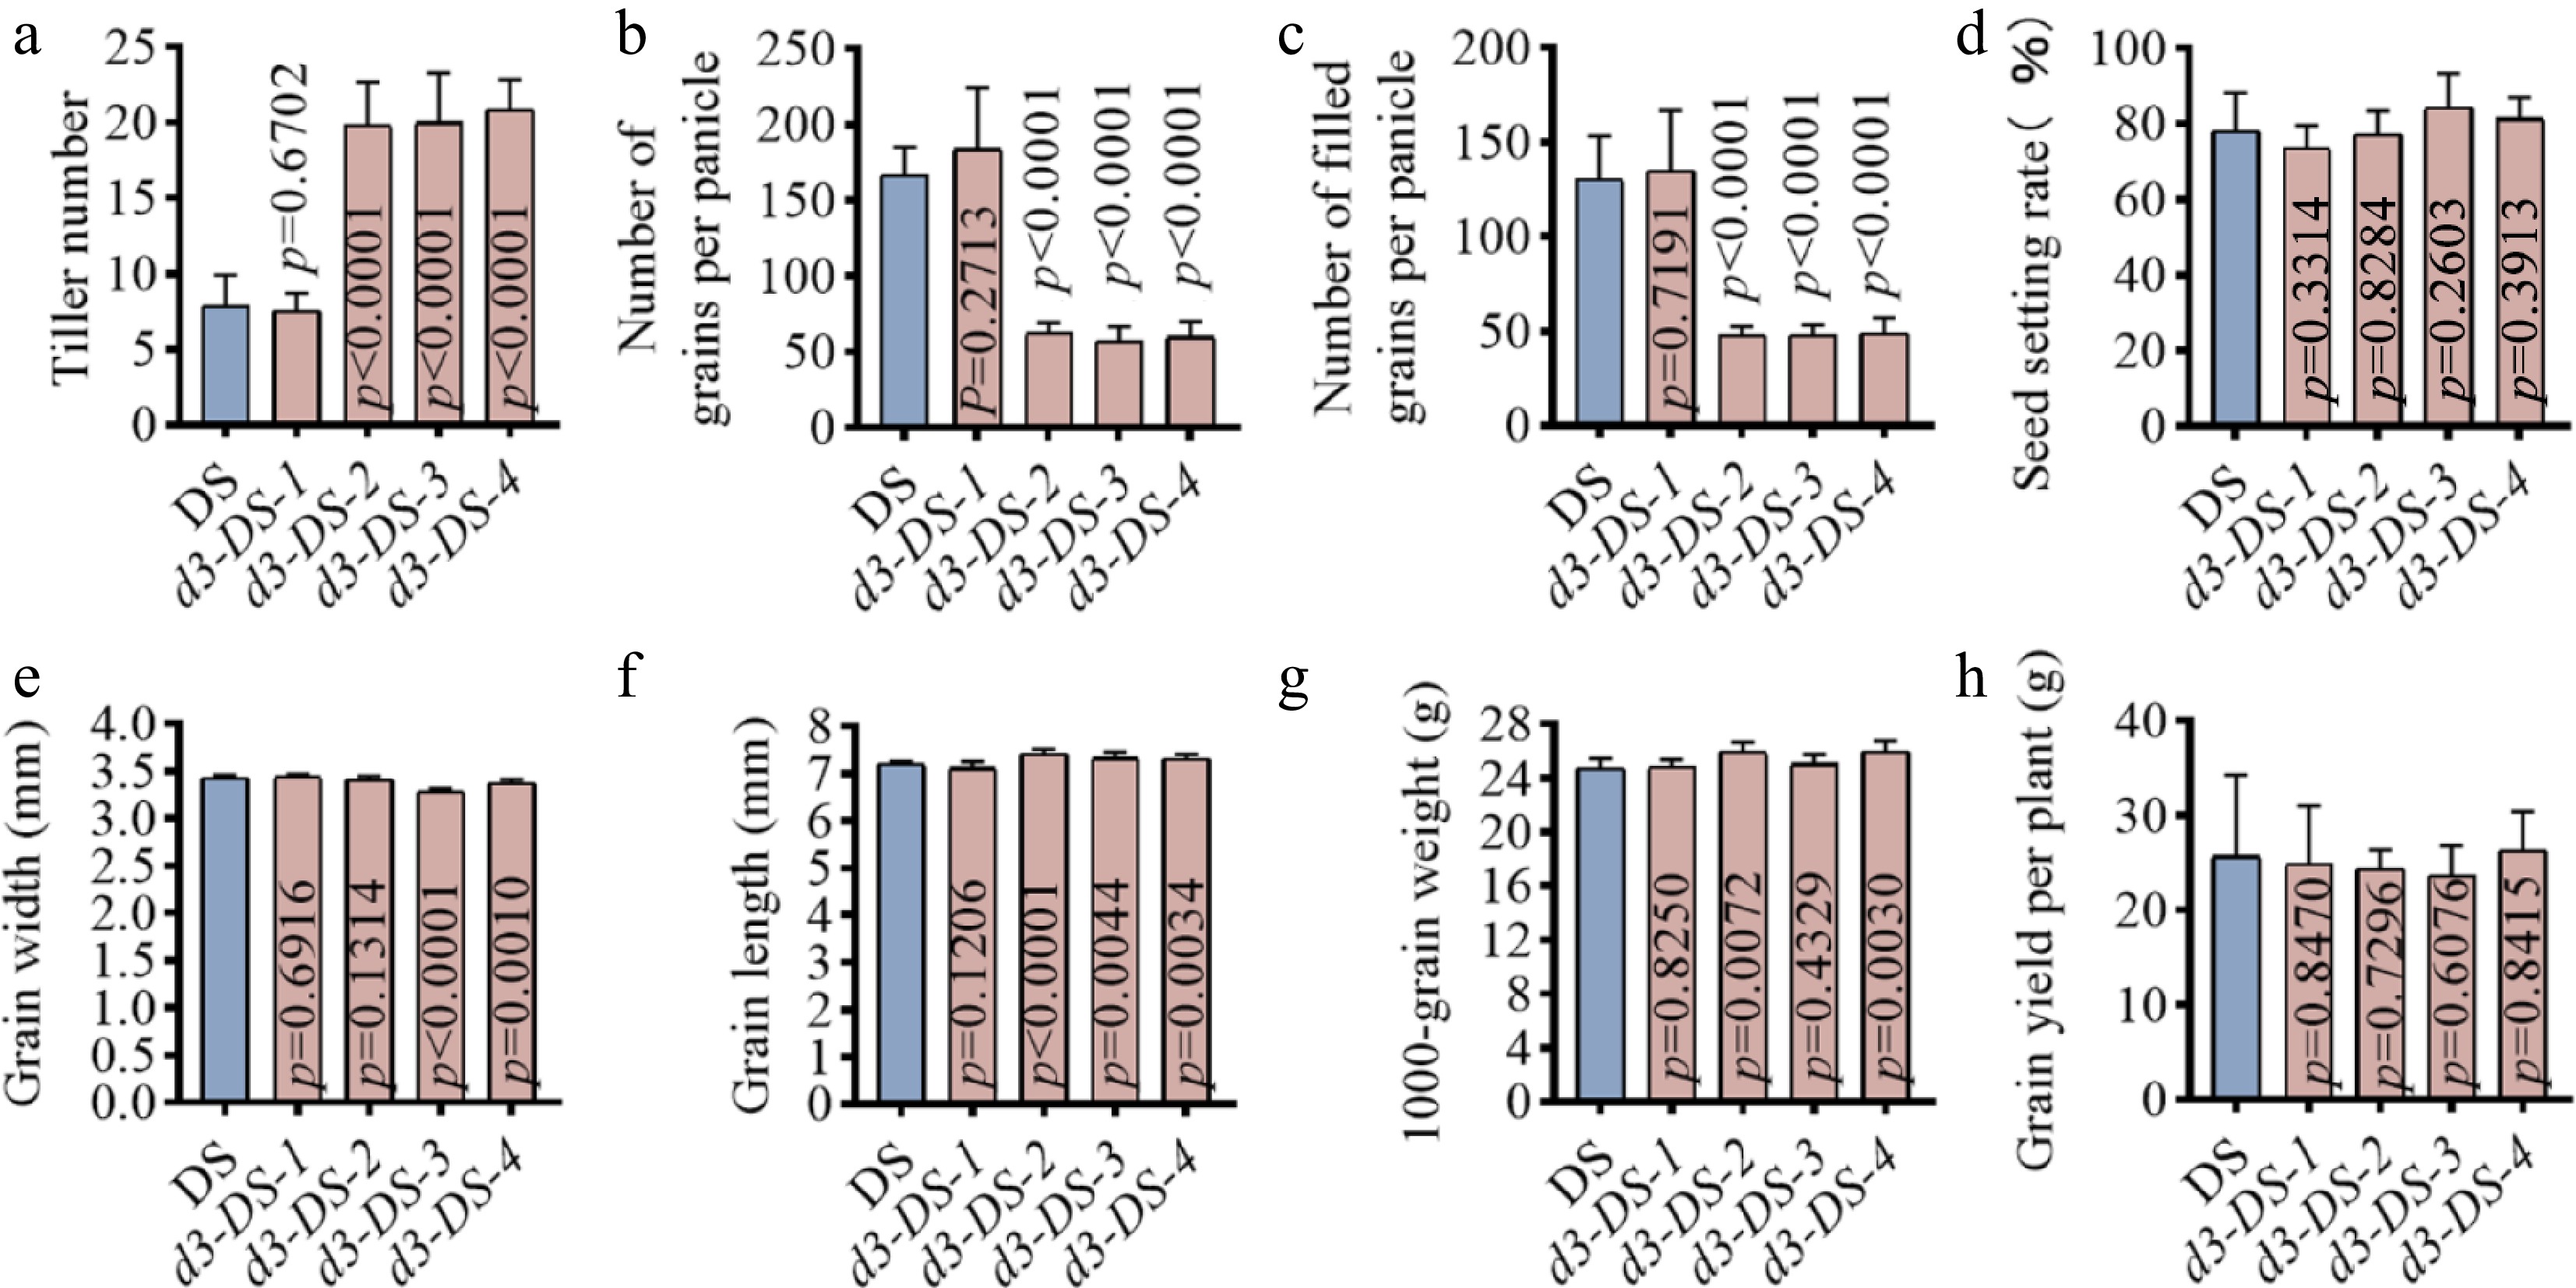
Figure 3.
Yield traits of d3 mutants. Major yield traits were measured at rice maturing stages. (a) Tiller number. (b) Number of grains per panicle. (c) Number of filled grains per panicle. (d) Seed setting rate. (e) Grain width. (f) Grain length. (g) 1,000-grain weight. (h) Grain yield per plant. All p values were determined by unpaired Student's t-test, compared to DS.
-
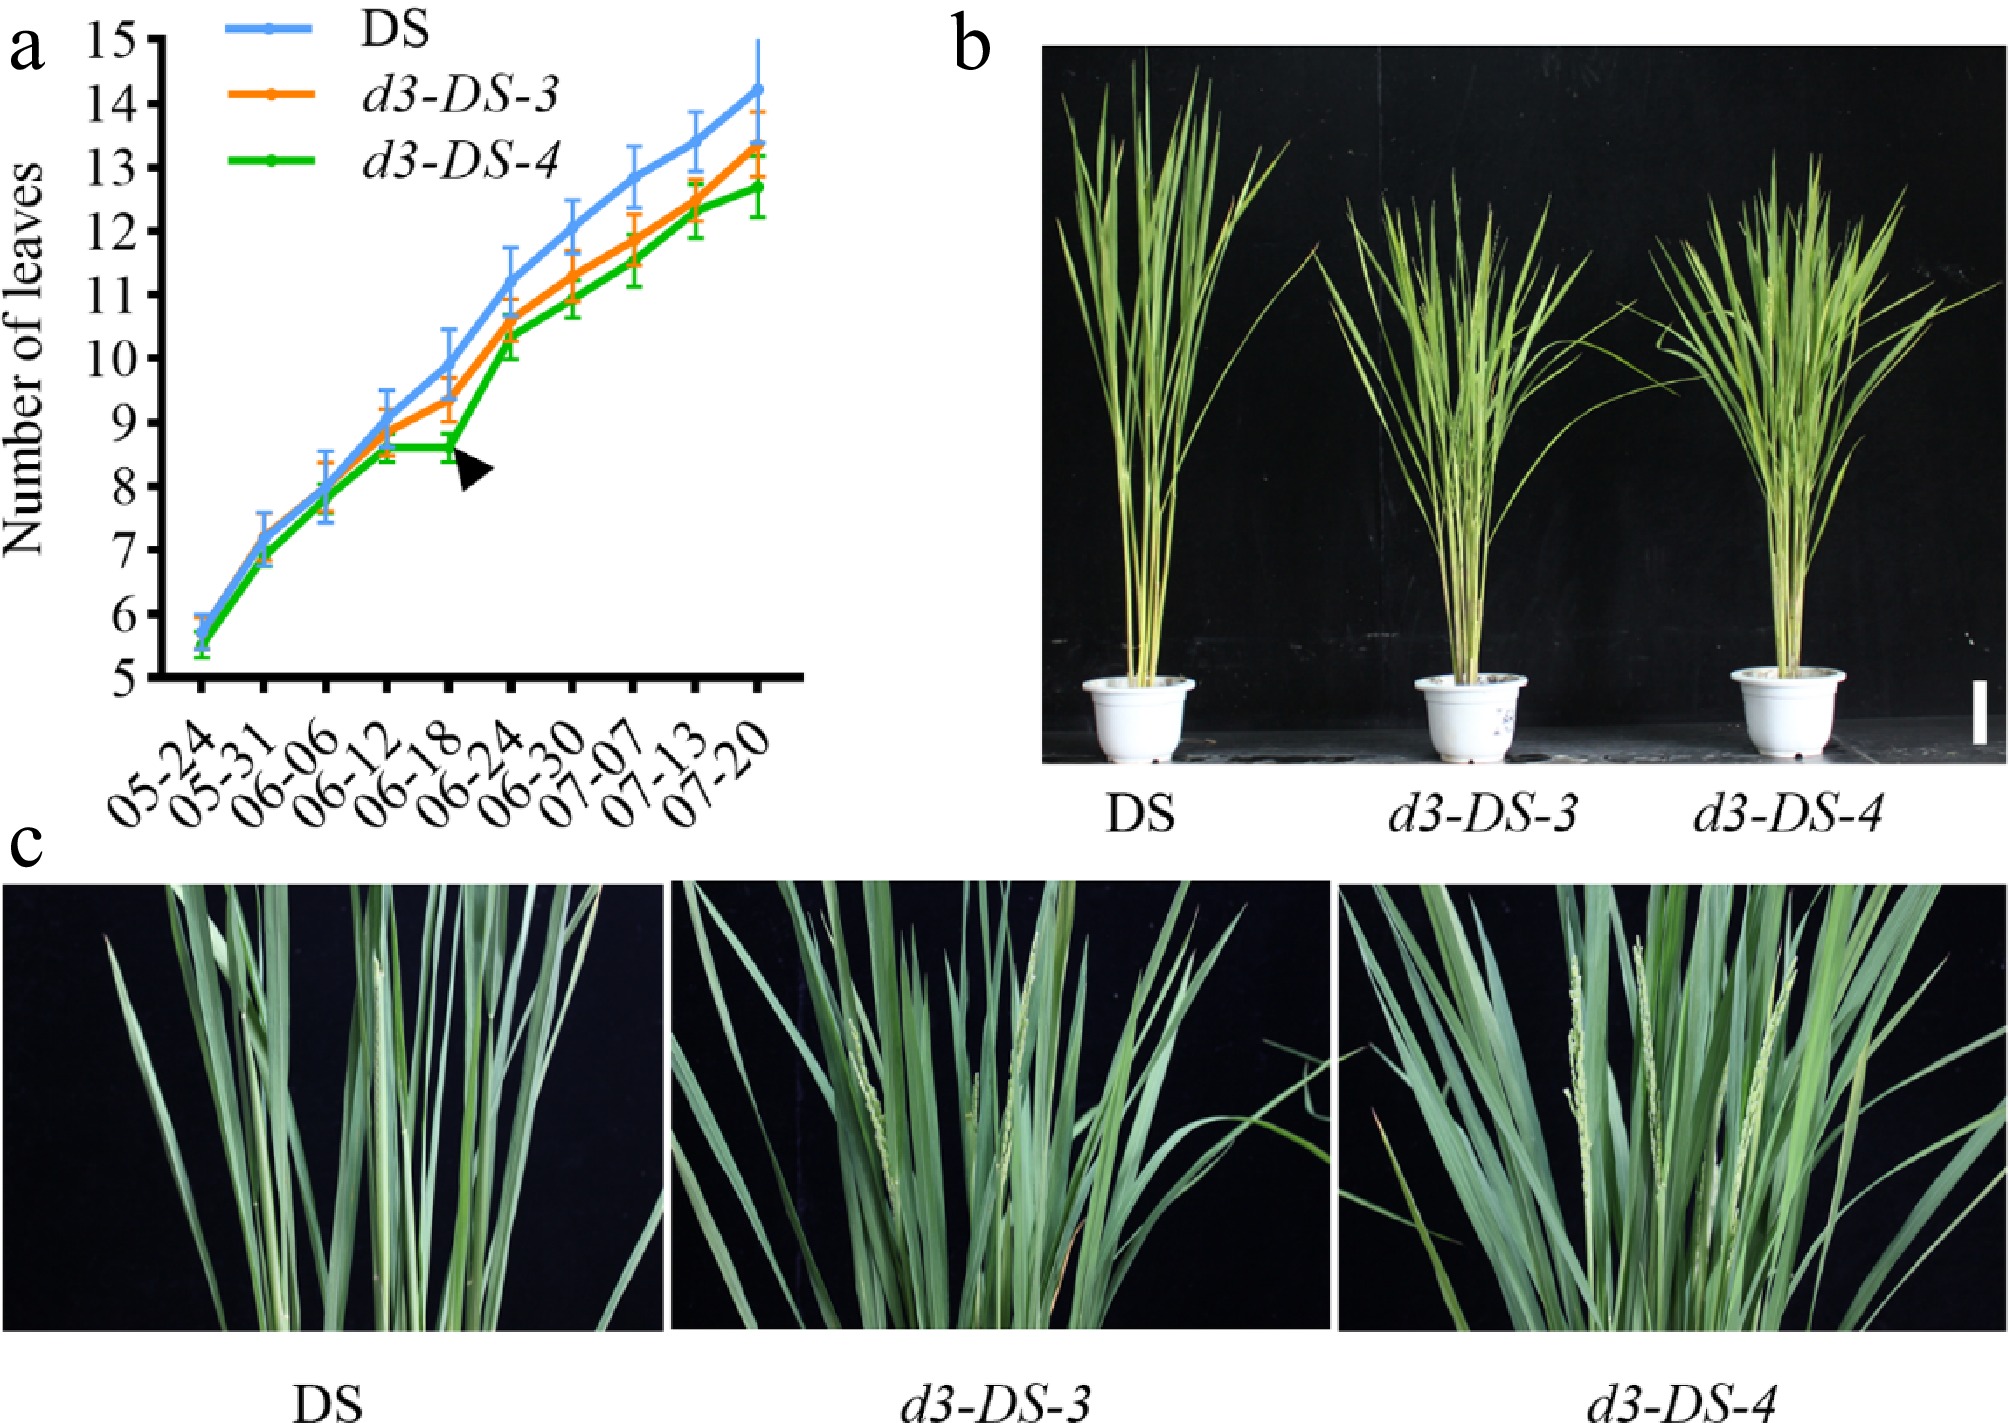
Figure 4.
Growth period analysis of d3 mutants. (a) Monitoring of leaf age of d3 mutants and the wild-type DS. The black inverted triangle marks the point when the leaf age difference emerged. (b) The heading stage phenotype of the d3 mutants and wild type in the field. (c) A close-up of the panicle part, with a scale bar of 10 cm.
-
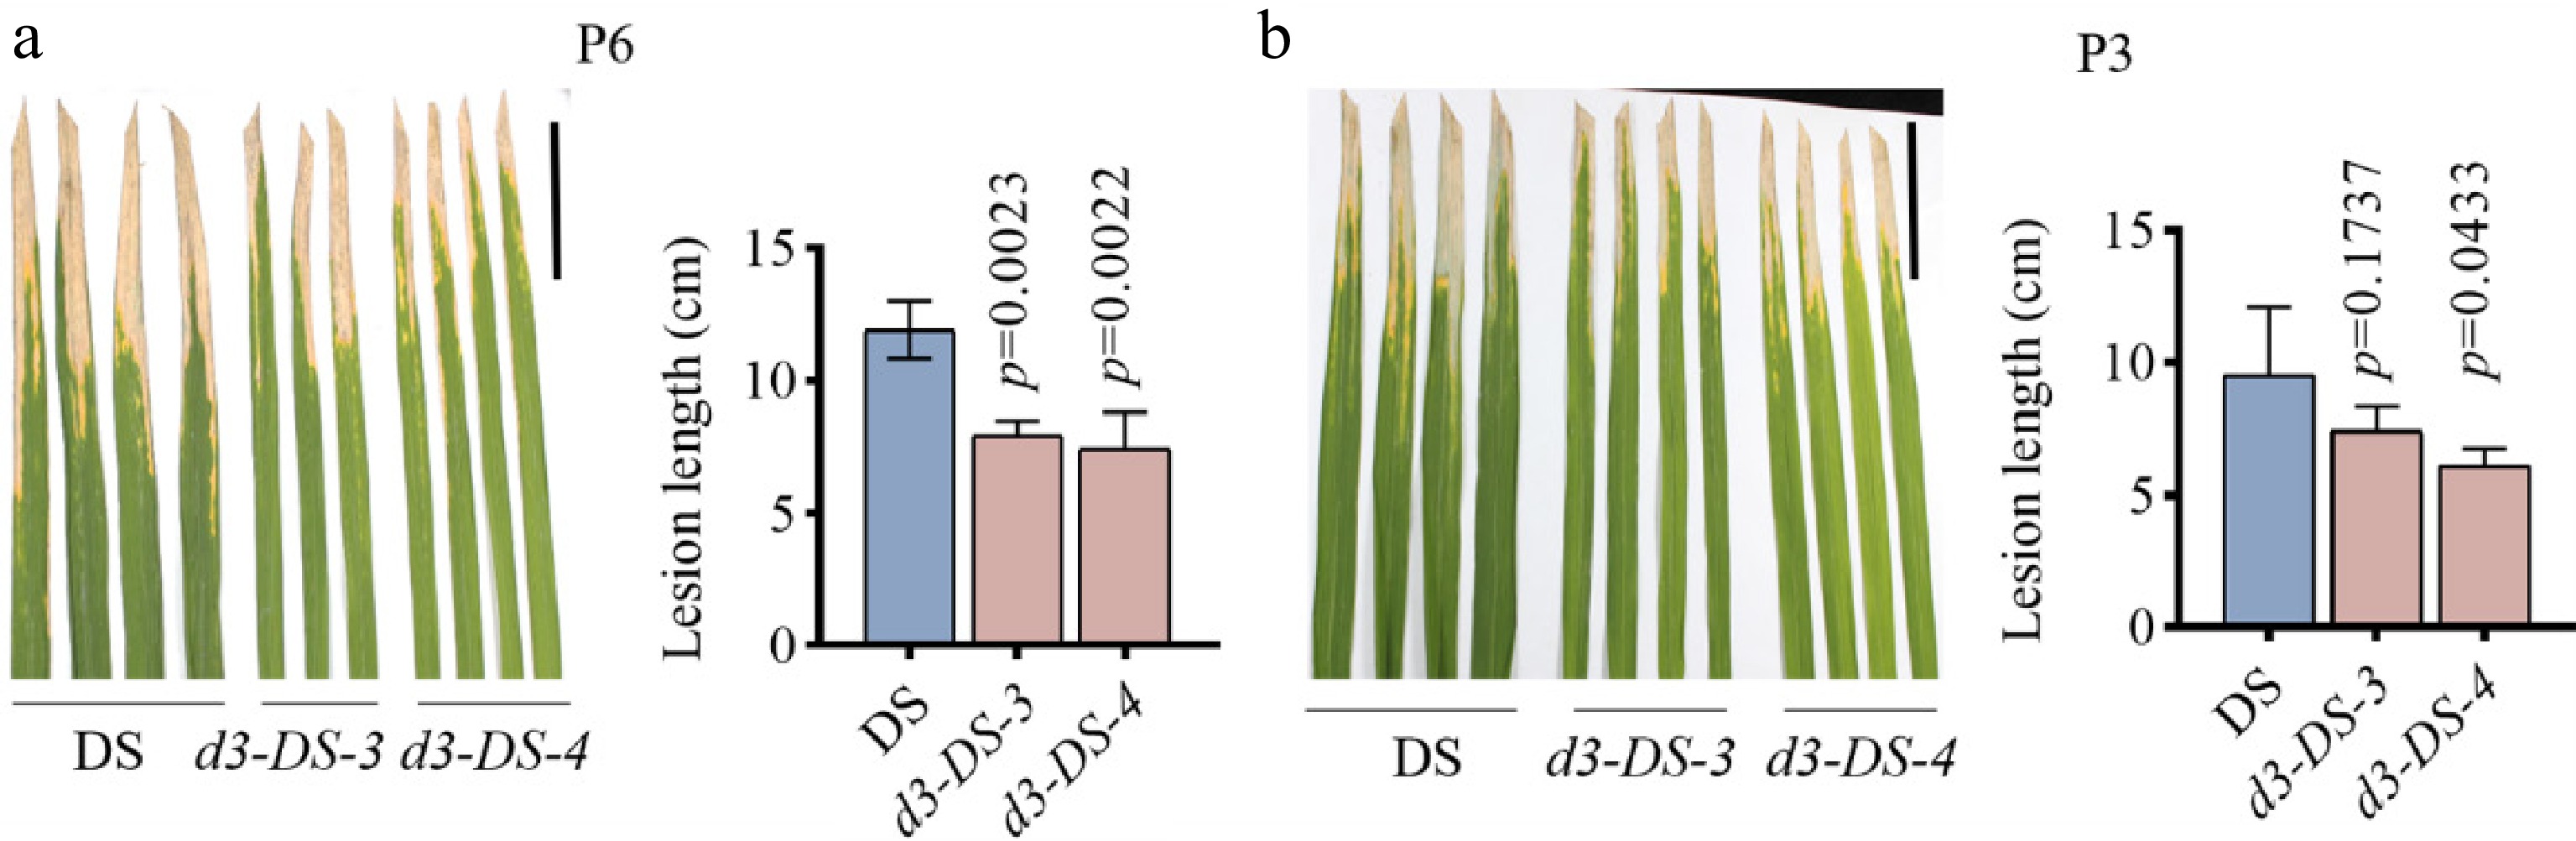
Figure 5.
Inoculation of Xoo on d3 mutants. (a), (b) Phenotype and lesion length statistics of the d3 mutant and wild-type DS inoculated with P6 and P3 strains after 18 d. The scale bar represents 5 cm, with P6 and P3 strain suspension concentration set at an OD600 of 0.6. All p values were determined by unpaired Student's t-test, compared to DS.
-
T1 homozygous mutant line T1 with transgenic elements Number of examined T2 plants Number of T2 'transgene-free' plants d3-DS-1 Positive 10 4 d3-DS-2 Negative 30 30 d3-DS-3 Positive 30 8 d3-DS-4 Positive 30 9 Table 1.
Identification of 'transgene-free' homozygous d3 mutant plants in T1 and T2 generations.
Figures
(5)
Tables
(1)