-
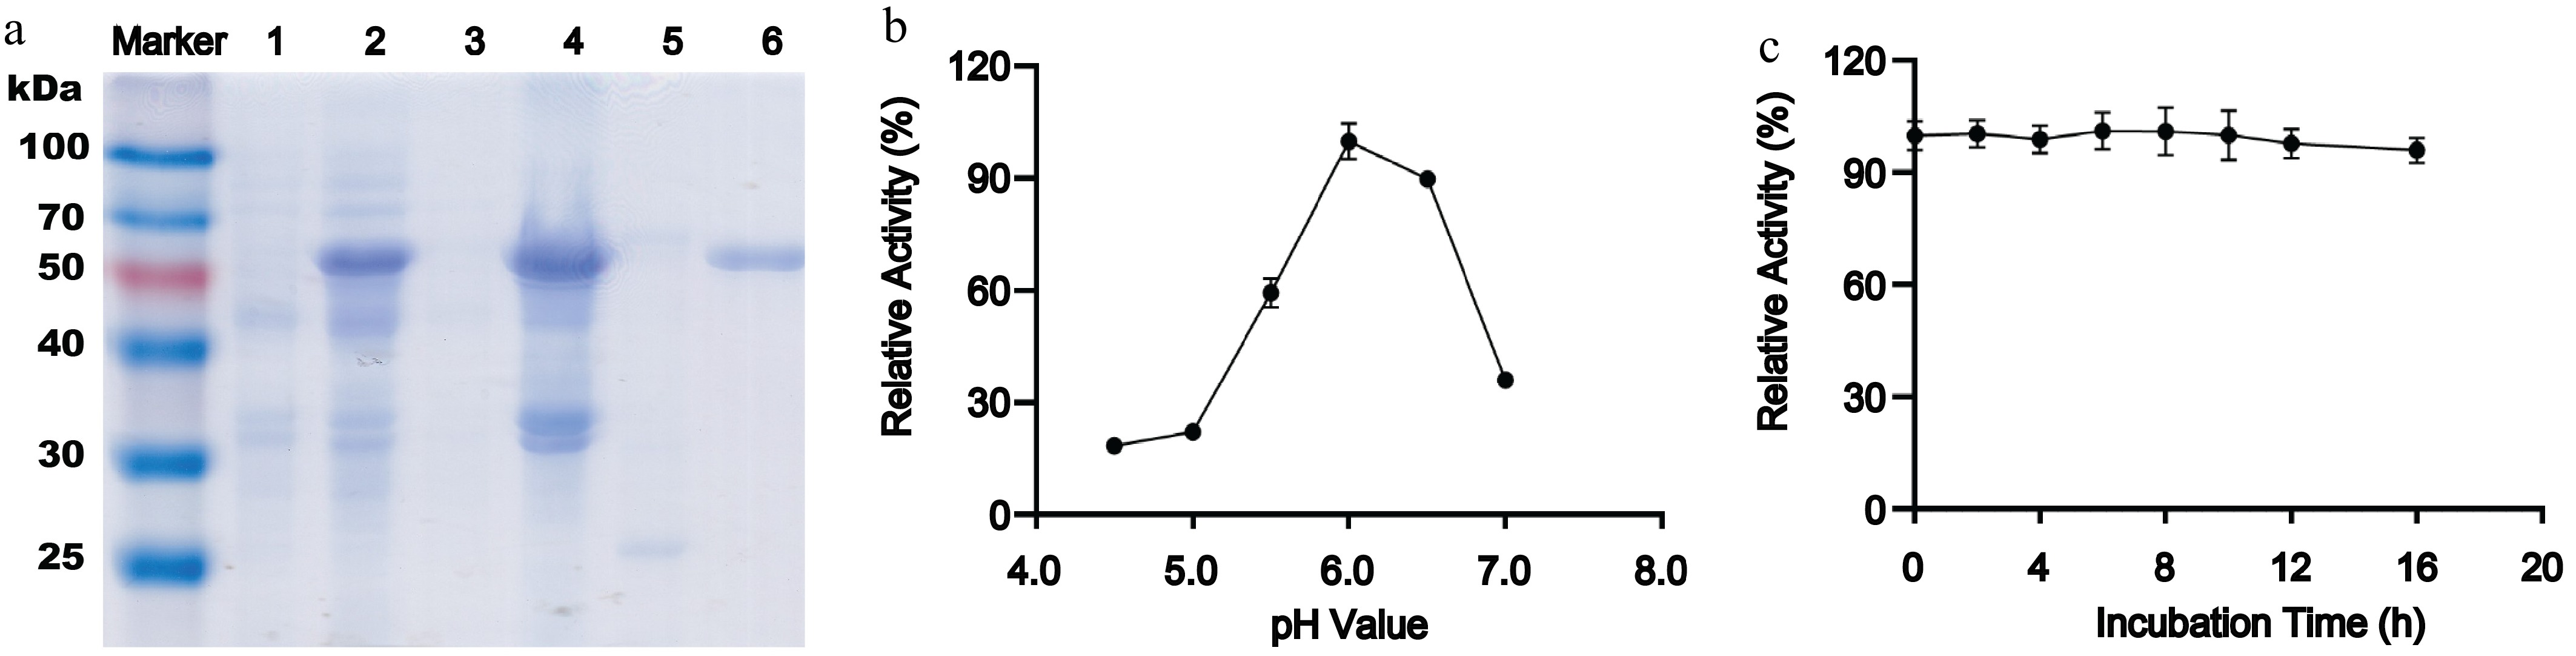
Figure 1.
Expression, purification, and biochemical characterization of recombinant AmePNG. (a) SDS-PAGE analysis of AmePNG expression and purification. Lane Marker: protein molecular weight marker; Lane 1: uninduced E. coli cells; Lane 2: IPTG-induced E. coli cells; Lane 3: soluble fraction (supernatant) after cell lysis; Lane 4: insoluble fraction (precipitate) after cell lysis; Lane 5: AmePNG purified from the soluble fraction by nickel affinity chromatography; Lane 6: refolded AmePNG purified from inclusion bodies. (b) pH profile showing relative activity of AmePNG across different pH values. (c) Stability of AmePNG after incubation at pH 6.0 in 0.5 M sodium phosphate–citrate buffer for up to 16 h, expressed as relative activity.
-
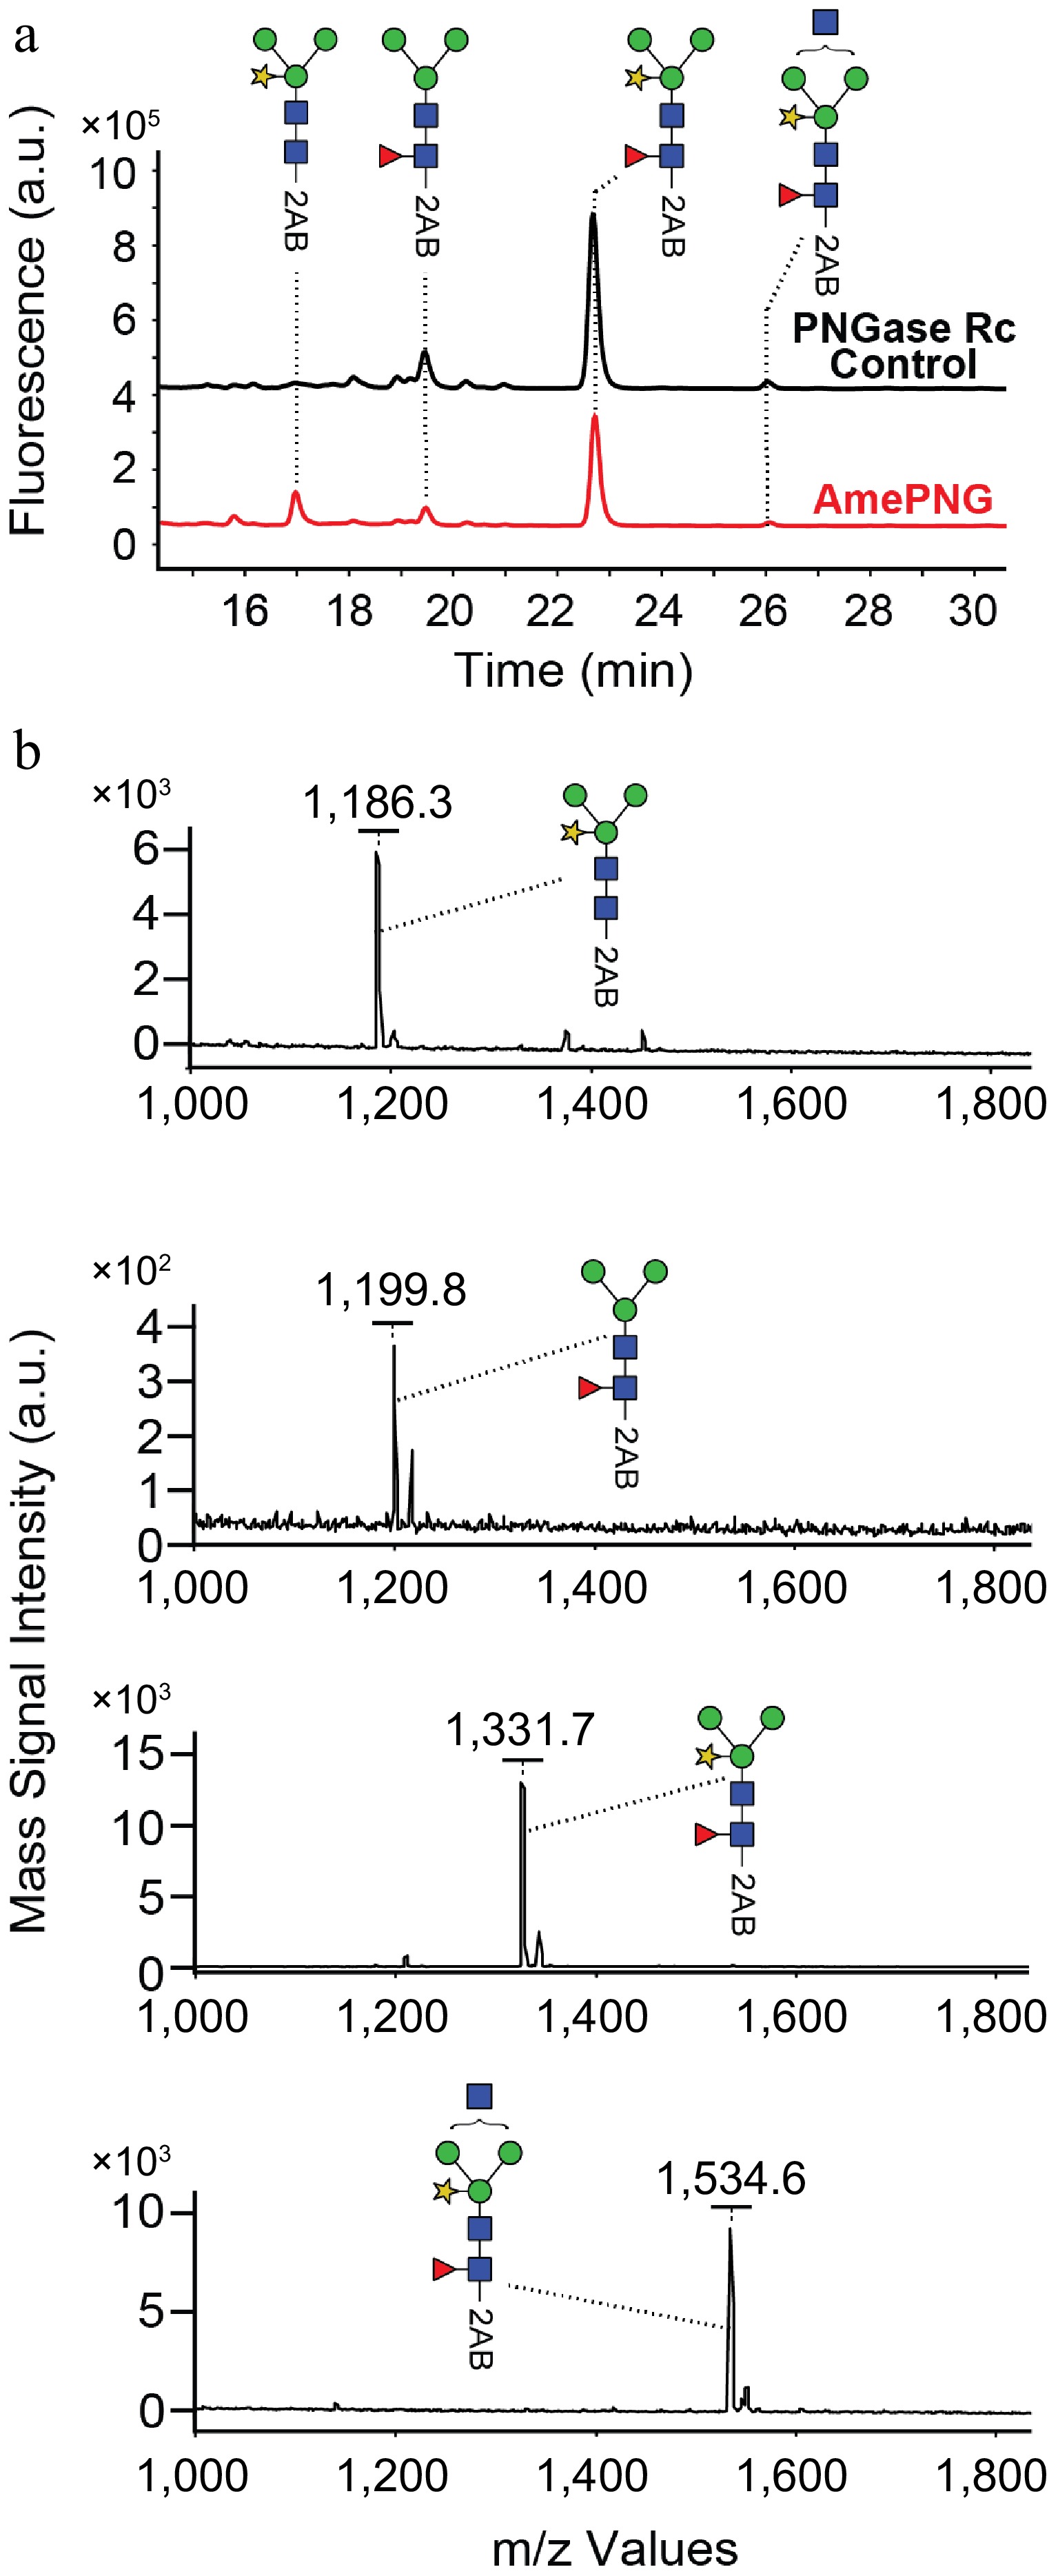
Figure 2.
(a) UPLC, and (b) MALDI-TOF analysis of HRP N-glycans.
-
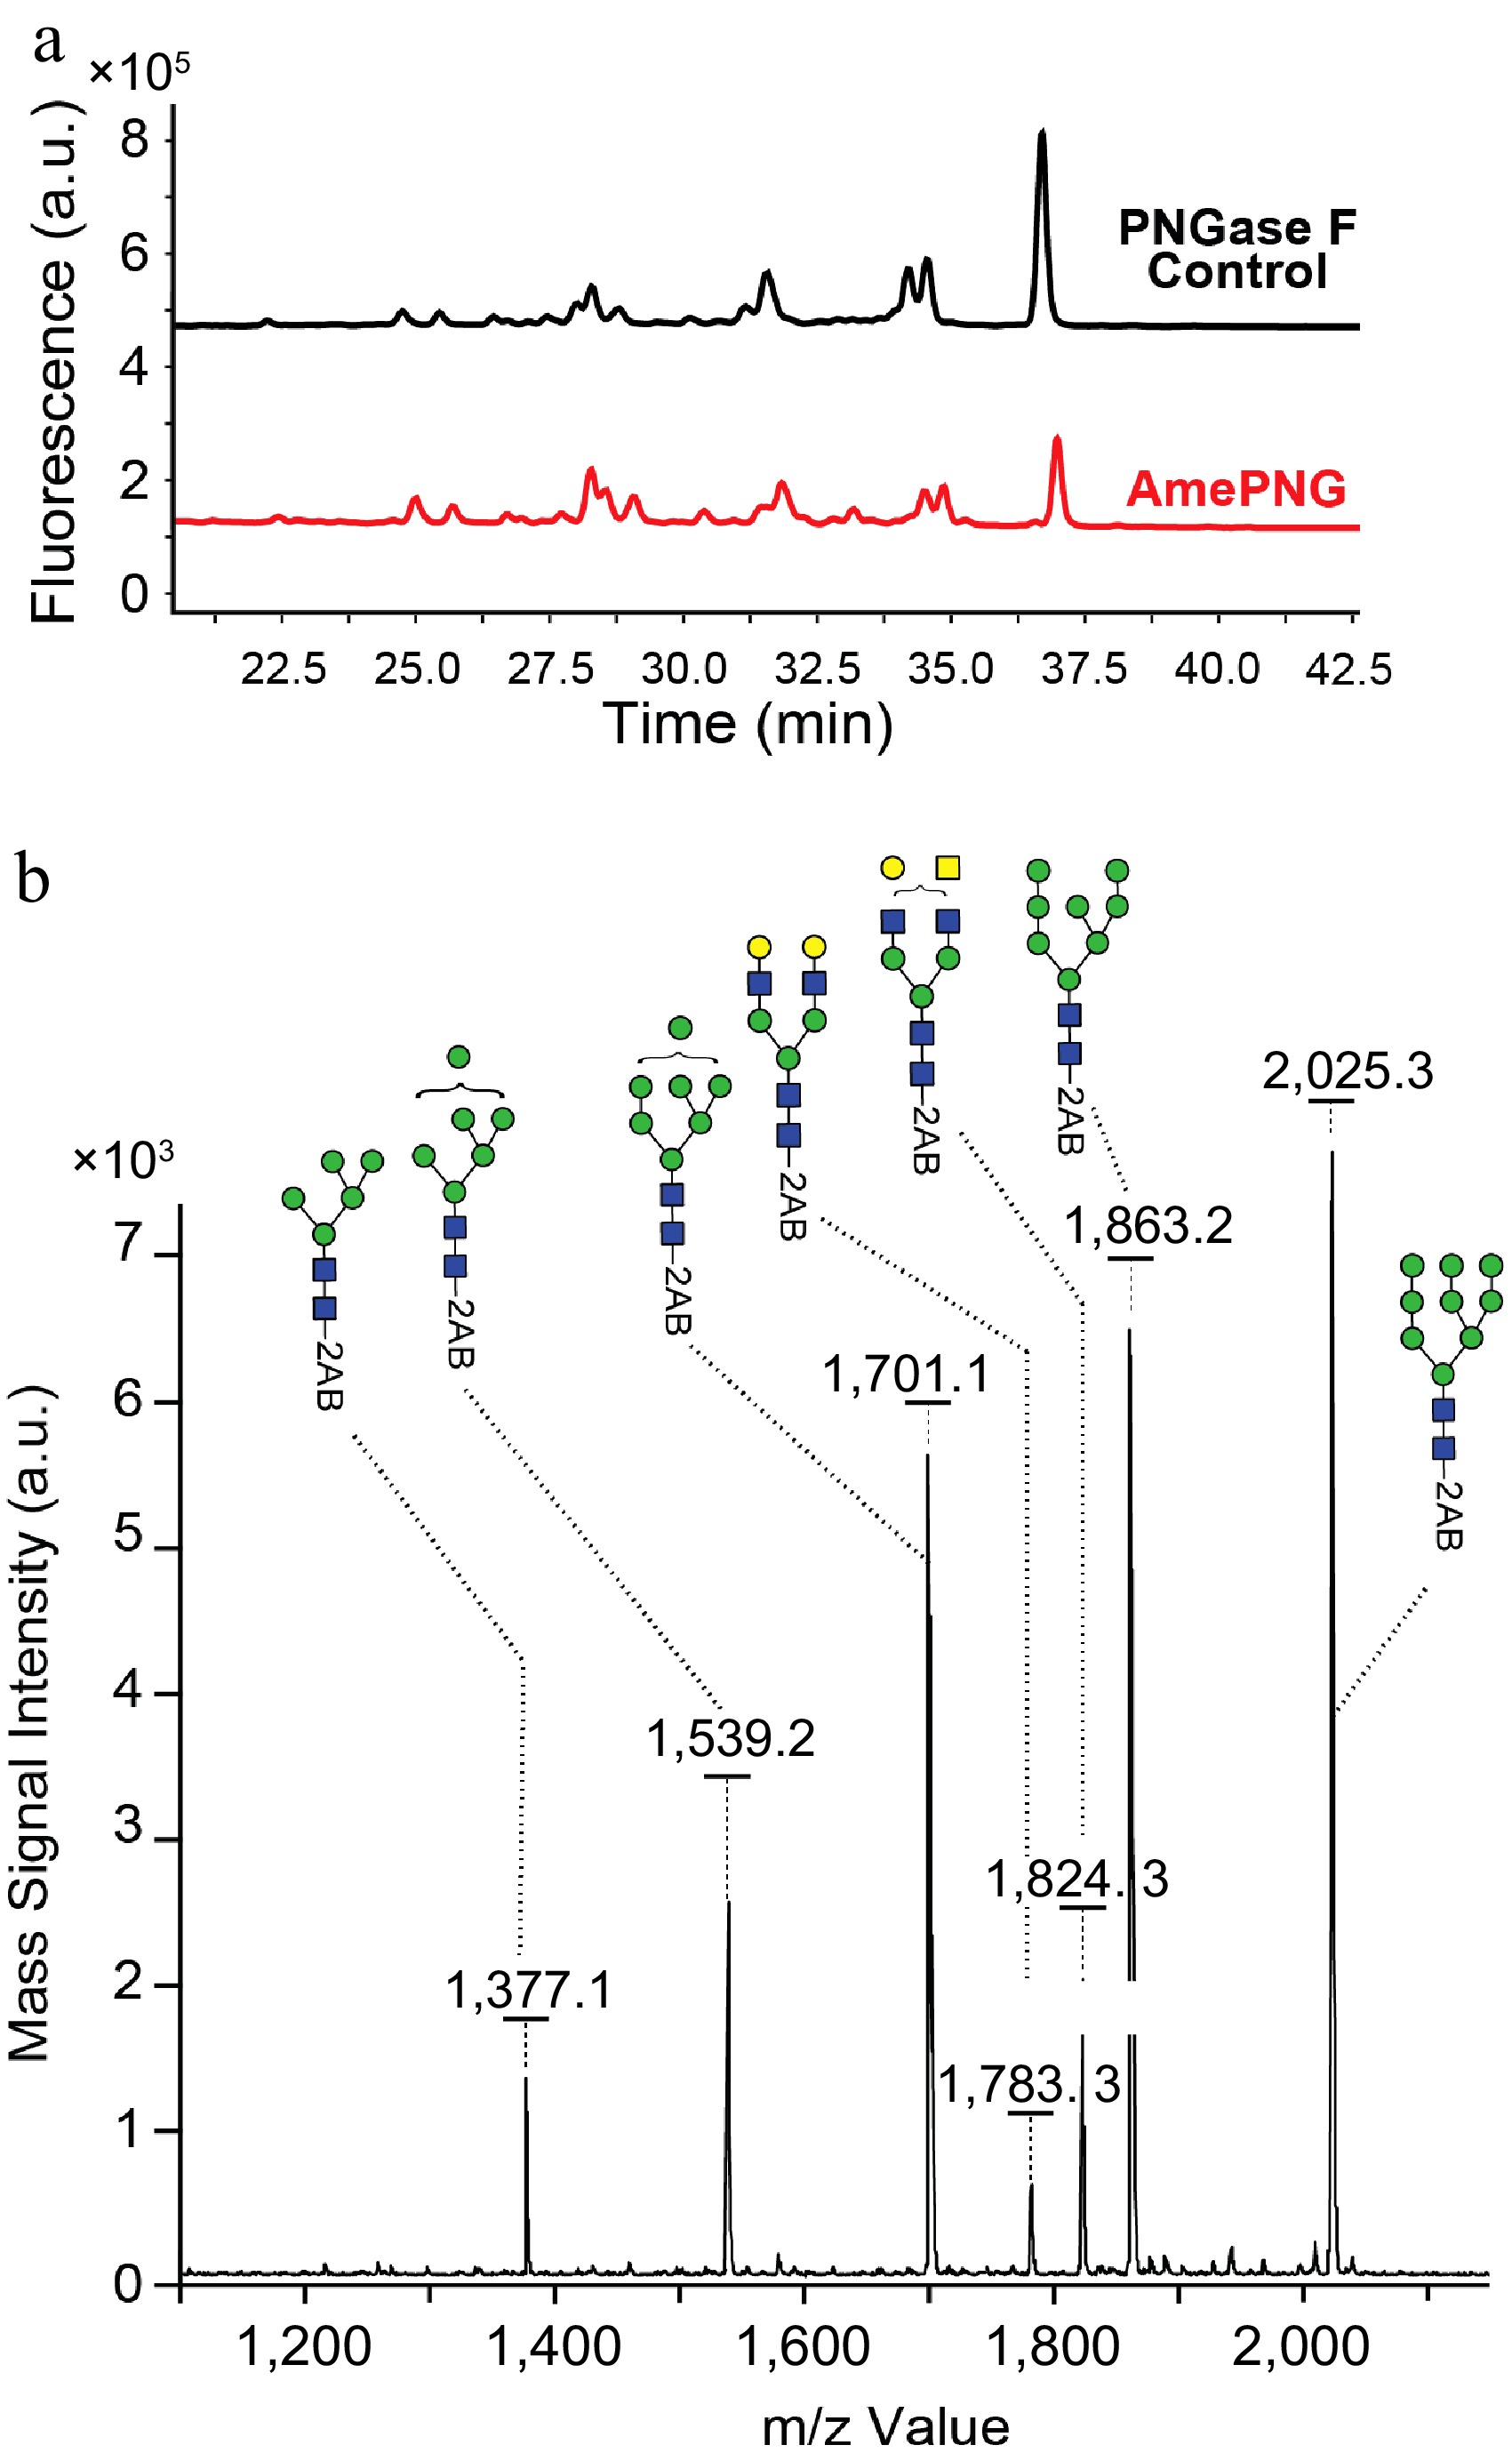
Figure 3.
(a) UPLC, and (b) MALDI-TOF analysis of LF N-glycans.
-
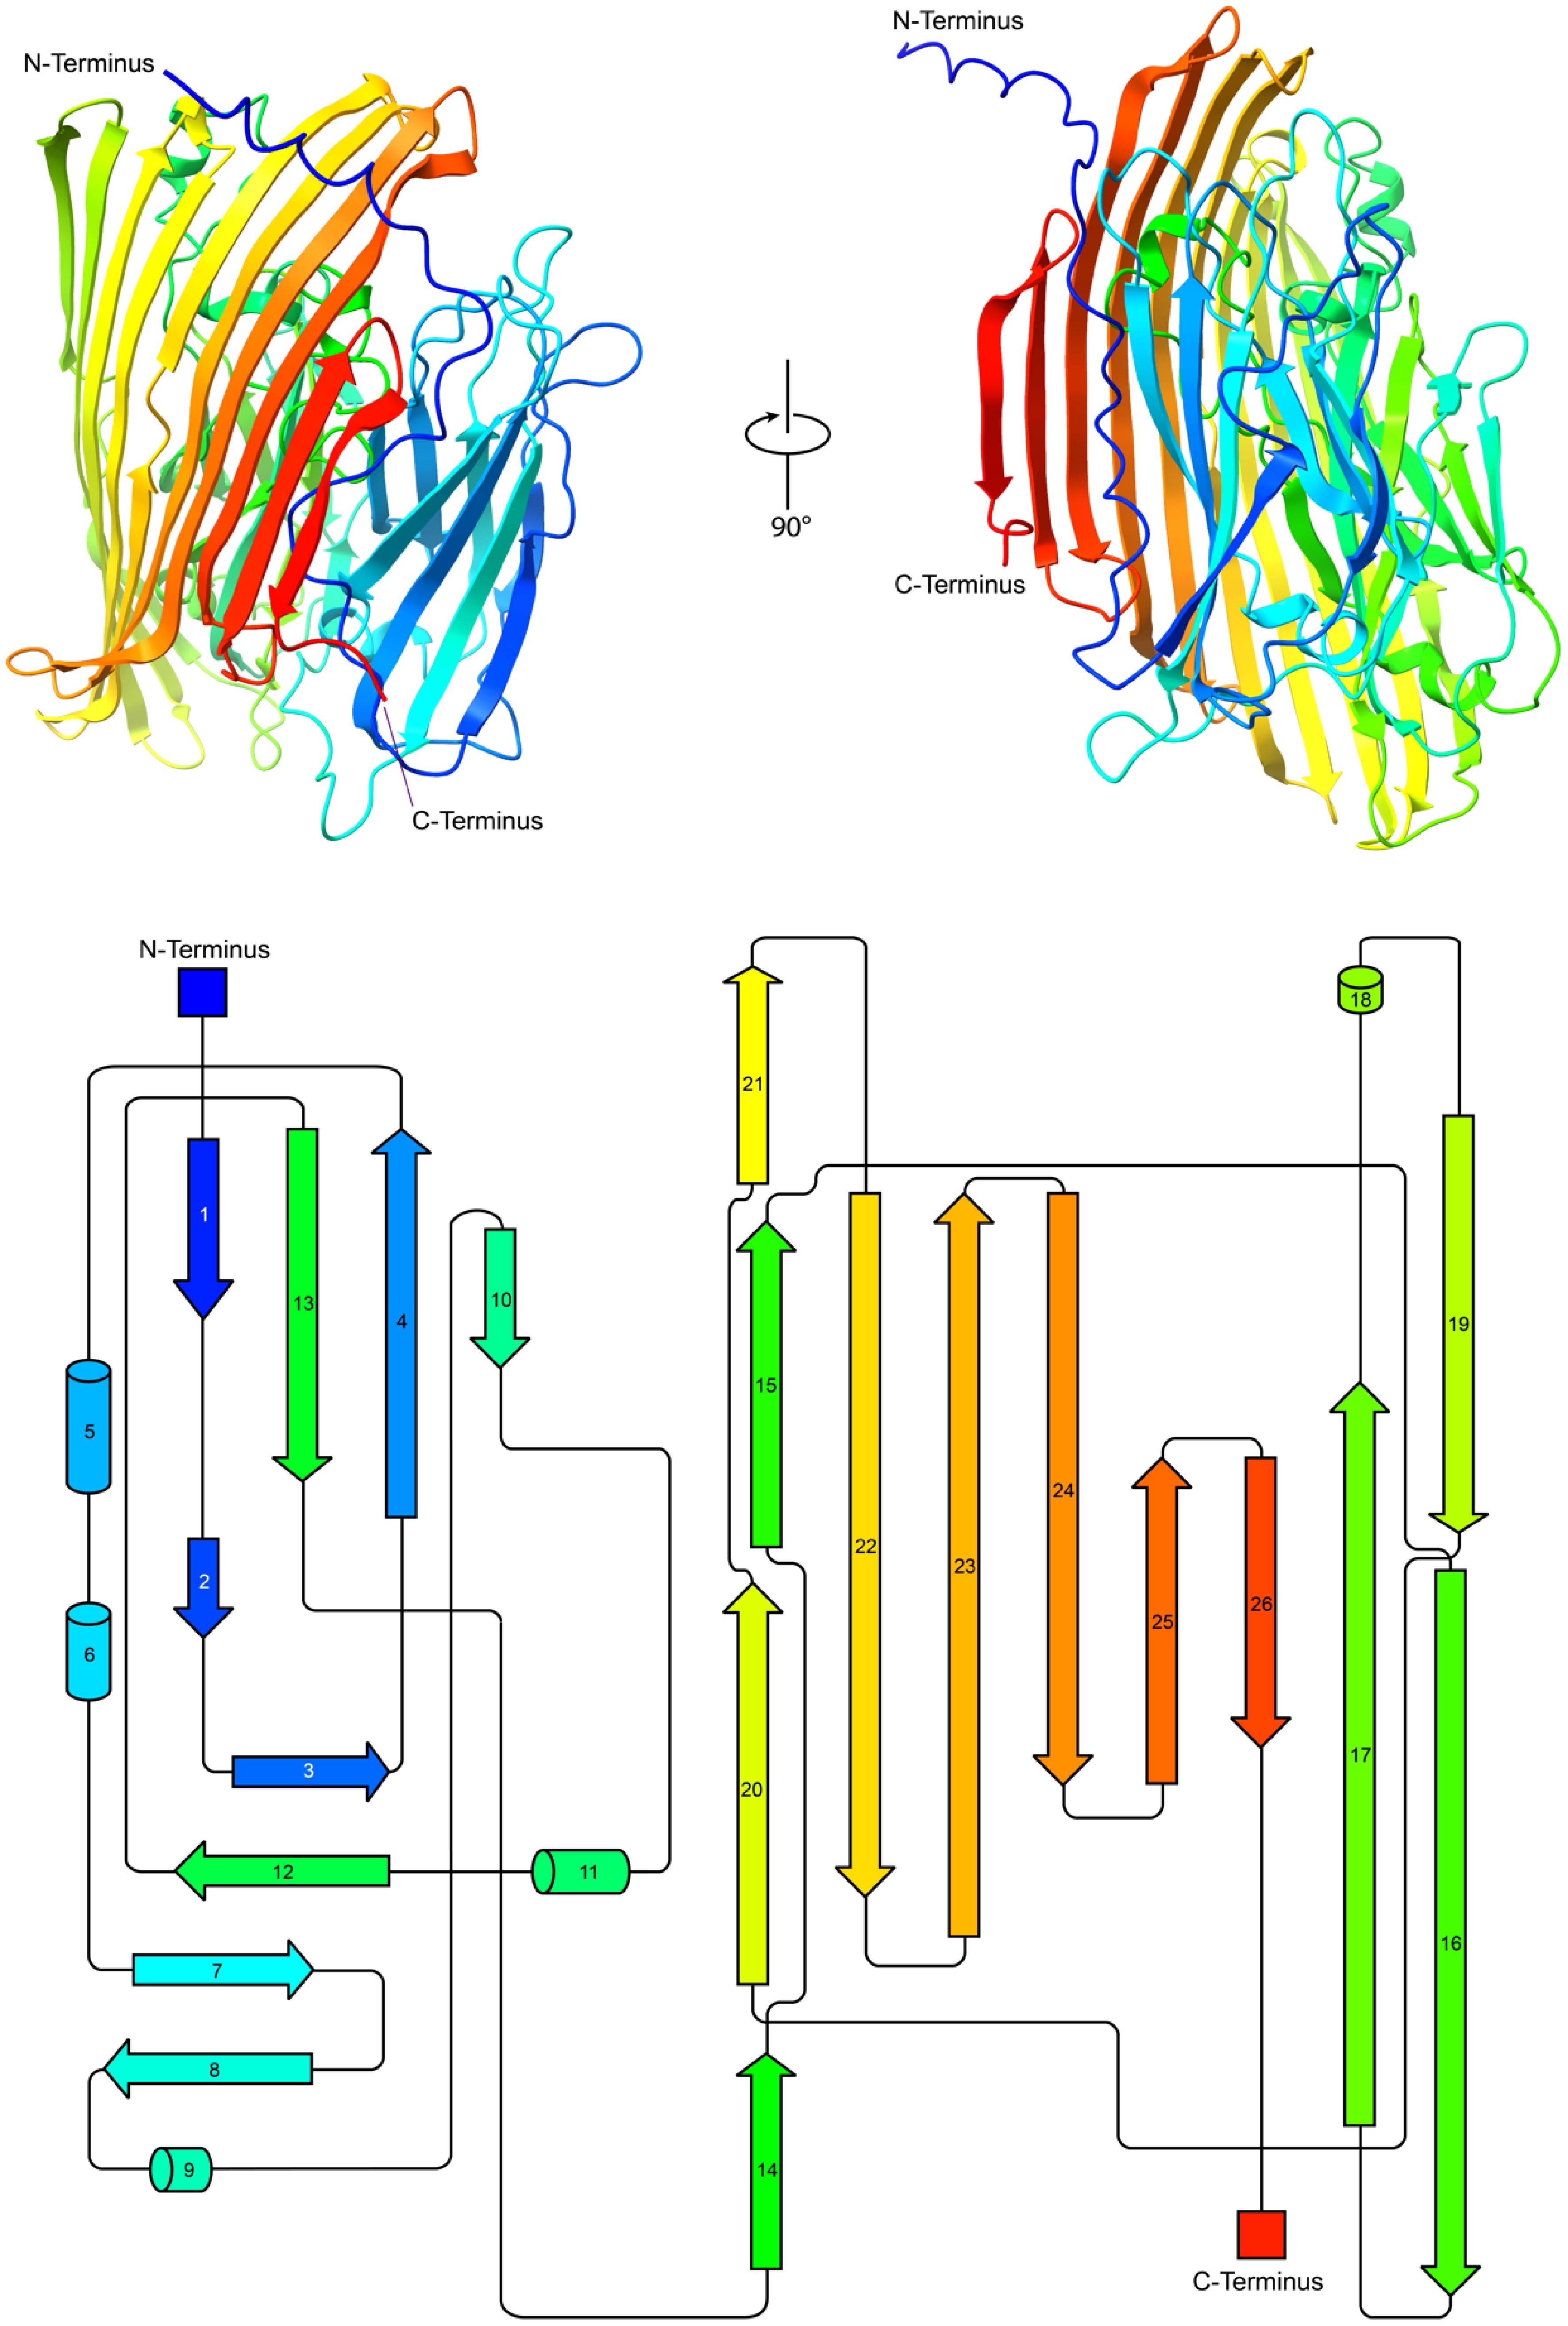
Figure 4.
Structural and topological analysis of AmePNG. The top part shows cartoon representations of the predicted AmePNG structure, generated using AlphaFold2, in two orientations rotated by 90°, with the N- and C-termini indicated in red and blue, respectively. The bottom shows the corresponding topological map of AmePNG. β-strands and α-helices are represented as arrows and cylinders, respectively, and illustrate the sequential order and spatial organization of AmePNG's secondary structure.
Figures
(4)
Tables
(0)