-
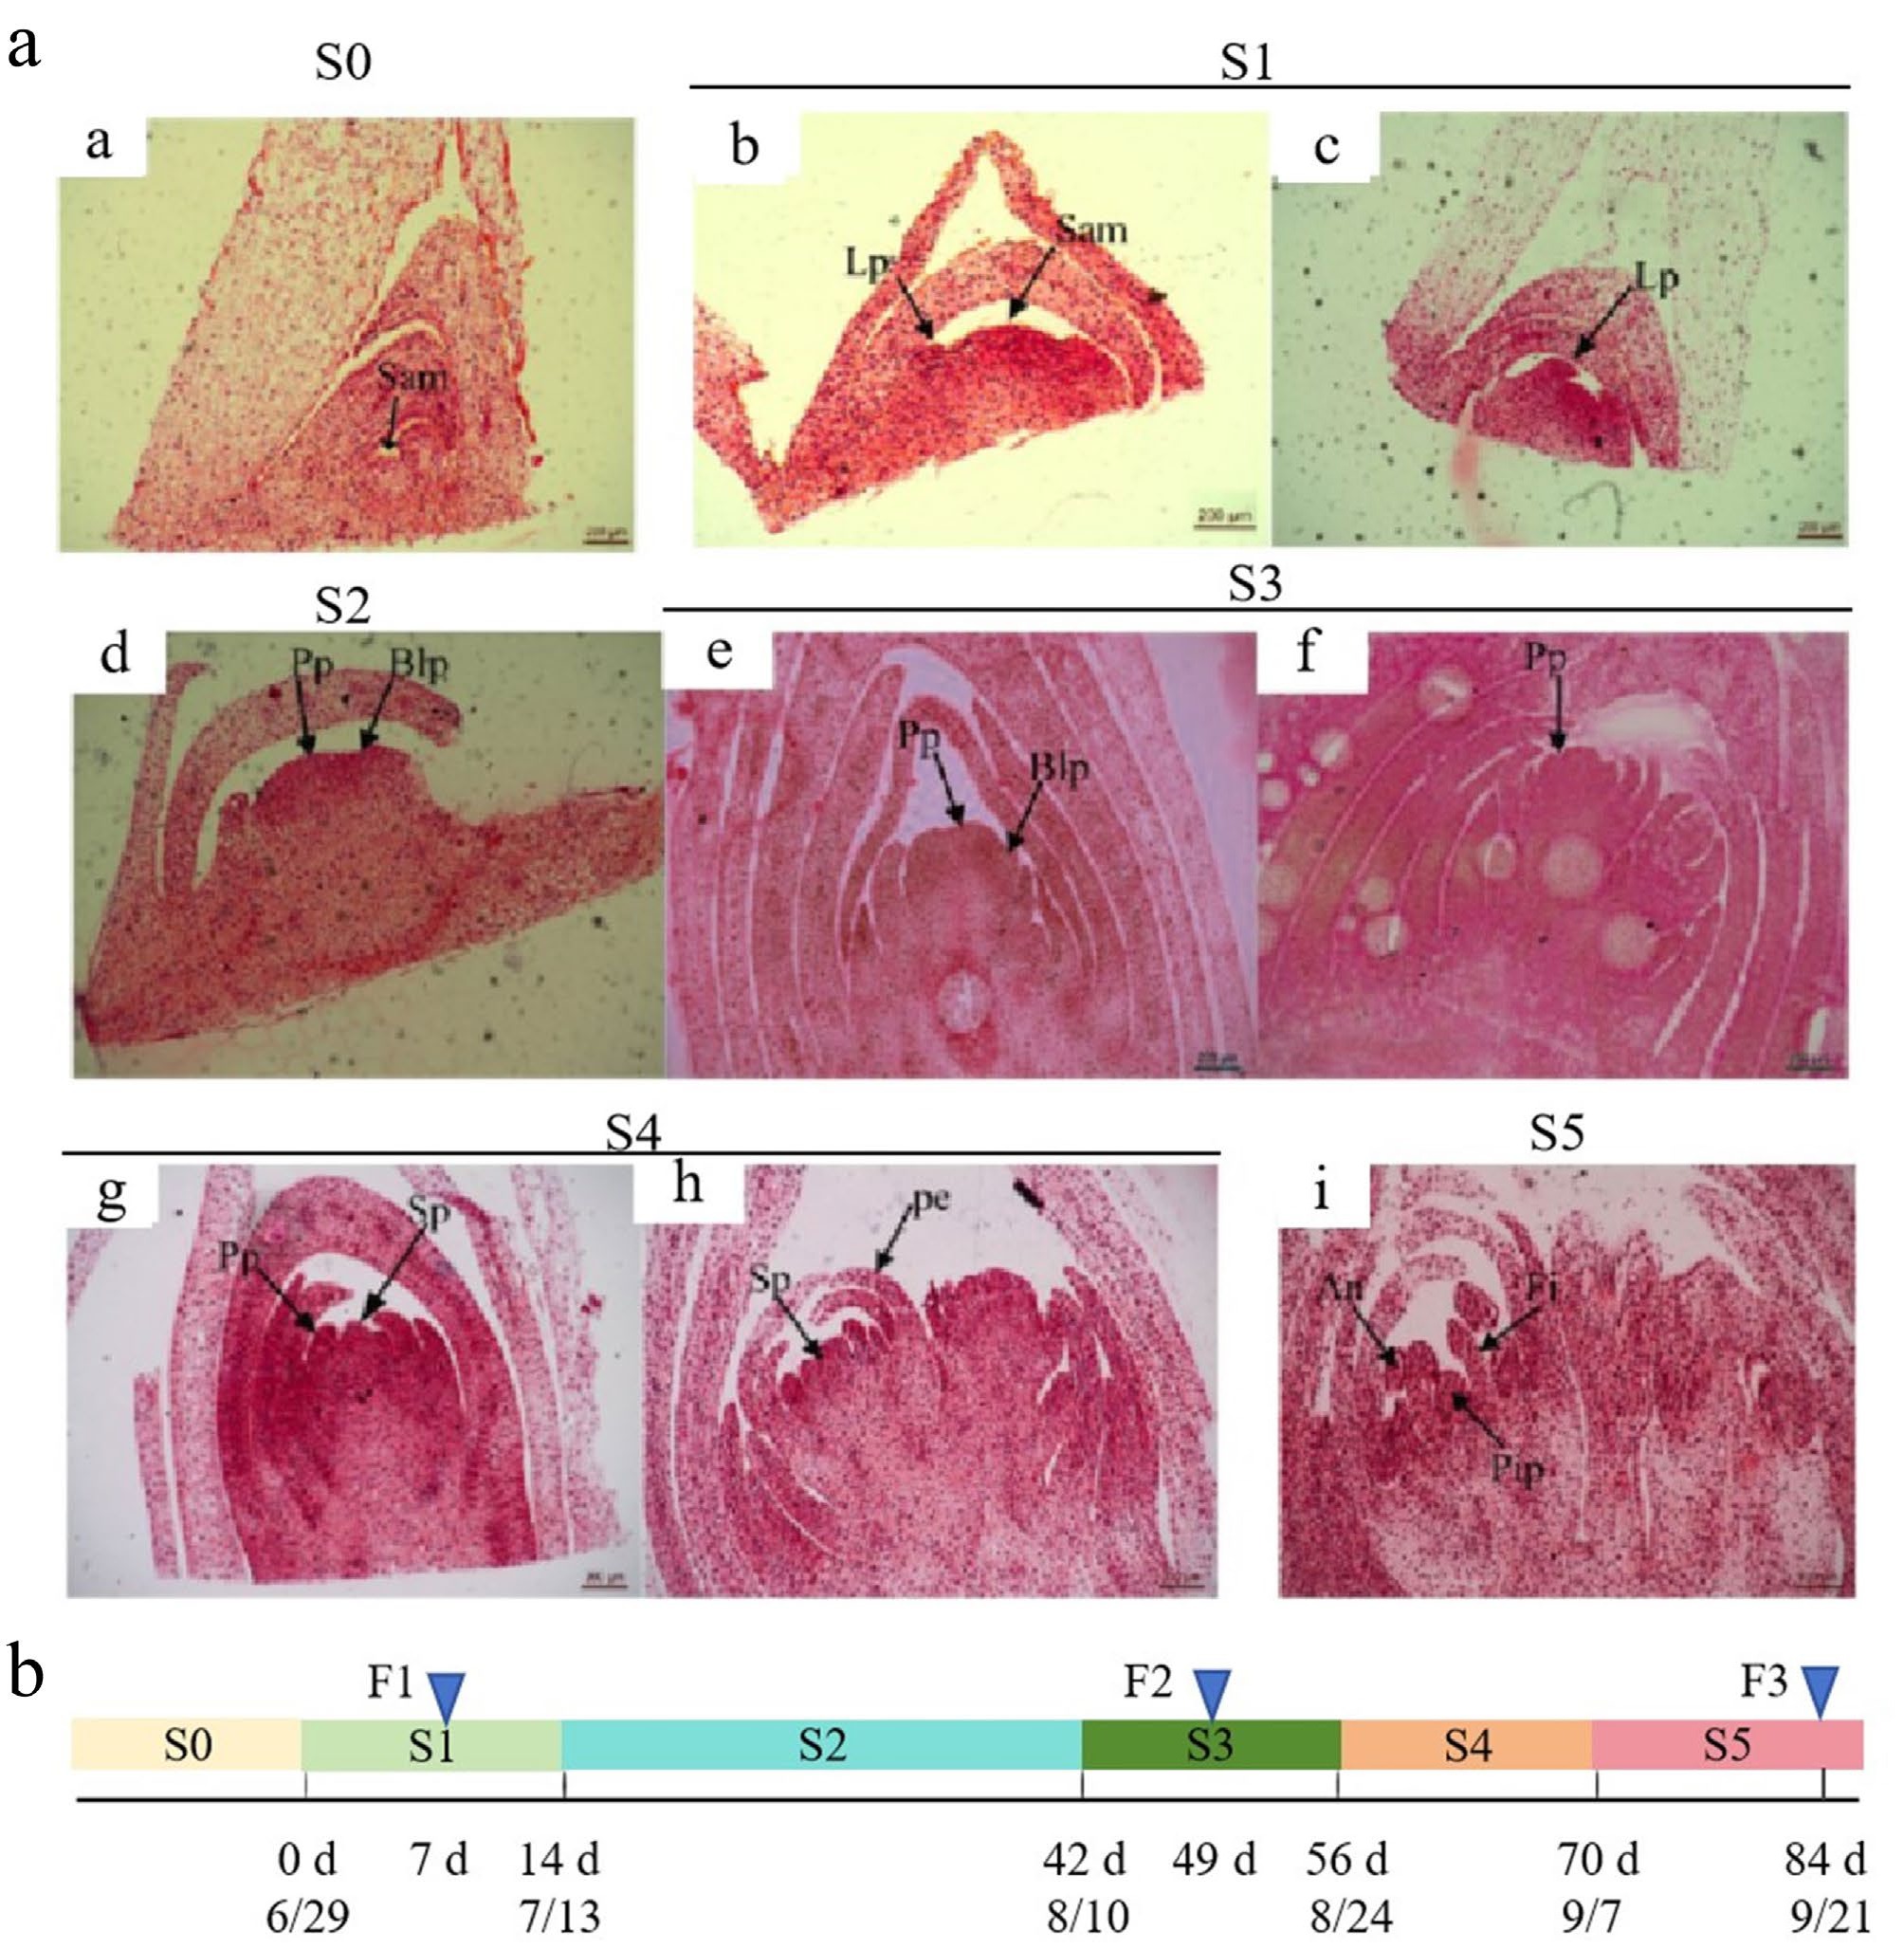
Figure 1.
Morphological characterization of floral bud differentiation in Fritillaria pallidiflora. a: Floral bud development was classified into six distinct stages (S0–S5) based on morphological characteristics. (a) Undifferentiated phase (S0). (b), (c) Bract primordium differentiation phase (S1). (d) Floral primordium formation phase (S2). (e), (f) Petal primordium differentiation phase (S3). (g), (h) Stamen primordium differentiation phase (S4). (i) Pistil primordium differentiation phase (S5). An: anther; Blp: bract leaf primordium; Fi: filament; Lp: leaf primordium; Pe: petal; Pip: pistil primordium; Pp: petal primordium; Sam: shoot apical meristem; Sp: stamen primordium. Scale bars: 200 μm. b: Sampling time line. F1, F2, and F3 represent three samples corresponding to the three representative developmental stages (S1, S2, and S3) of floral buds. F1 represents the sample from the S1 stage, sampled after 7 d of treatment (on July 6); F2 represents the sample from the S3 stage, sampled after 49 d of treatment (on August 17); F3 represents the sample from the S5 stage, sampled after 84 d of treatment (on September 21).
-
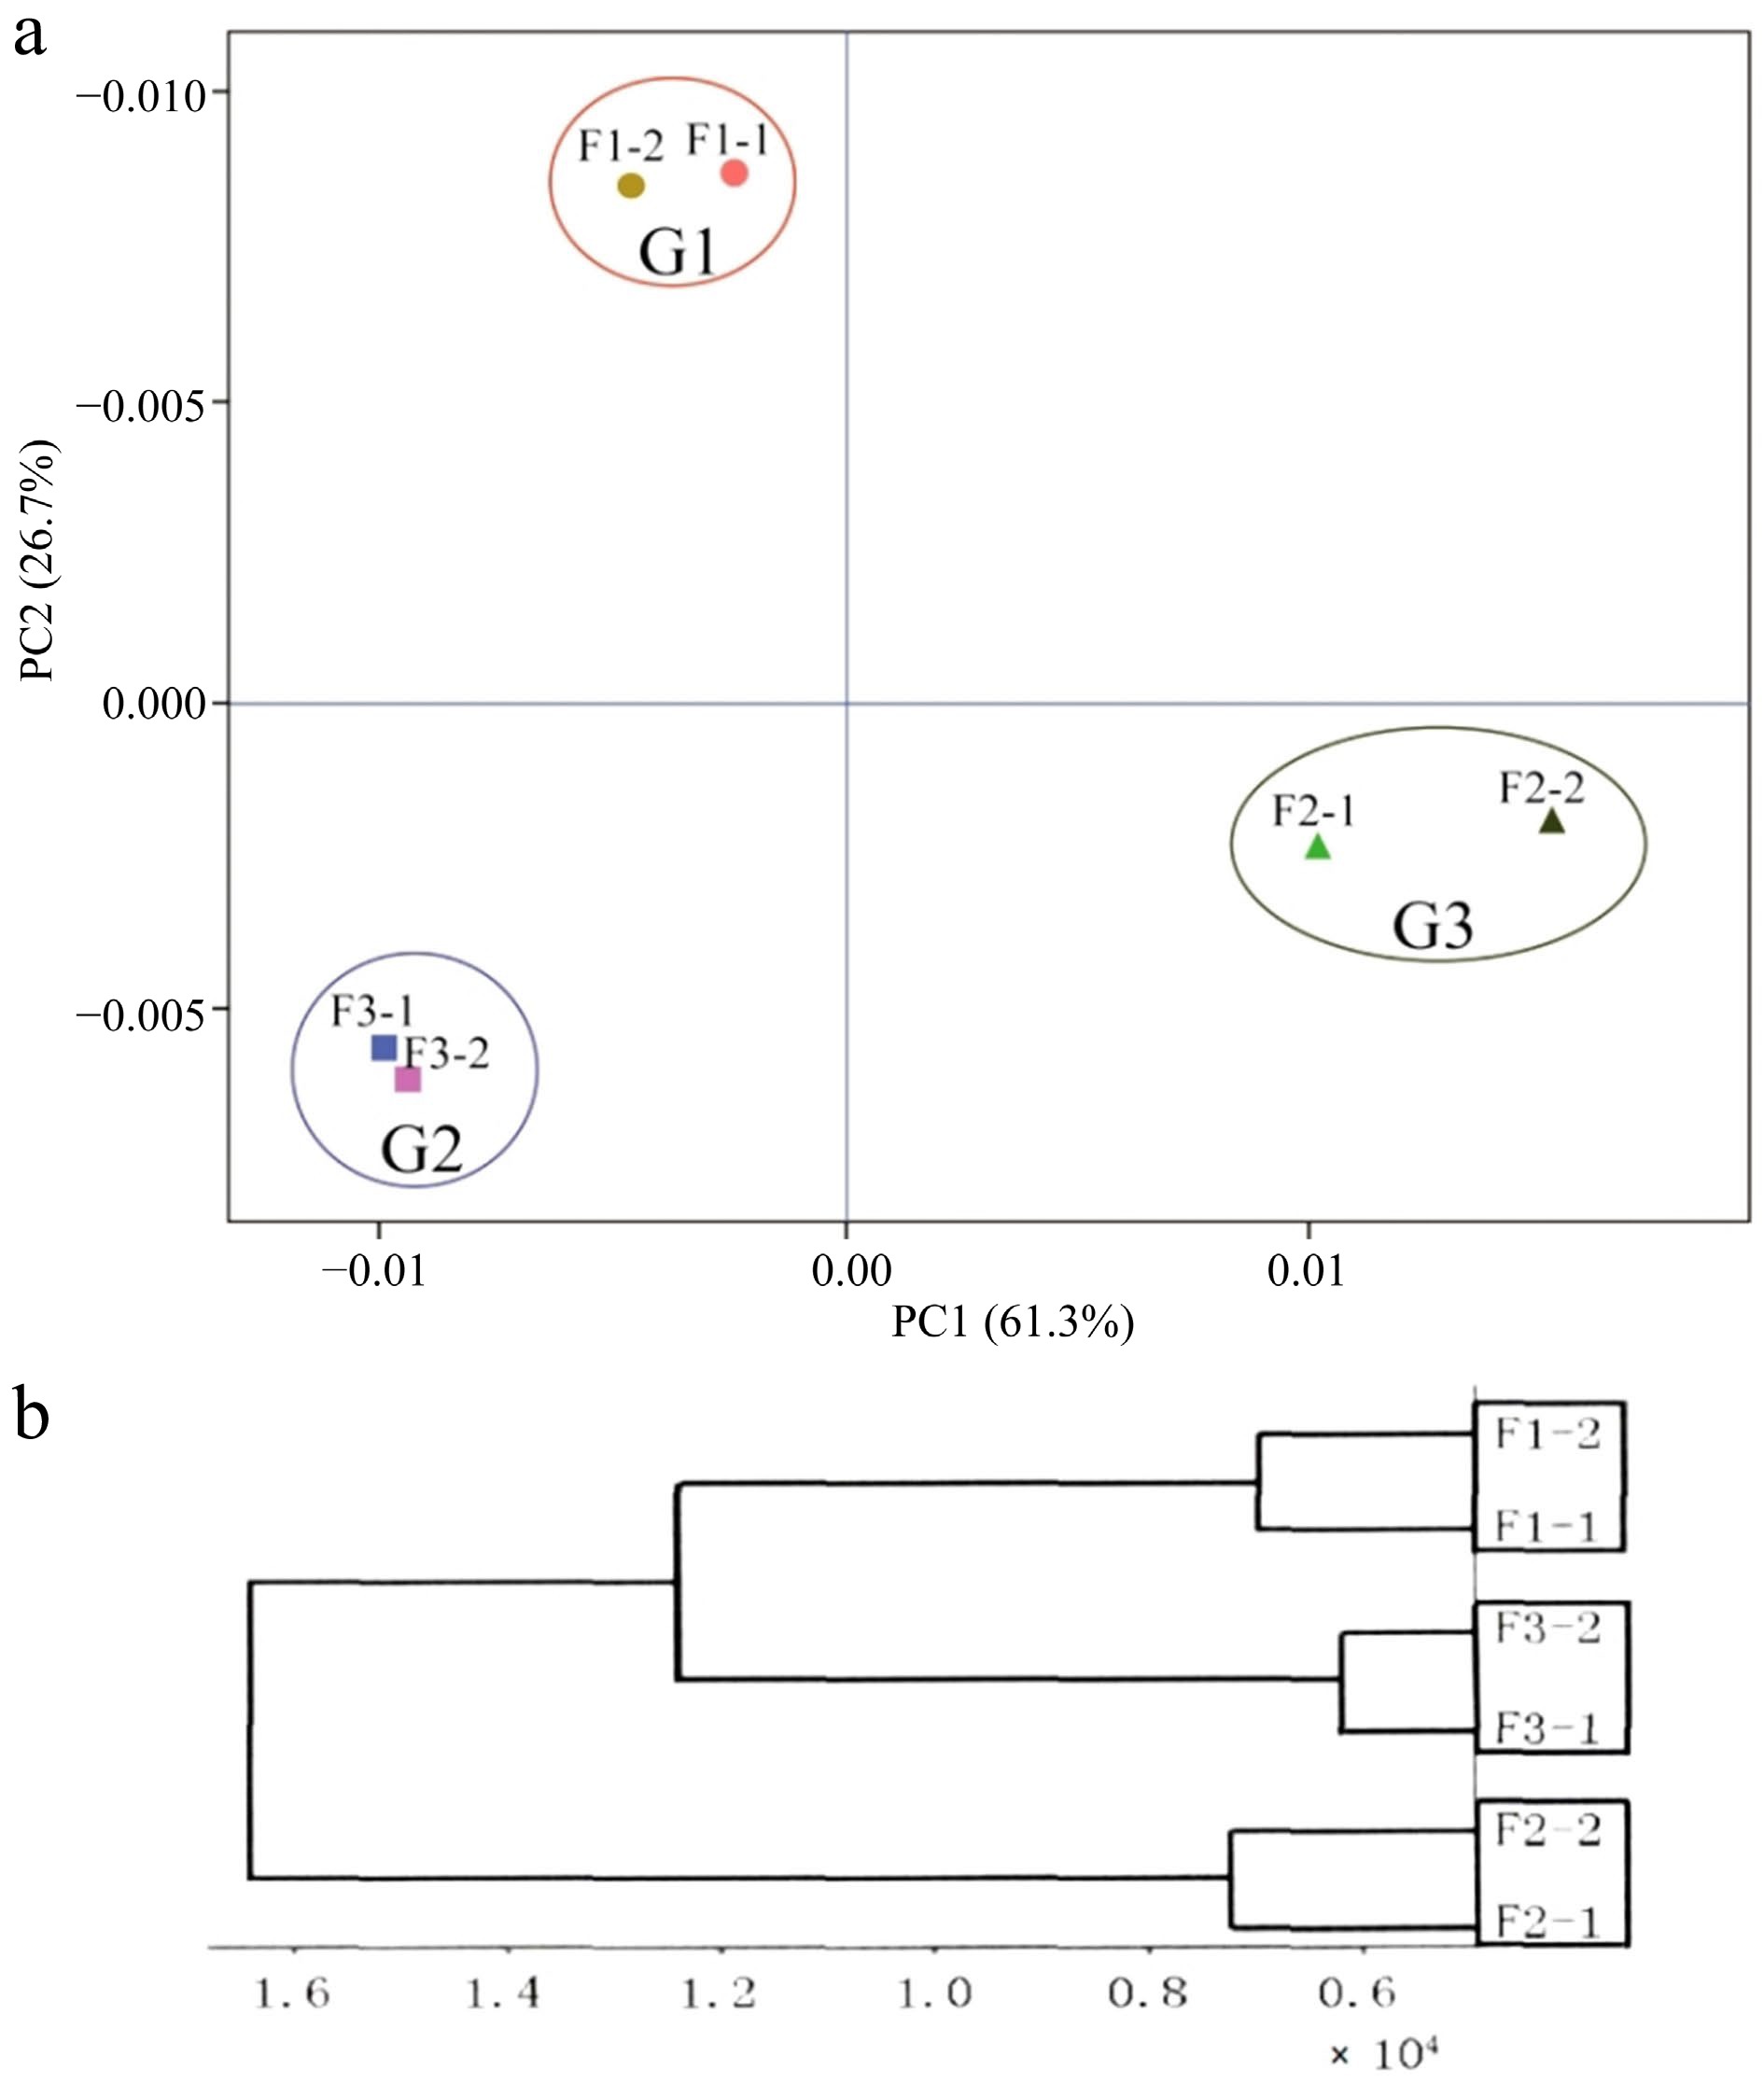
Figure 2.
(a) Principal component analysis (PCA) of each sample, and (b) cluster analysis of expression levels of samples. F1-1 and F1-2, F2-1 and F2-2, F3-1 and F3-2 represent two biological replicates for each sample respectively.
-
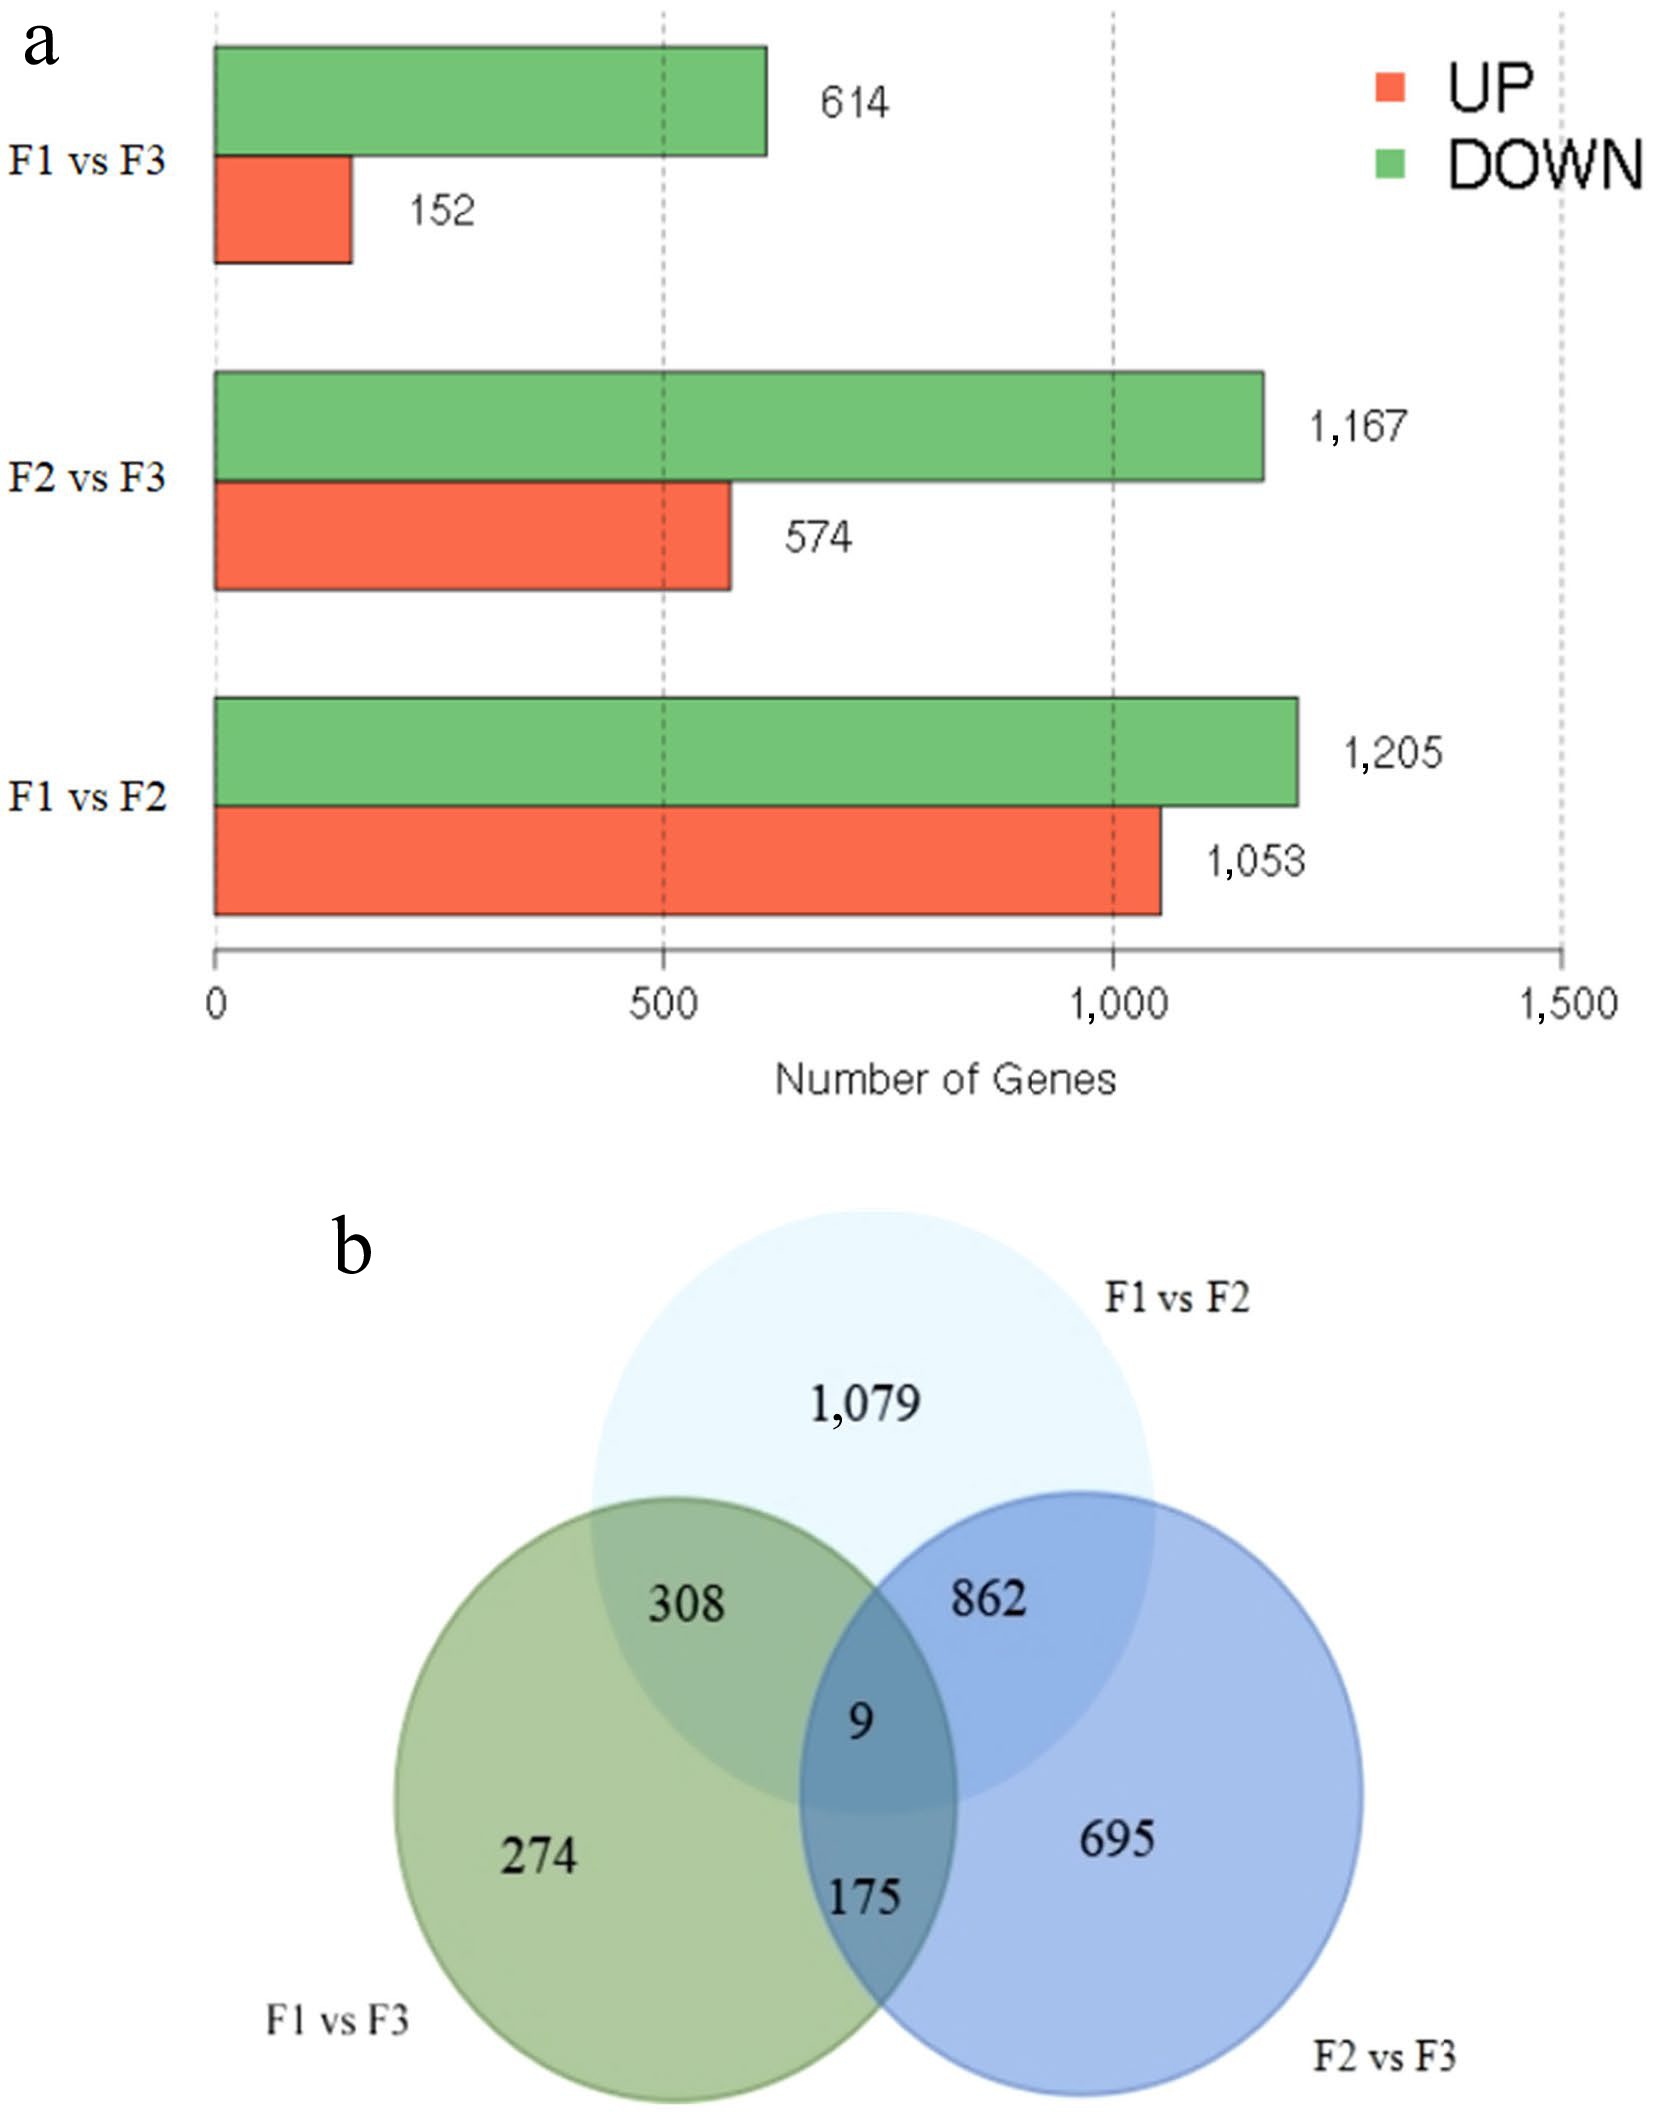
Figure 3.
Identification of differentially expressed genes (DEGs). (a) The number of up- and down-regulated DEGs between comparative groups in sequential stages. (b) Venn diagram of DEGs among groups.
-
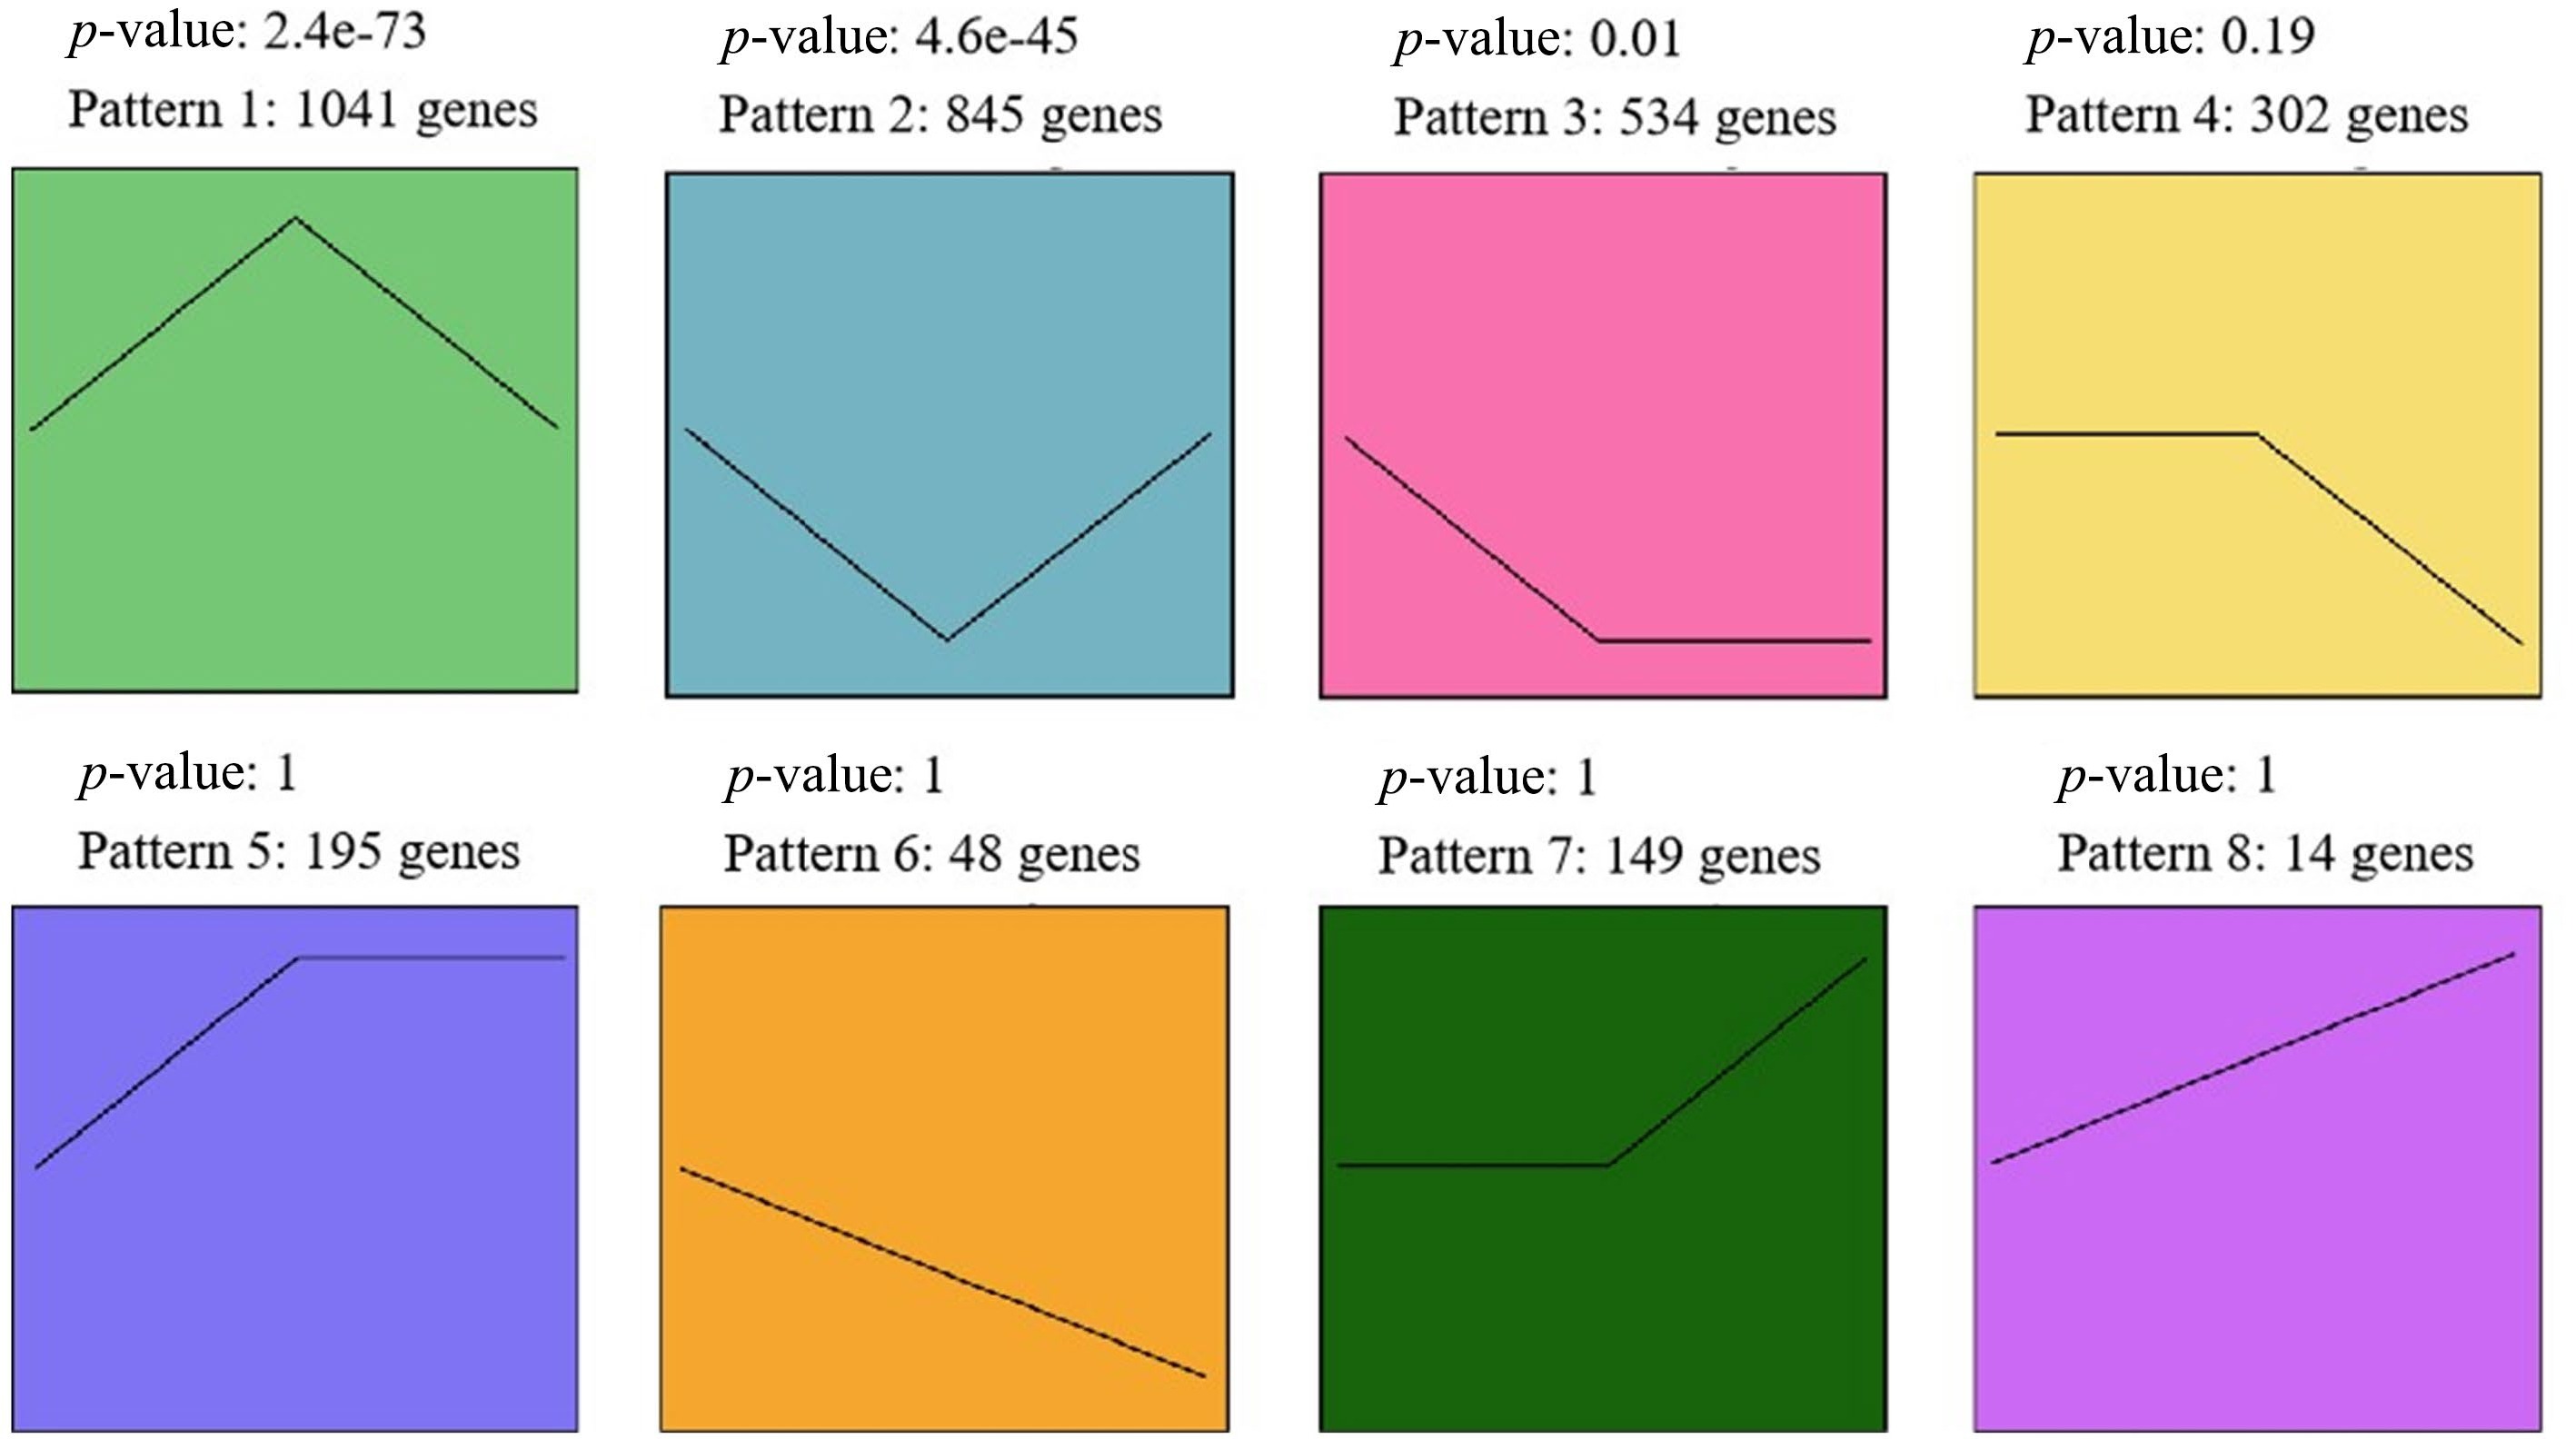
Figure 4.
Eight expression patterns across the three stages. Genes in pattern 1 were significantly up-regulated during F2 compared to F1 and F3; genes in pattern 2 were significantly down-regulated during F2 compared to F1 and F3.
-
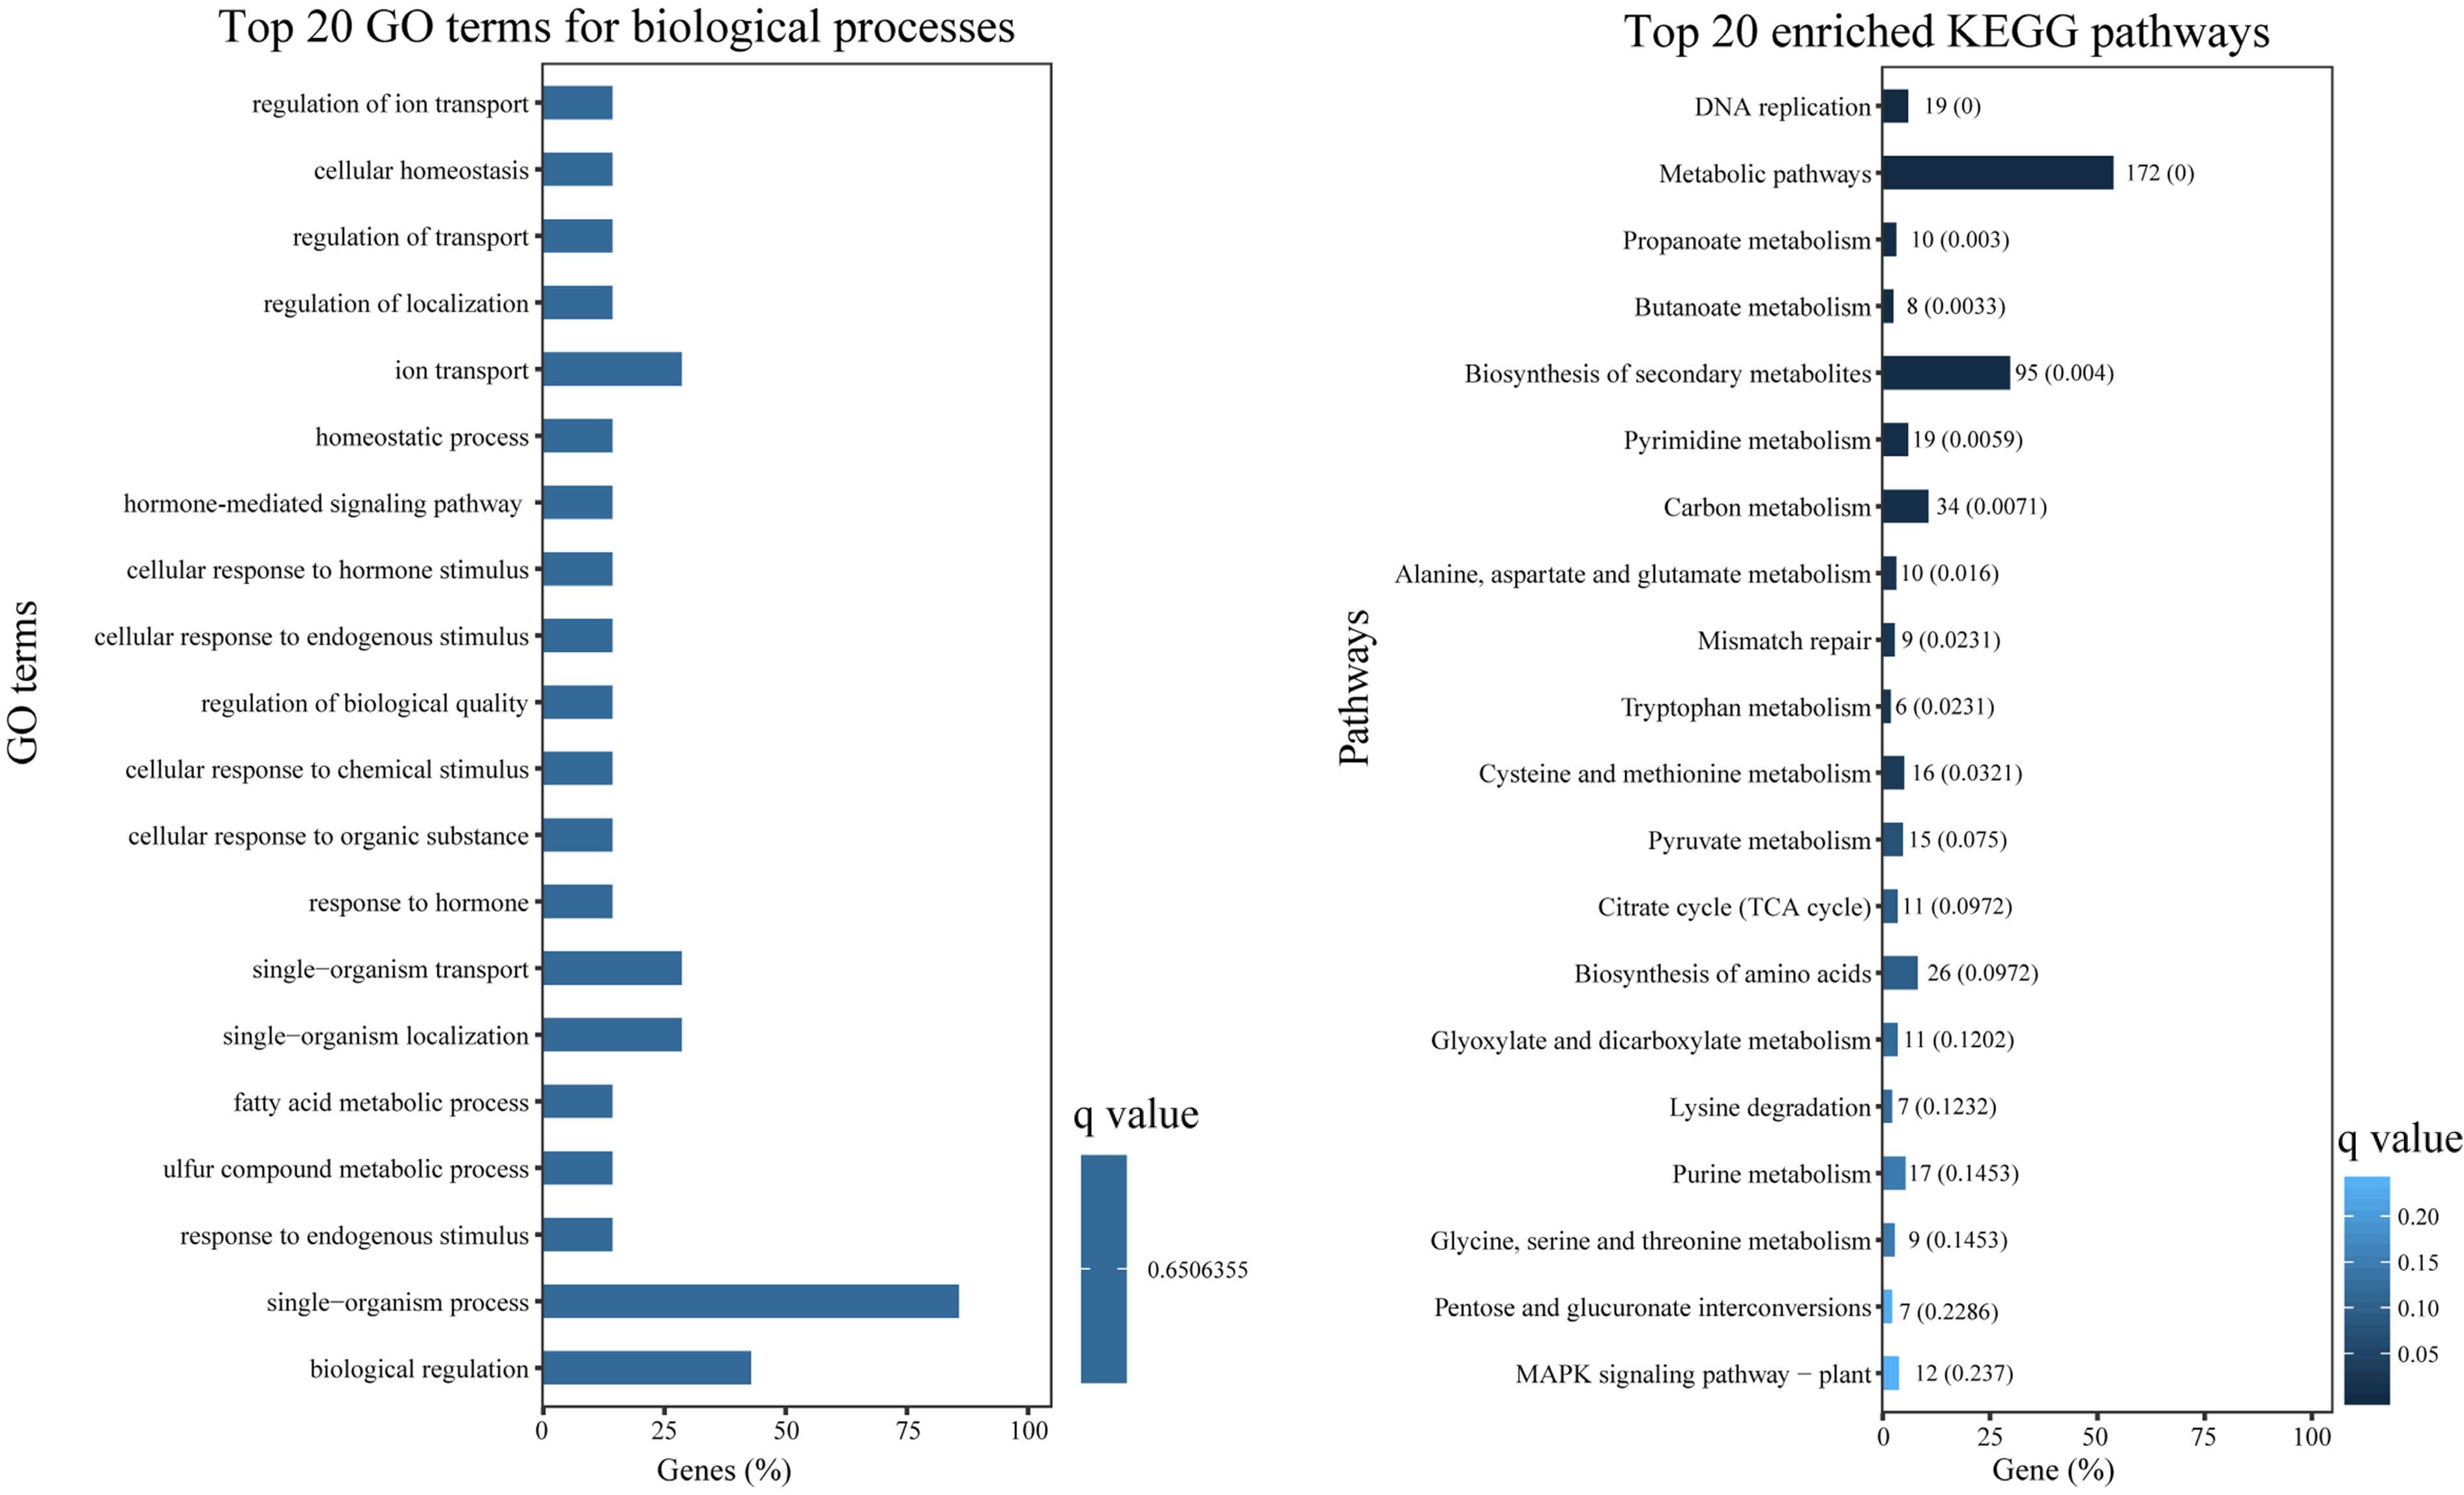
Figure 5.
GO enrichment and KEGG enrichment of DEGs. (a) The top 20 enriched GO terms in 'biological process' ontology. (b) The top 20 enriched KEGG pathways for DEGs.
-
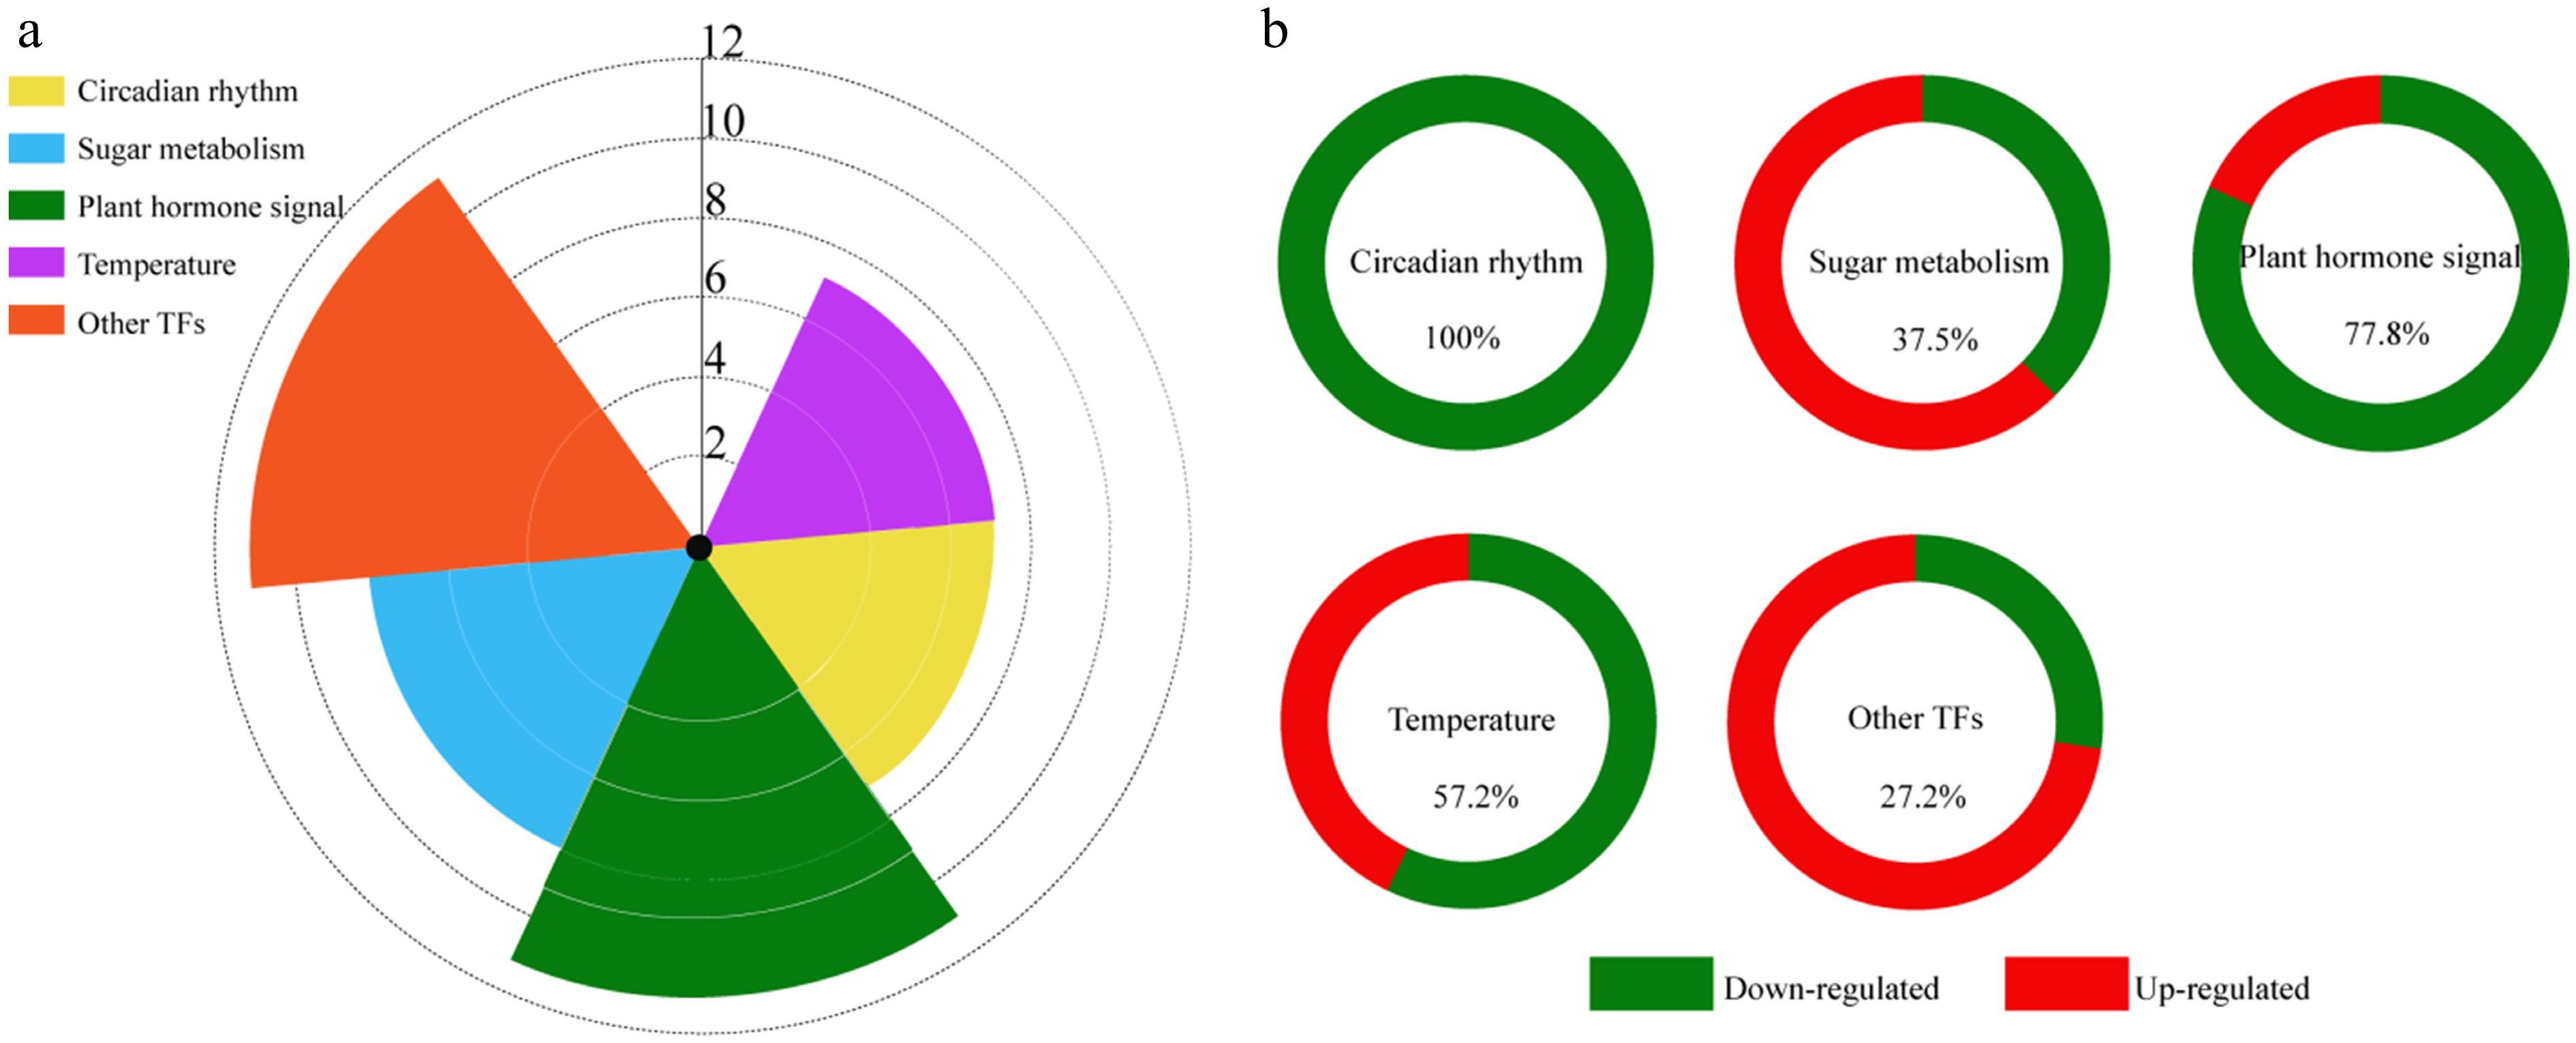
Figure 6.
DEGs related to floral bud differentiation. (a) Types and numbers of DEGs related to floral bud differentiation in Fritillaria pallidiflora. (b) Ratio of up- and down-regulated DEGs at F2 in each category.
-
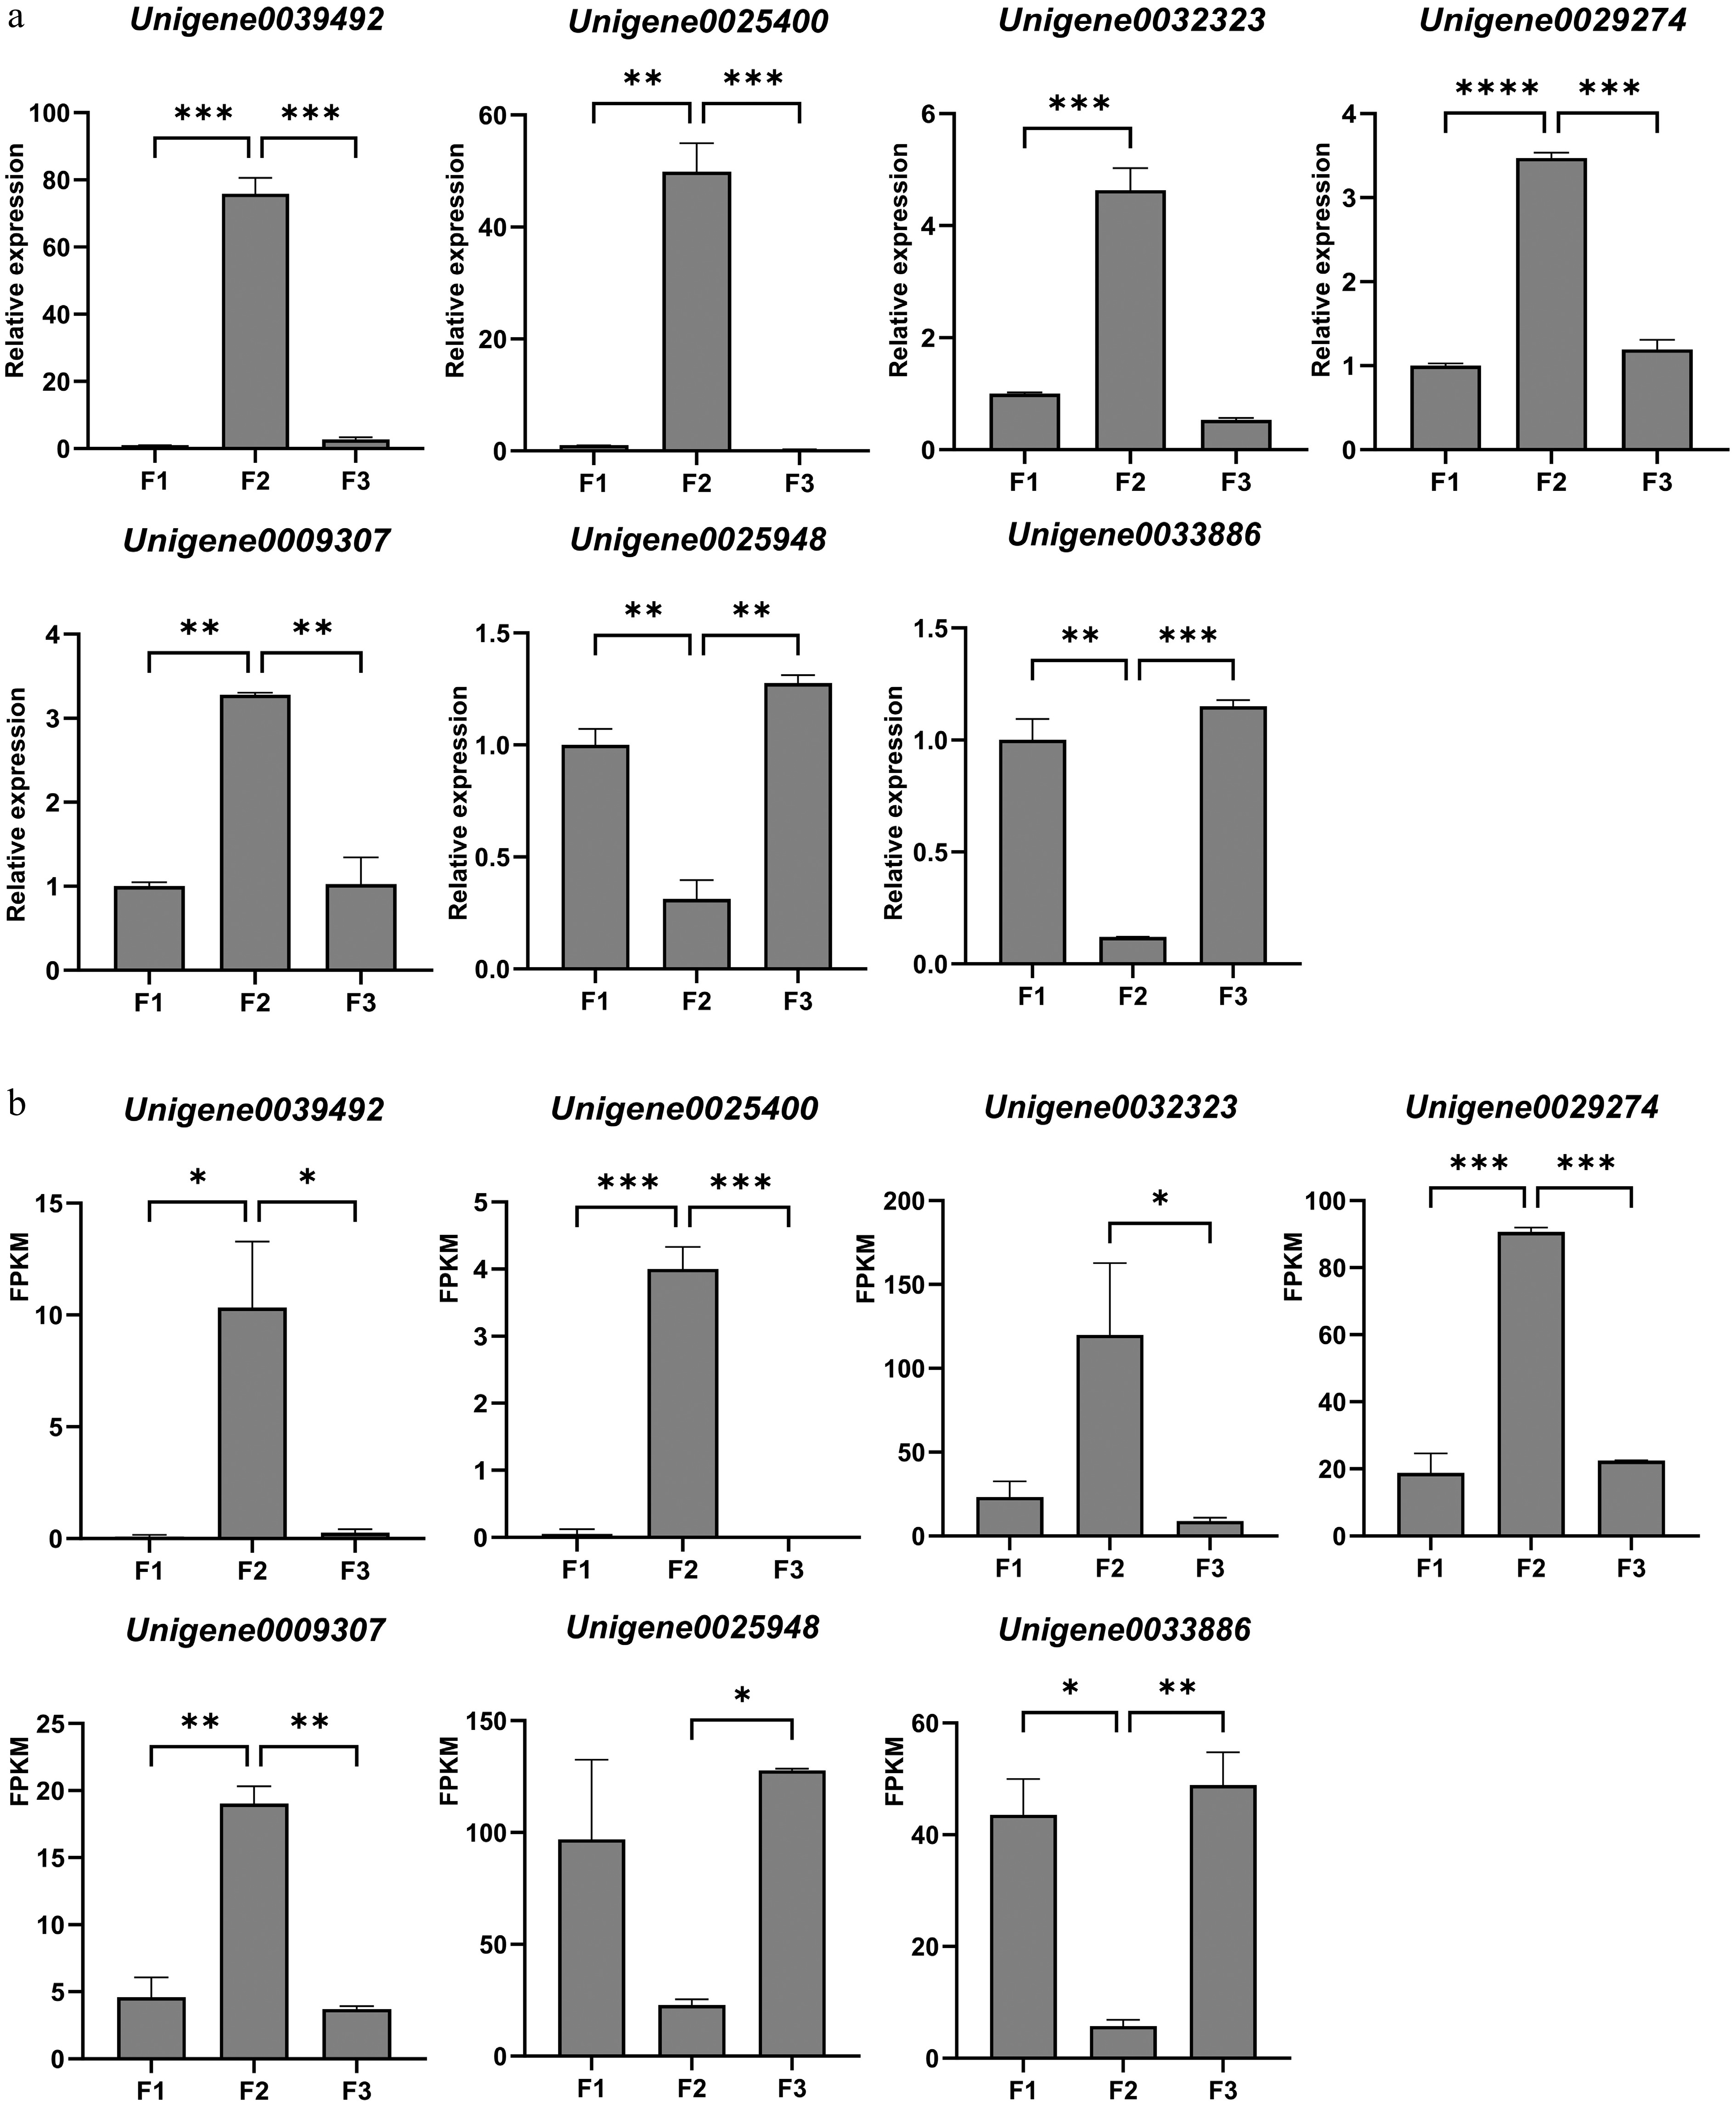
Figure 7.
Validation of the expression of selected DEGs from transcriptome data by qRT-PCR. (a) Relative expression results of qRT-PCR. (b) The FPKM value obtained from the transcriptome data. Values are means of three independent biological samples and each sample contains three plants. Error bars represent standard deviations and the statistical analysis was conducted using the Student's t-test. * denotes statistical significance, with the number of '*' corresponding to the level of significance (* p < 0.05; ** p < 0.01; *** p < 0.001; **** p < 0.0001).
-
Number Unigene ID Gene code Forward primer (5'→3') Reverse primer (5'→3') 1 Unigene0039492 MYB21 CCTCATCAGCCCCACCAAC CGTCATCTACACGACCAGCC 2 Unigene0025400 MYB308 CGCAGCTGGTTGAACCAAC GTGGAGAAGGGAGCTGGAG 3 Unigene0032323 MYB44 CTAACGAAGCCGCCATCTTC GGTGTGGAACTACATGTCGG 4 Unigene0029274 BHLH93 CCACCGTAGCCTGAACTCC GCTGACATCGACCATGAGC 5 Unigene0009307 MYB3R1 GTGGAGTTCTGCTGCTGTG CGGCAGTTCATTGCTGCTC 6 Unigene0025948 RAP2.9 CCGGTGCTATGTTCAGGTCAG ACACCGCCGTCTACTACCTC 7 Unigene0033886 PRR95 GACCGGCACTTCACTAGCT TAGCAGAGCAACGTCCTCG 8 Actin CATAATCCAGAGCCACATA TGCCAATCTACGAGGGTT Table 1.
List of primers used for qRT-PCR expression validation analysis.
-
Samples Number of reads Q20 (%) Q30 (%) Clean reads ratio (%) GC content (%) F1-1 728,21,844 97.94% 94.83% 97.54% 51.30% F1-2 678,43,116 97.70% 94.27% 96.95% 50.86% F2-1 721,00,898 97.93% 94.77% 97.64% 51.42% F2-2 640,60,984 97.84% 94.55% 97.45% 51.89% F3-1 642,17,358 98.06% 95.04% 97.79% 50.63% F3-2 640,44,064 98.04% 95.02% 97.78% 50.42% Table 2.
Data quality statistics for RNA-seq of Fritillaria pallidiflora flower buds.
-
Database Number of annotated unigenes Annotation (%) Nr 33,839 45.51 Swissprot 24,343 32.74 KOG 21,176 28.48 KEGG 13,957 18.77 Total 34,288 46.12 Table 3.
Statistics of gene annotation.
-
Pathways Unigene ID Gene name Annotation Expression pattern Expression trends Circadian rhythm Unigene0003638 CHS Chalcone synthase Pattern 2 F2 vs F1/F3 down Unigene0010964 EFP Early flowering protein Pattern 2 F2 vs F1/F3 down Unigene0024917 APRR3 Pseudo-response regulator Pattern 2 F2 vs F1/F3 down Unigene0033886 PRR95 Pseudo-response regulator Pattern 2 F2 vs F1/F3 down Unigene0040017 LHY Late elongated hypocotyl Pattern 2 F2 vs F1/F3 down Unigene0051073 PHYC Phytochrome C Pattern 2 F2 vs F1/F3 down Unigene0046922 FPA Flowering time control protein Pattern 2 F2 vs F1/F3 down Sugar Unigene0013557 SWEET14 Bidirectional sugar transporter Pattern 2 F2 vs F1/F3 down Unigene0045320 SP1 Starch phosphorylase Pattern 2 F2 vs F1/F3 down Unigene0048029 FBP Fructose-1,6-bisphosphatase Pattern 2 F2 vs F1/F3 down Unigene0014691 Susy1 SUS Pattern 1 F2 vs F1/F3 up Unigene0014693 Susy2 SUS Pattern 1 F2 vs F1/F3 up Unigene0014695 Susy3 SUS Pattern 1 F2 vs F1/F3 up Unigene0040753 Susy4 SUS Pattern 1 F2 vs F1/F3 up Unigene0033944 GBSSI Granule-bound starch synthase Pattern 1 F2 vs F1/F3 up Plant hormone signaling Unigene0021555 ABI5 ABA-insensitive Pattern 2 F2 vs F1/F3 down Unigene0022992 ERF1 Ethylene-responsive TF Pattern 2 F2 vs F1/F3 down Unigene0025948 RAP2.9 Ethylene-responsive TF Pattern 2 F2 vs F1/F3 down Unigene0041243 ABR1 Negative regulator of the ABA signaling pathway Pattern 2 F2 vs F1/F3 down Unigene0043547 GA3ox Gibberellin 2-β-dioxygenase Pattern 2 F2 vs F1/F3 down Unigene0015211 GASA1 Gibberellin-regulated protein Pattern 2 F2 vs F1/F3 down Unigene0025209 GASA2 Gibberellin-regulated protein Pattern 2 F2 vs F1/F3 down Unigene0025497 LOGL2 Cytokinin riboside 5'-monophosphate phosphoribohydrolase Pattern 1 F2 vs F1/F3 up Unigene0027601 CKX Cytokinin Dehydrogenase Pattern 1 F2 vs F1/F3 up Unigene0000376 ERF084 Ethylene-responsive TF Pattern 2 F2 vs F1/F3 down Unigene0073846 ARF Auxin response factor Pattern 2 F2 vs F1/F3 down Temperature Unigene0005515 HSF1 Heat stress TF Pattern 1 F2 vs F1/F3 up Unigene0036323 HSF2 Heat stress TF Pattern 2 F2 vs F1/F3 down Unigene0044090 HSP1 HSP Pattern 1 F2 vs F1/F3 up Unigene0050601 HSP2 HSP Pattern 1 F2 vs F1/F3 up Unigene0026481 HSP3 HSP Pattern 2 F2 vs F1/F3 down Unigene0033204 HSP4 HSP Pattern 2 F2 vs F1/F3 down Unigene0062240 HSP5 HSP Pattern 2 F2 vs F1/F3 down Other TFs Unigene0023294 WRKY71 WRKY 71 Pattern 2 F2 vs F1/F3 down Unigene0031385 MYB1R1 Myb 1R-1 Pattern 2 F2 vs F1/F3 down Unigene0039108 MYBX Myb-like protein X Pattern 2 F2 vs F1/F3 down Unigene0008589 BZIP bZIP-like protein Pattern 1 F2 vs F1/F3 up Unigene0009307 MYB3R1 Myb-related protein 3R-1 Pattern 1 F2 vs F1/F3 up Unigene0025400 MYB308 Myb-related protein 308 Pattern 1 F2 vs F1/F3 up Unigene0026858 NAC38 NAC domain-containing protein 38 Pattern 1 F2 vs F1/F3 up Unigene0029274 BHLH93 bHLH93 Pattern 1 F2 vs F1/F3 up Unigene0032323 MYB44 MYB44 Pattern 1 F2 vs F1/F3 up Unigene0039492 MYB21 Myb protein 21 Pattern 1 F2 vs F1/F3 up Unigene0068674 BHLH53 bHLH53 Pattern 1 F2 vs F1/F3 up ABA, abscisic acid; HSP, heat shock protein; SUS, Sucrose synthase; TF, transcription factor. Table 4.
Candidate genes potentially related to floral bud differentiation of Fritillaria pallidiflora.
Figures
(7)
Tables
(4)