-
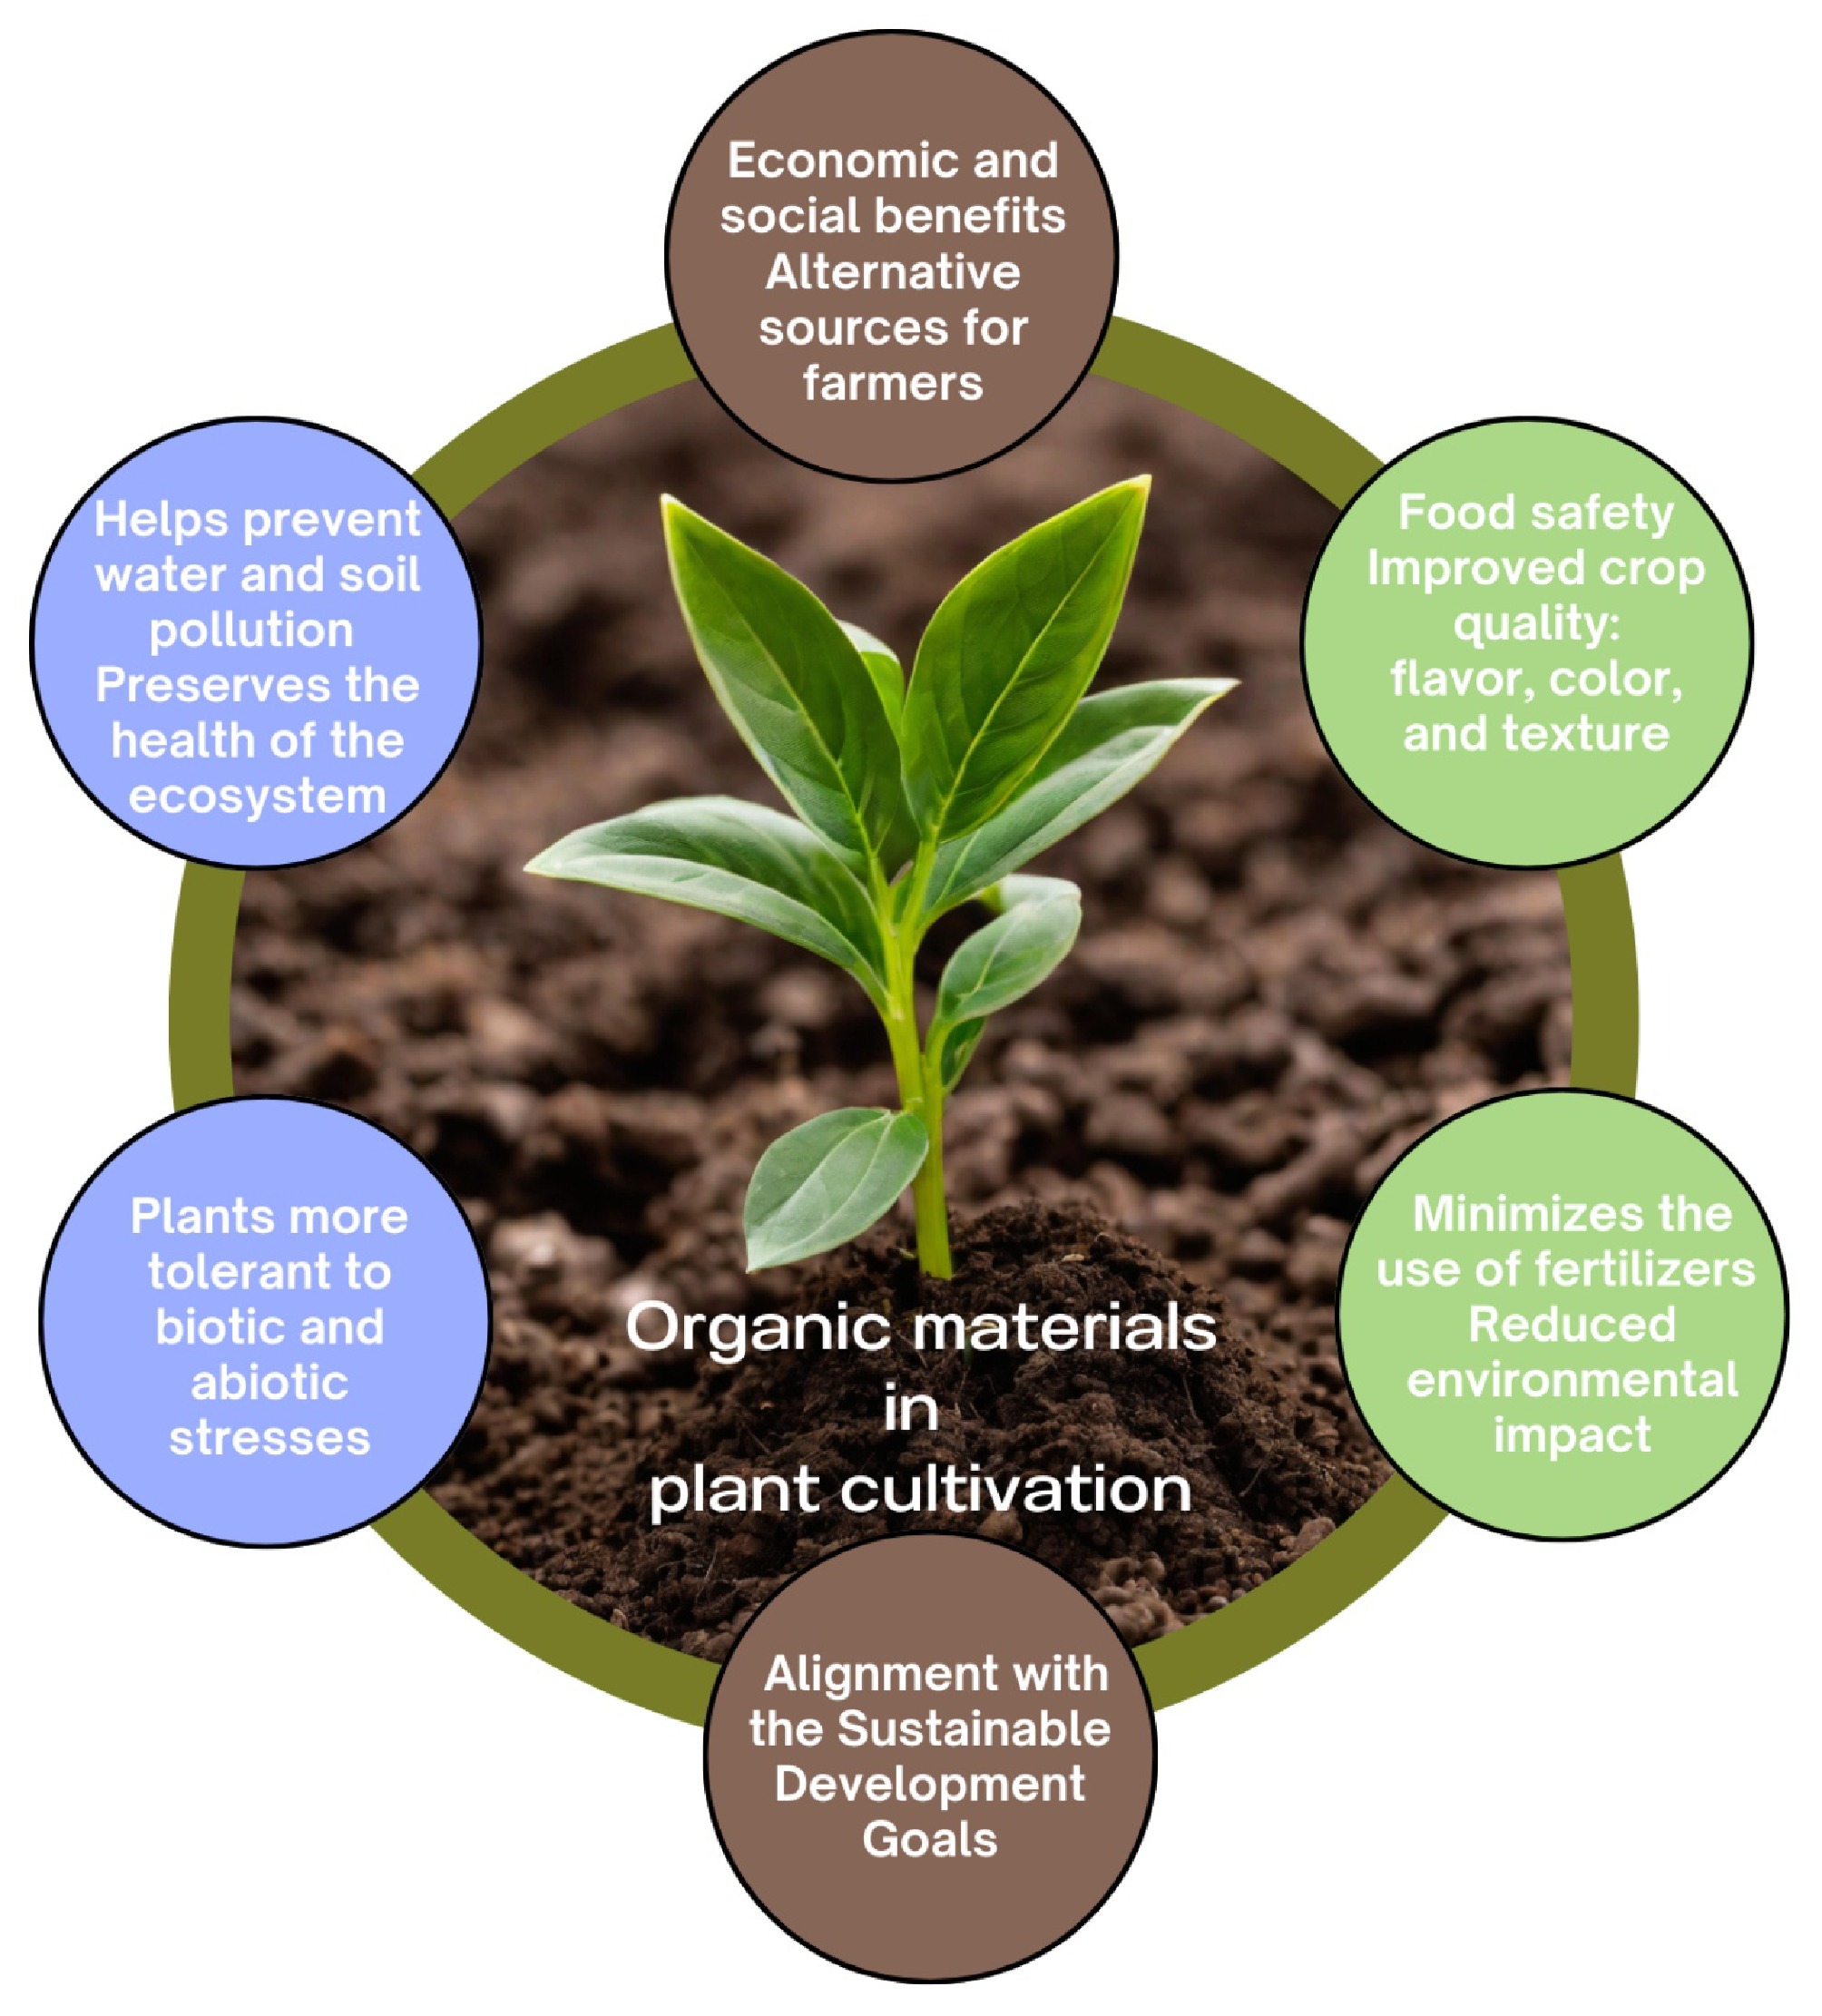
Figure 1.
The main benefits of using organic materials from agro-industrial waste with a focus on the conservation of natural resources with sustainable plant cultivation.
-
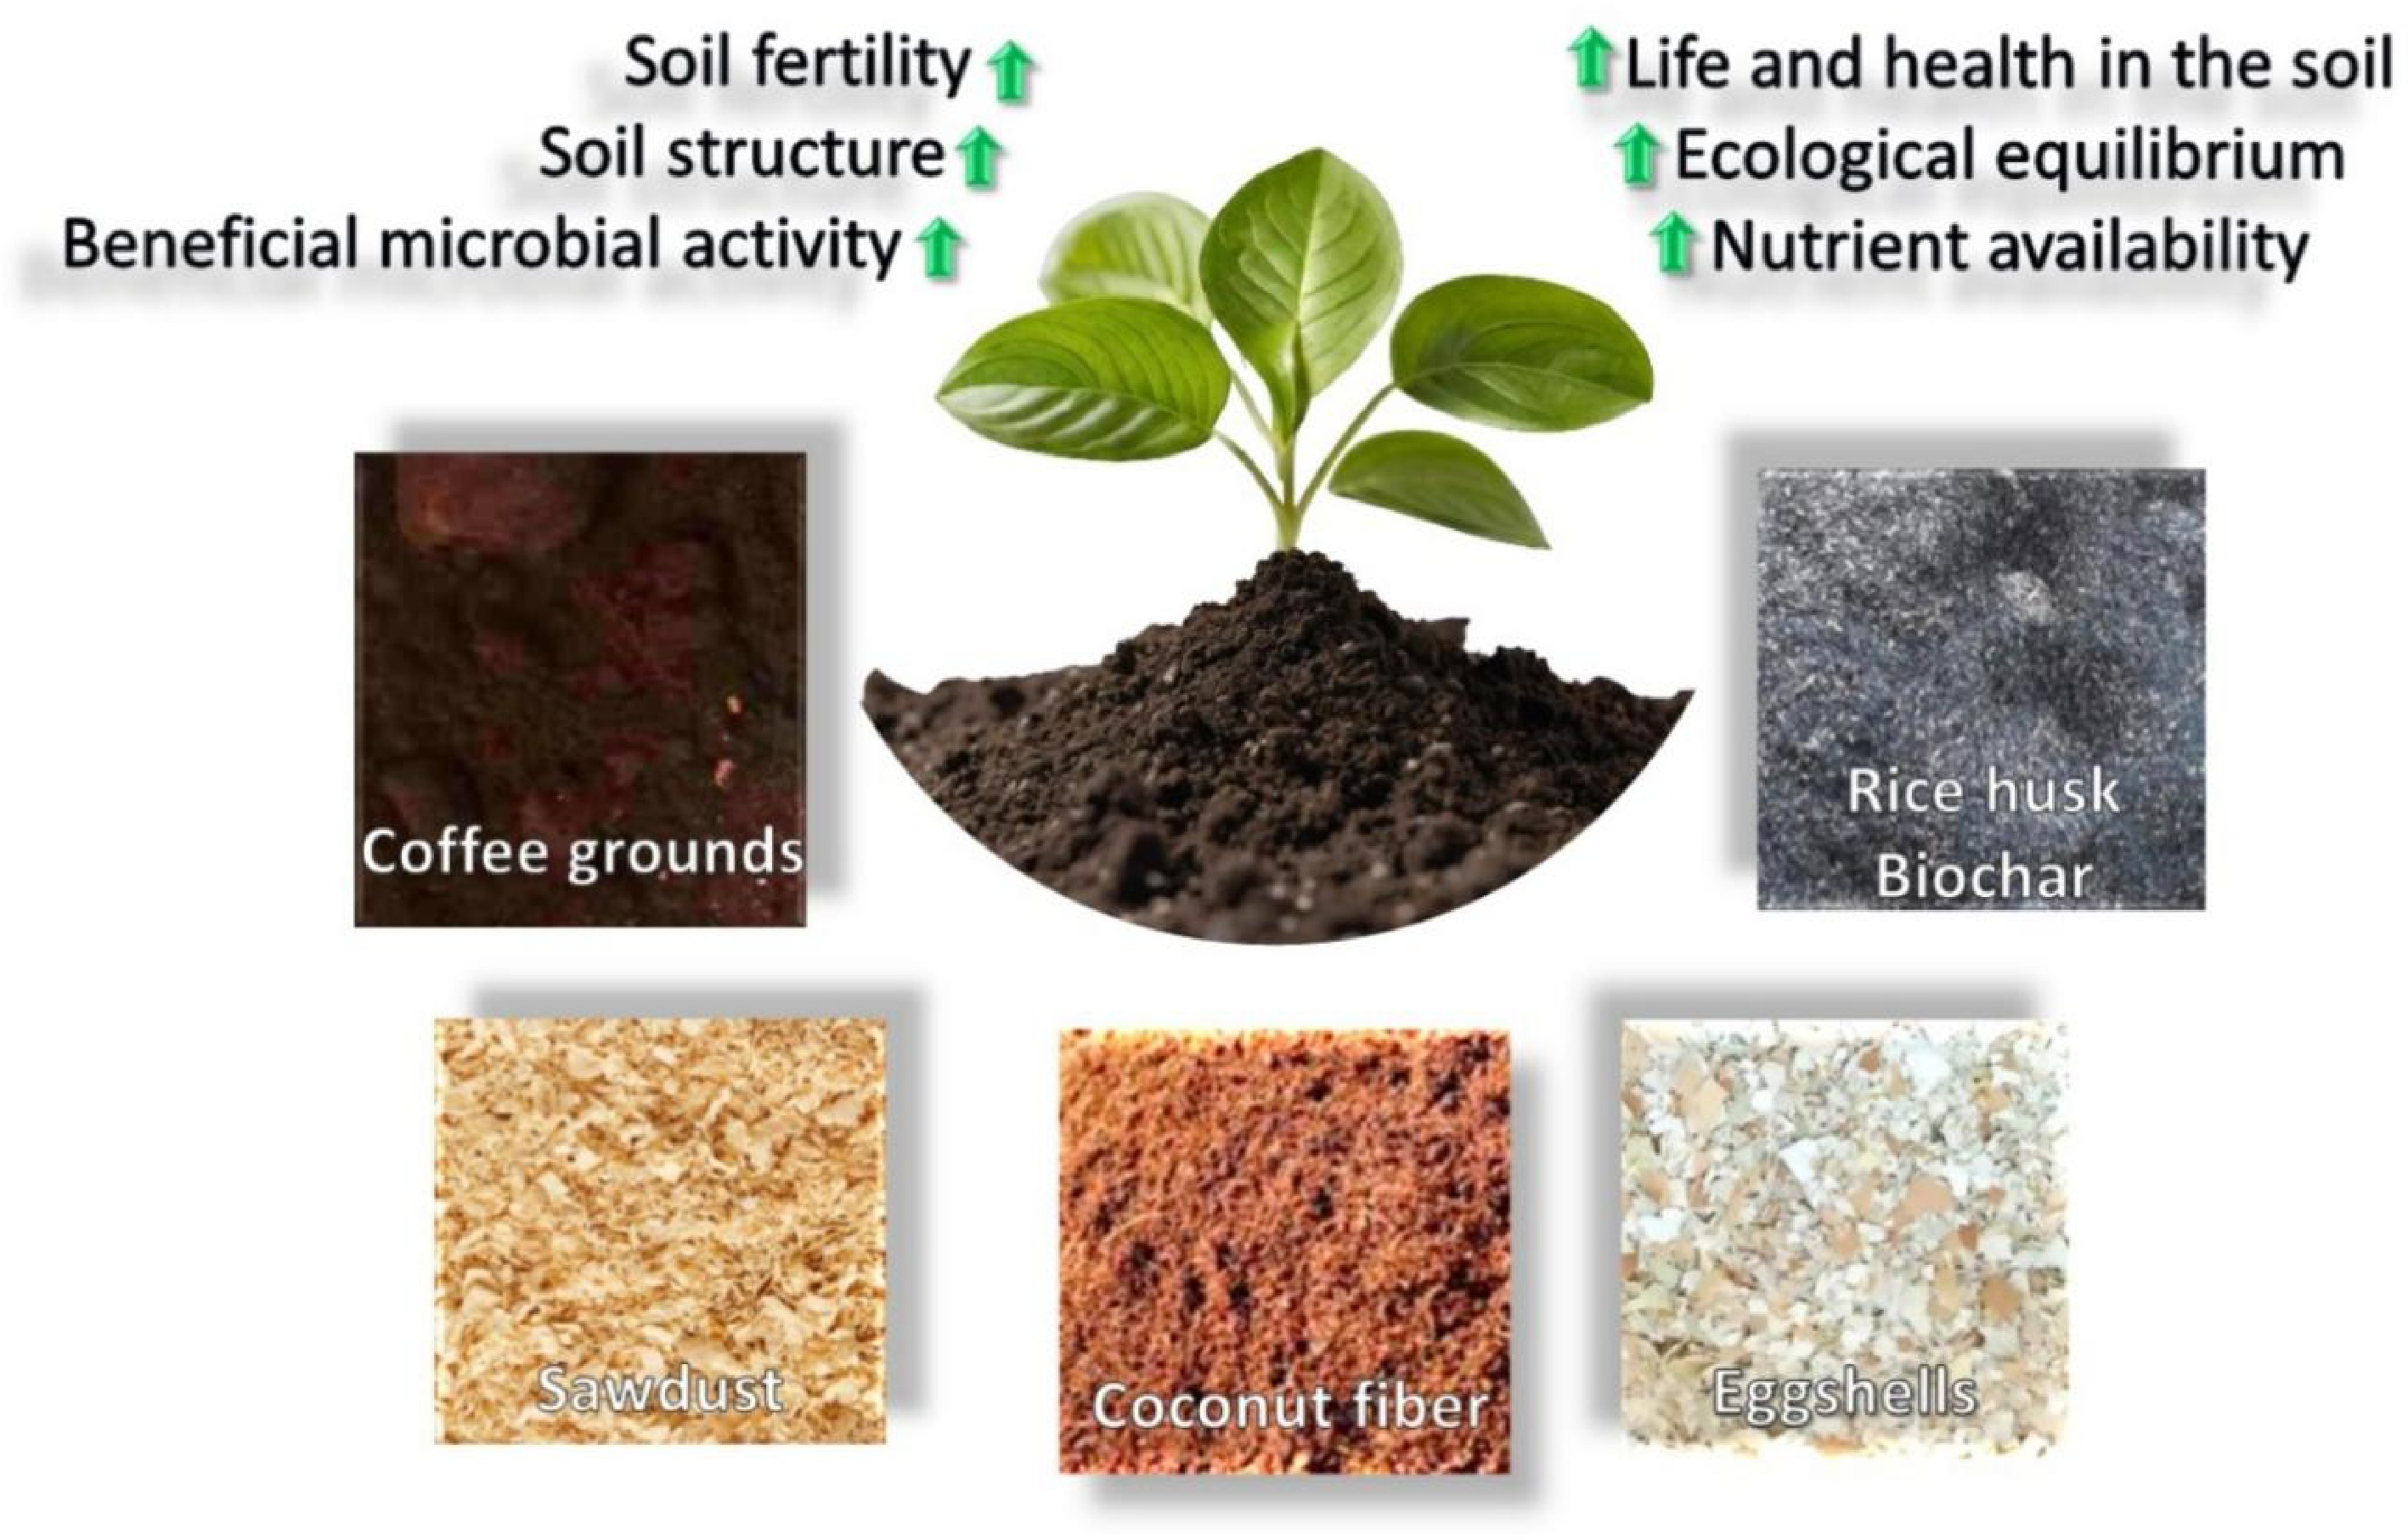
Figure 2.
Benefits of organic materials for the soil-plant system.
-
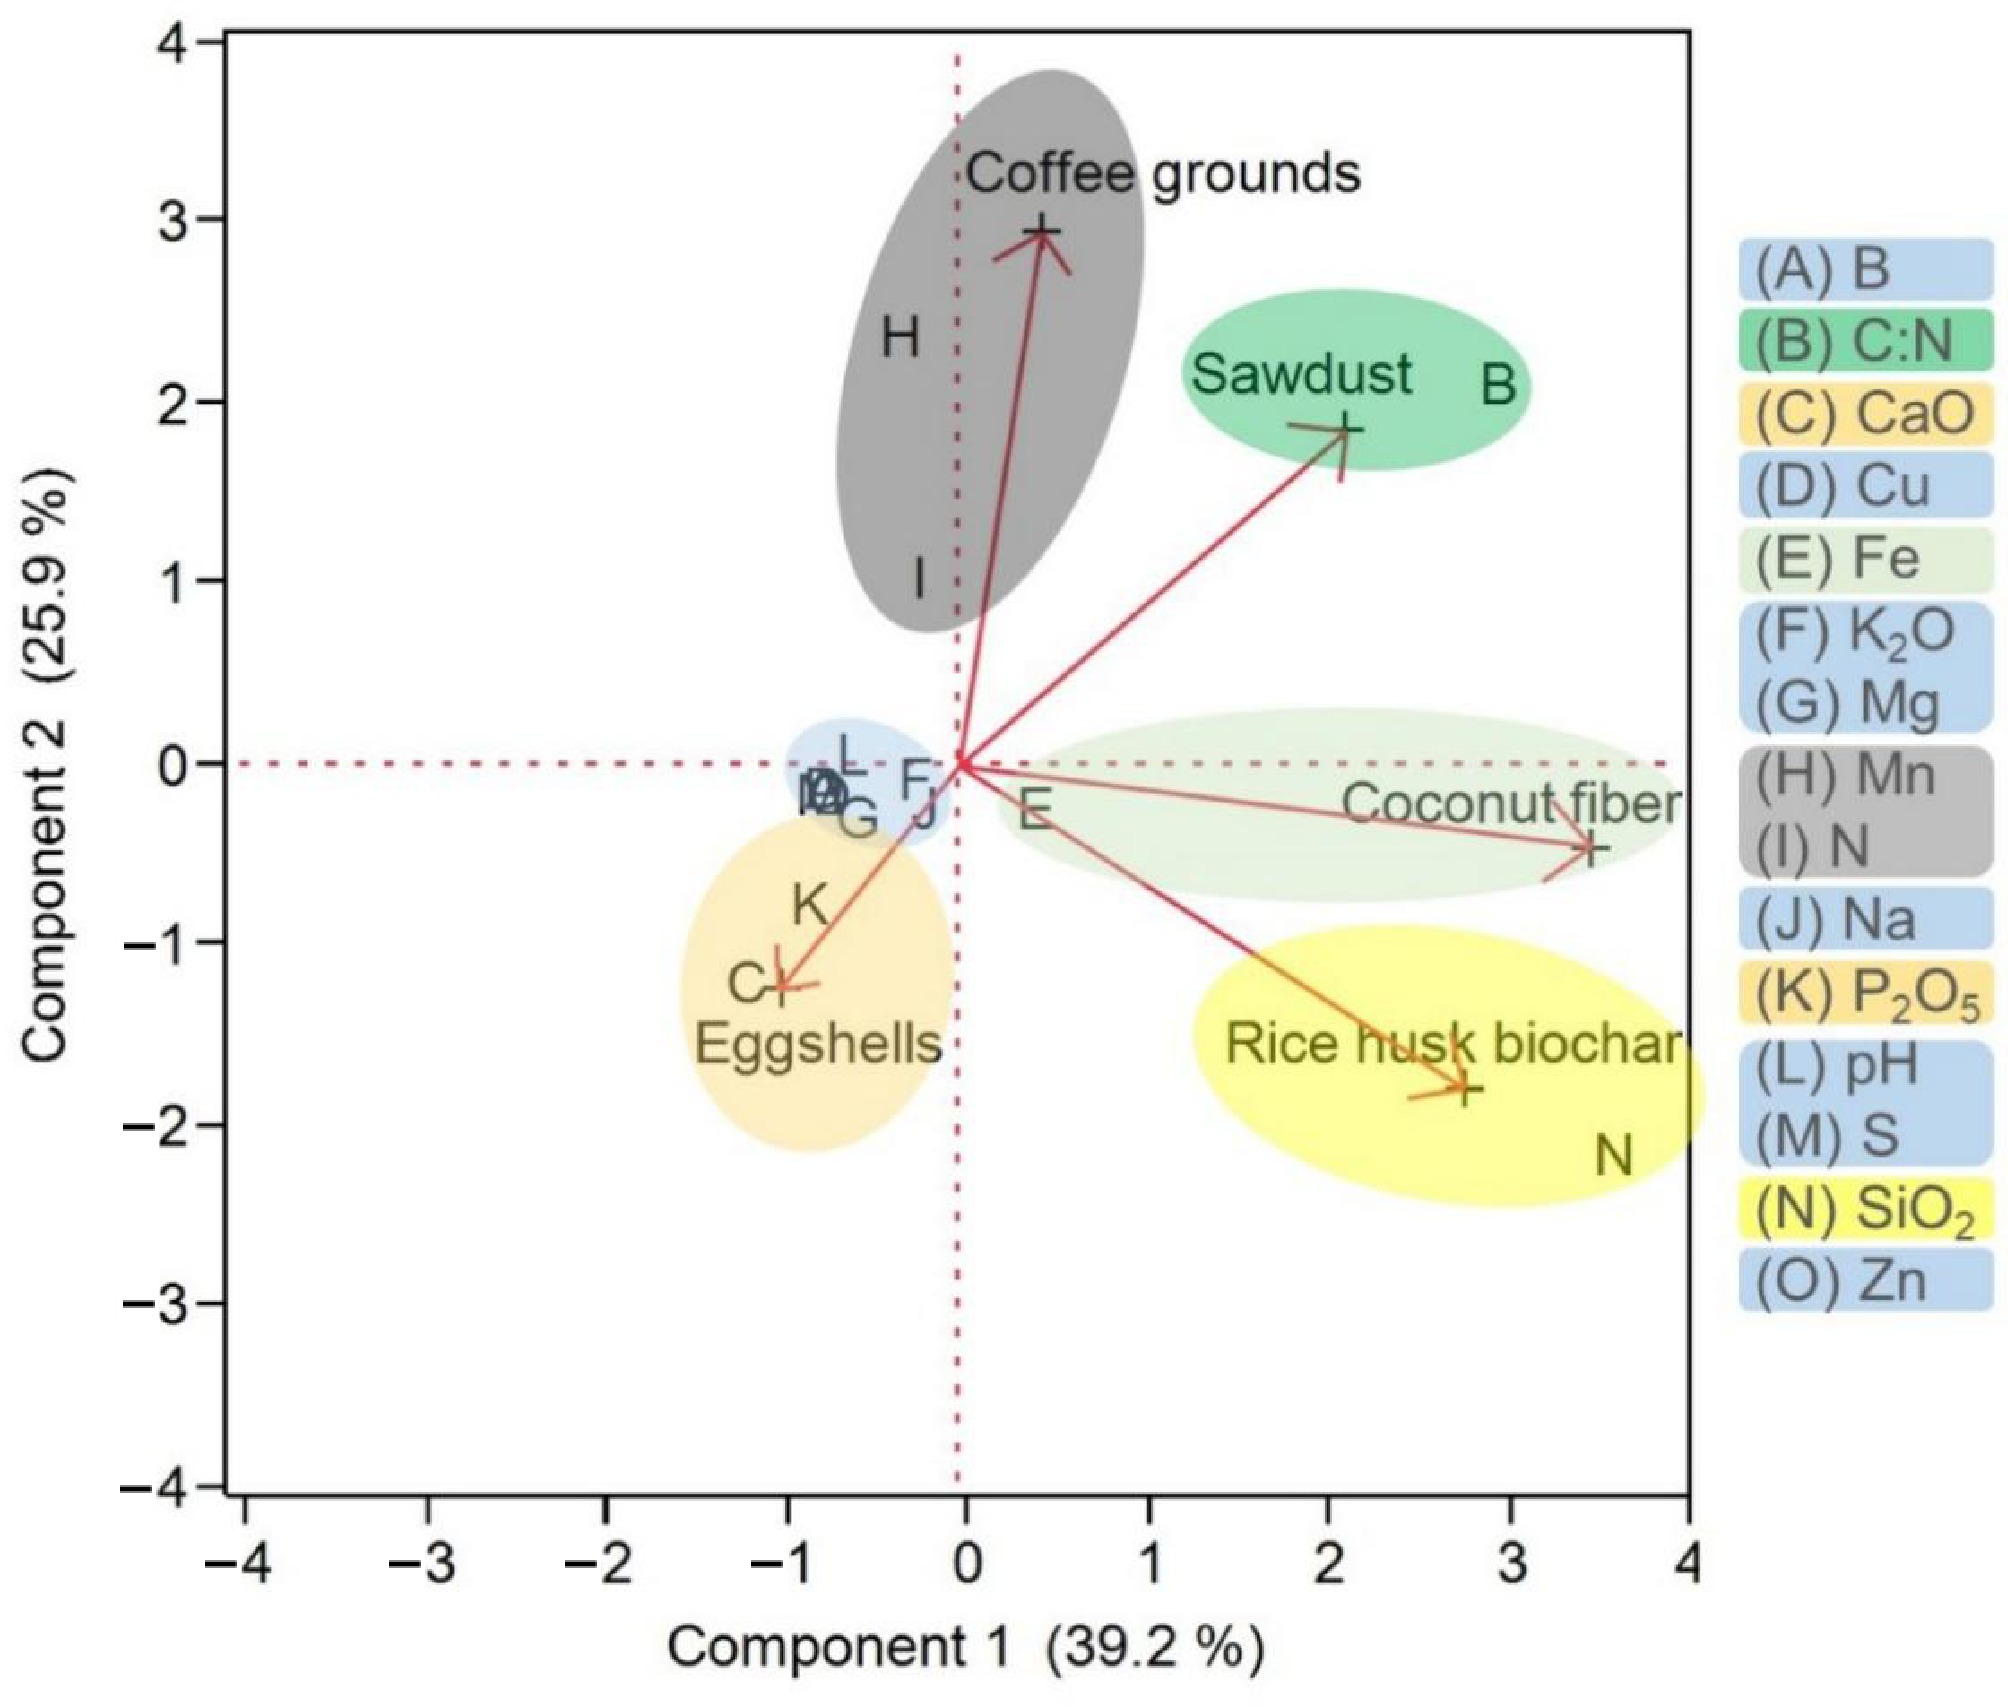
Figure 3.
Principal component analysis (PCA) biplot of agro-industrial wastes based on their mineral composition, pH, and C:N ratios as described in Table 2. Each of the five wastes is represented by a different vector, so that vectors that are close together tend to have similar mineral profiles, while those on opposite sides or directions of the graph have contrasting mineral compositions. The letters in the graph represent the 15 minerals and properties (labeled A–O) measured in the residues, so letters that are close together indicate a positive correlation between these variables, while letters located in opposite directions indicate a negative correlation. The illustrative ellipses highlight the affinity between the waste and the mineral, except for the blue ellipse that highlights the similarity only between minerals. This biplot was generated using JMP 10 statistical software (SAS Institute Inc., USA).
-
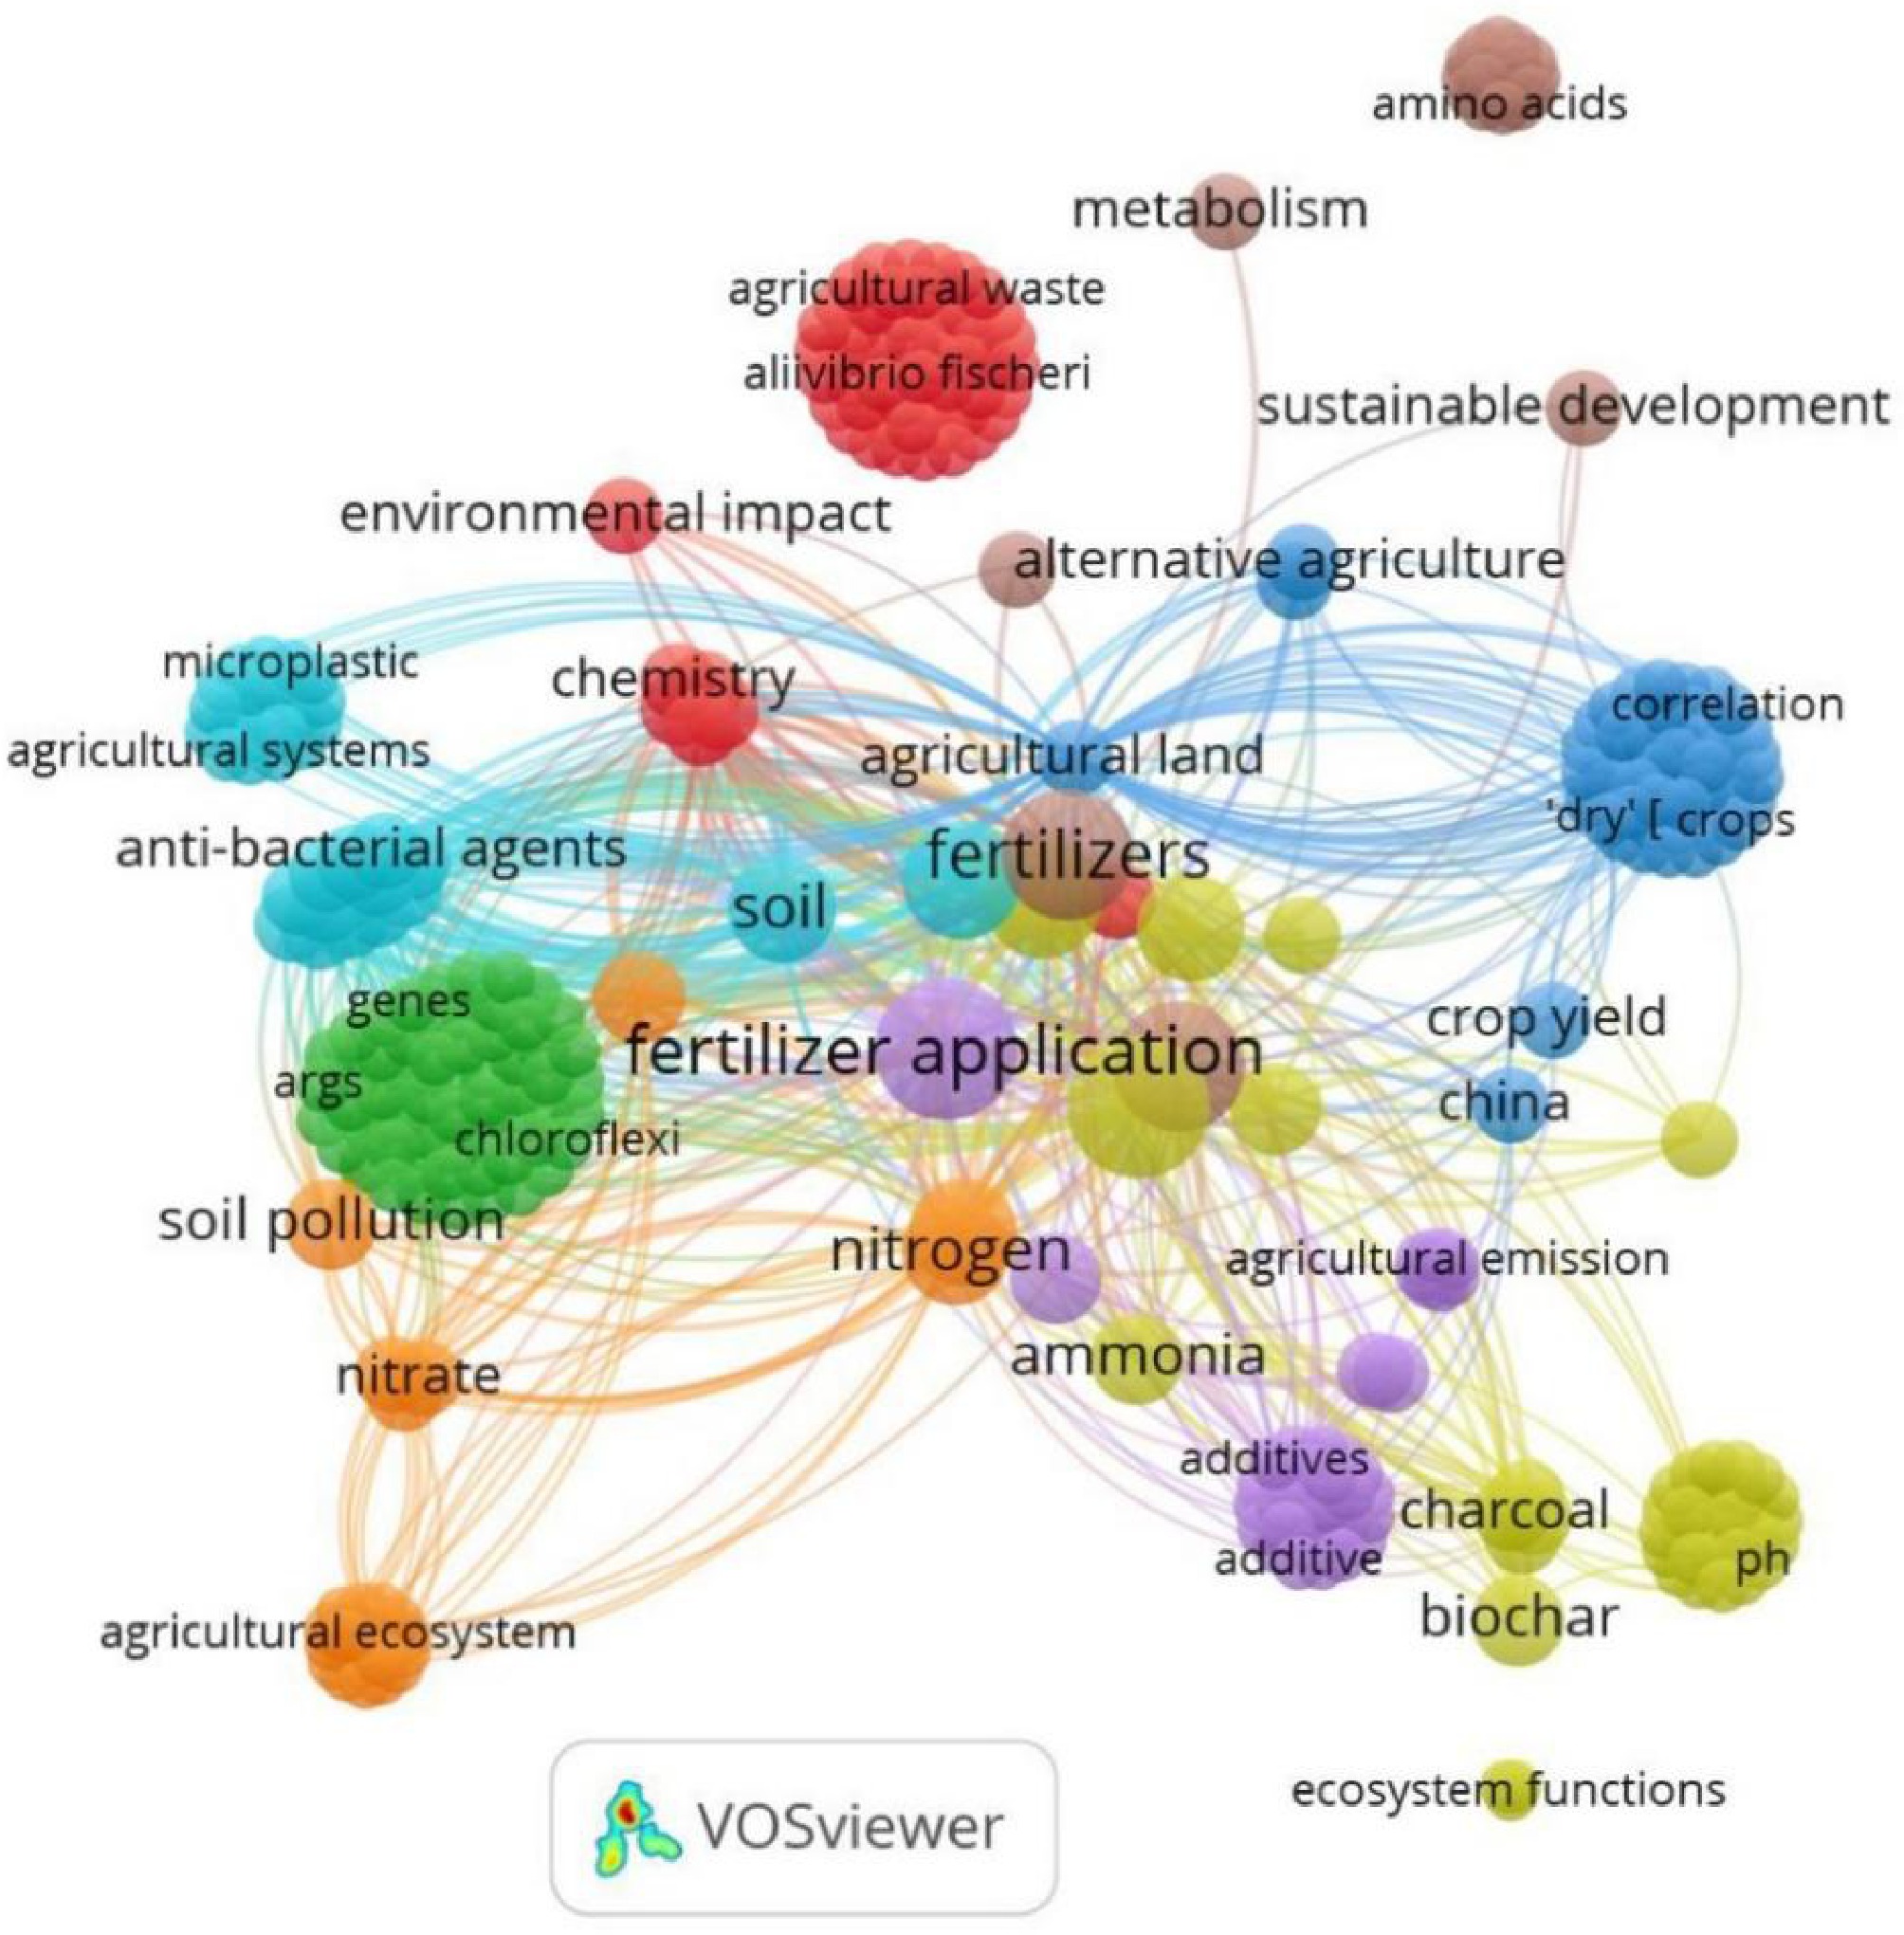
Figure 4.
Clustering of the words most used by the authors in the title and keywords. The size of the bubble shows the volume of words appearing, the thickness of the lines shows the strength of the link, and the color shows the grouping.
-
Coconut fiber1 Coffee grounds2 Eggshells3 Rice husk4 Sawdust5 China 125,026 300,000 3,862,169 42,880,774 14,500,000 India 3,995,100 76,200 790,212 39,085,000 5,300,000 United States 218,000 1,528,500 724,272 1,739,944 4,200,000 Indonesia 5,157,098 287,400 873,280 10,883,059 3,800,000 Pakistan 7,478 1,000 148,876 2,796,802 1,700,000 Nigeria 67,658 8,818 66,138 1,668,400 1,300,000 Brazil 40,000,000 1,353,600 387,831 2,332,121 2,600,000 Bangladesh 123,590 501,000 108,466 11,388,911 1,000,000 Russia 4,200 255,000 302,381 215,282 3,900,000 Mexico 335,954 179,100 387,103 51,408 2,100,000 Ref. [22] [23−26] [27] [28,29] [30,31] 1Coconut fiber: Calculated assuming that approximately 30% of the coconut fruit's weight is coir fiber. 2Coffee grounds: Estimated using average coffee consumption per capita and the approximation that roasted coffee generates approximately 65% of its weight as spent coffee grounds. 3Eggshells: The average weight of 60 g per egg was considered, with a shell weight of 10%. These data are only for eggshells generated by consumption, they do not consider the shells of eggs generated by artificial incubators, so these values may be much higher. 4Rice husk: represents 20% of the total rice grain. 5Sawdust: Calculated as a byproduct of industrial timber processing, assuming an average generation rate of 10%–20% sawdust per cubic meter of processed wood, depending on the scale and efficiency of operations. Table 1.
Amount (tons/annum) of organic waste produced in the world's most populous countries.
-
Minerals
(g/kg)Coconut fiber Coffee grounds Eggshells Rice husk biochar Sawdust1 N 20.00 25.61 12.14 10.00 1.25 P2O5 11.56 1.53 125.50 40.00 0.075 K2O 20.05 5.06 6.50 50.00 0.30 CaO 12.43 1.77 224.15 15.00 1.50 Mg 16.01 1.48 36.00 3.00 0.30 S 0.50 0.87 12.50 0.60 0.075 B 0.001 0.001 0.0002 0.003 0.01 Fe 64.04 1.50 0.022 0.01 0.035 Mn 6.00 49.00 0.0009 0.53 0.02 Cu 0.01 0.034 0.0009 0.01 0.0075 Zn 1.20 0.0165 0.0009 0.06 0.0075 SiO2 123.46 1.00 4.50 250.00 0.15 Na 30.65 0.13 1.09 0.12 0.03 pH 6.90 5.10 9.24 7.63 5.00 C:N 100:1 20:1 17:1 85:1 500:1 Ref. [56−58] [4,59] [4,60,61] [43,62−66] [67,68] 1Sawdust: These values can vary depending on the type of wood and its geographical origin, and after burning the ash can contain up to around 100 times more nutrients. Table 2.
Mineral composition of organic materials and other chemical properties.
Figures
(4)
Tables
(2)