-
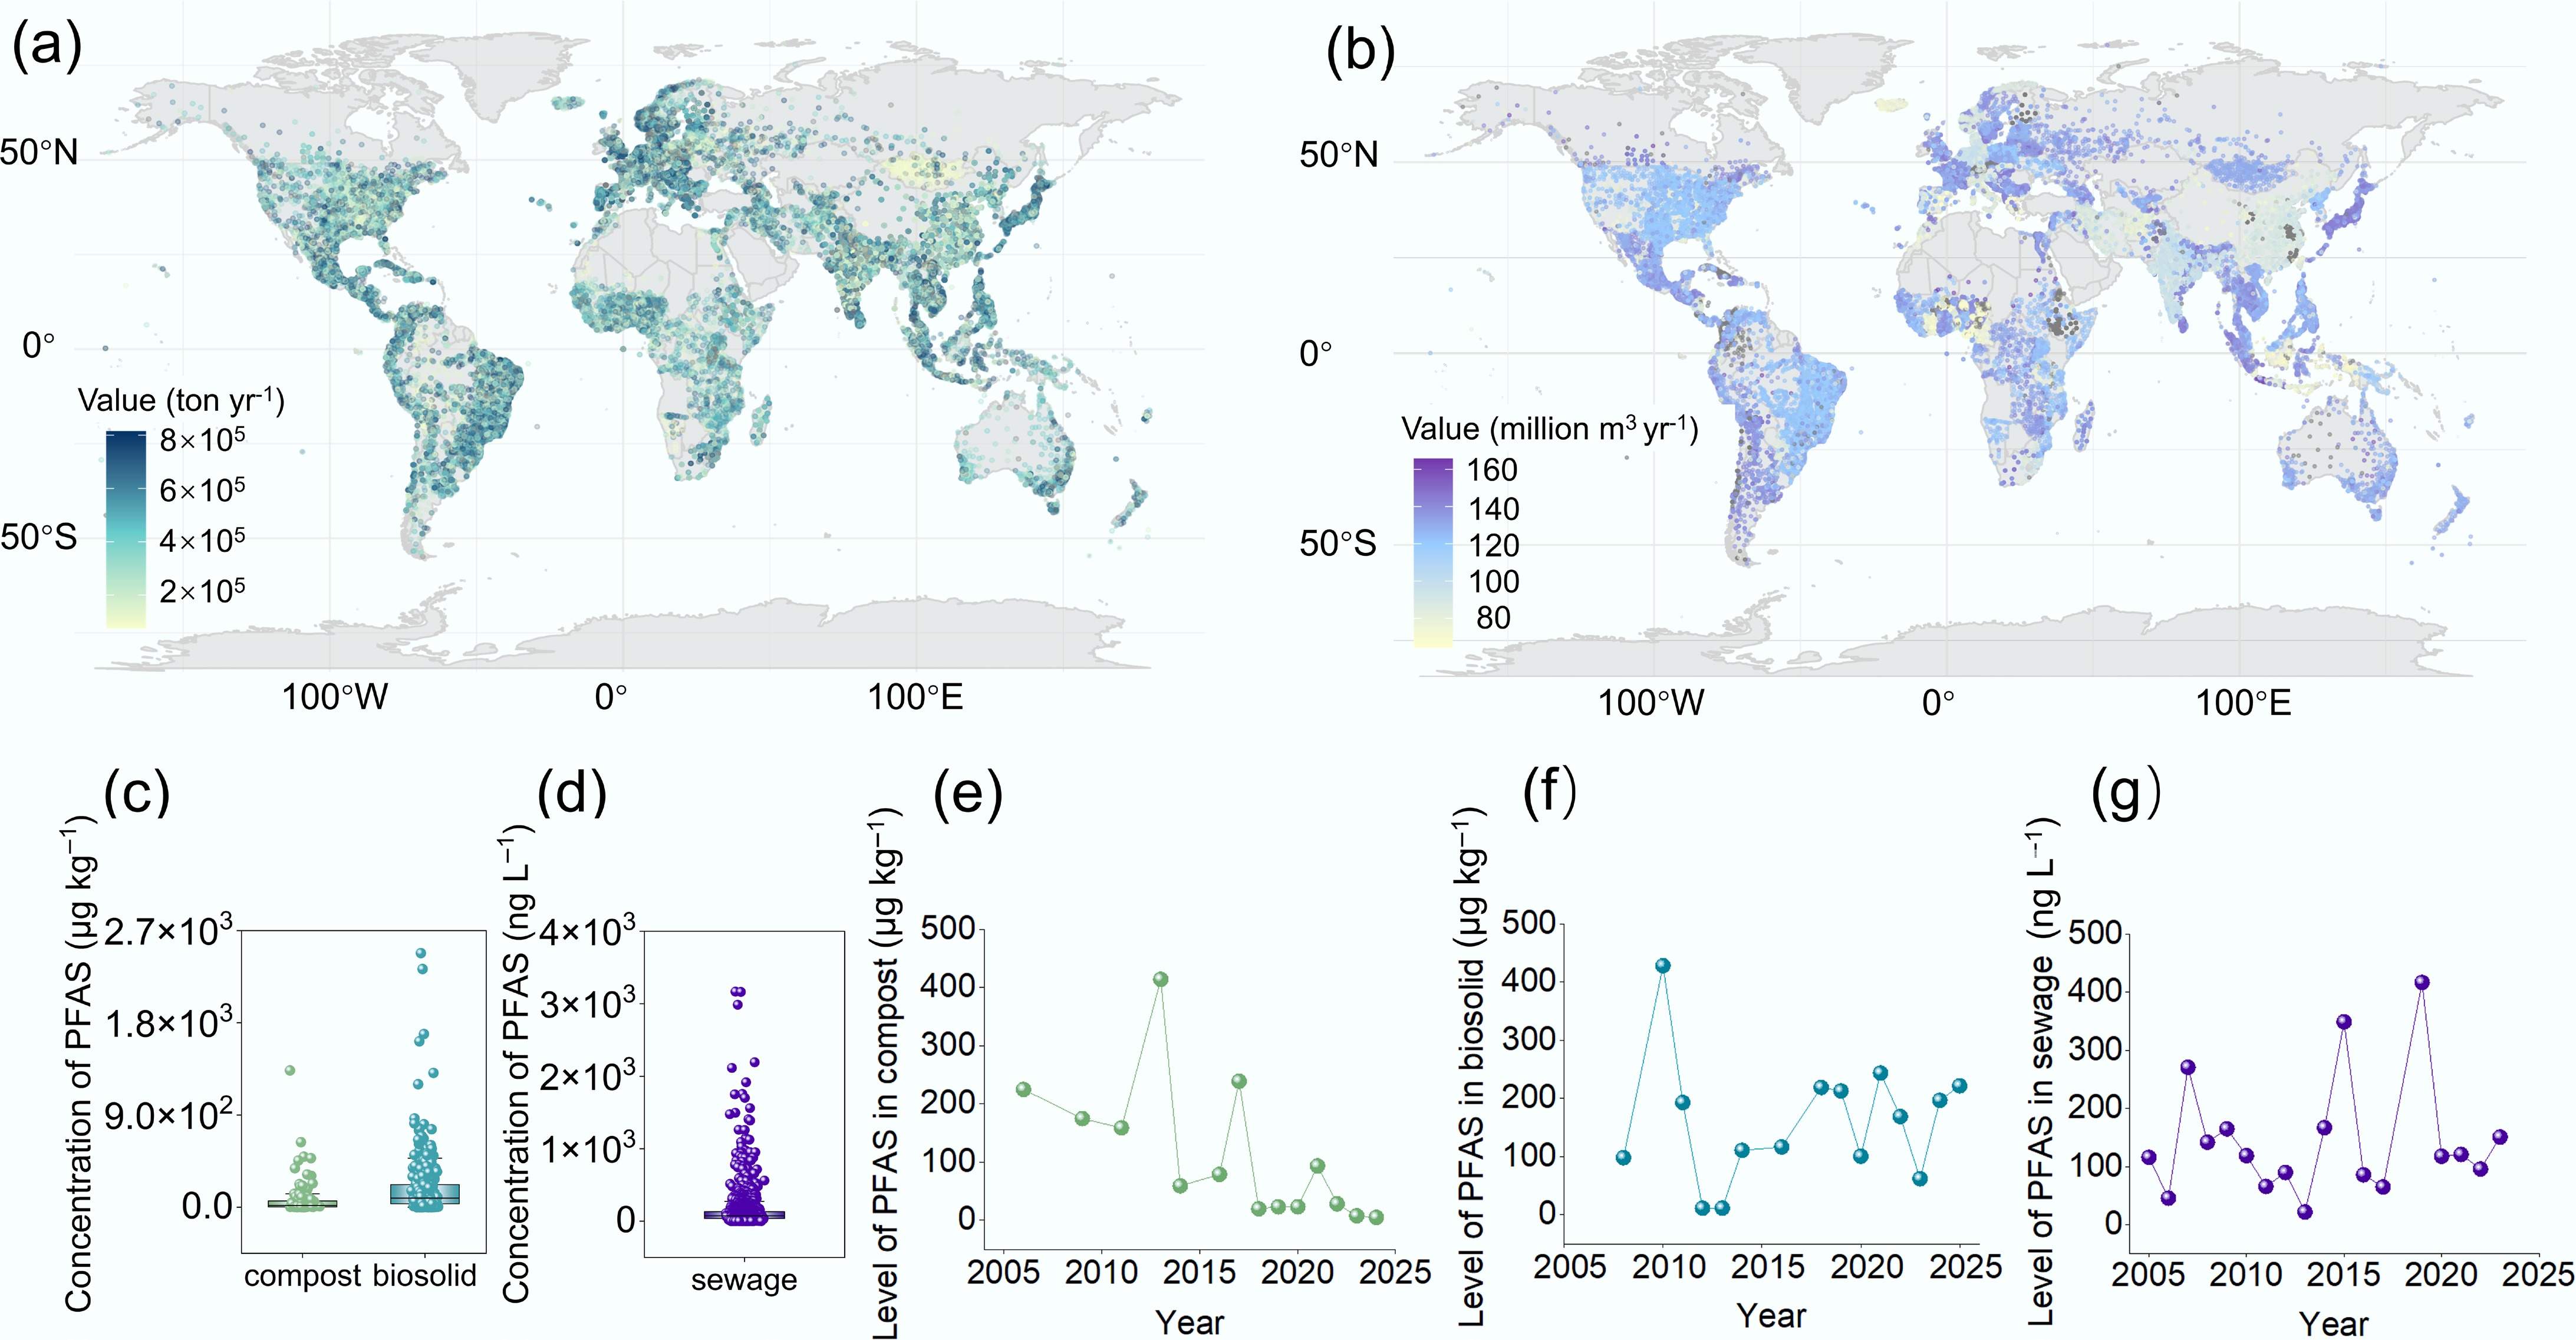
Figure 1.
Global waste and sewage production and PFAS concentrations in compost, biosolids, and sewage. (a) Global solid waste generation. (b) Global sewage production. (c) PFAS concentrations in compost (n = 108), and biosolids (n = 332), retrieved from the Web of Science and analyzed statistically. (d) PFAS concentrations in sewage (n = 1,536), retrieved from the Web of Science and analyzed statistically (excluding ultrashort-chain fluorides). Details of the search methodology are provided in the Supplementary Text S1 and Text S2. Yearly trends in PFAS concentrations in (e) compost, (f) biosolids, and (g) sewage from 2005 to 2025. In each box plot, the horizontal line indicates the average value, and the small square indicates the median value.
-
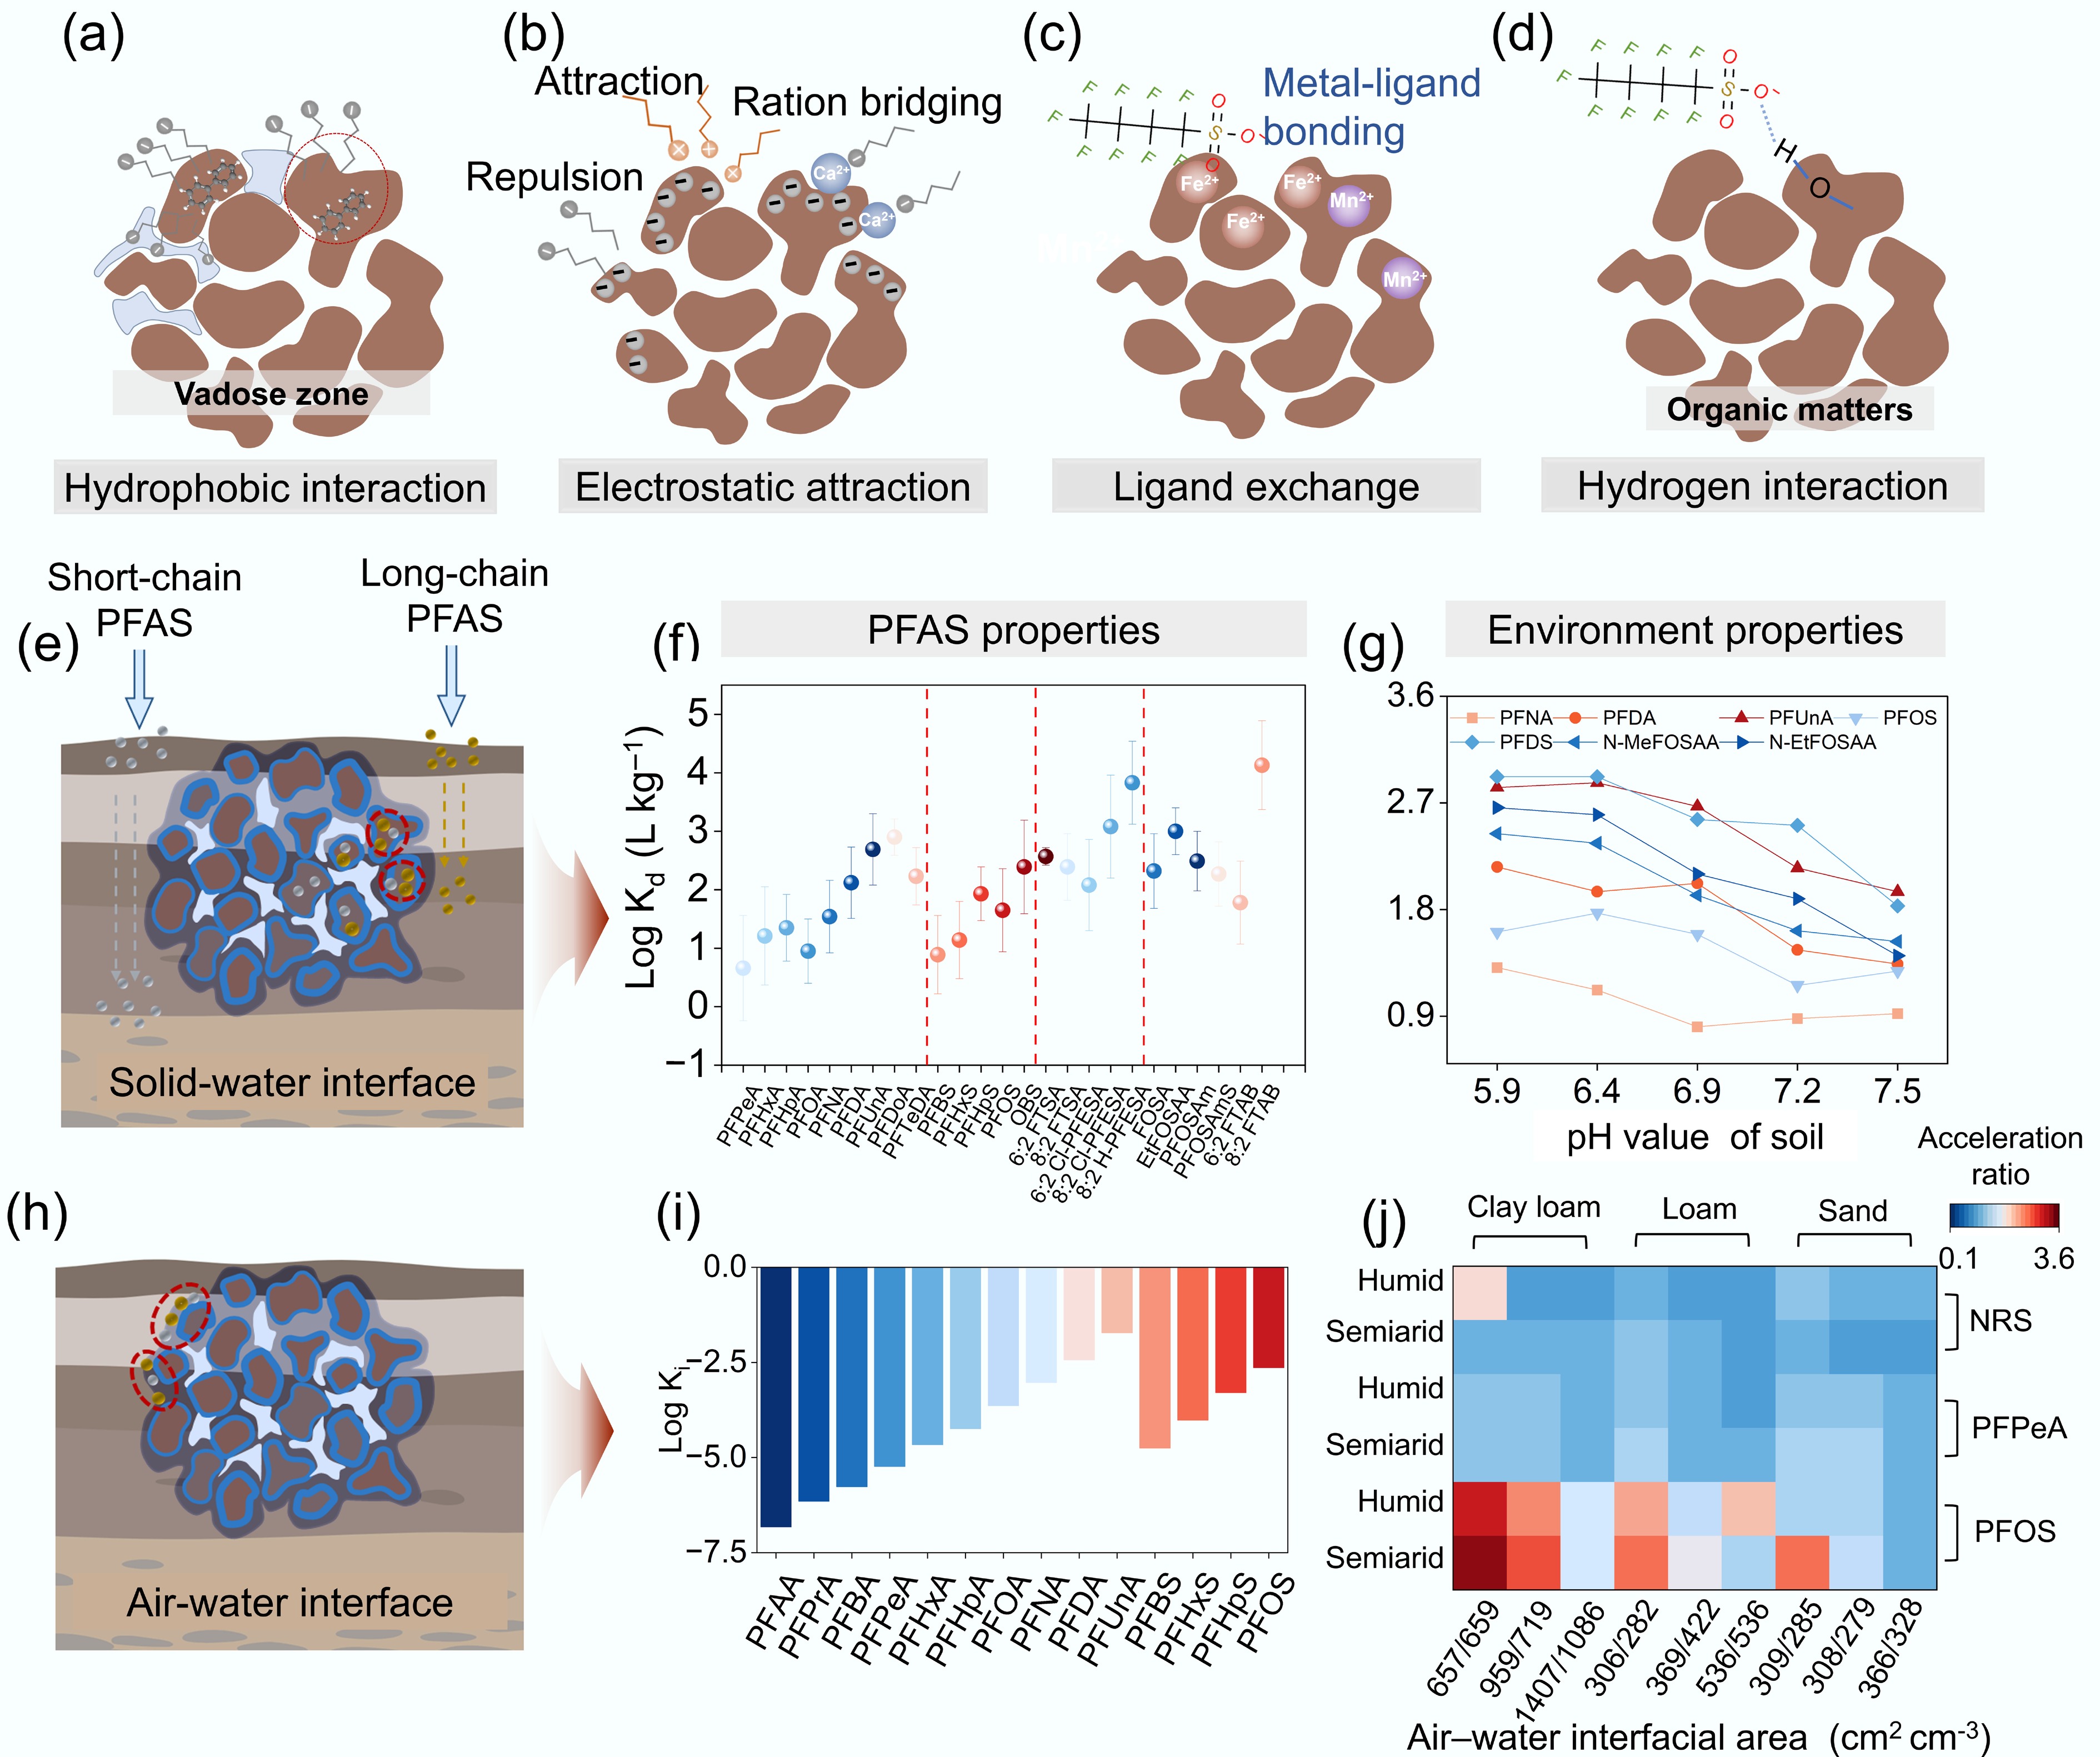
Figure 2.
Adsorption mechanisms and interfacial behavior of PFAS in soil. (a) Hydrophobic interaction, (b) electrostatic attraction, (c) ligand exchange, and (d) hydrogen bonding occurring after PFAS infiltrate soil. (e) Adsorption of PFAS at the solid–water interface. (f) Solid–water partition coefficient (log10Kd) of PFAS with different chain lengths[52]. (g) Change in log10Kd of PFAS with different chain lengths at varying pH levels[53]. (h) Adsorption of PFAS at the air–water interface. (i) Interface tension coefficient (log10Ki) of PFAS with different chain lengths[50]. (j) Influence of soil texture and moisture on the acceleration ratios of PFAS, mediated by changes in the area of the air–water interface. The acceleration ratio regarded as the ratio between the mean travel time of PFAS in a homogenous vadose zone, and that in a heterogeneous vadose zone. Among them, the mean travel time of PFAS represents the retention PFAS experience when migrating from the land surface to the depth of L, which was considered as an effective retardation factor. Columns 1–3 represent clay loam, 4–6 represent loam, and 7–9 represent sand. The horizontal rows indicate the acceleration ratios of non-reactive solute (NRS), perfluoropentanoic acid (PFPeA), and PFOS seeping from soil under humid and semiarid conditions. The horizontal axis indicates the interfacial area associated with different soil textures and moisture levels. Specifically, the left side represents semiarid conditions, and the right side represents humid conditions. Color shading from blue to red corresponds to acceleration ratios ranging from 0 to 3.6[16].
-
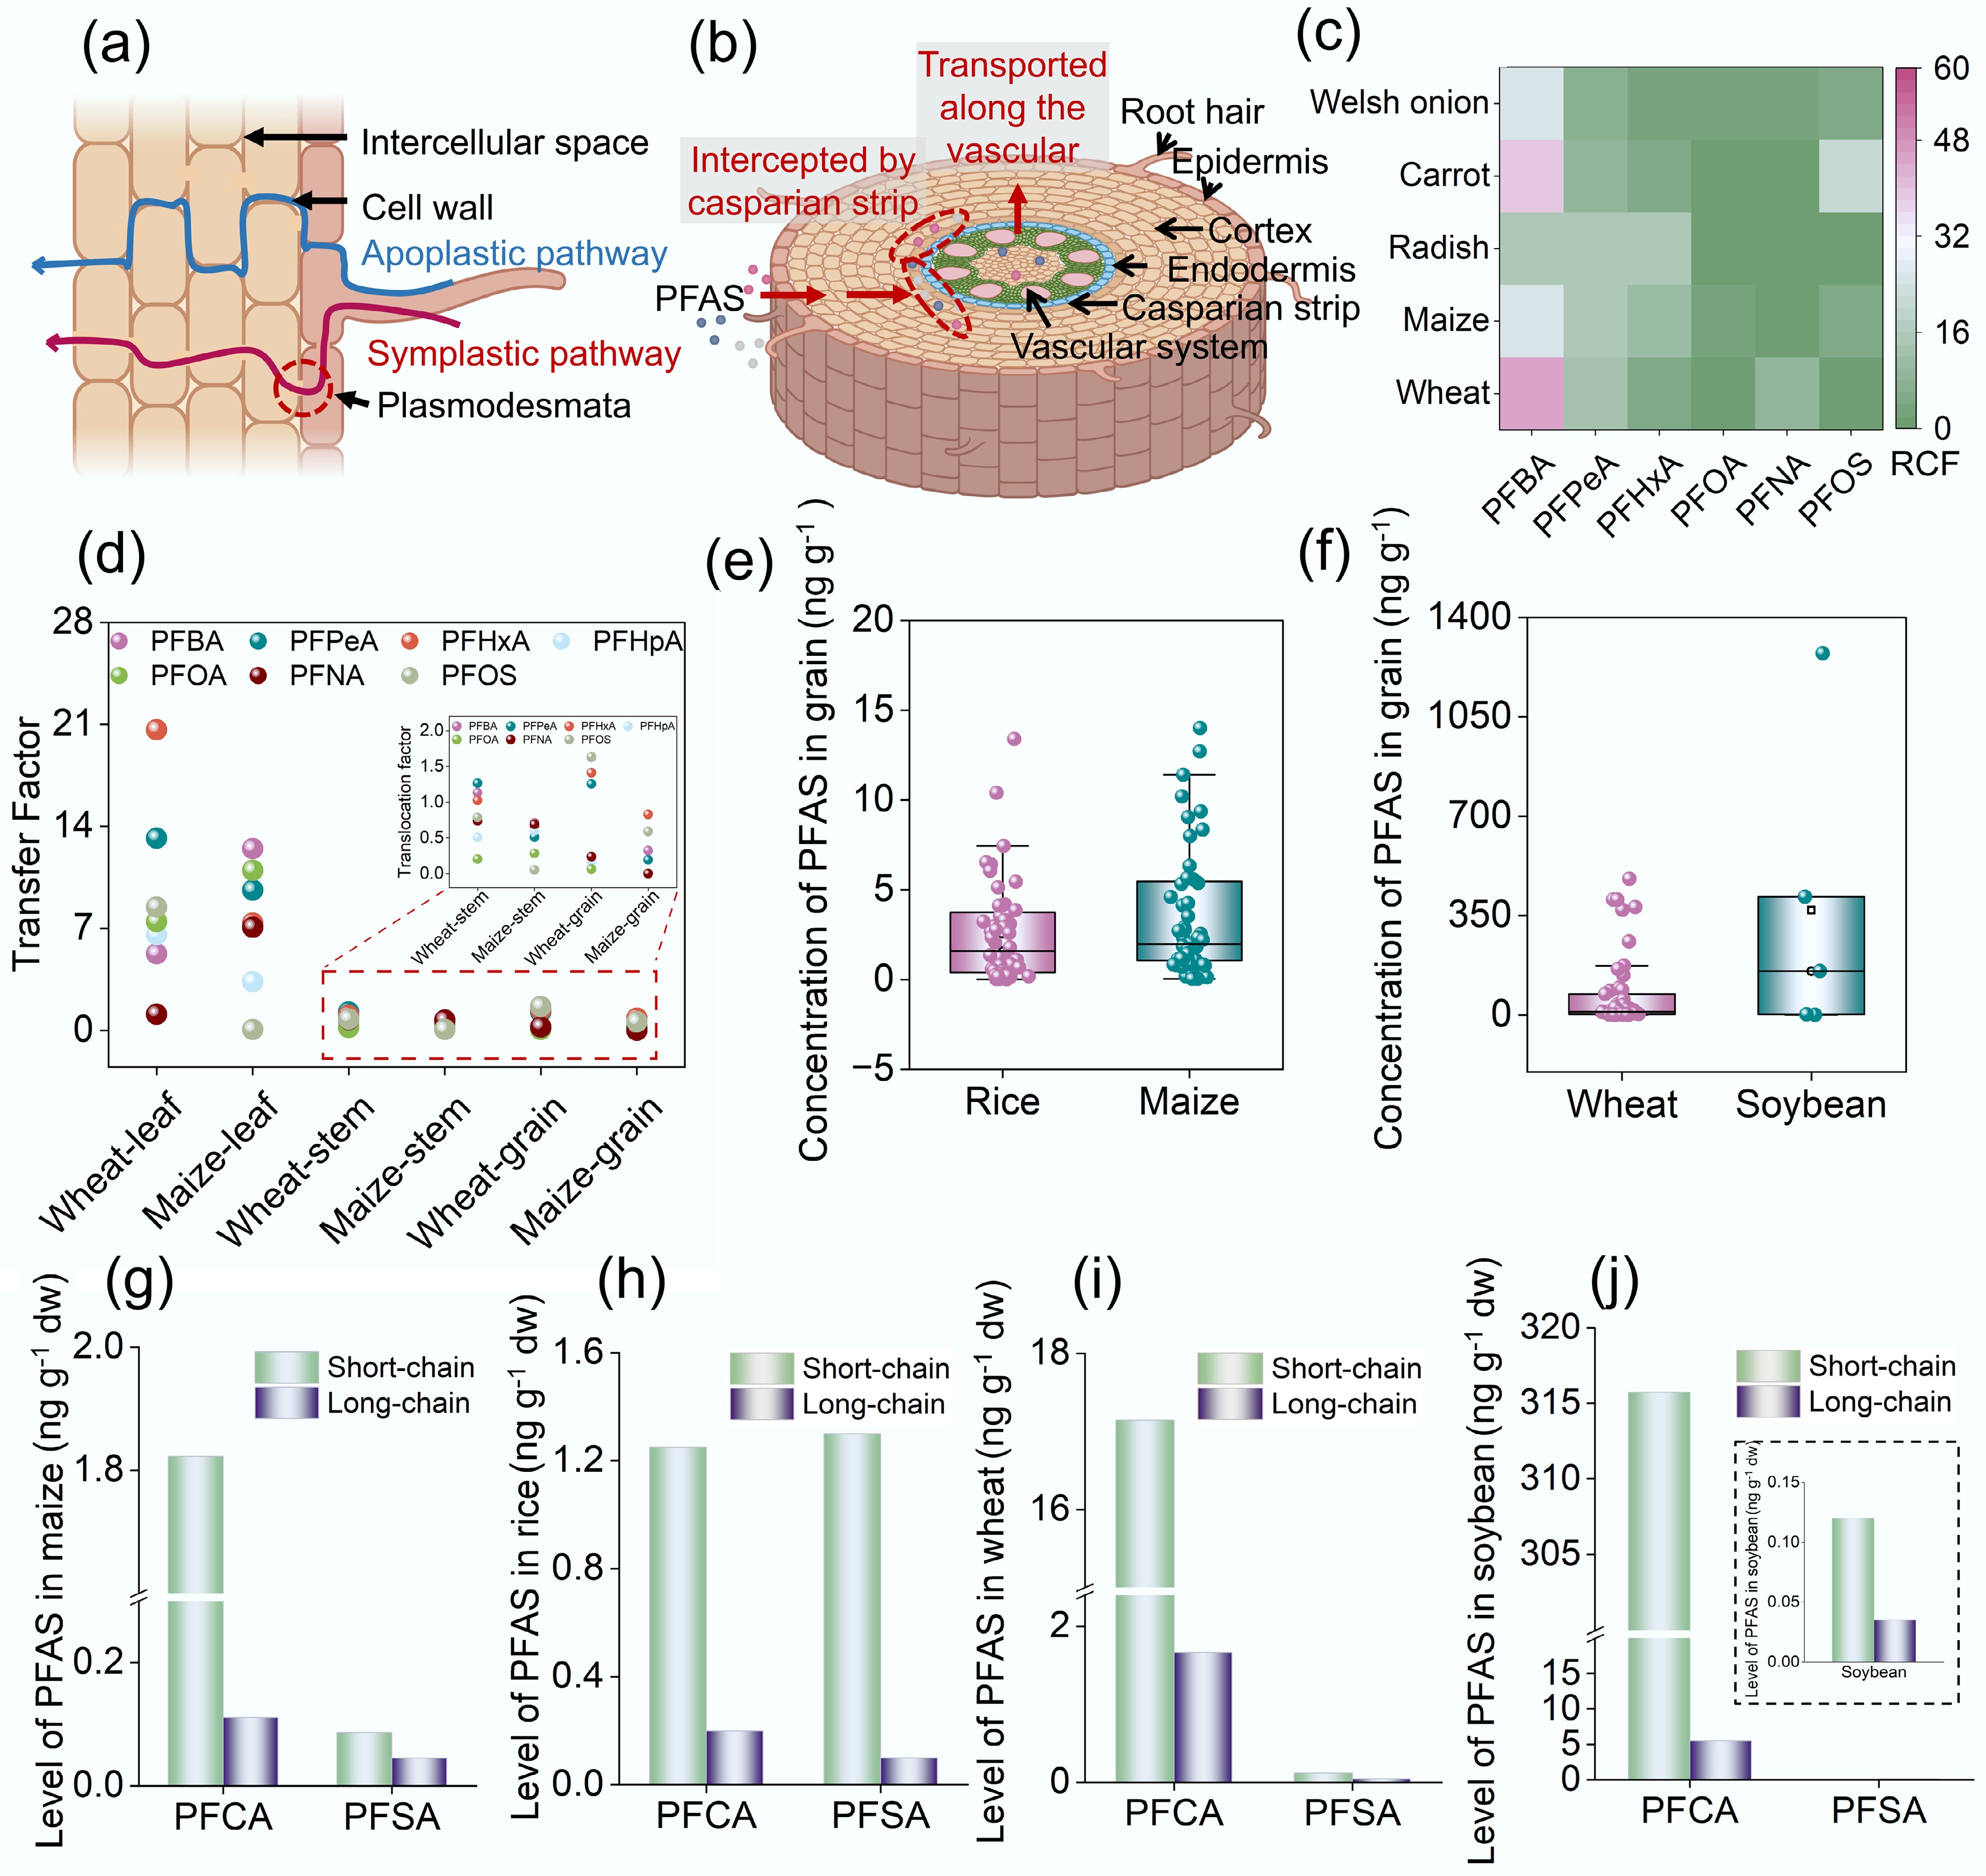
Figure 3.
Absorption and translocation of PFAS in plants and associated influencing factors. (a) PFAS enter plant roots via apoplastic and symplastic pathways. (b) PFAS are intercepted by Casparian strips in the root endodermis. (c) Root concentration factors (RCFs) of PFAS with varying chain lengths in Welsh onion, carrot, radish, maize, and wheat roots[74]. (d) Transfer factors of PFAS with different chain lengths from roots to leaves, stems, and grains in wheat and maize[86]. (e), (f) Data retrieved from the Web of Science database were statistically analyzed to determine PFAS concentrations in rice (n = 52), maize (n = 56), wheat (n = 51), and soybean (n = 4). The detailed search method is provided in Supplementary Text S3. In the boxplots, the horizontal line represents the average value, and the small square indicates the median. Concentrations of PFCA and PFSA with varying chain lengths in (g) maize, (h) rice, (i) wheat, and (j) soybean[65].
-
Region Generation (ton year−1) Generation (ton−1 capita day−1) Composting rate (%) Recycling rate (%) North America 289 2.21 0.4 33.3 South Asia 334 0.52 16 5 Middle East and North Africa 129 0.81 4 9 Europe and Central Asia 392 1.18 10.7 20 Sub-Saharan Africa 174 0.46 < 1 6.6 Latin America and Caribbean 231 0.99 < 1 24.5 East Asia and Pacific 468 0.56 2 9 Note: Data adjusted to 2016. Table 1.
Regional waste generation and the proportion of waste managed via different treatment pathways at the global scale[35]
Figures
(3)
Tables
(1)