


-
Anthropogenic activities and social development continually introduce new pollutants into the environment. Among these pollutants, per- and polyfluoroalkyl substance (PFAS) represent a class of synthetic chemicals first manufactured in the 1940s, which mainly includes classic perfluorosulfonic acid (PFSA) and perfluorocarboxylic acid (PFCA), as well as newly emerging alternative products. Since the 1950s, these chemicals have been widely used in industrial processes, such as surfactant production, electroplating, and the manufacturing of household appliances, as well as in the production of everyday consumer goods, including personal care products, food packaging, carpets, and clothing. This broad application is largely attributed to their remarkable hydrophobicity and chemical stability[1,2]. Notably, the exceptional chemical and thermal stabilities of PFAS stem from their distinctive carbon–fluorine bond structure, which enables their long-term persistence in the environment and even within living organisms[3]. Moreover, mounting toxicological evidence indicates that PFAS can cause developmental toxicity, disrupt endocrine function, and impair reproduction, leading to their classification as emerging persistent organic pollutants and thereby prompting increasing scientific and regulatory scrutiny[4−6]. To date, the environmental impacts of PFAS have been documented across a range of spatial scales, from regional to global, with particularly high concentrations reported in groundwater and seawater[7−10]. Agricultural soils play a unique role in food production for both humans and livestock. However, as major environmental sinks of PFAS, agricultural soil also accumulates substantial PFAS loads. Because of this connection to the food chain, agricultural soil is directly linked to human health, thus establishing it as one of the most critical targets for PFAS burden assessment.
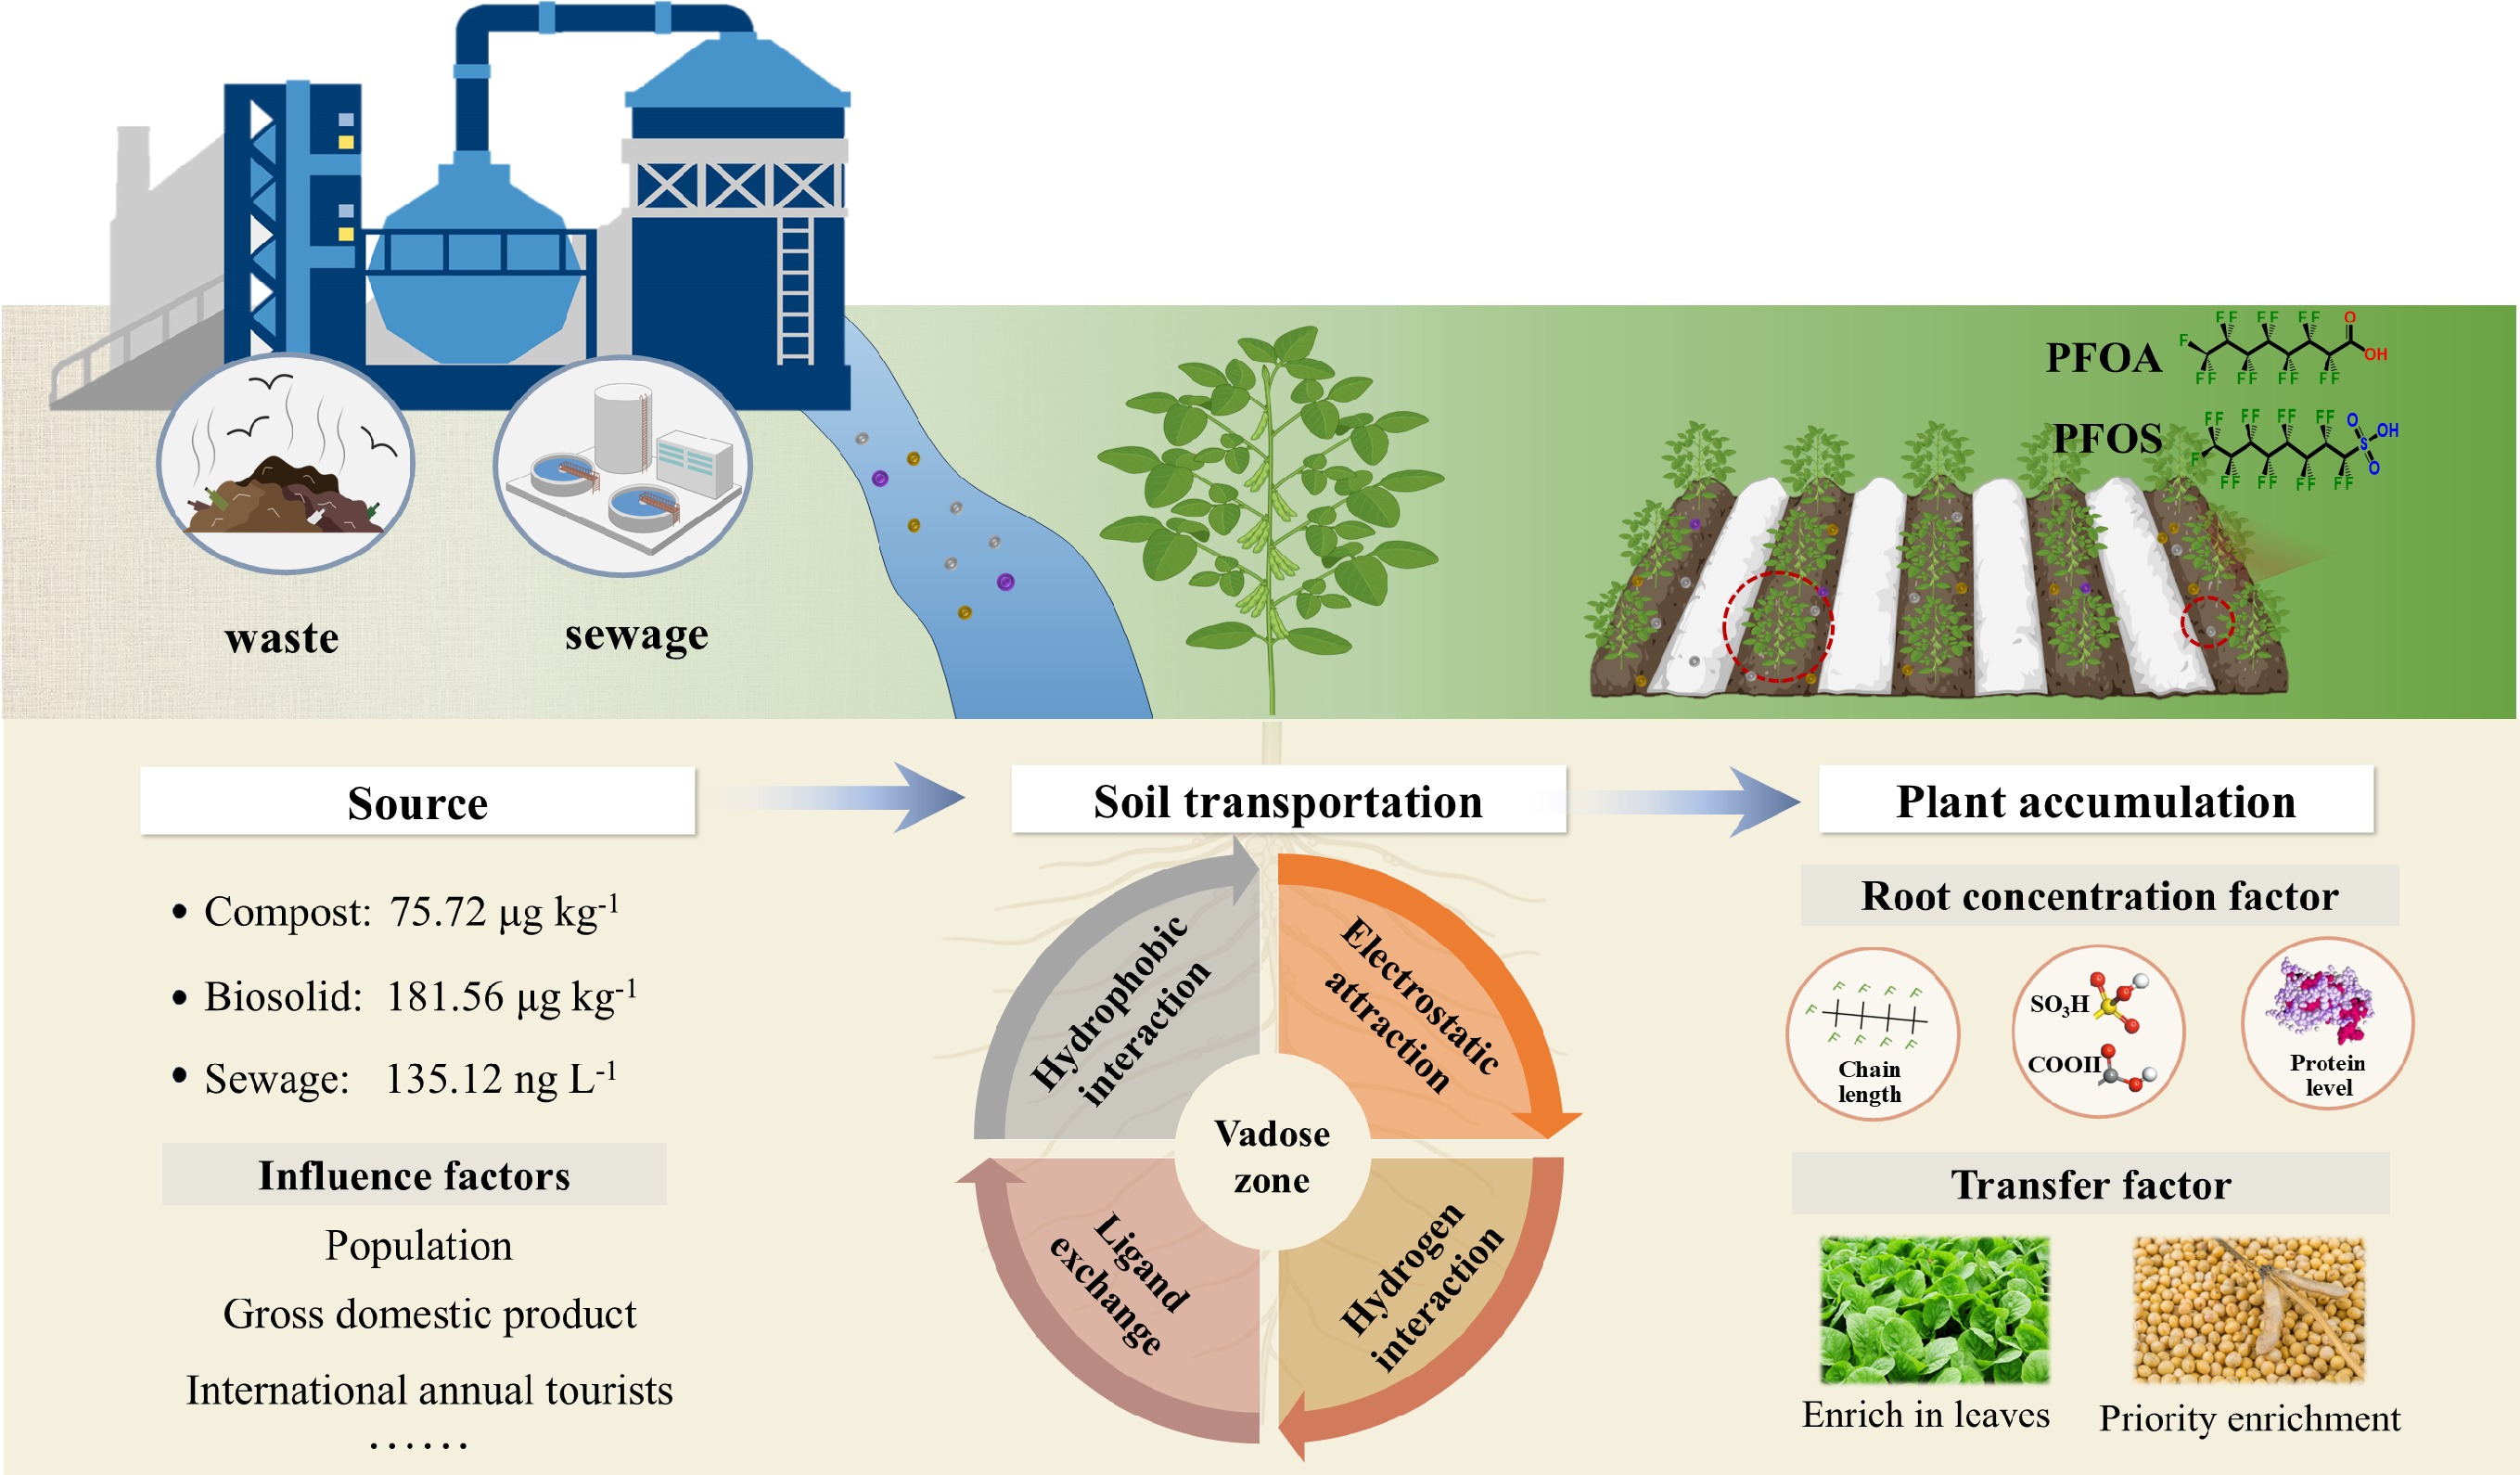
PFAS infiltrate agricultural soil through diverse pathways, including atmospheric deposition, compost and biosolid use, and wastewater reuse. In recent years, as the concepts of circular economy and sustainable soil nutrient management have gained traction, the land application of sewage sludge, biosolids, and compost has emerged as an increasingly important practice in sustainable soil utilization[11,12]. Reflecting this trend, more than 60% of biosolids are land-applied in Germany and Australia, while the corresponding proportion ranges from 50% to 55% in the US. Despite this widespread application, current technologies lack targeted processes to eliminate PFAS from wastewater treatment plants and composting facilities. Consequently, global concentrations of individual PFAS in biosolids have been reported to range from 0.11 to 403 μg·kg–1 dry weight (dw), while levels in wastewater treatment plant effluents range from 15 to 1,500 ng·L–1 dw[13,14]. Although awareness regarding the potential health risks associated with the application of waste and wastewater to agricultural land is increasing, the key source of PFAS in agricultural soil and the individual contribution of compost, biosolid, and sewage on the load of PFAS in agricultural soil remain unknown. Regional disparities in waste and wastewater production further lead to corresponding variations in PFAS burdens and risks. Currently, a systematic summary of the divergent sources of PFAS in soils across distinct global ecoregions is lacking, which impedes the characterization of spatiotemporal dynamics in PFAS contamination cascades. Therefore, quantifying global waste and wastewater yields, along with their PFAS loads, is essential for identifying the sources of PFAS in agricultural soil and guiding the development of more effective regulatory policies.
PFAS introduced into soils as a result of human activities tend to migrate and disperse. Previous studies have reported that PFAS primarily accumulate in the vadose zone, a critical subsurface region that extends from the land surface to the groundwater[15,16]. This zone comprises a complex matrix of rock particles, water, and air. Within it, PFAS undergo intricate adsorption and partitioning processes among the gas, liquid, and solid phases, including hydrophobic adsorption, electrostatic attraction, ligand exchange, and hydrogen bonding[17−19]. These interactions can exert long-term effects on subsurface soil environments and groundwater quality[20,21]. Given that adsorption behavior is influenced by various factors, including PFAS-specific properties and soil characteristics, traditional adsorption models (the Freundlich-based model and Langmuir-based model) have become inadequate to reveal the migration behavior of PFAS. Despite a few emerging adsorption models (Leverett thermodynamic model [LTM], and Quantitative-structure/property-relationship [QSPR] analysis) having been proposed to explore the underlying adsorption mechanisms and kinetic process, our knowledge on adsorption patterns remains limited.
In addition to the above functions, the vadose zone also serves as a key region where plant roots absorb water and nutrients. In this region, dissolved PFAS can be taken up by the epidermal cells of roots and further migrate to the vascular tissues before being transported upward through the xylem or phloem[22]. Although the Casparian strip in plant roots restricts the uptake of long-chain PFAS (C ≥ 7 for PFCA and C ≥ 6 for PFSA), short-chain PFAS (C < 7 for PFCA and C < 6 for PFSA), owing to their high water solubility, can bypass this barrier, enter vascular tissues, and be further translocated to stems, leaves, and even grains, via transpiration. Although the investigations into the migration processes of PFAS have been conducted, there remains a significant lack of comprehensive reviews regarding the influence of PFAS properties and plant species on root uptake and intra-plant translocation. A study conducted by van Dijk et al. reports that global food demand will increase by 35%–56% between 2010 and 2050[23]. Thus, it is essential to examine the PFAS load introduced into agricultural soil, and systematically investigate their migration in soils and accumulation in crops.
For this review, global wastewater and solid waste production data from the United Nations were compiled, and a machine learning model was employed to generate global annual average emission maps. The total PFAS content in compost, biosolids, wastewater, and major food crops, including rice, corn, wheat, and soybeans, was obtained from 115 research articles published between 2005 and 2025 (Web of Science). Leveraging these data, the review systematically examines PFAS contamination processes in the global soil–plant system by summarizing their sources, migration behavior, and plant uptake. Together, these analyses provide a comprehensive perspective of global occurrence and environmental risks associated with PFAS.
-
PFAS contamination has been reported in agricultural soils across numerous countries. The application of soil amendments such as compost and biosolids, and irrigation using reclaimed wastewater are well-documented pathways through which PFAS enter agricultural systems[24−26]. Additionally, atmospheric deposition and the use of PFAS-containing pesticides further contribute to PFAS accumulation in soil[27−29]. This section presents global maps of waste generation and wastewater production, along with average PFAS concentrations in compost, biosolids, and wastewater, as derived from a machine learning model and literature review (Fig. 1a−g). Details of the data collection and modeling procedures are provided in Supplementary Text S1 and Text S2. The reliability of the waste generation model and sewage discharge model are listed in Supplementary Figs S1 and S2.
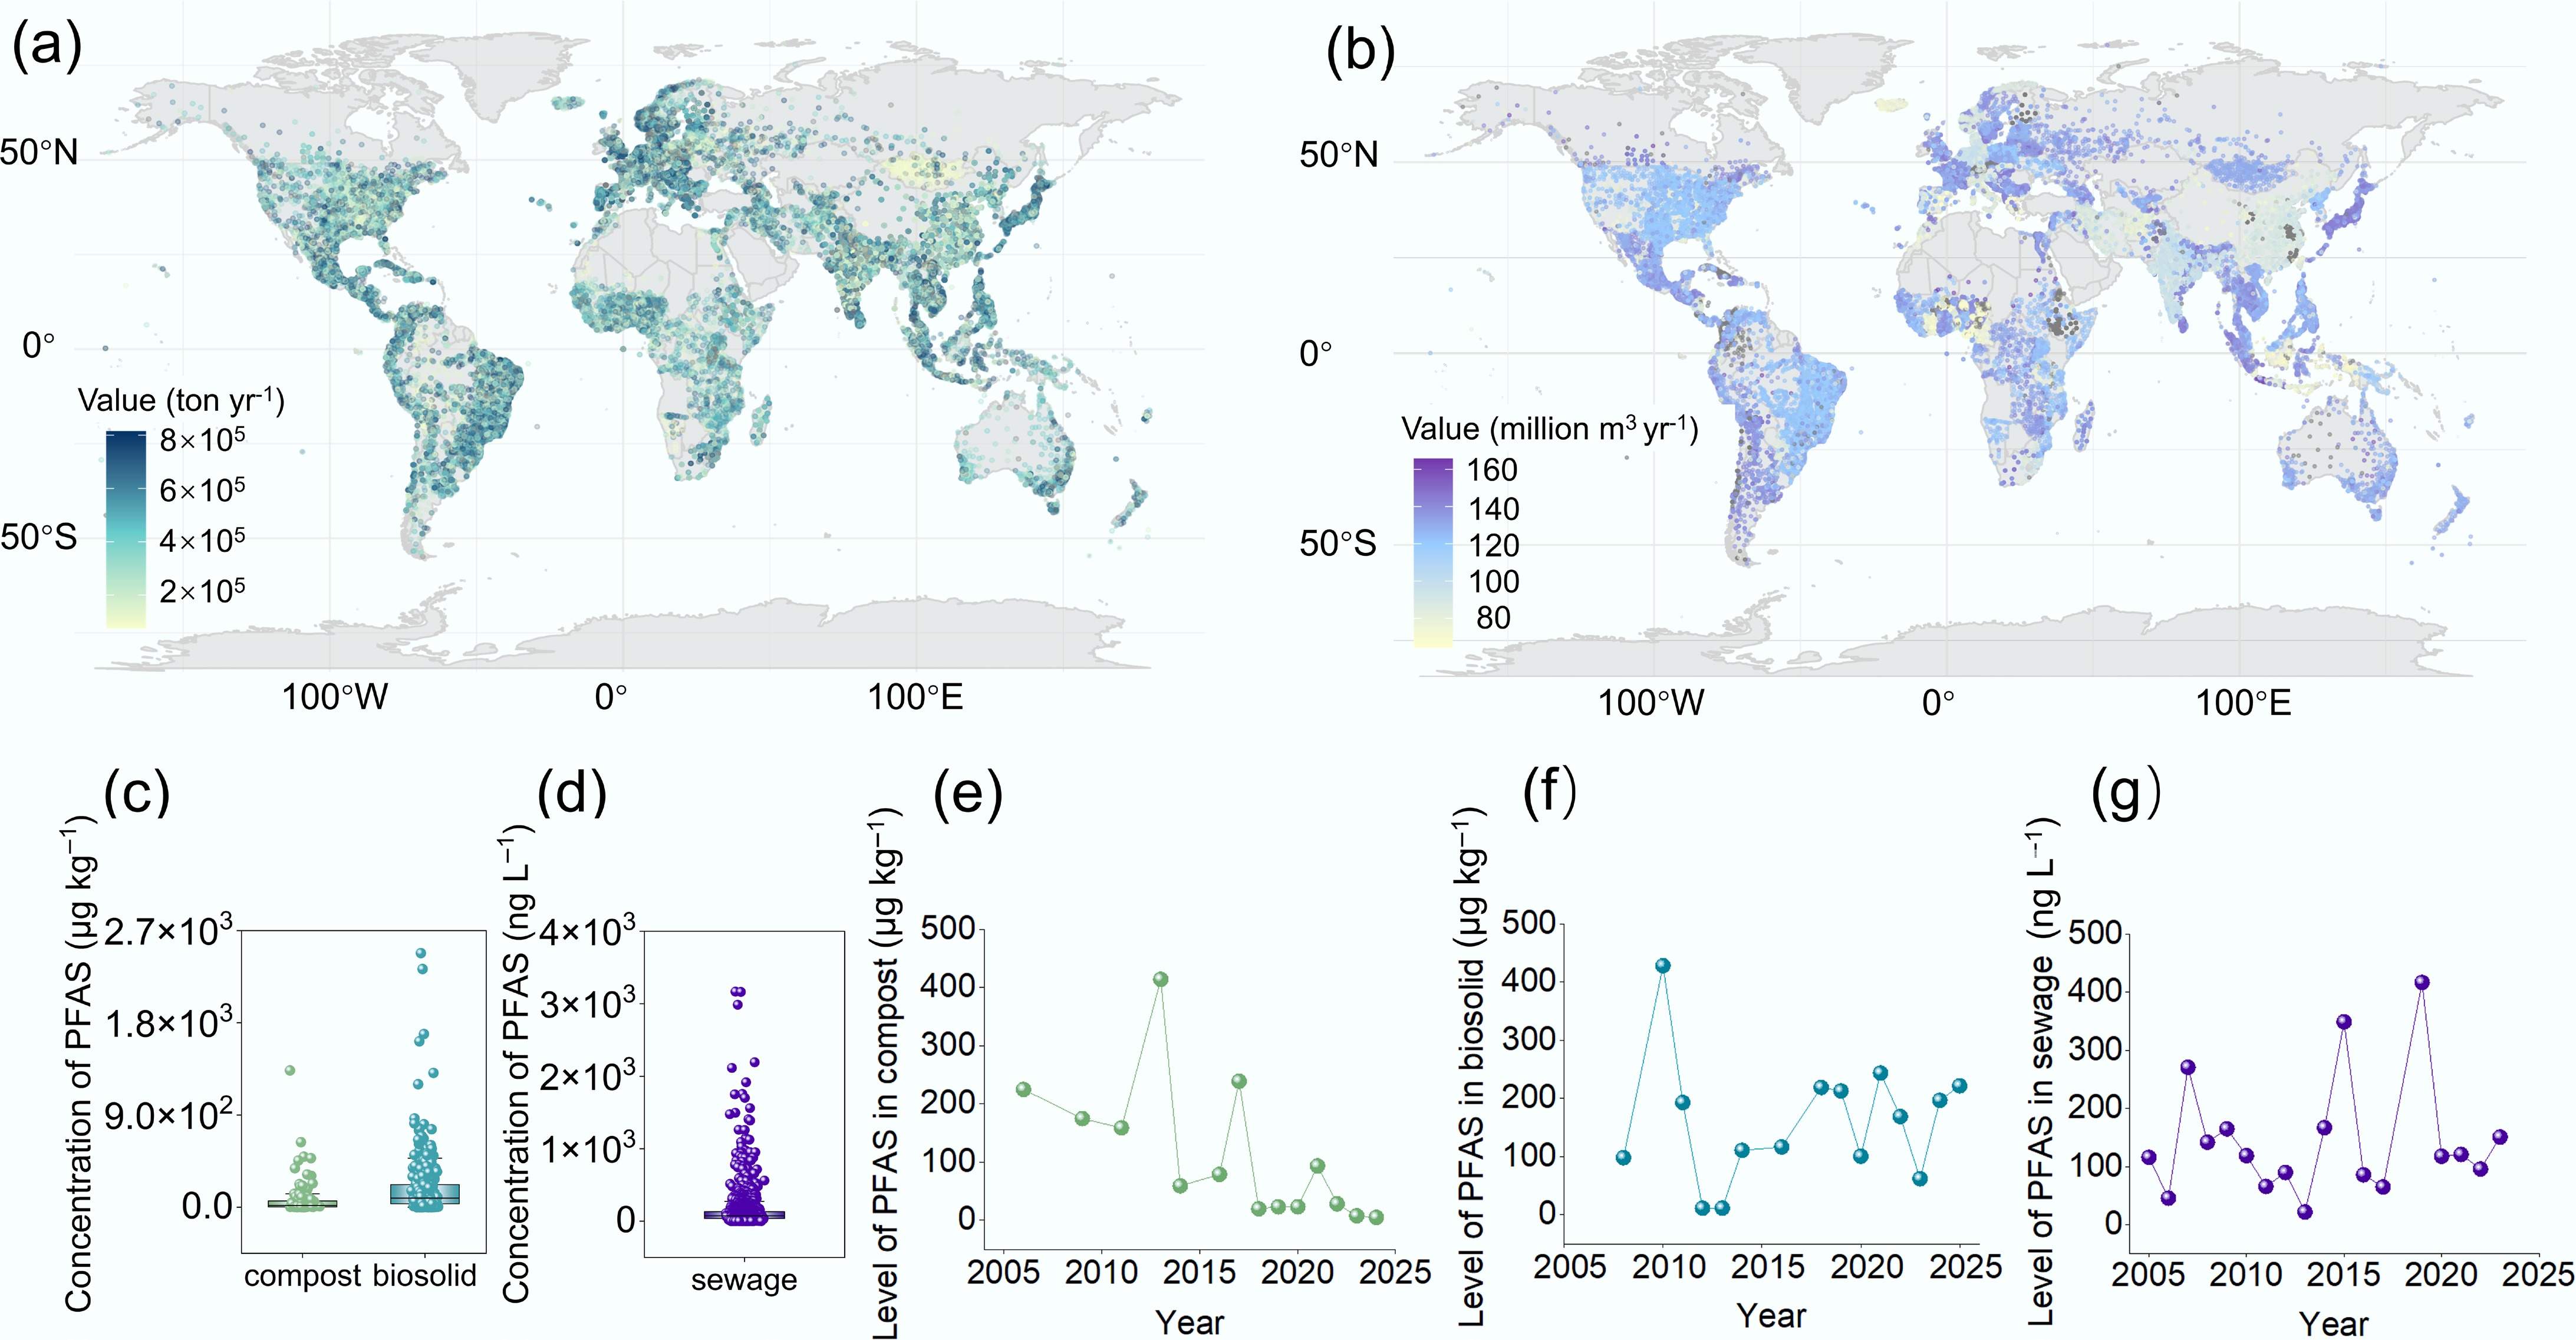
Figure 1.
Global waste and sewage production and PFAS concentrations in compost, biosolids, and sewage. (a) Global solid waste generation. (b) Global sewage production. (c) PFAS concentrations in compost (n = 108), and biosolids (n = 332), retrieved from the Web of Science and analyzed statistically. (d) PFAS concentrations in sewage (n = 1,536), retrieved from the Web of Science and analyzed statistically (excluding ultrashort-chain fluorides). Details of the search methodology are provided in the Supplementary Text S1 and Text S2. Yearly trends in PFAS concentrations in (e) compost, (f) biosolids, and (g) sewage from 2005 to 2025. In each box plot, the horizontal line indicates the average value, and the small square indicates the median value.
Compost and biosolids derived from waste
-
Over the study period, 2.01 billion tons of municipal solid waste were generated annually worldwide. The regional waste generation was largely influenced by population (84.2%), and international annual tourists (5.0%) (Supplementary Table S1). Population size directly determines the scale of basic daily consumption and resource use, so it is the fundamental source of waste generation. Tourism brings short-term, high-intensity increases in population and consumption, which can lead to a sharp surge in waste production; in some cases, the amount of waste generated by tourists is even twice that of local residents[30]. In detail, East Asia and the Pacific, Europe, and South Asia produced the highest amounts of waste, accounting for 23%, 20%, and 17% of total global production, respectively (Table 1). Specifically, annual waste generation exceeded 6 × 10⁵ ton year-1 in Mediterranean countries, Japan, the Philippines, and eastern coastal cities of Australia, surpassing that in other countries (Fig. 1a).
Table 1. Regional waste generation and the proportion of waste managed via different treatment pathways at the global scale[35]
Region Generation (ton year−1) Generation (ton−1 capita day−1) Composting rate (%) Recycling rate (%) North America 289 2.21 0.4 33.3 South Asia 334 0.52 16 5 Middle East and North Africa 129 0.81 4 9 Europe and Central Asia 392 1.18 10.7 20 Sub-Saharan Africa 174 0.46 < 1 6.6 Latin America and Caribbean 231 0.99 < 1 24.5 East Asia and Pacific 468 0.56 2 9 Note: Data adjusted to 2016. The load of PFAS in compost
-
One hundred and eight values were collected from 16 articles. Owing to the constraints in reporting, these sampling sites are predominantly clustered across Europe, the Pacific region, and North America (Supplementary Fig. S3a). As depicted in Fig. 1c, the average PFAS concentration in compost products was 75.72 μg·kg–1 dw. Among the analyzed samples, the highest average concentration (161.51 μg·kg–1 dw) was reported in European regions, and a commercial compost from France exhibited the highest PFAS load of 1,334.30 μg·kg–1 dw. The analyzed samples in North America demonstrated comparatively low concentration of PFAS in composts (22.98 μg·kg–1 dw) among all surveyed regions. The production restrictions on PFAS in then US have effectively reduced the load of PFAS in soil since 2009[31]. A time-based subgroup analysis revealed that the peak PFAS concentration in compost occurred in 2013 (Fig. 1e). Although levels rose briefly in 2017 and 2021, the overall trend from 2005 to 2024 exhibited a decline, with concentrations remaining below 100 μg·kg–1 dw since 2018. Compost is typically produced by processing solid waste through high-temperature decomposition. This thermal treatment can degrade PFAS, which may explain why PFAS concentrations in compost are generally lower than those in other biological products[32]. This continued decrease in PFAS loads in compost may also reflect growing concerns over pollutants in compost products, which has driven ongoing improvements in processing technologies[33,34].
The load of PFAS in biosolids
-
As a byproduct of sewage treatment, sludge is often managed as solid waste. Given the high levels of nitrogen, phosphorus, and organic matter present in sewage, it is commonly processed into biosolids and used to improve soil quality in agricultural production. Data from 332 samples across 32 articles revealed that the average PFAS concentration in biosolids was 181.56 μg·kg–1 dw, 2.40-fold higher than that in compost (Fig. 1d). A time-series analysis revealed that the highest PFAS concentration in biosolids was observed in a sample collected in 2010 (Fig. 1f). Since then, the level of PFAS in biosolids has remained within the range of 100 to 250 μg·kg–1 dw. In Asia regions, biosolids exhibited the highest concentrations of PFAS (405.07 μg·kg–1 dw) among all surveyed areas, followed by those in European regions (179.76 μg·kg–1 dw). The populations of Asia and Europe account for 53.6% and 9.04% of the global population, respectively (Supplementary Fig. S3b). Besides, according to the statistics published in 2024, the number of international tourists in Europe and the Asia-Pacific region stands at 747 and 316 million, respectively. The consumer product waste generated by large populations and international tourists exerted severe PFA pressure. From a regulatory perspective, few Asian countries have established standards for the limit of PFAS in biosolids, and only Germany has imposed an upper limit of (100 mg·kg–1) PFAS in biosolids in Europe[36]. Due to the underdeveloped fluorination industry in Africa and the relatively low level of interest in this field, the load of PFAS in African biosolids exhibits the lowest levels. In North America, New York State stipulates that biosolids with a concentration of ≥ 50 μg·kg–1 for perfluorooctanoic acid (PFOA), and ≥ 50 μg·kg–1 for PFOS should not be land applied, while Michigan has completely banned the agricultural land application of biosolids[37]. In Oceania, Australia has set a limit of 4 μg·kg–1 for PFOA and PFOS in biosolids[38]. These cases demonstrate that monitoring and regulatory limits can effectively reduce the PFAS input into agricultural soils from biosolid applications. However, only a few countries globally have issued regulatory standards, highlighting the urgent need for international collaboration to control PFAS levels in agricultural soils.
Irrigation with wastewater
-
The high stability of the carbon–fluorine bond prevents PFAS from being effectively eliminated by conventional wastewater treatment processes. Consequently, PFAS are frequently detected in the effluents of wastewater treatment plants and even in reclaimed wastewater used for irrigation[7,39]. Across the study period, global wastewater production was estimated at 3.594 × 10¹¹ m3 per year, and regional per capita wastewater generation was largely influenced by gross domestic product (GDP) (50.6%), and population (27.2%) (Supplementary Table S2). Regions with high per capita wastewater discharge included the southern United States, Argentina, Western Europe, East Asia (Japan), and South Asia (the Philippines) (Fig. 1b). GDP shapes the content of PFAS in wastewater by influencing the intensity of economic activities, consumption patterns, and infrastructure development. The population forms the distribution of wastewater, and the combined effect results in regions with high GDP and population density. Per capita wastewater production is typically higher in developed countries in Europe and America, and in emerging Asian economies. Wastewater contains predominantly short-chain PFAS, mainly including perfluorobutanoic acid (PFBA), perfluorovaleric acid (PFPeA), and perfluorobutanesulfonic acid (PFBS), which indicates that wastewater serves as a primary environmental pathway for emerging short-chain PFCA[40]. Notably, ultrashort-chain fluorides such as trifluoroacetic acid (TFA) are not currently recognized as PFAS by the US Environmental Protection Agency (EPA). However, ultrashort-chain PFAS share similarities with long-chain PFAS in terms of persistence, long-range transport potential, and biotoxicity. Since neither biological treatment nor advanced treatment processes in wastewater treatment plants can effectively remove ultrashort-chain PFAAs, as degradation products of PFAS, trifluoroacetic acid (TFA) (15,000 ng·L–1), and perfluoropropionic acid (PFPrA) (4,100 ng·L–1) have shown increasing concentrations in wastewater effluents, even exceeding those at the influent[41,42]. On a global scale, 38% industrial wastewater and 58% household wastewater were safely treated (i.e., at least secondary treatment)[42]. Although the technologies to address PFAS contamination are evolving rapidly, no single technology offers a complete solution, leading to an elevated PFAS threats in wastewater effluents[43]. Data from 1,536 sampling sites revealed that the average PFAS concentration in sewage was 135.12 ng·L–1. As with biosolids, the lowest PFAS concentration in sewage was recorded in a sample collected in 2013 (21.70 ng·L–1), and wastewater production exhibited a generally increasing trend across the study period (Fig. 1g). Although the use of perfluorohexanoic acid (PFHxA), and perfluorooctane sulfonic acid (PFOS) has been restricted, their concentrations in sewage have not notably declined over time on a global scale[39]. This persistence indicates that PFAS have stable and long-lasting environmental effects. Currently, the entry of PFAS into farmland through reclaimed wastewater cannot be mitigated by large-scale upgrades to sewage treatment technologies, as their stability and the high costs of implementing advanced methods hinder the effectiveness of such measures[43,44]. In light of this, introducing global restrictions on the reuse of reclaimed wastewater may provide a more viable strategy for limiting PFAS contamination.
Atmospheric deposition and pesticides
-
In addition to the primary pathways of PFAS introduction, including compost, biosolids, and reclaimed wastewater usage, atmospheric deposition and the use of fluorinated pesticides have also contributed to PFAS accumulation in agricultural soil. Notably, sulfluramid (N-ethyl perfluorooctylsulfonamide, N-EtFOSA), developed by the US-based Guarantee Trust Company in 1989, is primarily used to control termites and cockroaches[45]. Upon environmental exposure, N-EtFOSA degrades into PFOS and generates various degradation intermediates. EtFOSA may have contributed up to 616 tons of PFOS emissions between 2010 and 2018[46]. Moreover, PFAS are also present in containers of fluorinated pesticides and in pesticide antifoaming agents. Over the study period, concentrations of PFOA and perfluoroheptane sulfonic acid (PFHpS) detected in insecticides reached up to 510 ng·L–1 and 680 ng·L–1, respectively, with detection rates as high as 60%[47,48]. In contrast, other major pesticide-consuming countries such as China, Japan, and Australia have paid comparatively less attention to this issue. Given this situation, more comprehensive data are urgently needed to support global assessments of PFAS loads in pesticides and to fill the research gap concerning PFAS levels in agricultural environments.
-
PFAS in soil interact with the surrounding media and undergo diffusion and adsorption. Given their low mobility, PFAS are primarily restricted to the vadose zone, the region between the ground surface and groundwater table[49]. This zone comprises gas, liquid, and solid phases, where PFAS exhibit various adsorption mechanisms, including hydrophobic and electrostatic interactions, ligand exchange, and hydrogen bonding (Fig. 2a−d). Among these, adsorption at the solid–water and air–water interfaces constitute the primary mechanisms governing PFAS adsorption[50,51].
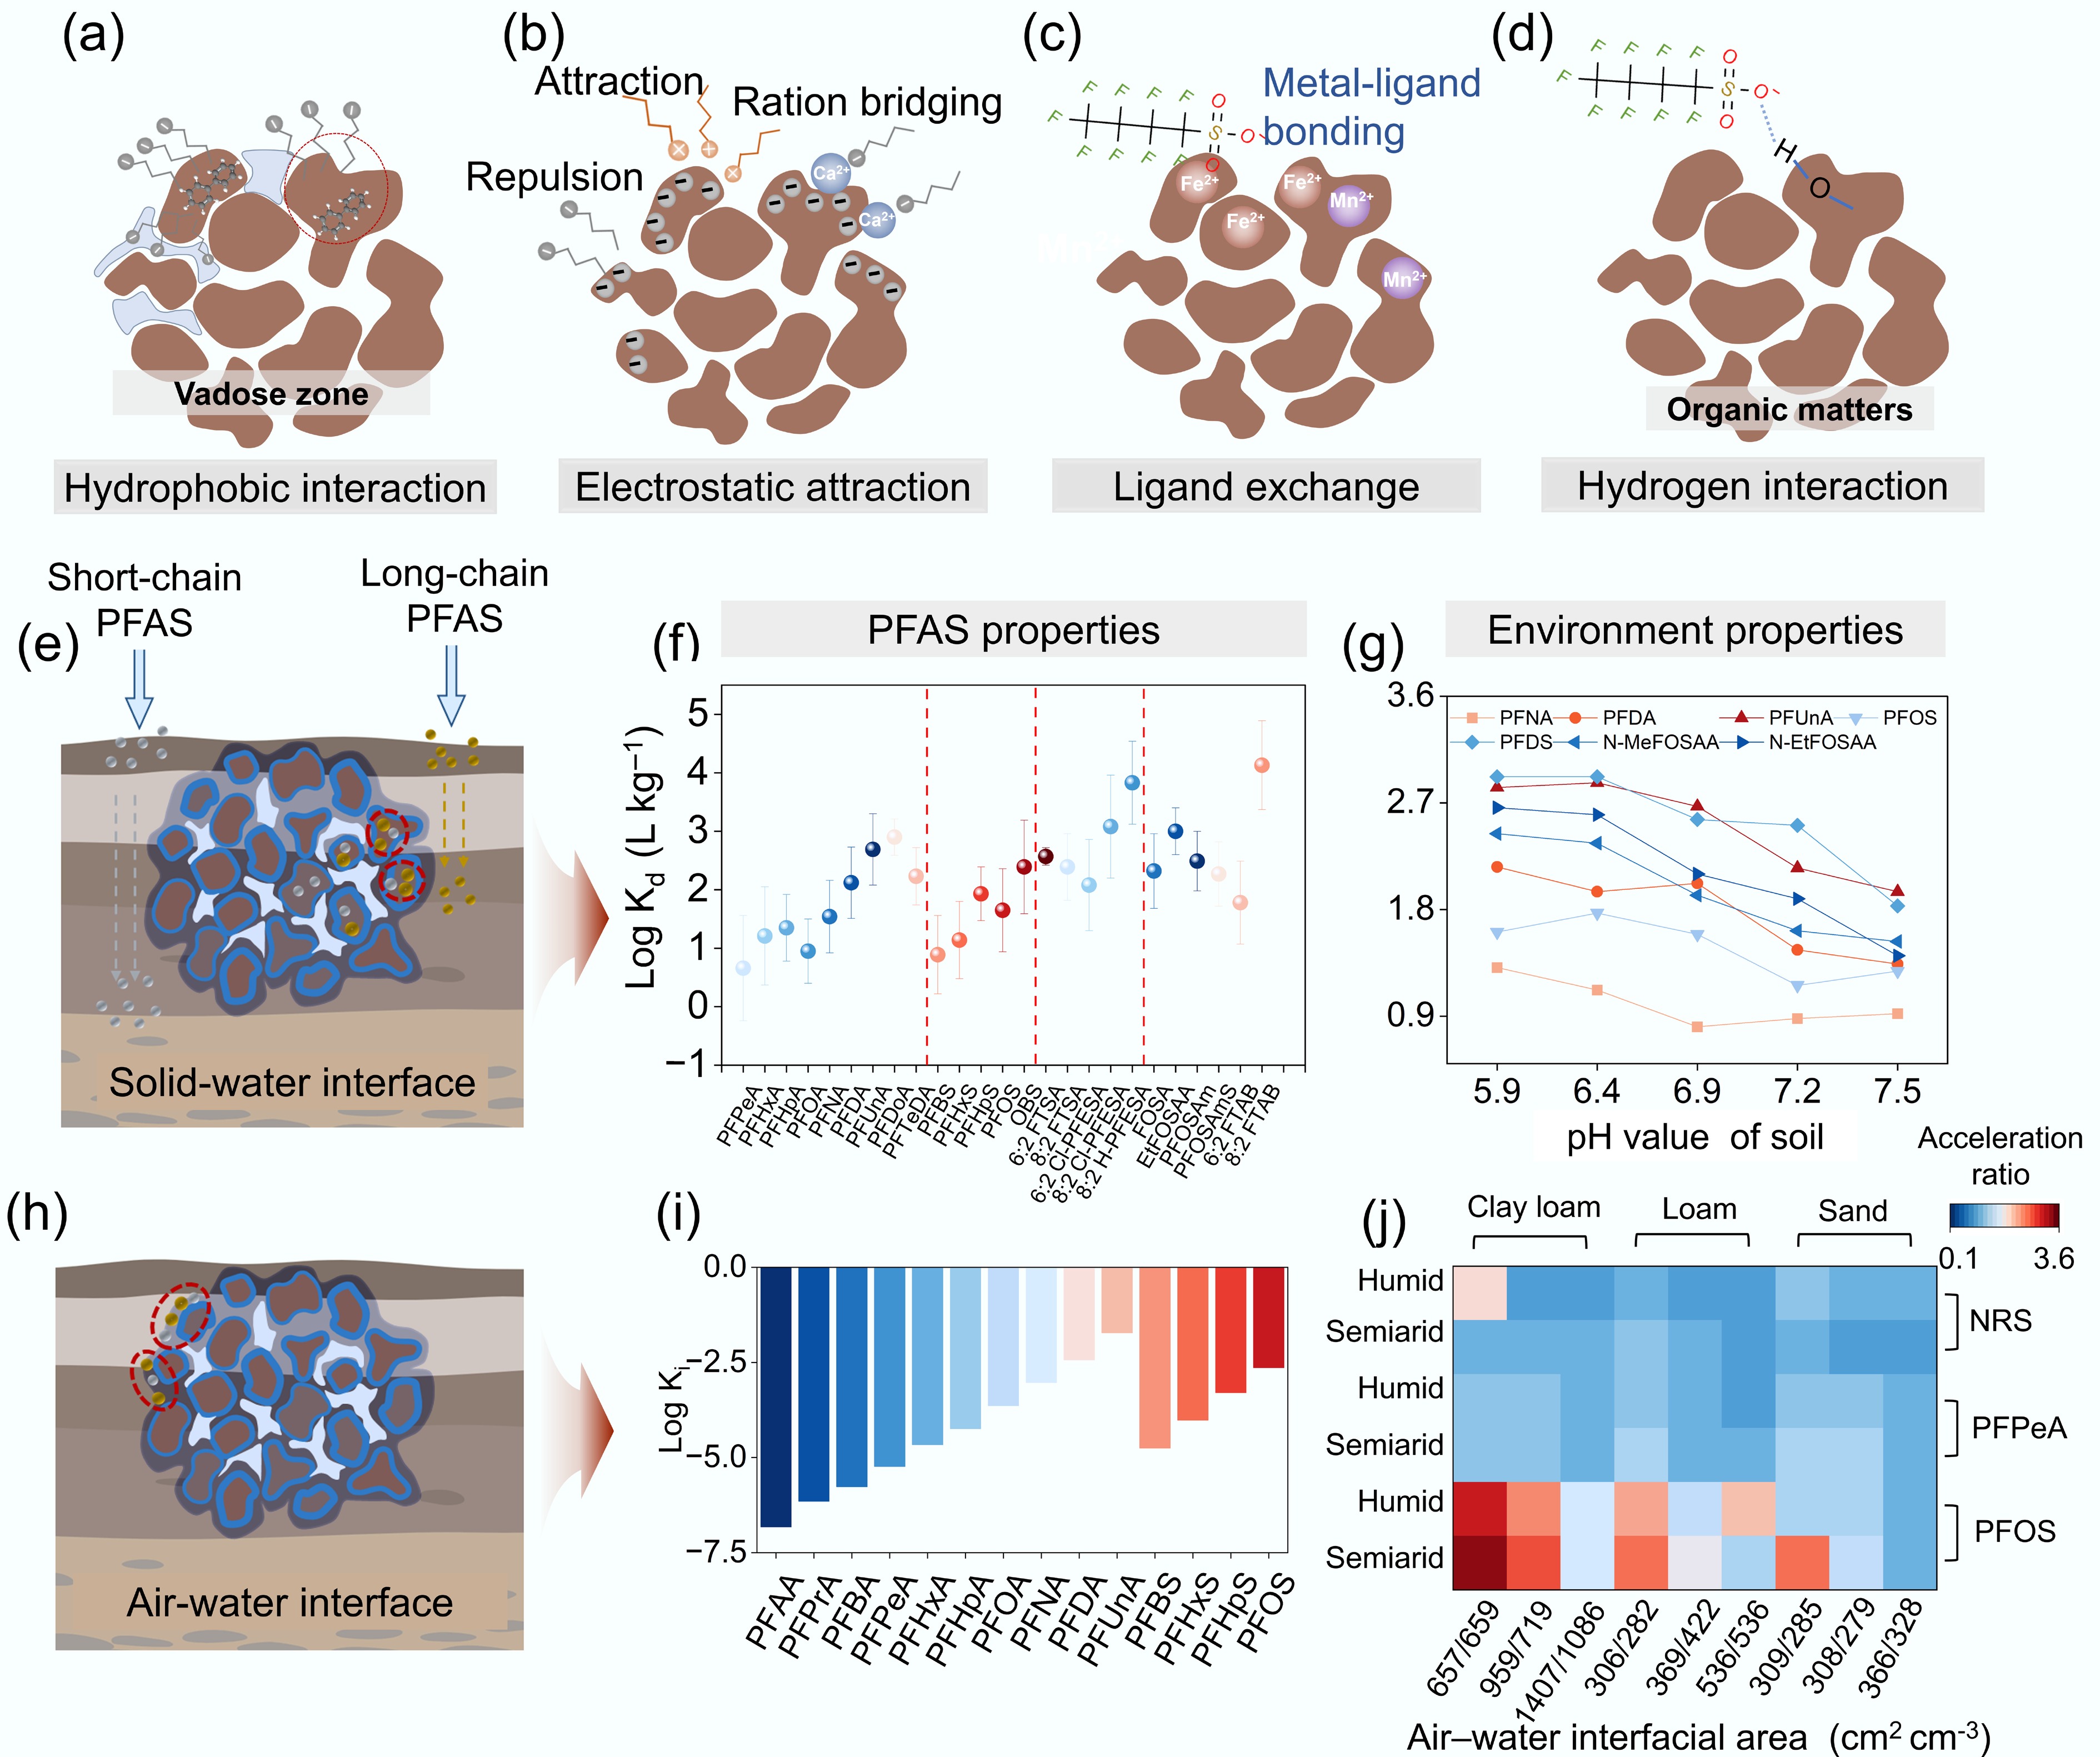
Figure 2.
Adsorption mechanisms and interfacial behavior of PFAS in soil. (a) Hydrophobic interaction, (b) electrostatic attraction, (c) ligand exchange, and (d) hydrogen bonding occurring after PFAS infiltrate soil. (e) Adsorption of PFAS at the solid–water interface. (f) Solid–water partition coefficient (log10Kd) of PFAS with different chain lengths[52]. (g) Change in log10Kd of PFAS with different chain lengths at varying pH levels[53]. (h) Adsorption of PFAS at the air–water interface. (i) Interface tension coefficient (log10Ki) of PFAS with different chain lengths[50]. (j) Influence of soil texture and moisture on the acceleration ratios of PFAS, mediated by changes in the area of the air–water interface. The acceleration ratio regarded as the ratio between the mean travel time of PFAS in a homogenous vadose zone, and that in a heterogeneous vadose zone. Among them, the mean travel time of PFAS represents the retention PFAS experience when migrating from the land surface to the depth of L, which was considered as an effective retardation factor. Columns 1–3 represent clay loam, 4–6 represent loam, and 7–9 represent sand. The horizontal rows indicate the acceleration ratios of non-reactive solute (NRS), perfluoropentanoic acid (PFPeA), and PFOS seeping from soil under humid and semiarid conditions. The horizontal axis indicates the interfacial area associated with different soil textures and moisture levels. Specifically, the left side represents semiarid conditions, and the right side represents humid conditions. Color shading from blue to red corresponds to acceleration ratios ranging from 0 to 3.6[16].
Adsorption mechanisms and factors influencing PFAS in the vadose zone
-
The reactivity of PFAS in soil is influenced by multiple factors, including their molecular structure, soil mineralogy, and physicochemical properties. In organic-matter-rich black soils, hydrophobic partitioning between PFAS and soil organic matter serves as the predominant PFAS adsorption mechanism. During this process, the long carbon–fluorine chain of PFAS binds to the hydrophobic regions of soil organic matter through van der Waals forces, or hydrophobic interactions (Fig. 2a). Given their high hydrophobicity, long-chain PFAS are preferentially sequestered within the organic matrix of topsoil and exhibit greater enrichment than their short-chain congeners[54]. Consequently, in areas with organic-matter-rich soils (e.g., peatlands, podzols, and boreal forest soils), hydrophobic interactions between PFAS and soil emerge as the primary adsorption mechanism. This is especially evident in high-latitude regions such as Northern Europe, Canada, and northern Russia, where PFAS mobility and distribution are strongly influenced by chain length[55].
In mineral-rich soils, anionic and cationic PFAS are adsorbed onto oppositely charged mineral surfaces, including those of kaolinite, iron oxides, and montmorillonite (Fig. 2b)[56,57]. This adsorption is governed by soil pH and PFAS functional groups, which modulate mineral surface charge and the electronegativity of PFAS, respectively. In regions such as southern China, Southeast Asia, and the Brazilian Highlands, which are characterized by red soils, electrostatic adsorption may act as an important retention mechanism for short-chain PFAS in agricultural soils[58].
Although ligand exchange and hydrogen bonding occur less frequently, they contribute significantly to the adsorption of PFAS. Ligand exchange primarily occurs on the surfaces of metal hydroxides, where the hydrophilic functional groups of PFAS molecules exchange with hydroxyl groups on oxide surfaces to form complexes (Fig. 2c)[18]. These reactions are strongly influenced by soil pH and typically occur in arid or semiarid alkaline regions, such as northern Australia and central North America[59]. Hydrogen bonding predominantly occurs between hydrophilic soil components (e.g., humic acid and the edge regions of kaolinite) and the electronegative moieties of short-chain PFAS molecules (Fig. 2d)[17]. Given the inherently low bond energy of hydrogen bonds and competition from water molecules, the hydrophobic carbon–fluorine chains of PFAS exhibit limited hydrogen bonding with the soil matrix[14]. Notably, recent studies have demonstrated enhanced adsorption of carboxylic and sulfonic PFAS through charge-assisted hydrogen bonding interactions[60].
Actual soils constitute complex multiphase systems, and the adsorption behaviors vary substantially across different phases, which are commonly governed by PFAS physicochemical properties and soil matrix characteristics. Consequently, a single adsorption mechanism is deficient to recapitulate the authentic migration behavior of PFAS in soils, and separate discussion from different interfaces helps clarify their complex processes.
Interaction of PFAS at the solid–water interface
-
The solid–water interface represents the contact surface between the solid phase and water molecules in soil (Fig. 2e). The adsorption capacity of PFAS at this interface affects their migration and accumulation, and in turn, influences their bioavailability in soil[61]. Broadly, the primary factors influencing adsorption at this interface can be grouped into two categories: the intrinsic properties of PFAS, and characteristics of the soil (Fig. 2e−g).
The influence of PFAS properties on solid–water interface adsorption
-
PFAS properties, including carbon chain length and functional group type, influence their adsorption capacity at the solid–water interface by altering their hydrophobicity. This relation is often quantified using the solid–water partition coefficient (Kd), which reflects the extent to which PFAS adsorb at the interface. For long-chain anionic PFAS, such as certain PFCA and PFSA, hydrophobic adsorption governs their interaction with solid surfaces. The carbon chain length is positively correlated with the hydrophobicity of PFAS (Fig. 2e). For example, the adsorption capacity of perfluorononanoic acid (PFUnA) has been reported to exceed that of PFPeA by > 1,000-fold, leading to its enhanced retention and accumulation in specific environmental compartments[62]. Dynamic soil column studies have demonstrated that 37% of the total PFAS content is retained in soil. Short-chain PFAS exhibit rapid sorption and desorption in soil, whereas long-chain perfluorinated compounds tend to be retained to a greater extent[61,62]. When PFAS possess the same carbon chain length, the hydrophobicity of their functional groups becomes a critical determinant of adsorption capacity—stronger hydrophobicity leads to greater retention. For example, the Kd values of PFHpS and PFOS are 3.8-fold and 5.0-fold higher, respectively, than those of PFCAs with equivalent chain lengths[63]. The Kd values of certain cationic and zwitterionic PFAS exceed those of PFOA by several orders of magnitude (Fig. 2f)[64,65]. Given their positive charge, cationic PFAS undergo hydrophobic adsorption and electrostatic interactions with soil particles. Consequently, their adsorption behavior is likely governed by both the functional group type and the nature of ionic charge[66]. Realistically, PFAS often exist within PFAS mixtures in soil, where the mobility of PFAS in the interfacial region also exhibits strong dependence on the type of functional groups and chain-length of mixed PFAS molecules[67].
The influence of soil characteristics on solid–water interface adsorption
-
Soil characteristics substantially influence the adsorption behavior of PFAS, primarily including soil pH, soil organic carbon (SOC), and cation exchange capacity (CEC). Specifically, soil pH alters PFAS adsorption by influencing both PFAS speciation and soil characteristics. In acidic soils (low pH), PFAS exist in ionic forms, while soil organic matter and mineral surfaces carry positive charges[68]. This leads to hydrophobic interactions, electrostatic attraction, and ligand exchange between the PFAS and soil constituents, thereby enhancing adsorption (Fig. 2g)[69]. As the pH increases, the degree of protonation of soil components decreases, promoting electrostatic repulsion between anionic PFAS and negatively charged soil particles. Under such conditions, short-chain PFAS demonstrate reduced sensitivity to pH variations compared to their long-chain counterparts owing to preferential partitioning into the aqueous phase (low Kd), which renders their adsorption less dependent on soil surface chemistry[67]. The abovementioned electrostatic repulsion increases PFAS mobility and promotes PFAS desorption, thereby elevating their bioavailability in soil pore water.
Moreover, SOC and CEC influence the migration and retention of PFAS in soil by mediating their hydrophobic interactions and electrostatic adsorption, respectively. A few studies have consistently demonstrated a strong negative correlation between SOC content and PFAS mobility; however, SOC content exerts a statistically significant influence on the Kd value only when present at elevated concentrations (> 5%)[70]. Concurrently, close correlations have been observed between Kd values and the calcium and sodium contents of soil, highlighting the important role of CEC in modulating PFAS sorption at the solid–water interface[71]. However, because this correlation is grounded in electrostatic adsorption, it does not extend to nonionic PFAS.
Most precursors are neutral or amphoteric PFAS, and their environmental adsorption is dominated by hydrophobic interactions[66]. Thus, soil organic matter content and soil moisture are the primary factors influencing their migration behavior. Fluorotelomer alcohols (FTOHs) are retained in soil due to their lipophilicity; studies have shown that FTOHs can persist in soil for over 400 d[72]. Since FTOH adsorption in soil is primarily driven by hydrophobic interactions, soil moisture content affects its adsorption capacity. For instance, at 5% moisture, the peak density of 4:2 FTOH on montmorillonite is 2.6-fold higher than that at 10% moisture[73]. Moreover, in real soil environments, moisture can further interfere with the transformation of precursors to PFAS by influencing microbial activity. Under high soil moisture conditions, the transformation and degradation of precursors are reduced due to low oxygen levels, enabling precursors to persist more readily in the environment[74].
Interaction of PFAS at the air–water interface
-
The air–water interface refers to the boundary between air and water within soil pores and constitutes a defining feature of the soil vadose zone (Fig. 2h). The marked difference in surface tension between gaseous and liquid phases generates high surface energy, which drives the spontaneous adsorption of surface-active substances at this interface[75,76]. PFAS molecules feature hydrophobic fluorocarbon chains that orient toward the air phase, while their hydrophilic functional groups remain in the aqueous phase. This amphiphilic behavior promotes substantial PFAS accumulation at the air–water interface, thereby influencing their retention and transport within the soil vadose zone[77]. Previous studies have evaluated PFAS adsorption at this interface using interfacial tension measurements, miscible-displacement experiments, and direct quantification of sorbed PFAS mass[75, 78]. Other studies have reported that PFAS concentration and physicochemical properties, the ionic strength of the soil solution, and soil texture and moisture content all affect PFAS adsorption at the air–water interface[16, 76].
The influence of PFAS properties on air–water interface adsorption
-
PFAS adsorption at the air–water interface exhibits a nonlinear pattern. As PFAS concentration increases, surface tension at the interface declines, thereby promoting sorption (Fig. 2i)[78]. According to nonlinear adsorption models, the adsorption capacity of PFAS remains stable at concentrations below a critical threshold but rises sharply once this limit is exceeded. A previous study demonstrated that this critical concentration decreases with increasing PFAS chain length, suggesting that long-chain PFAS have a competitive advantage in air–water interface adsorption[75].
The influence of soil properties on air–water interface adsorption
-
In addition to the intrinsic properties of PFAS, soil characteristics play a critical role in influencing their adsorption at the air–water interface. In the vadose zone of saline–alkali soils, cations released through salt hydrolysis can enhance PFAS adsorption at this interface. For example, 0.01 M sodium ions have been shown to double the adsorption capacity of PFOS, with sorption increasing steadily as ionic strength rises[75, 79]. Moreover, soil texture and moisture content can alter the air–water interfacial area, thereby affecting PFAS adsorption. Marked differences in this interfacial area have been observed across clay loam, loam, and sandy soils under humid and semiarid conditions (Fig. 2j). Among these, clay loam soils display substantial heterogeneity, with average interfacial areas 149.63% and 207.53% greater than those of loam and sandy soils, respectively. The air–water interfacial area in semiarid soils is 579.66 cm2·cm–3 representing a 13.44% increase relative to that in humid soils. In clayloam soils, preferential flow driven by rapid migration through high-permeability pathways is common and can disrupt air–water interfaces, thereby reducing PFAS adsorption. In arid soils, brief episodes of intense infiltration accelerate the leaching of soluble PFAS. Consequently, PFAS adsorption at the air–water interface in clayloam soils under semiarid conditions is frequently compromised, resulting in rapid PFAS leaching. Given the lower hydrophobicity of short-chain PFAS, they are more prone to leaching from soils through preferential flow[16]. The Loess Plateau in China, and southern Australia are semiarid regions characterized by clay-rich soils. In these areas, PFAS exhibit a high leaching rate and strong migration potential[54]. Future assessments of global PFAS levels in agricultural soils should prioritize these regions.
Adsorption model of PFAS in soil
-
From an experimental perspective, traditional isothermal adsorption models (e.g., Langmuir and Freundlich) can fit monolayer and multilayer adsorption through simple mathematical formulations. However, due to their idealized assumptions, they have limited capacity to describe specific adsorption and cannot predict the impact of environmental conditions on adsorption processes, which demand thermodynamic models to broaden the limitation. For instance, the Leverett Thermodynamic Model (LTM) combined with the Surface Roughness Multiplier (SRM) has been used to predict the adsorption capacity of PFAS at the air–water interface[80]. While a thermodynamic-based model coupling the chemical equilibrium of PFAS with the Poisson-Boltzmann equation has been applied to characterize PFAS adsorption in the thin film layer of the air–water interface[81].
With the development of statistics, machine learning models have been employed to predict the adsorption of PFAS in soil. In particular, the quantitative structure–property relation (QSPR) models have garnered significant attention due to their rapid predictive capability and capacity to incorporate multiple influencing factors[82]. The QSPR model offers a simplified approach for estimating the interfacial adsorption coefficients of PFAS. However, Hodges et al. claimed that its predictive accuracy for anionic species remains inadequate[83]. After modification, the single-descriptor QSPR model performed well for the prediction of Koc only using molar volumes[75]. Despite high efficiency, QSPR models remain confined to predicting adsorption coefficients under equilibrium states and demonstrate no responsiveness to environmental heterogeneity. Thus, the predictive outcomes necessitate supplementation and refinement through experimental validation.
In real soils with coexisting multiphase media, QSPR-based nomographs have been employed to evaluate the relative contributions of solid–water interface adsorption and air–water interface adsorption in soil, which offers a new insight for mathematical modeling of PFAS migration[75]. However, since the high dependence of nomographs on accurate QSPR predictions, they cannot effectively characterize adsorption behavior in complex environments. Furthermore, nomograph models assume that solid–liquid interface adsorption of PFAS is mediated by organic carbon, limiting their applicability to soils with high clay mineral or metal oxide contents. Integrated modeling of PFAS adsorption across global soils is crucial for characterizing global PFAS-contaminated sites and conducting risk assessments.
-
After being absorbed by epidermal cells in plant roots, PFAS are transported via two pathways: the apoplast and symplast[84]. Along the apoplastic pathway, PFAS bypass cell membranes and migrate through cell walls and intercellular spaces. In contrast, during symplastic transport, PFAS cross cell membranes via passive diffusion and active transport and are subsequently translocated through plasmodesmata (Fig. 3a). Upon reaching the endodermis, PFAS encounter Casparian strips, which act as selective filters in root endodermal tissues. Structurally, these formations create a paracellular barrier that regulates selective nutrient uptake and restricts the entry of pollutants (Fig. 3b)[85]. Studies confirm that Casparian strips effectively restrict the translocation of long-chain PFAS from roots to shoots.
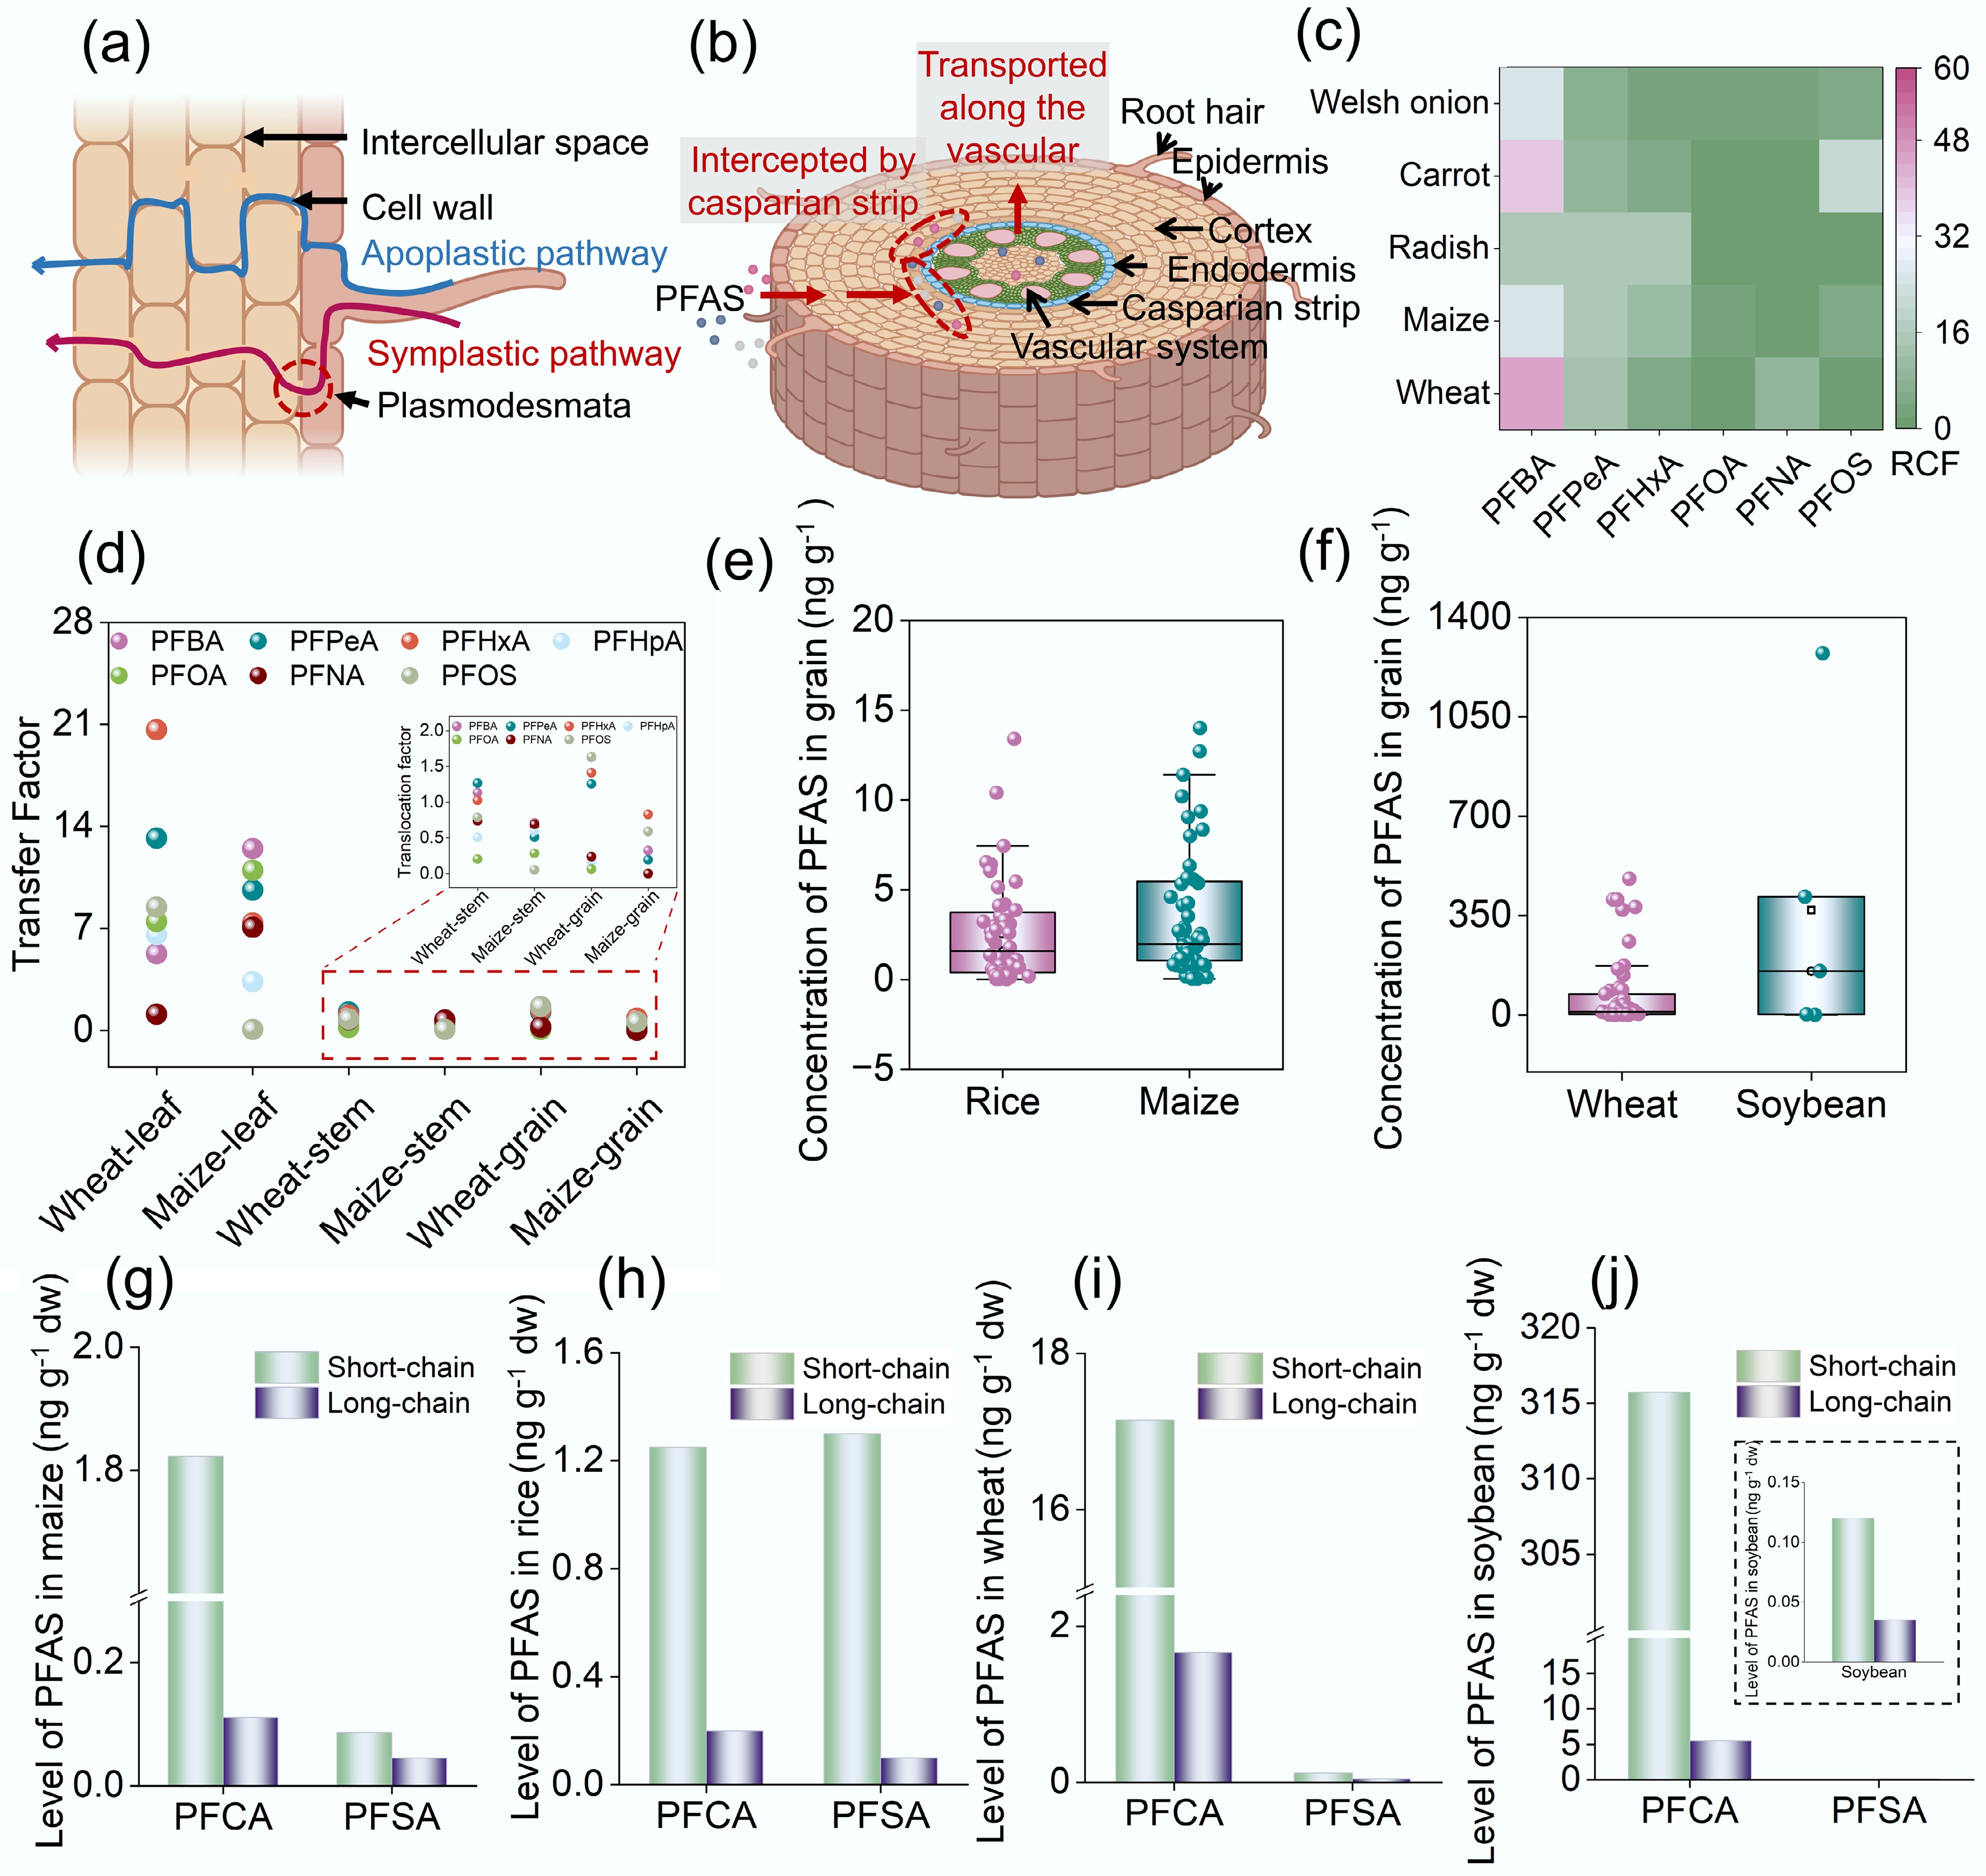
Figure 3.
Absorption and translocation of PFAS in plants and associated influencing factors. (a) PFAS enter plant roots via apoplastic and symplastic pathways. (b) PFAS are intercepted by Casparian strips in the root endodermis. (c) Root concentration factors (RCFs) of PFAS with varying chain lengths in Welsh onion, carrot, radish, maize, and wheat roots[74]. (d) Transfer factors of PFAS with different chain lengths from roots to leaves, stems, and grains in wheat and maize[86]. (e), (f) Data retrieved from the Web of Science database were statistically analyzed to determine PFAS concentrations in rice (n = 52), maize (n = 56), wheat (n = 51), and soybean (n = 4). The detailed search method is provided in Supplementary Text S3. In the boxplots, the horizontal line represents the average value, and the small square indicates the median. Concentrations of PFCA and PFSA with varying chain lengths in (g) maize, (h) rice, (i) wheat, and (j) soybean[65].
Bioaccumulation of PFAS in plant roots
The properties of PFAS affecting accumulation in plant roots
-
Hydrophobicity is strongly dependent on carbon chain length, with short-chain PFAS exhibiting greater hydrophilicity and lower molecular weights, which facilitates easier uptake by plant roots. As the chain length increases, PFAS become more hydrophobic, which enhances their adsorption in roots[87]. Previous studies have identified a U-shaped relation between RCF and carbon chain length in PFAS, with the lowest RCF observed for C7 PFCA[88]. Studies on vegetables and grain crops corroborate this U-shaped pattern, showing that PFBA accumulates the most in plant roots, while PFOA exhibits the least accumulation (Fig. 3c)[86]. For short-chain PFAS, an inverse correlation exists between hydrophobicity and the RCF, a trend consistently observed across plant species. For example, the RCF of PFPeA in wheat is 9.0-fold higher than that of PFOA[89]. Similarly, the RCF values of PFBA in radish, carrot, green onion, and celery are 1.01-, 9.28-, 6.53-, and 8.22- fold higher, respectively, than those of PFHxA[86]. Conversely, in the case of long-chain PFAS, hydrophobicity is positively correlated with the RCF, primarily owing to greater PFAS adsorption in the rhizosphere. Additionally, the Casparian strip restricts the upward translocation of long-chain PFAS, resulting in their accumulation within root tissues. The RCF of 8:2 chlorinated polyfluorinated ether sulfonate (8:2 Cl-PFESA) is 1.54-fold higher than that of 6:2 Cl-PFESA[90,91]. Functional groups also influence RCF considerably; for instance, PFOS has a much higher RCF than PFOA. According to a previous study, the RCF of PFOS is 17.9 mL·g-1, which is 1.7 times greater than that of perfluorononanoic acid (PFNA)[91]. Studies on Cl-PFESAs indicate that the ether bond reduces the hydrophobicity of 6:2 Cl-PFESA, resulting in an RCF that is 0.93-fold that of PFOS[92].
Upon entering the soil, PFAS precursor substances are primarily adsorbed onto plant roots. A portion undergoes transformation under the action of root exudates, while some can enter root cells and be transformed by biological enzymes. It is found that perfluorooctane sulfonamide (PFOSA) in wheat roots can undergo carbon-carbon bond cleavage and defluorination reactions under the catalysis of cytochrome P450 (CYP450) and glutathione-S-transferase (GST), degrading into PFOS, PFHxS, and PFBS[93,94]. Similarly, 8:2 polyfluoroalkyl phosphate diester (diPAP) undergoes carbon-carbon bond cleavage in carrots, being transformed into PFOA. The compounds generated through these transformations then undergo differential accumulation and translocation based on characteristics such as chain length and functional groups.
Plant characteristics affecting the accumulation of PFAS in roots
-
PFAS accumulation in plant roots is strongly influenced by root lipid and protein content. Lipids mediate the partitioning of macromolecular organic compounds, while transport proteins affect PFAS uptake[88, 95]. Root concentrations of PFOA and PFOS show positive correlations with protein content (PFOS: y = 0.347x + 0.949, r = 0.825, p = 0.022; PFOA: y = 0.926x – 1.126, r = 0.77, p = 0.043) but negative correlations with lipid content (PFOS: y = –0.788x + 5.746, r = –0.864, p = 0.012; PFOA: y = –3.251x + 5.2, r = 0.764, p = 0.046)[96]. In general, vegetable roots accumulate lower levels of PFAS than grain crops, particularly long-chain compounds such as PFOA and PFNA. This is attributed to intense transpiration, driven by the large leaf surfaces of vegetables, which promotes the upward migration of PFAS[97]. Carrot and radish exhibit higher RCFs than Welsh onion, potentially because their less developed Casparian strips impose weaker restrictions on PFAS uptake. Carrot roots exhibit greater PFAS accumulation than radish, which aligns with their higher protein content. Phloem-derived carrot tissue contains 1% protein, which is 0.3% higher than that of xylem-derived radish tissue[98]. Among grain crops, wheat roots contain higher protein levels (approximately 12%–14%) compared to maize roots (7%–10%)[99,100]. In addition, root exudates contain effective components, which include lignin, tannins, and organic acids[101,102]. They can inhibit the adsorption of PFAS in soil and also significantly improve the bioavailability of PFAS in plant roots. However, differences in gene expression among plants lead to differences in the content of effective components in root exudates. This results in differences in the level of PFAS uptake by plants. Studies have found that the concentration of PFOS in shoots and roots of lettuce with high PFAS accumulation is 3.4–4.7 times, and 1.2–1.4 times that of lettuce with low PFAS accumulation, respectively. Therefore, the composition and content of root exudates can also affect the uptake of PFAS by plant roots to a certain extent.
Soil properties affecting the accumulation of PFAS in plant roots
-
In addition, soil conditions also exert an impact on the uptake of PFAS in plants, such as pH, temperature, moisture, and SOC. Since plant absorption and translocation of PFAS are primarily driven by transpiration, soil temperature and moisture stand as key factors influencing this process. For instance, the uptake of PFAS in wheat at 30 °C is twice that at 20 °C[103]. Moreover, soil pH affects the absorption level of PFAS in plants by altering the existing forms of PFAS. In acidic environments, plants exhibit a higher absorption level of ionic PFAS. When the pH increases from 5.0 to 7.0, the PFAS content in maize roots decreases from 2.51 to 1.51 μg g–1 dw[104]. SOC can alter the adsorption of PFAS onto soil particles. A previous study reported that as SOC content increased, the bioaccumulation of PFAS decreased significantly[105]. This could be attributed to the enhanced adsorption of PFAS onto soil particles, which reduces the bioavailability of PFAS to plants.
Transformation of PFAS in plants
-
Compared to root systems, aboveground plant tissues also exhibit considerable PFAS accumulation, which is quantified using the translocation factor. To assess compartment-specific PFAS accumulation, we calculated the migration kinetics of PFAS from roots to leaves, stems, and grains in maize and wheat, based on data reported by Liu et al[86]. As depicted in Fig. 3d, long-chain PFAS are substantially retained in roots owing to interception by Casparian strips and physicochemical retention, whereas short-chain PFAS, particularly PFBA and PFPeA, exhibit high transfer factors in leaves. The TF of short-chain PFCAs is approximately 14-fold greater than that of PFOA. In vegetables grown near Chinese fluorochemical industrial parks, short-chain PFAS accounted for 96.5% of the total PFAS content in plant tissues, and PFBA accounted for an average of 74.5% of PFAS across vegetable species[106].
Leaf tissues accumulate the highest concentrations of PFAS, which migrate upward through water uptake and transpiration streams and ultimately become sequestered in leaf cells. Vegetables such as carrots and radishes, which lack Casparian strips in their roots, exhibit greater PFAS bioaccumulation in leaves than other plant species. In contrast, PFAS enrichment in stems remains relatively low, with no consistent relation among translocation factors, carbon chain length, and hydrophobicity. Because PFAS levels in plant tissues are positively correlated with protein content, grains accumulate considerably higher PFAS concentrations than stems, likely owing to their elevated protein content (Fig. 3d). Wheat exhibits a markedly greater PFAS accumulation capacity, with hydrophobic PFOS and PFNA being predominant. This trend aligns with the higher protein content in wheat (15.7%), compared to maize (8%), suggesting that molecular adsorption between PFAS and proteins may underlie this disparity. PFAS precursors migrate and transform in plants, and their transformation products accumulate in different plant tissues. Specifically, 8:2 diPAP undergoes migration and transformation in carrots. Among its transformation products, PFOA exhibits the highest concentration in the epidermis and core of carrots, while PFBA is most abundant in the leaves. This observation indicates that short-chain compounds with stronger hydrophilicity are more prone to translocation within plants via transpiration[107]. The migration and transformation of 6:2 Cl-PFESA and 8:2 Cl-PFESA in wheat also exhibit the phenomenon that short-chain transformation products accumulate in leaves, which support the perspective[92].
According to statistics from the Food and Agriculture Organization (FAO), global grain production reached 9.6 billion tons in 2022, representing a 56% increase over the 2000 yield[108]. Given the accumulation of PFAS in grains and the associated risk of dietary exposure, quantifying PFAS concentrations in globally cultivated grain crops has become a pressing need. This review leverages the PFAS data of maize, wheat, rice, and soybeans collected from 174 sampling sites. Details of the data collection methodology are provided in Supplementary Text S3. The results indicate that rice grains contain the lowest PFAS levels (1.6 ng·g–1 dw), followed by maize (2.0 ng·g–1 dw), while wheat and soybeans exhibit higher concentrations of 11.8 and 154.4 ng·g–1 dw, respectively (Fig. 3e, f). In grains, PFSA concentrations exceed those of PFCAs, indicating an inverse relation between PFAS accumulation and carbon chain length. The concentrations of short-chain PFAS are 6.2- to 56.9-fold greater than those of long-chain PFAS in grain samples (Fig. 3g–j). As one of the most valuable global crops, soybean production has been increasing continuously since 1961 and has reached 4.22 billion tons as of 2025[108]. Given this scale of production, the dietary intake of PFAS via soybeans by humans and animals alike may be considerable. The potential food safety and public health implications of PFAS contamination in agricultural soils thus merit urgent attention.
-
Extensive studies have been conducted on the sources of PFAS in agricultural soil. The risks of PFAS contamination from agricultural reuse of waste and wastewater have been widely elucidated. Considering global variations in emissions, a regional review on a global scale is provided in this study. Despite the recognized risks of agricultural reuse of waste and sewage, regulatory responses remain limited. In particular, to date, only a few countries, such as the US, Australia, and Germany, have imposed restrictions on PFAS concentrations in biosolids, while many regions still lack formal regulatory frameworks. In contrast to the development of PFAS removal technologies, restricting the reuse of high-load waste and wastewater is the most cost-effective, efficient, and expeditious strategy to curb PFAS infiltration into agricultural lands The authors appeal to governments worldwide, especially Asian countries, to accelerate the formulation and implementation of relevant regulatory framework governing the agricultural reuse of biosolids and wastewater.
Previous studies have focused on characterizing the behaviors of PFAS at the solid–water and air–water interfaces in isolation. Although QSPR models, combined with nomograph, have attempted to evaluate the contributions of adsorption across different interfaces, predictive targets still have remarkable limitations. The adsorption capacity directly influences the bioavailability and biological toxicity of PFAS. Accurate prediction of the contents of adsorbed and dissolved PFAS in soil is critical for environmental risk assessment of PFAS. Currently, effective models capable of comprehensively predicting PFAS adsorption behavior in different soil types are lacking, particularly when considering multiple factors such as soil texture, moisture content, and pH simultaneously. Classifying and modeling anionic, cationic, zwitterionic, and nonionic PFAS separately may offer a solution to this challenge[109]. Existing research has elucidated the relationship between anionic PFAS migration and soil minerals in the US, reminding us of that regional characterization and prediction could be a viable approach. Regional predictions also lay the foundation for establishing global-scale predictive models in the future.
Dissolved PFAS are absorbed by plant roots and subsequently transported to aboveground parts. Machine learning models have been developed to simulate PFAS uptake by roots and predict root enrichment. However, the prediction of PFAS distribution across different plant parts, especially edible tissues, remains inadequate. Integrated modeling of PFAS adsorption across global soils could facilitate the mapping of bioavailable PFAS and the prediction of crop contamination levels across regions, an approach that warrants urgent advancement. This effort would substantially mature the global PFAS risk assessment and enhance societal comprehension of the new contaminants.
-
It accompanies this paper at: https://doi.org/10.48130/newcontam-0025-0007.
-
Not applicable.
-
The authors confirm their contributions to the paper as follows: study conception and design, writing − manuscript revision and editing: Han M, Qin C, Gao Y; data collection and analysis: Han M, Qin C; writing − draft manuscript preparation: Han M. All authors reviewed the results and approved the final version of the manuscript.
-
The datasets used or analyzed during the current study are available from the corresponding author upon reasonable request.
-
This work was supported by the National Key Research and Development Program of China (2023YFE0110800), the National Natural Science Foundation of China (42430703, 42477419, U22A20590), and Jiangsu Agricultural Science and Technology Innovation Fund (CX(24)1002).
-
The authors declare that they have no conflict of interest.
-
Full list of author information is available at the end of the article.
- Supplementary Table S1 Feature importance of the waste generation model.
- Supplementary Table S2 Feature importance of the sewage discharge model.
- Supplementary Text S1 The data sources and modeling methods for machine learning.
- Supplementary Text S2 Process for searching the levels of PFAS in compost, biosolids and wastewater.
- Supplementary Text S3 Process for searching the levels of PFAS in grain of rice, maize, wheat, and soybean.
- Supplementary Fig. S1 The reliability of the waste generation model. The correlation between the predicted values and the actual values indicates the reliability of the model (R2 = 0.823, p < 0.05).
- Supplementary Fig. S2 The reliability of the sewage discharge model. The correlation between the predicted values and the actual values indicates the reliability of the model (R2 = 0.525, p < 0.05).
- Supplementary Fig. S3 The concentration of PFAS in compost and biosolid from different regions in global scale. (a) The concentration of PFAS in compost from Europe, North America, and The Pacific. (b) The concentration of PFAS in biosolid from East Asia, Europe, The Pacific, Sub-Saharan and North America.
- Copyright: © 2025 by the author(s). Published by Maximum Academic Press, Fayetteville, GA. This article is an open access article distributed under Creative Commons Attribution License (CC BY 4.0), visit https://creativecommons.org/licenses/by/4.0/.
-
About this article
Cite this article
Han M, Qin C, Gao Y. 2025. Sources and transport of per- and polyfluoroalkyl substance (PFAS) in agricultural soil–plant systems. New Contaminants 1: e005 doi: 10.48130/newcontam-0025-0007 

Sources and transport of per- and polyfluoroalkyl substance (PFAS) in agricultural soil–plant systems
- Received: 30 June 2025
- Revised: 15 July 2025
- Accepted: 25 August 2025
- Published online: 04 September 2025
Abstract: Per- and polyfluoroalkyl substance (PFAS), a class of new contaminants, have garnered increasing research attention in recent years owing to their environmental persistence and biological toxicity. Agricultural soils influence human health and exhibit marked spatial heterogeneity on a global scale. However, systematic reviews on the sources and transport of PFAS in soil–plant systems, across different regions, remain limited. To bridge this gap, this review focuses on the PFAS loading introduced into agricultural soil through waste and sewage reuse, highlighting biosolids as the primary source of PFAS contaminants. Global waste emission data revealed elevated PFAS risks in Western Europe, Australia, and East Asia. Subsequently, PFAS migration behaviors in soils and plants were examined. The results showed long-chain PFAS have strong adsorption in plant roots and soil, especially in soil rich in organic matter and minerals. In contrast, short-chain PFAS exhibit greater mobility and tend to accumulate in leaves and grains, driven by transpiration and tissue protein content. This raises concern over elevated PFAS risks in high-protein crops, particularly soybeans. The present study proposes that imposing strict limits on PFAS concentrations in waste reuse products is the most effective strategy to control their infiltration into agricultural soils. Additionally, migration models of PFAS in soils and plants are essential for predicting their bioavailability. The prioritized establishment of regional predictive models provides an effective strategy to counteract the complexity of soil properties. Integrating such models with regional soil heterogeneity data is conducive to assessing the global risks of PFAS contamination in agricultural soils in the future.