-
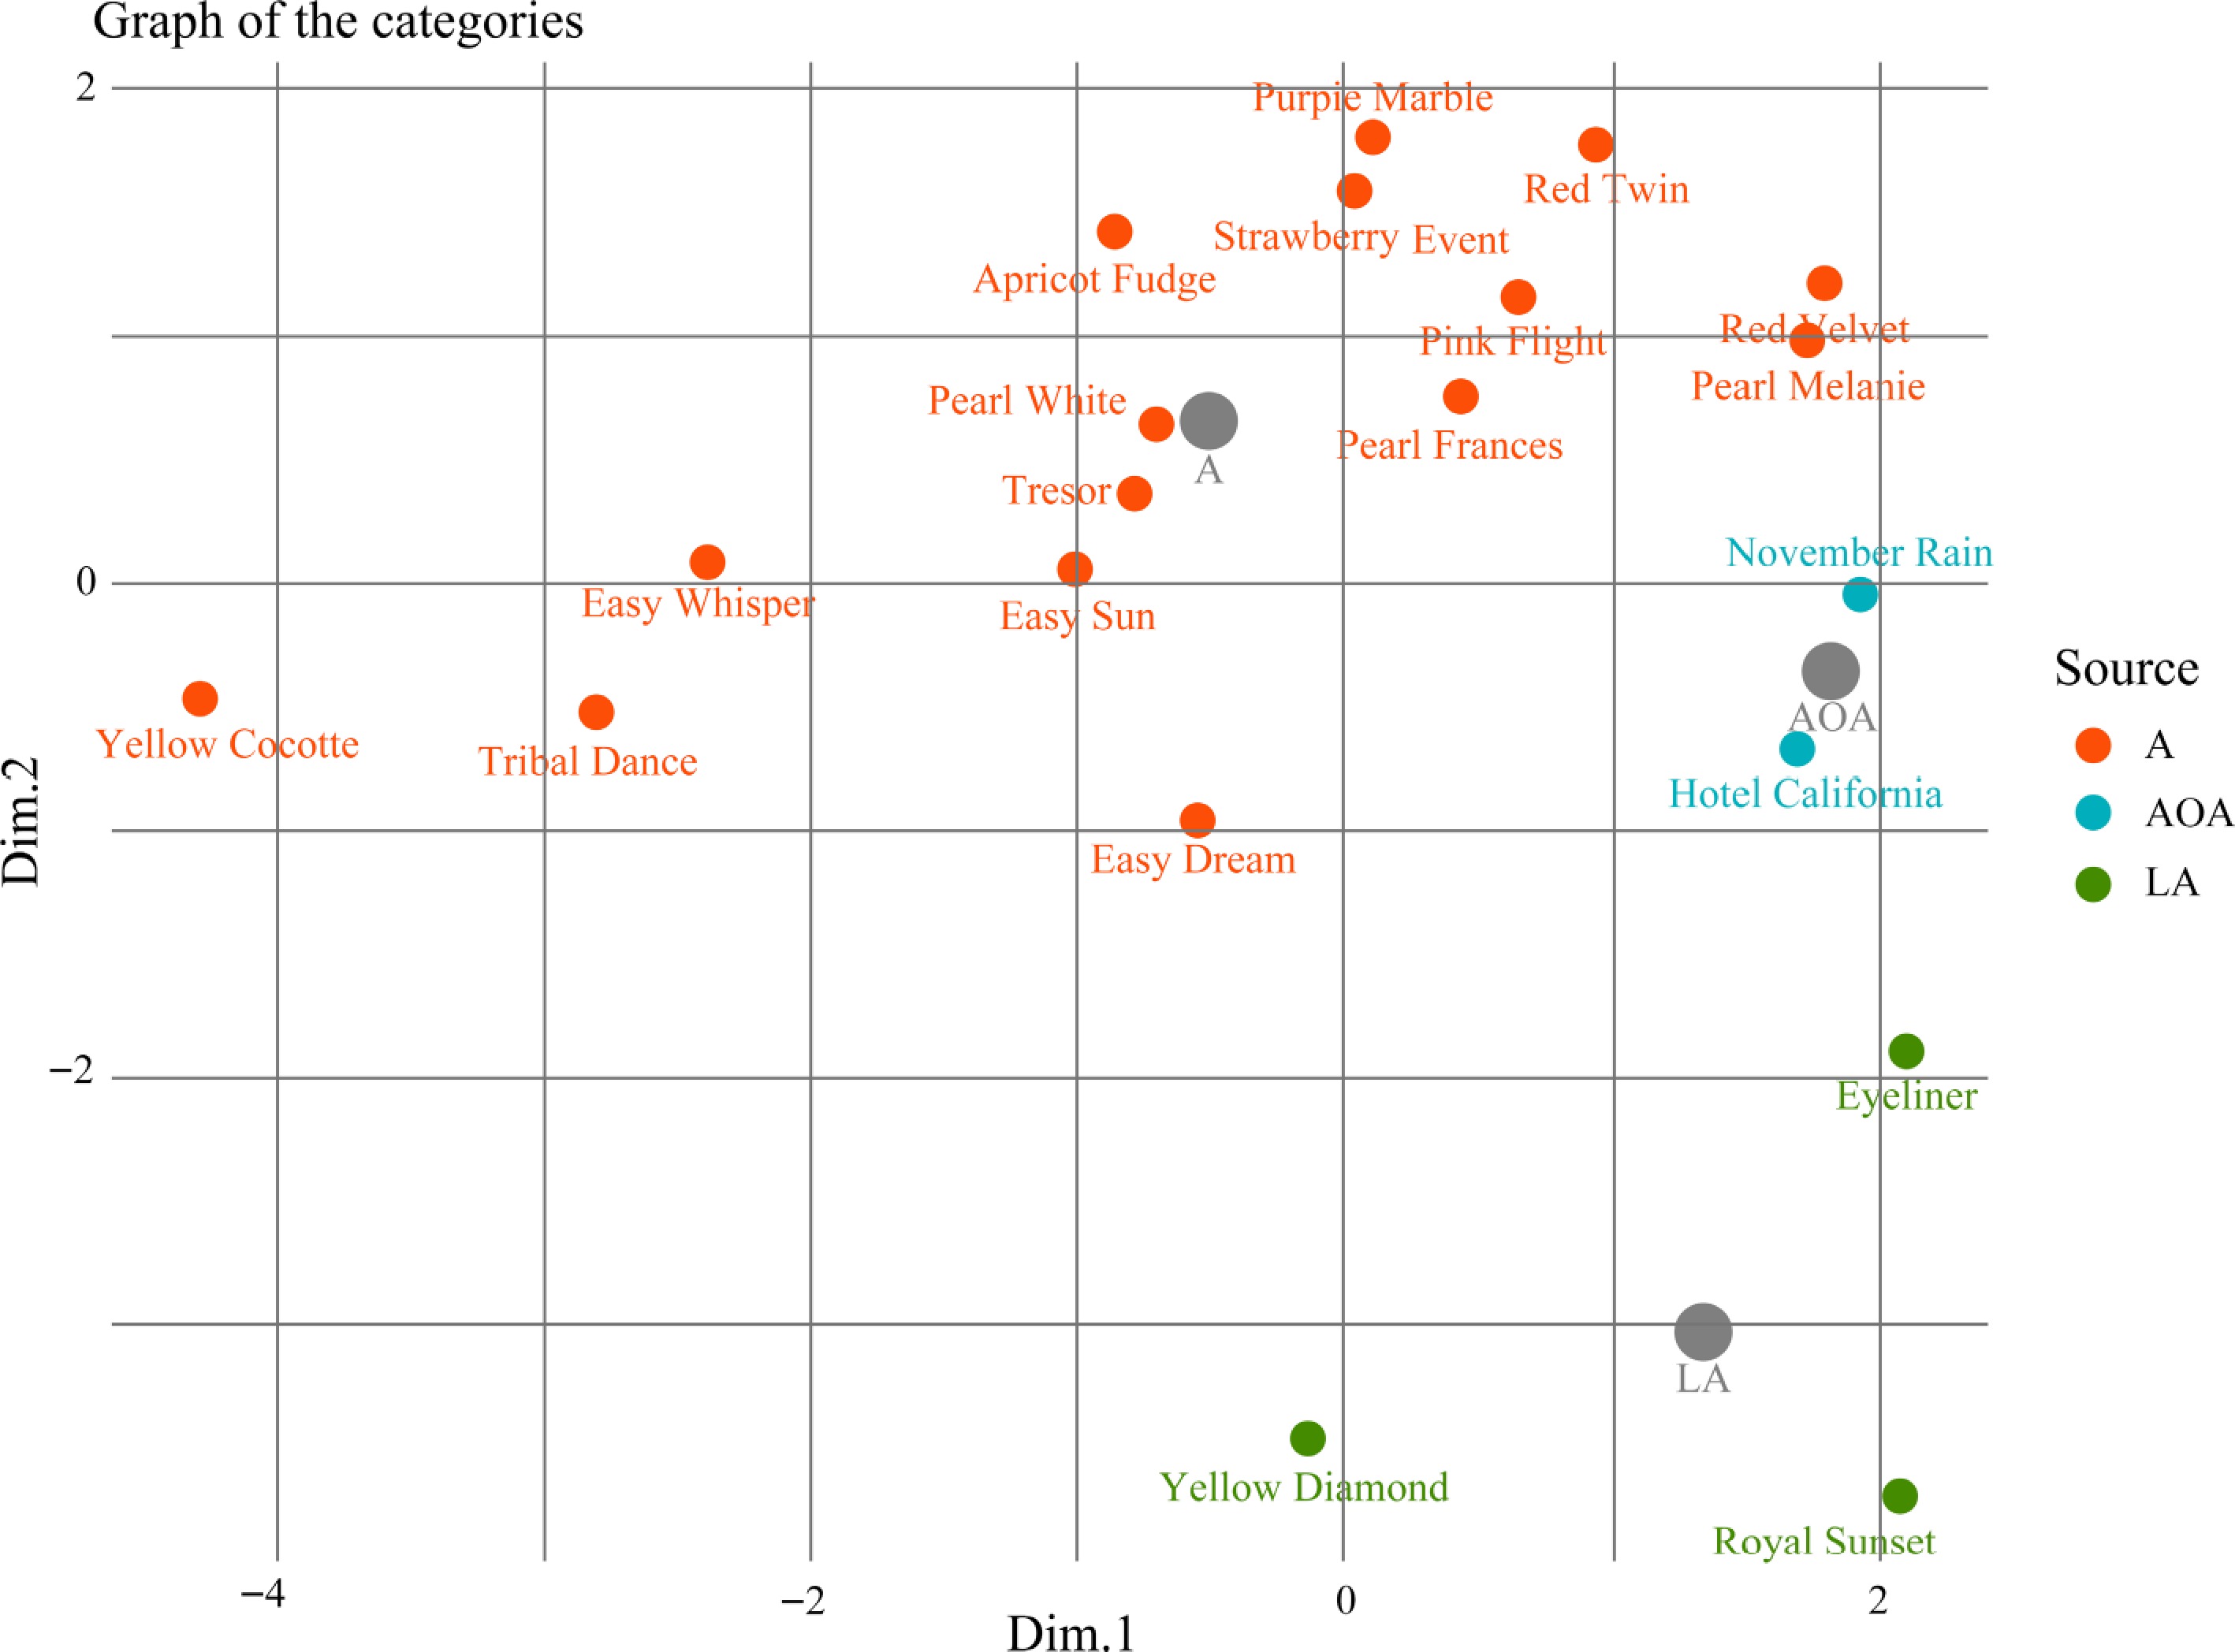
Figure 1.
PCA analysis of morphological indices data of different varieties of lily scales. The morphological indices data of 20 varieties were selected for analysis. n = 64 scales per variety.
-
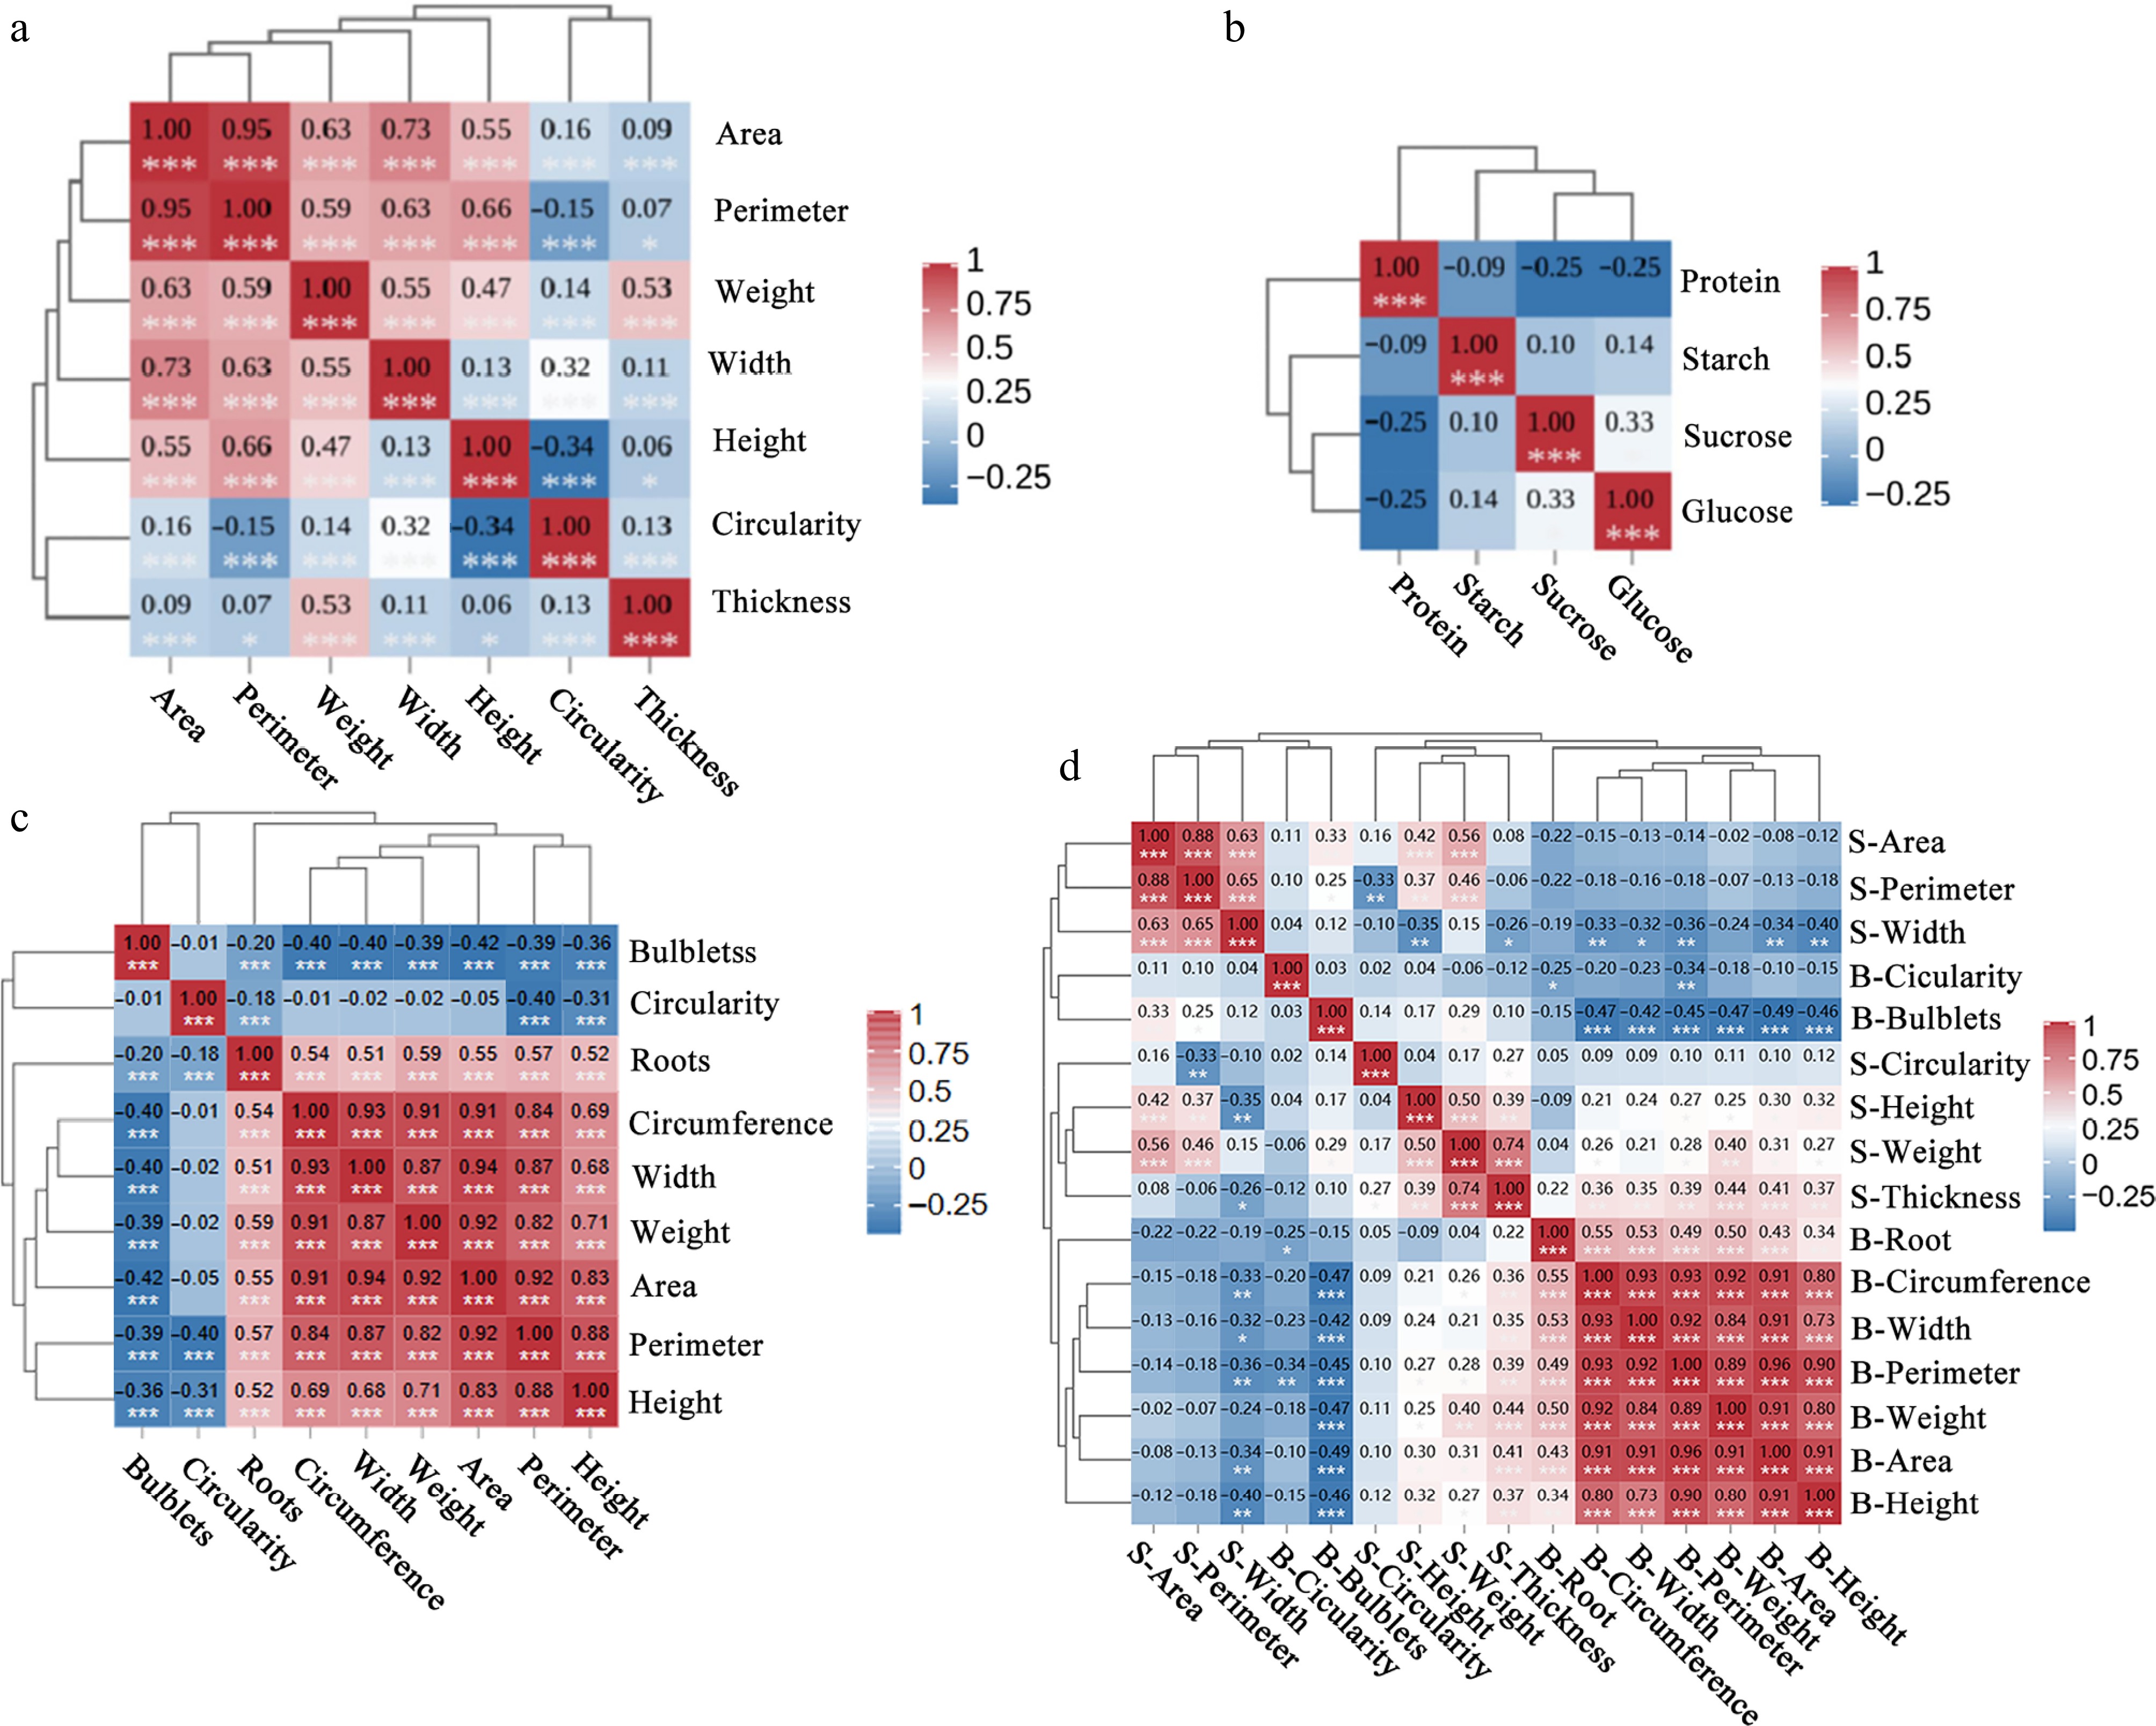
Figure 2.
Correlation analysis of morphological and nutritional indices of scales and bulblets. Correlation heat map of (a) morphological indices, and (b) nutritional indices of lily scales. 1,280 scales of 20 lily varieties were selected for data analysis. (c) Lily bulblets morphological indices correlation heat map, select 20 lily varieties, 2,601 bulblets for data analysis. (d) Correlation analysis of the scales' morphological indices and bulblets' morphological indices. 1,280 scales and 2,601 bulblets produced after propagation were selected for data analysis. The morphological indices of the scales and the morphological indices of the bulblets were in one-to-one correspondence. S represents the scales, and B represents the bulblets. The correlation heat map was made by the Jidi'ao Biological Online Data Analysis Platform (
www.omicshare.com ). The number in the heat map represents the Pearson correlation coefficient between the horizontal axis and the vertical axis index (represented by the letter r). The color represents the degree of correlation. The positive correlation is red, and the negative correlation is blue. The stronger the correlation, the deeper the color of the table. The * under the number represents the p value. No *: p ≥ 0.05, *: 0.01< p < 0.05, **: 0.001 < p<0.01, ***: p = 0.001. -
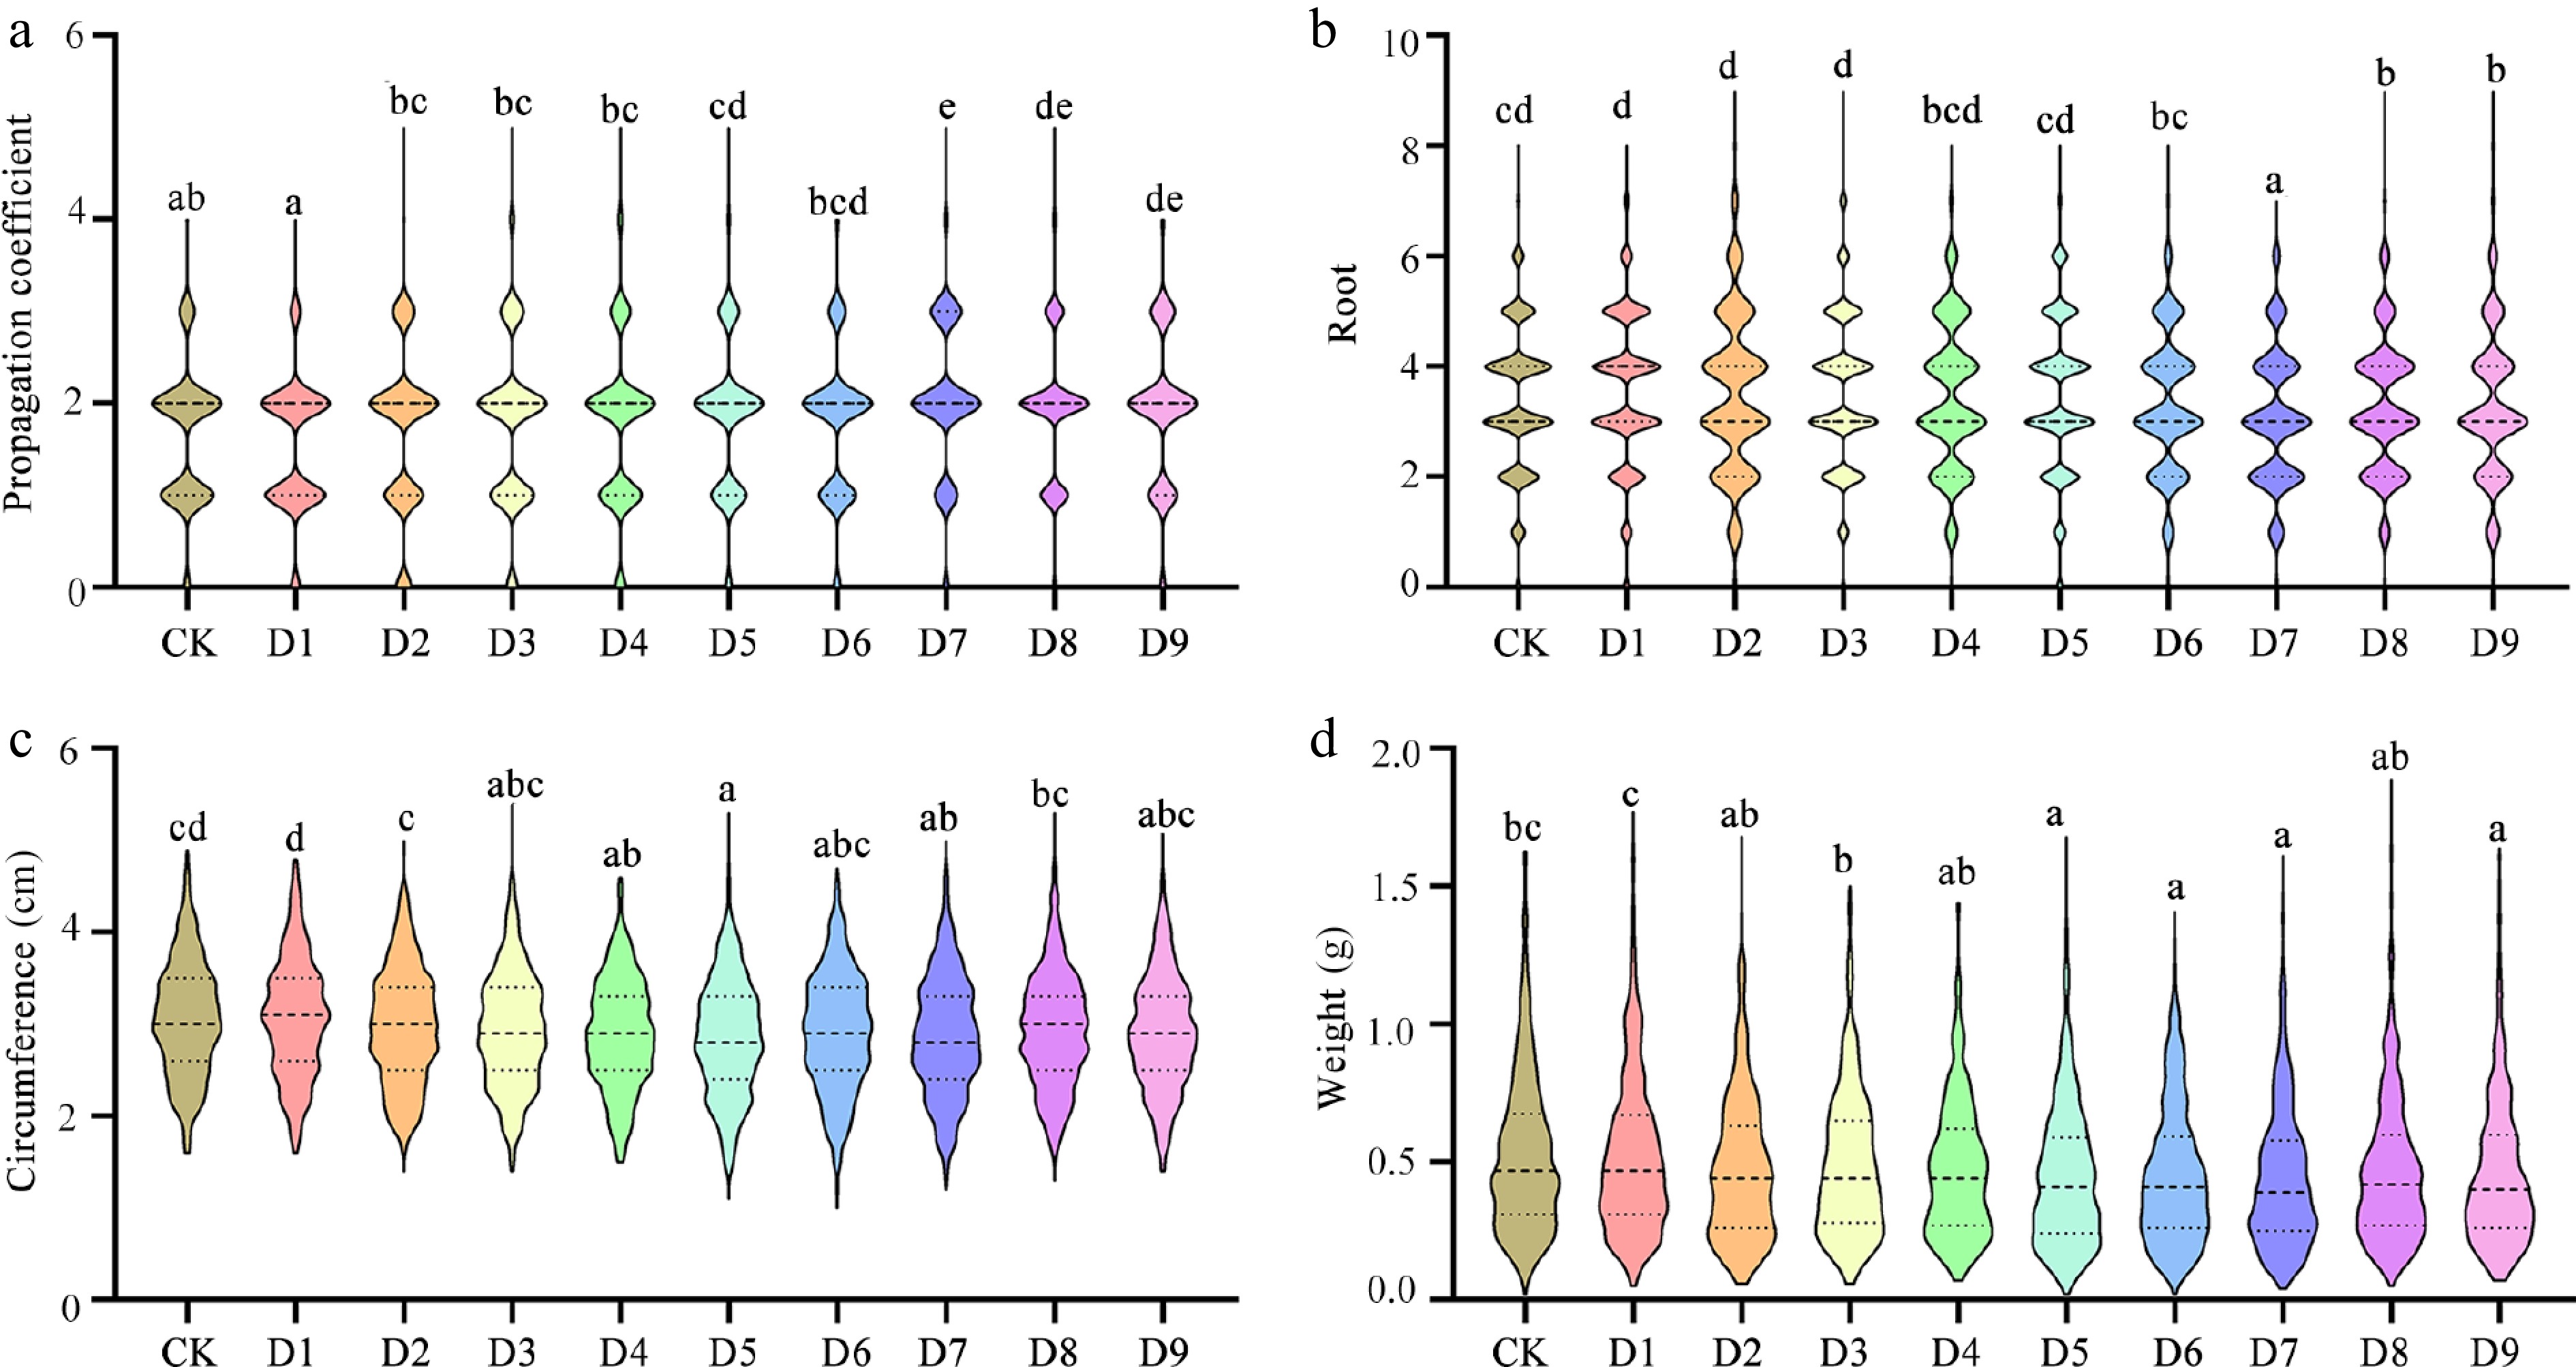
Figure 3.
Influence of different disinfection techniques on morphological indices of bulblets. (a) Analysis of propagation coefficient for bulblet. (b) Analysis of the number of roots for bulblets. (c) Analysis of circumference for bulblets. (d) Analysis of weight for bulblets. Data is based on the mean of bulblets generated from 64 scales of five varieties and is analyzed using ANOVA. Different letters indicate significant differences at p ≤ 0.05. CK: 30 min soaking in clean water; D1: 15 min soaking in water at 42 °C. D2: 30 min soaking in water at 42 °C. D3: 45 min soaking in water at 42 °C. D4: 30 min soaking in 1 g/L carbendazim. D5: 30 min soaking in 0.7 g/L carbendazim. D6: 30 min soaking in 0.5 g/L carbendazim. D7: 30 min soaking in 2 g/L mancozeb. D8: 30 min soaking in 1 g/L mancozeb. D9: 30 min soaking in 0.7 g/L mancozeb.
-
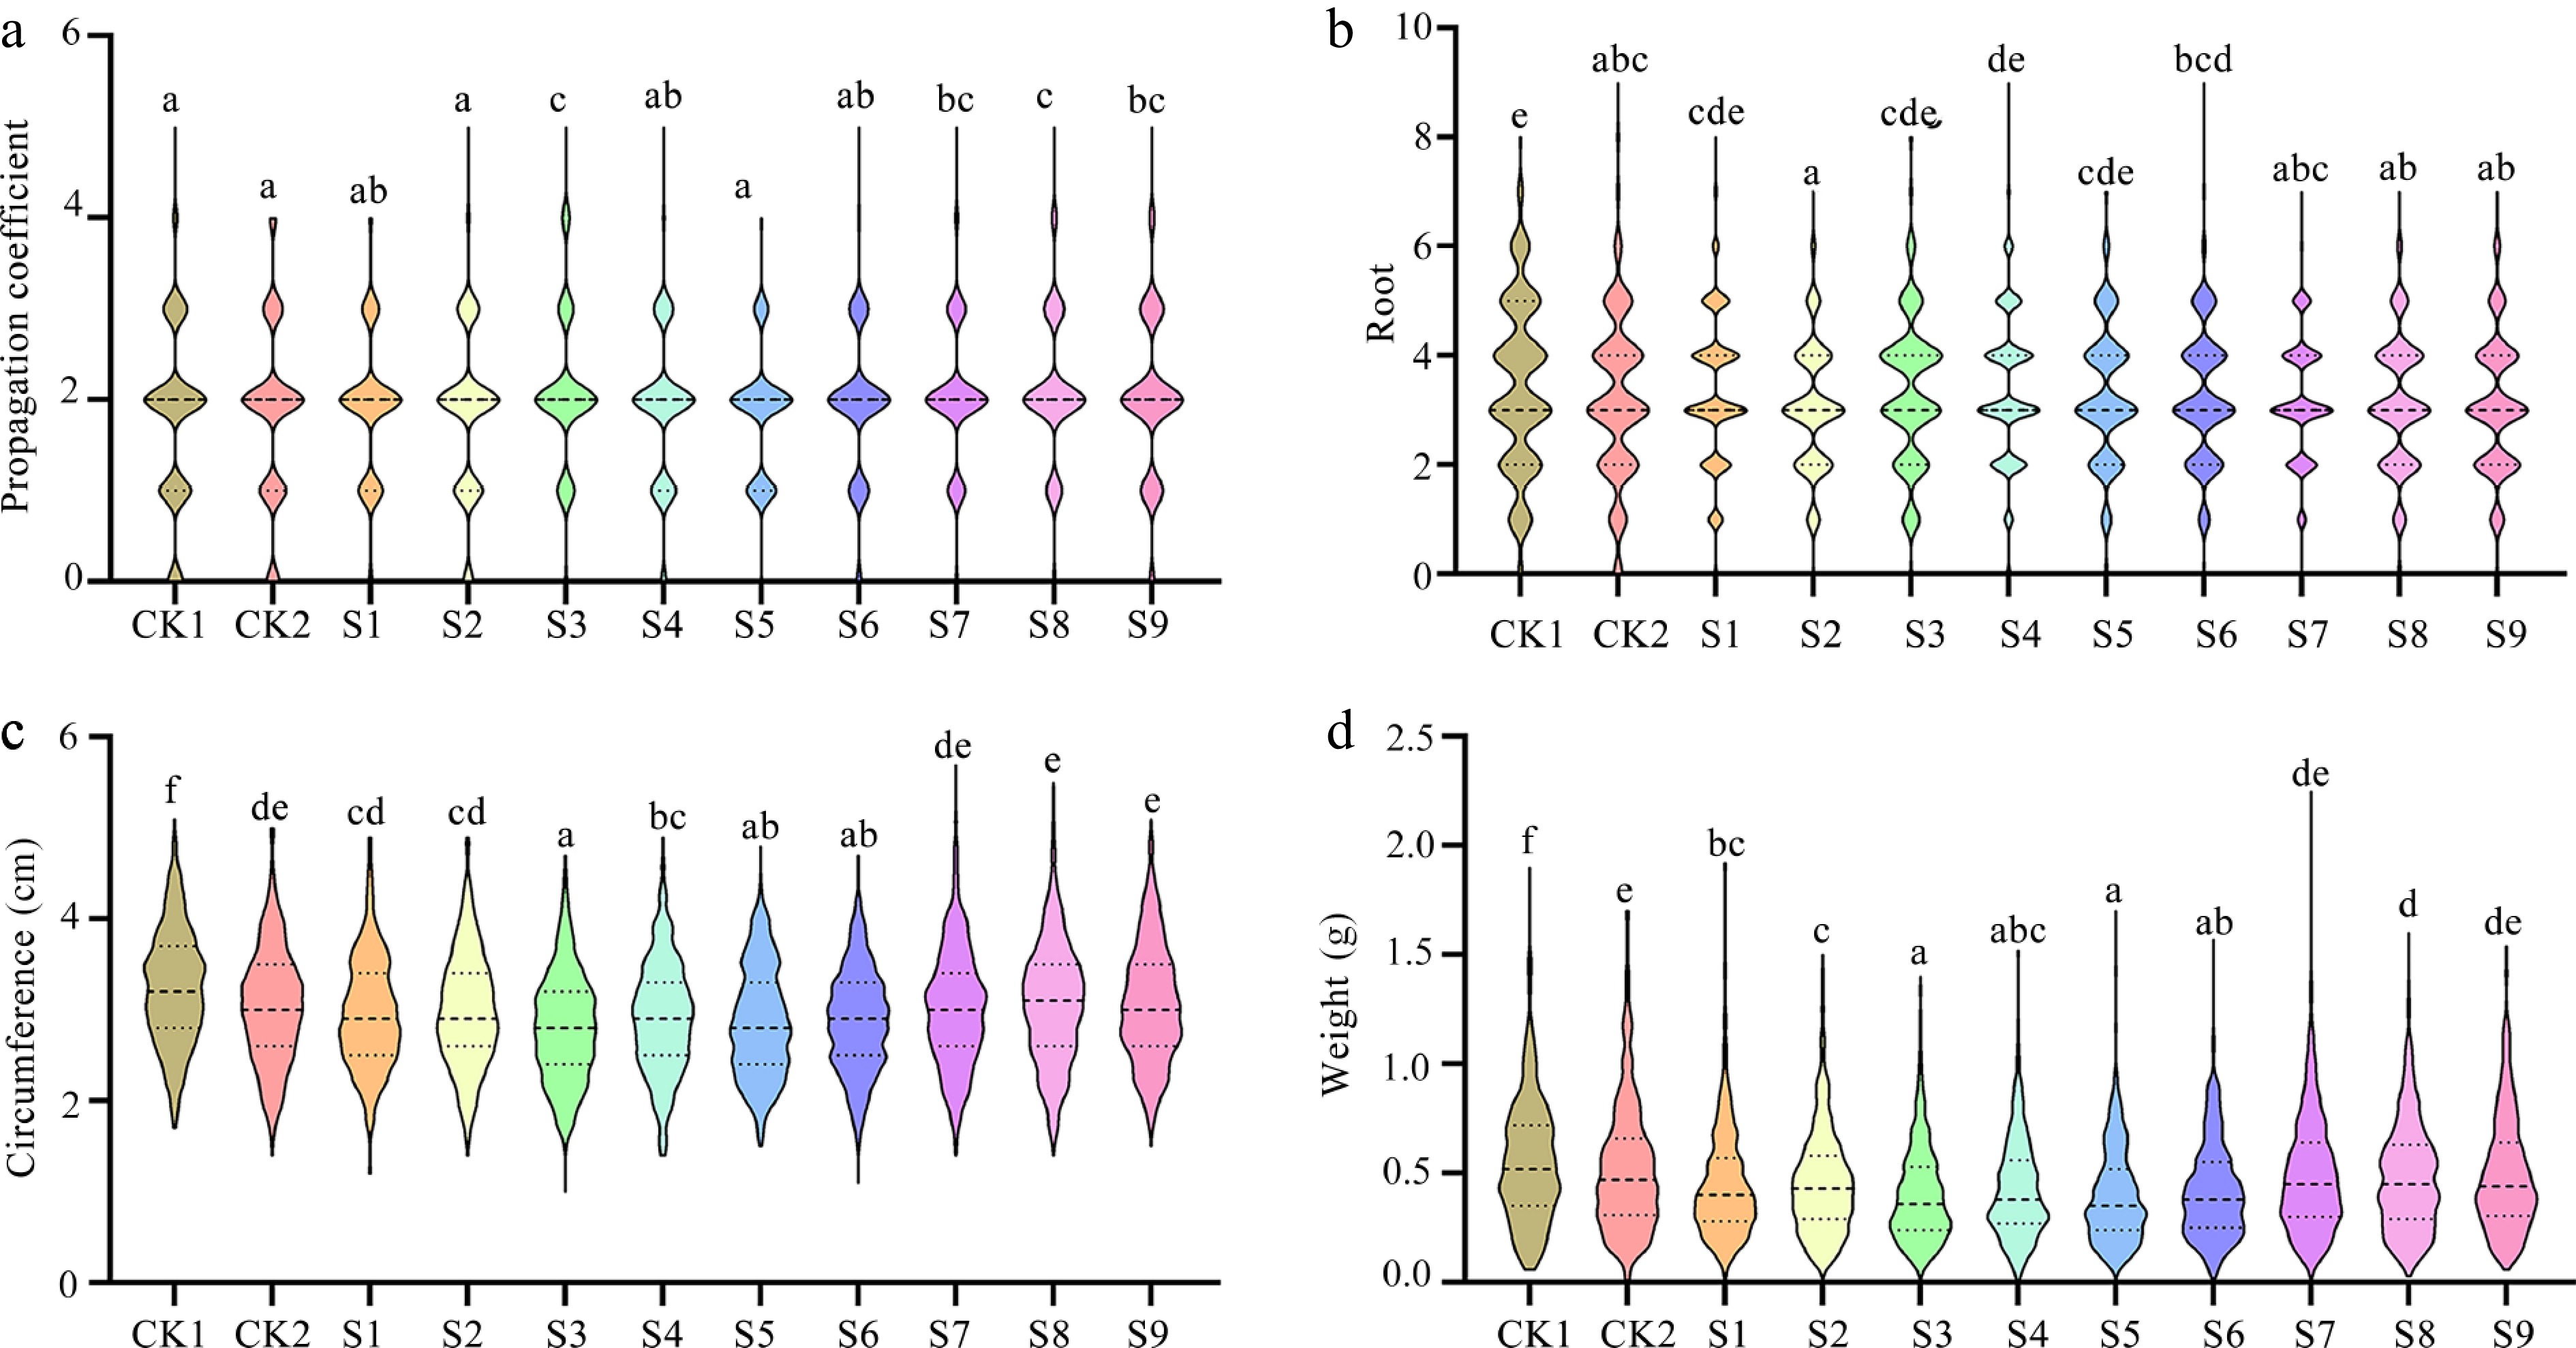
Figure 4.
Influence of different substrates on morphological indices of bulblets. (a) Analysis of propagation coefficient for bulblet. (b) Analysis of the number of roots for bulblets. (c) Analysis of circumference for bulblets. (d) Analysis of weight for bulblets. Data is based on the mean of bulblets generated from 64 scales of five varieties, and is analyzed using ANOVA. Different letters indicate significant differences at the p ≤ 0.05 level. CK1: Garden soil with high-temperature disinfection. CK2: Garden soil without high-temperature disinfection. S1: Vermiculite. S2: Imported peat. S3: Perlite. S4: Imported peat : perlite : vermiculite = 1:1:1. S5: Imported peat : perlite : vermiculite = 2:1:1. S6: Imported peat : perlite : vermiculite = 3:1:1. S7: Domestic peat : perlite : vermiculite =1:1:1. S8: Domestic peat : perlite : vermiculite = 2:1:1. S9: Domestic peat : perlite : vermiculite =3:1:1. The ratio indicates the volume ratio of each component.
-
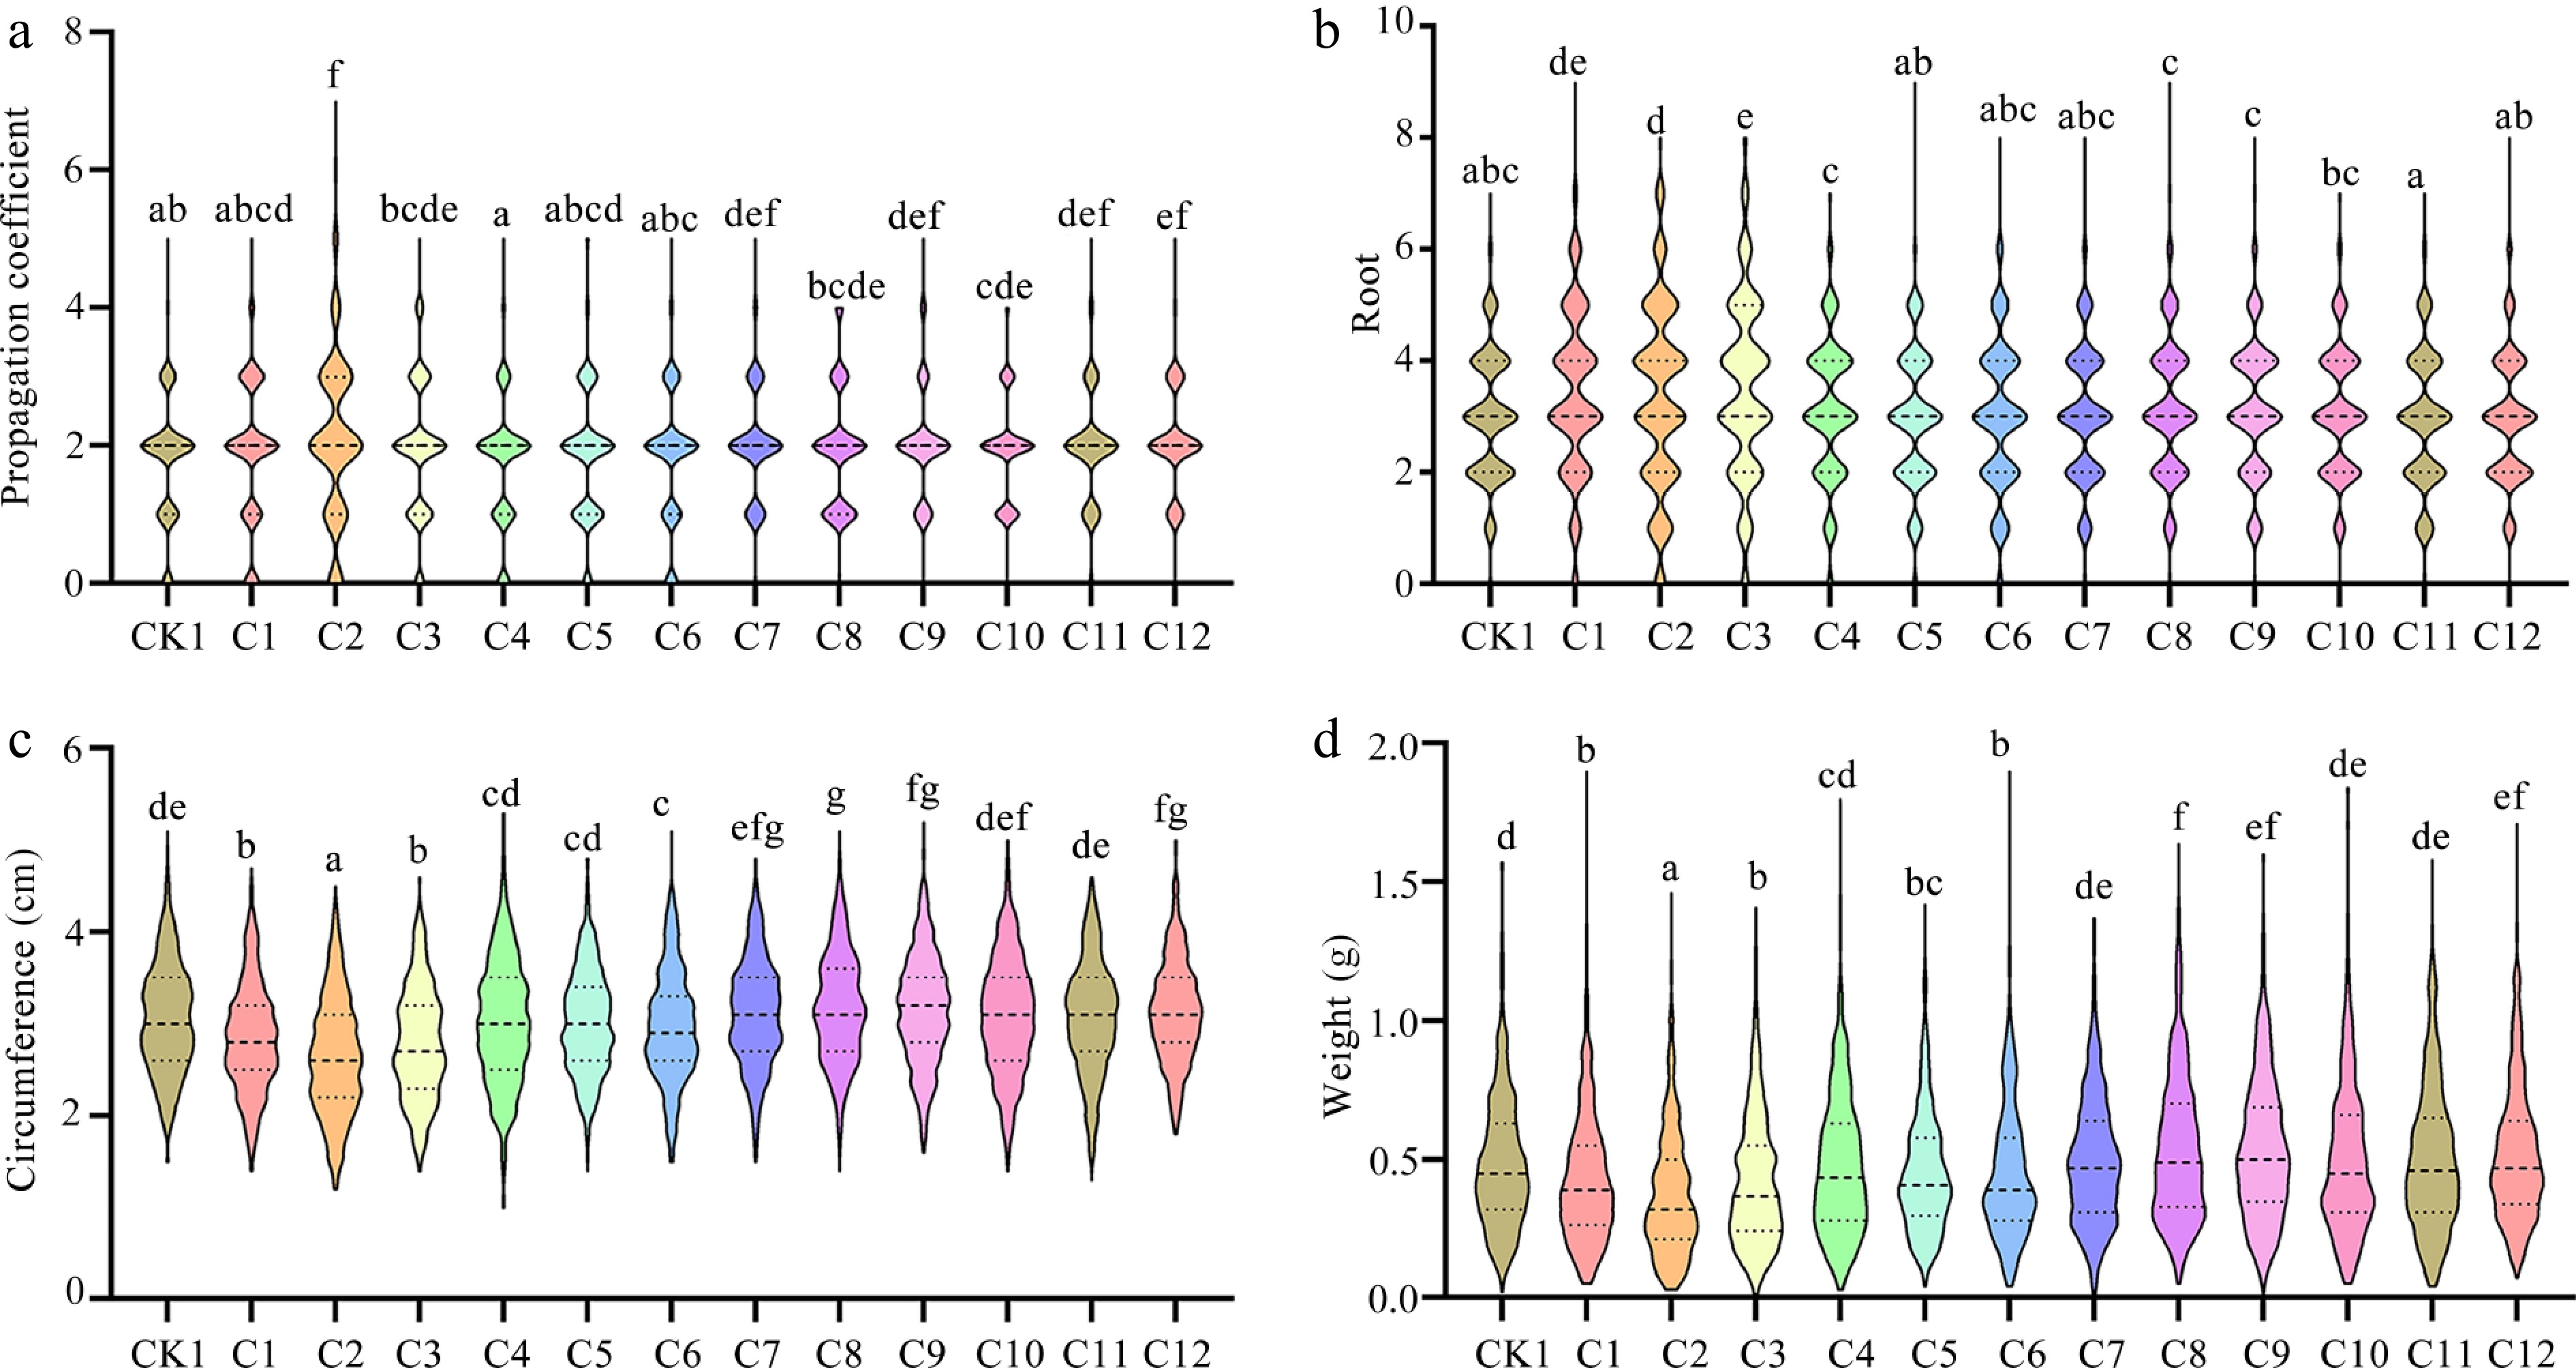
Figure 5.
Influence of different plant growth regulators on morphological indices of bulblets. (a) Analysis of propagation coefficient for bulblet. (b) Analysis of the number of roots for bulblets. (c) Analysis of circumference for bulblets. (d) Analysis of weight for bulblets. Data is based on the mean of bulblets generated from 64 scales of five varieties and is analyzed using ANOVA. Different letters indicate significant differences at the p ≤ 0.05 level. All the scales were soaked once in the following solution for 2 h. CK1: distilled water. C1: 0.1 g/L IBA solution. C2: 0.2 g/L IBA solution. C3: 0.3 g/L IBA solution. C4: 0.5 g/L kinetin solution. C5: 0.4 g/L kinetin solution. C6: 0.3 g/L kinetin solution. C7: 1 g/L CPPU. C8: 0.7 g/L CPPU. C9: 0.5 g/L CPPU. C10: 0.7 g/L rooting powder. C11: 0.5 g/L rooting powder. C12: 0.4 g/L rooting powder.
-
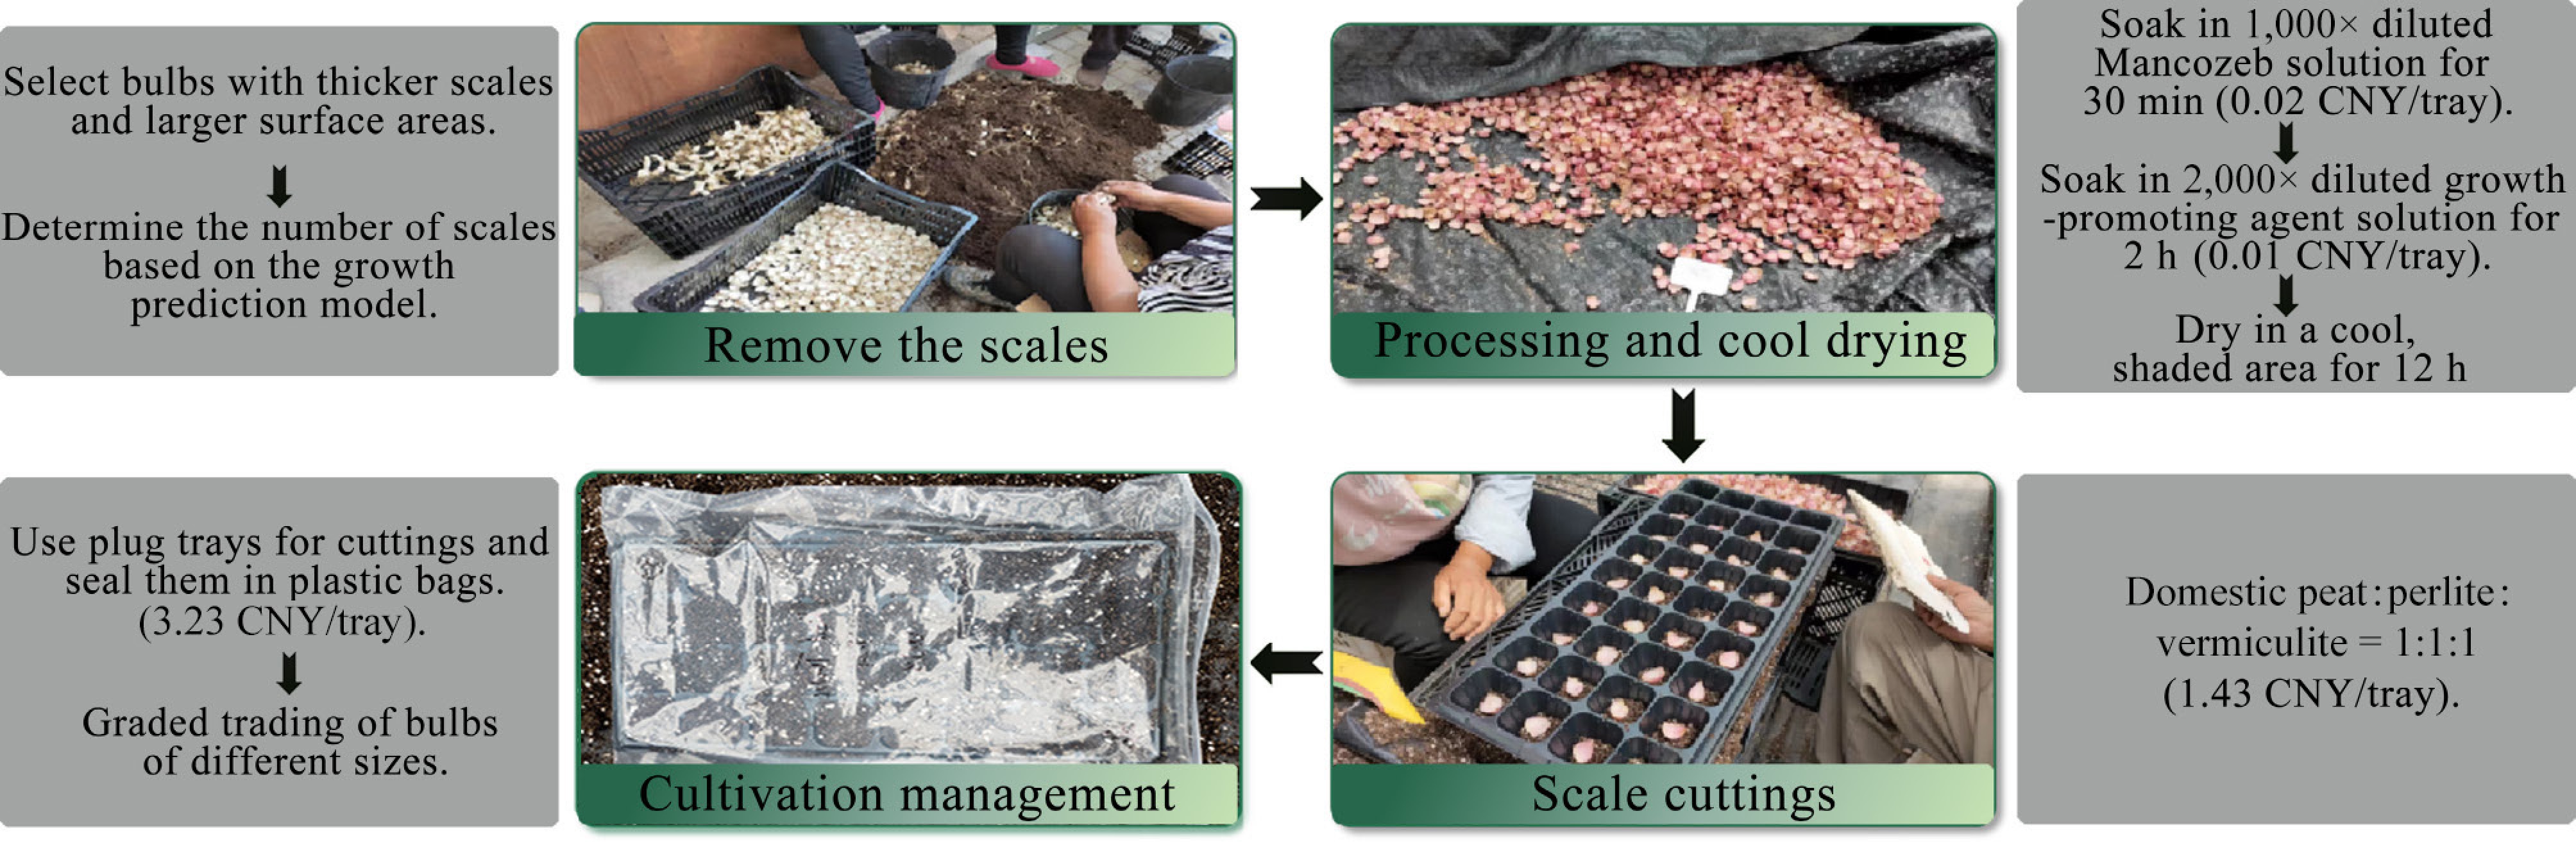
Figure 6.
Sequential disinfection and embedding treatment. CNY: Chinese Yuan.
Figures
(6)
Tables
(0)