-
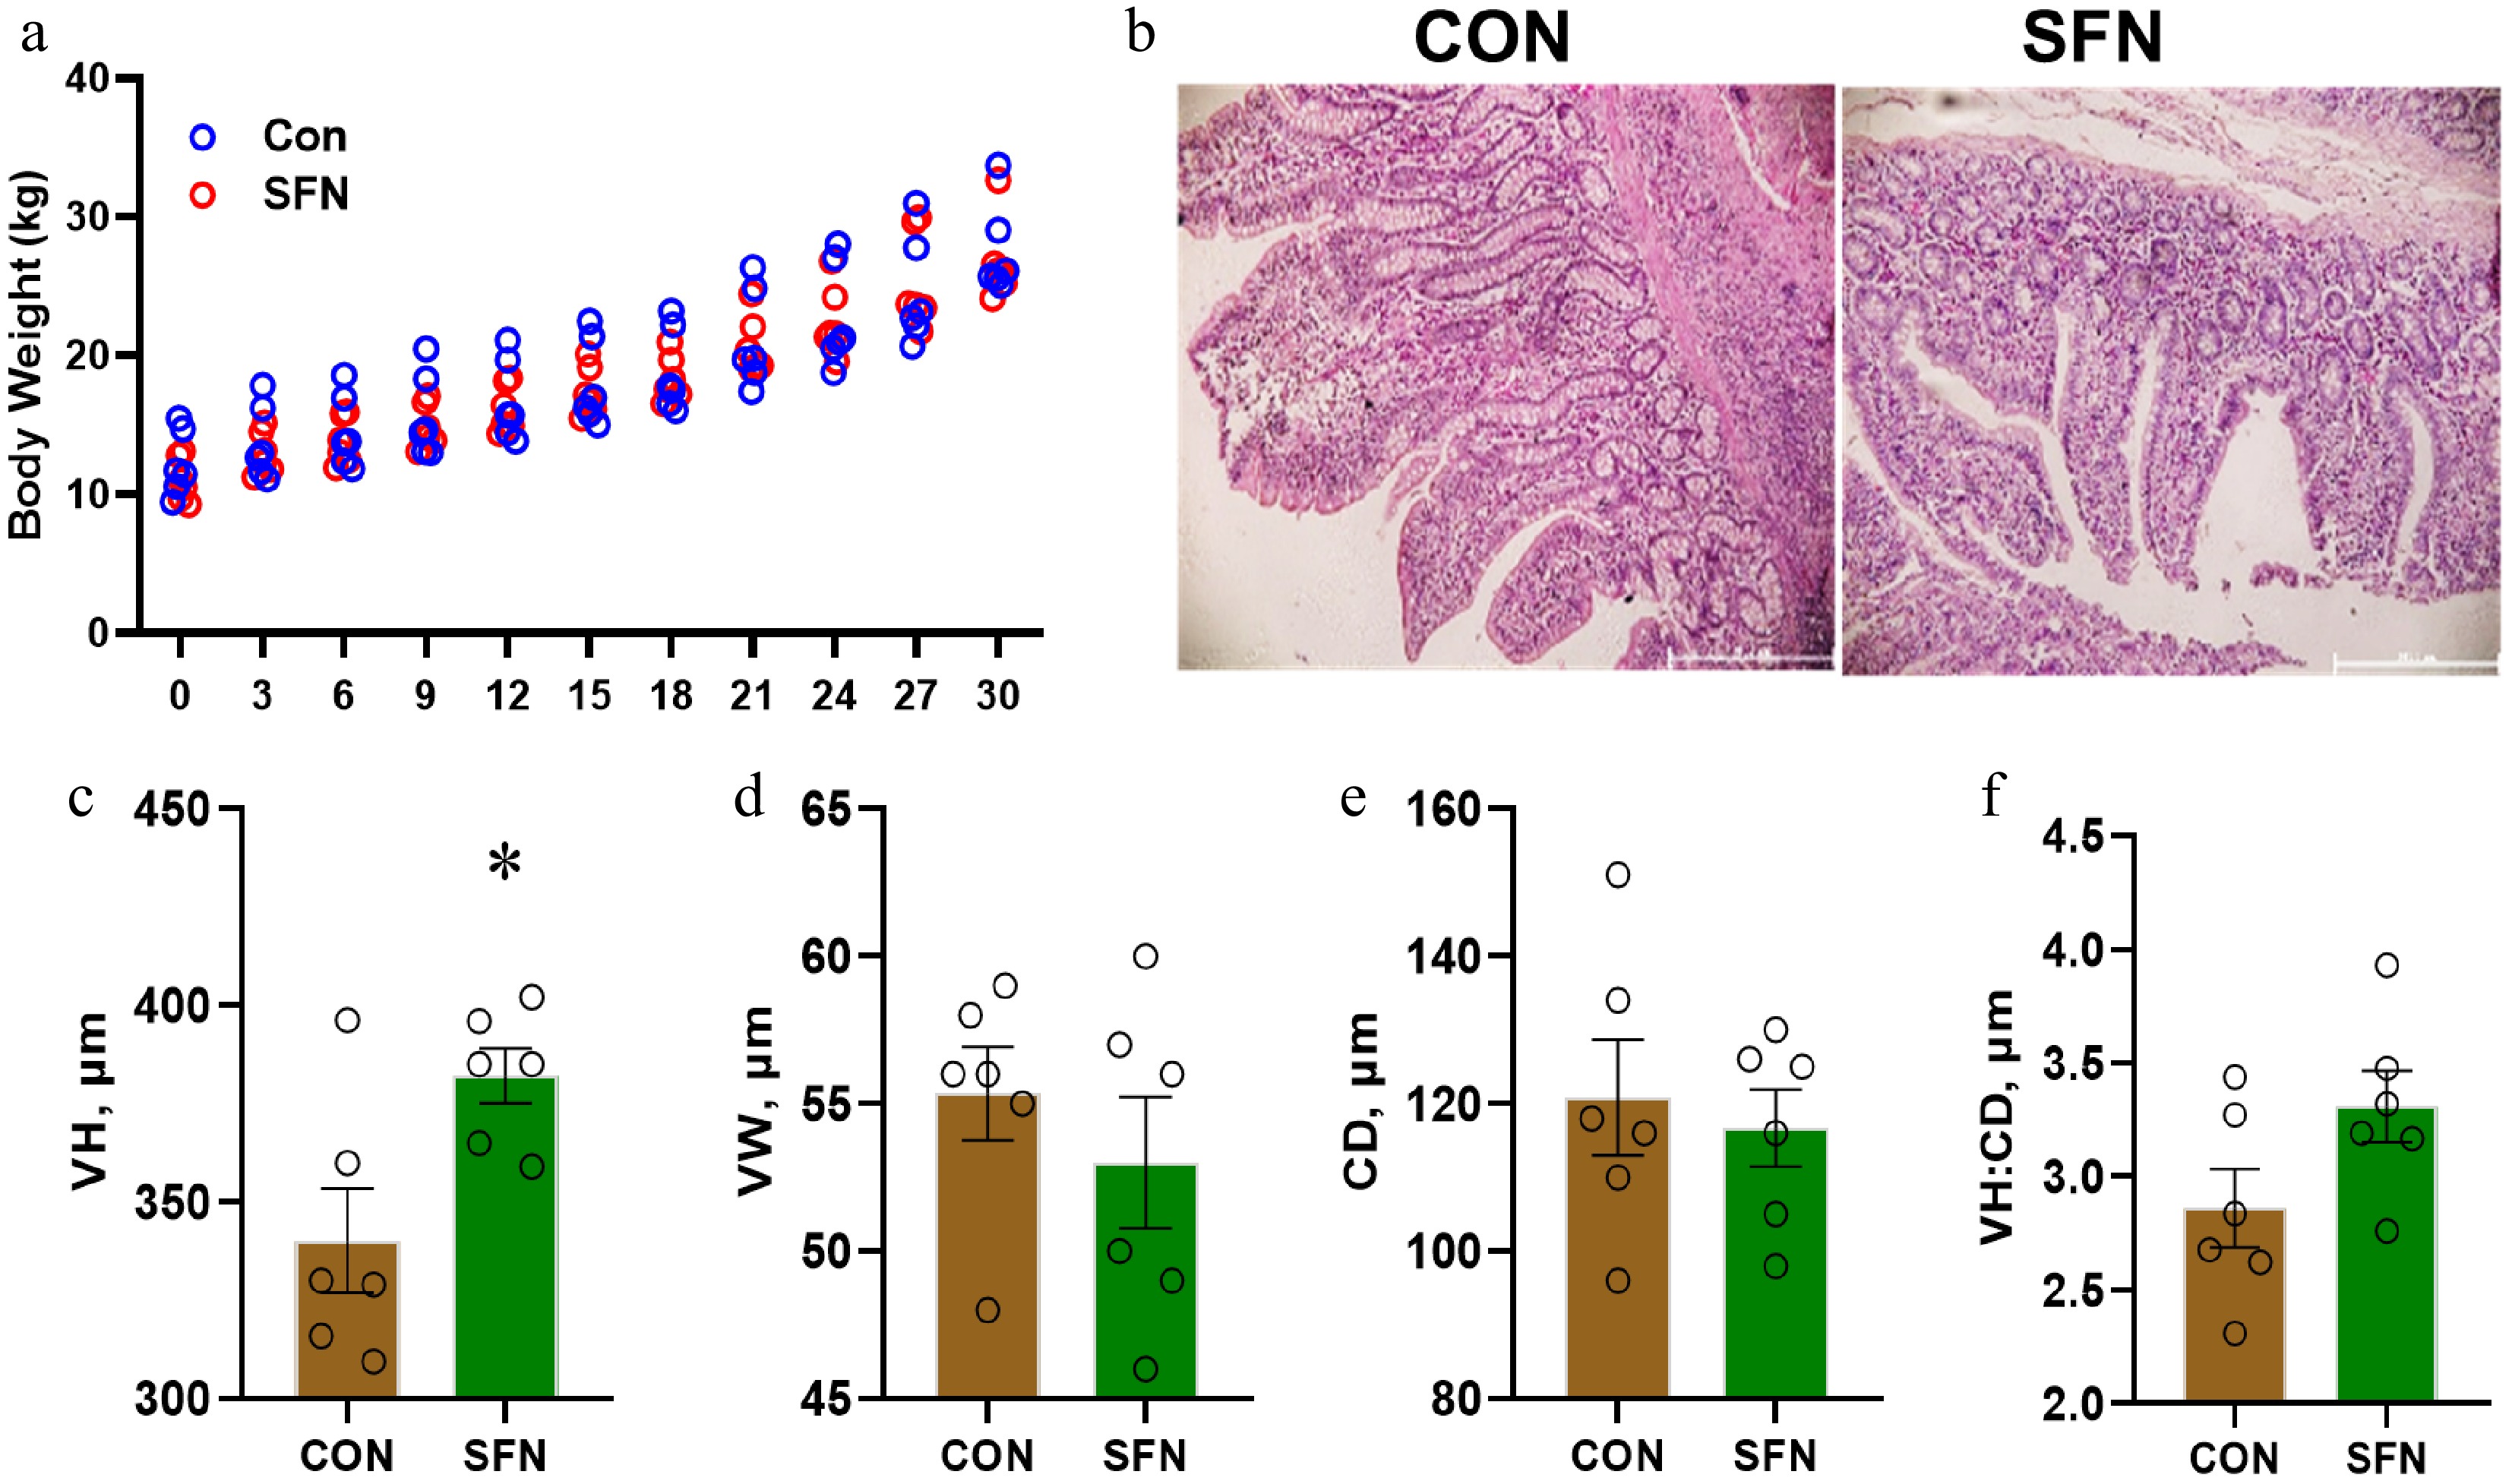
Figure 1.
This figure shows the effects of SFN supplementation on the ileum histomorphology of weaning piglets. (a) Body weight. (b) Representative histological image of the ileum. (c) Villus height (VH). (d) Villus width (VW). (e) Crypt depth (CD). (f) Villus height/Crypt depth (VH/CD). Data are presented as means ± SD. * p < 0.05.
-
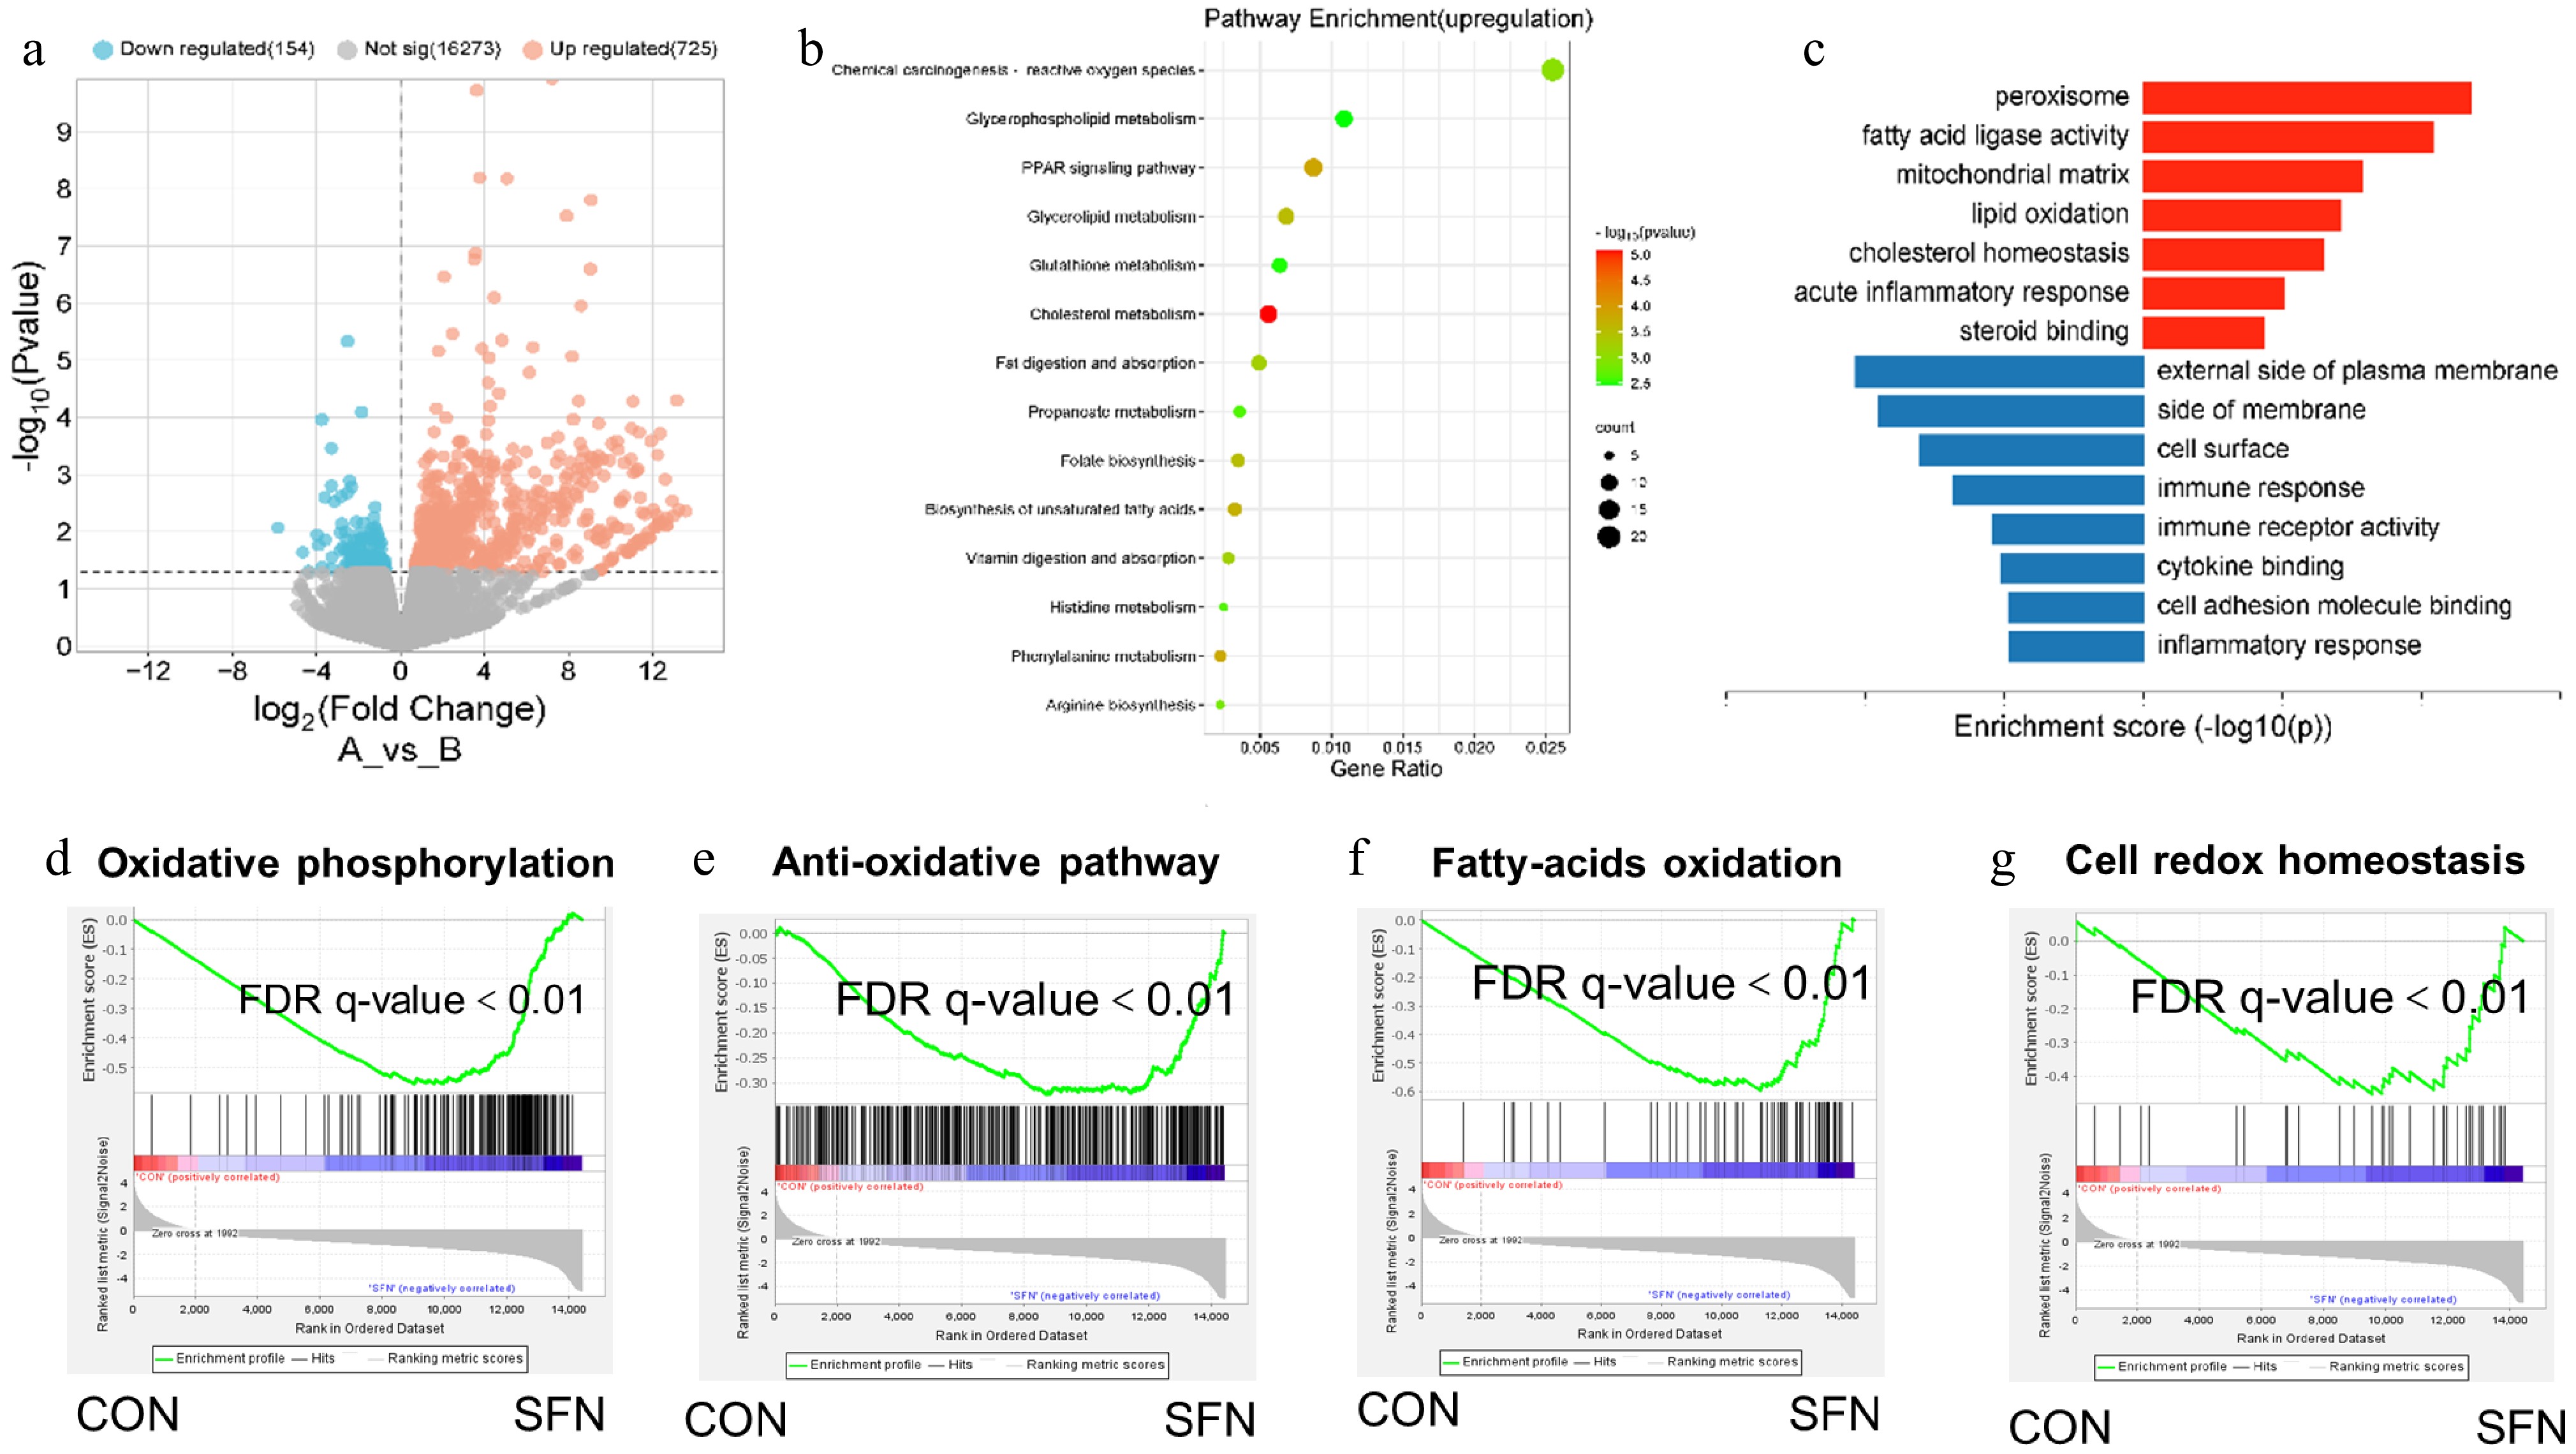
Figure 2.
(a) The differential gene expression profile between SFN and vector group was visualized by transcriptome analysis. (b) DEG involved in ROS and PPAR signal pathways is a rich enrichment of KEGG analysis. (c) Gene expression involved in the peroxisome and lipid oxidation pathways were among the most enriched pathways analyzed by gene ontology. (d) Oxidative phosphorylation. (e) Anti-oxidative pathway. (f) Fatty acid oxidation. (g) Cell-redox-homeostasis.
-
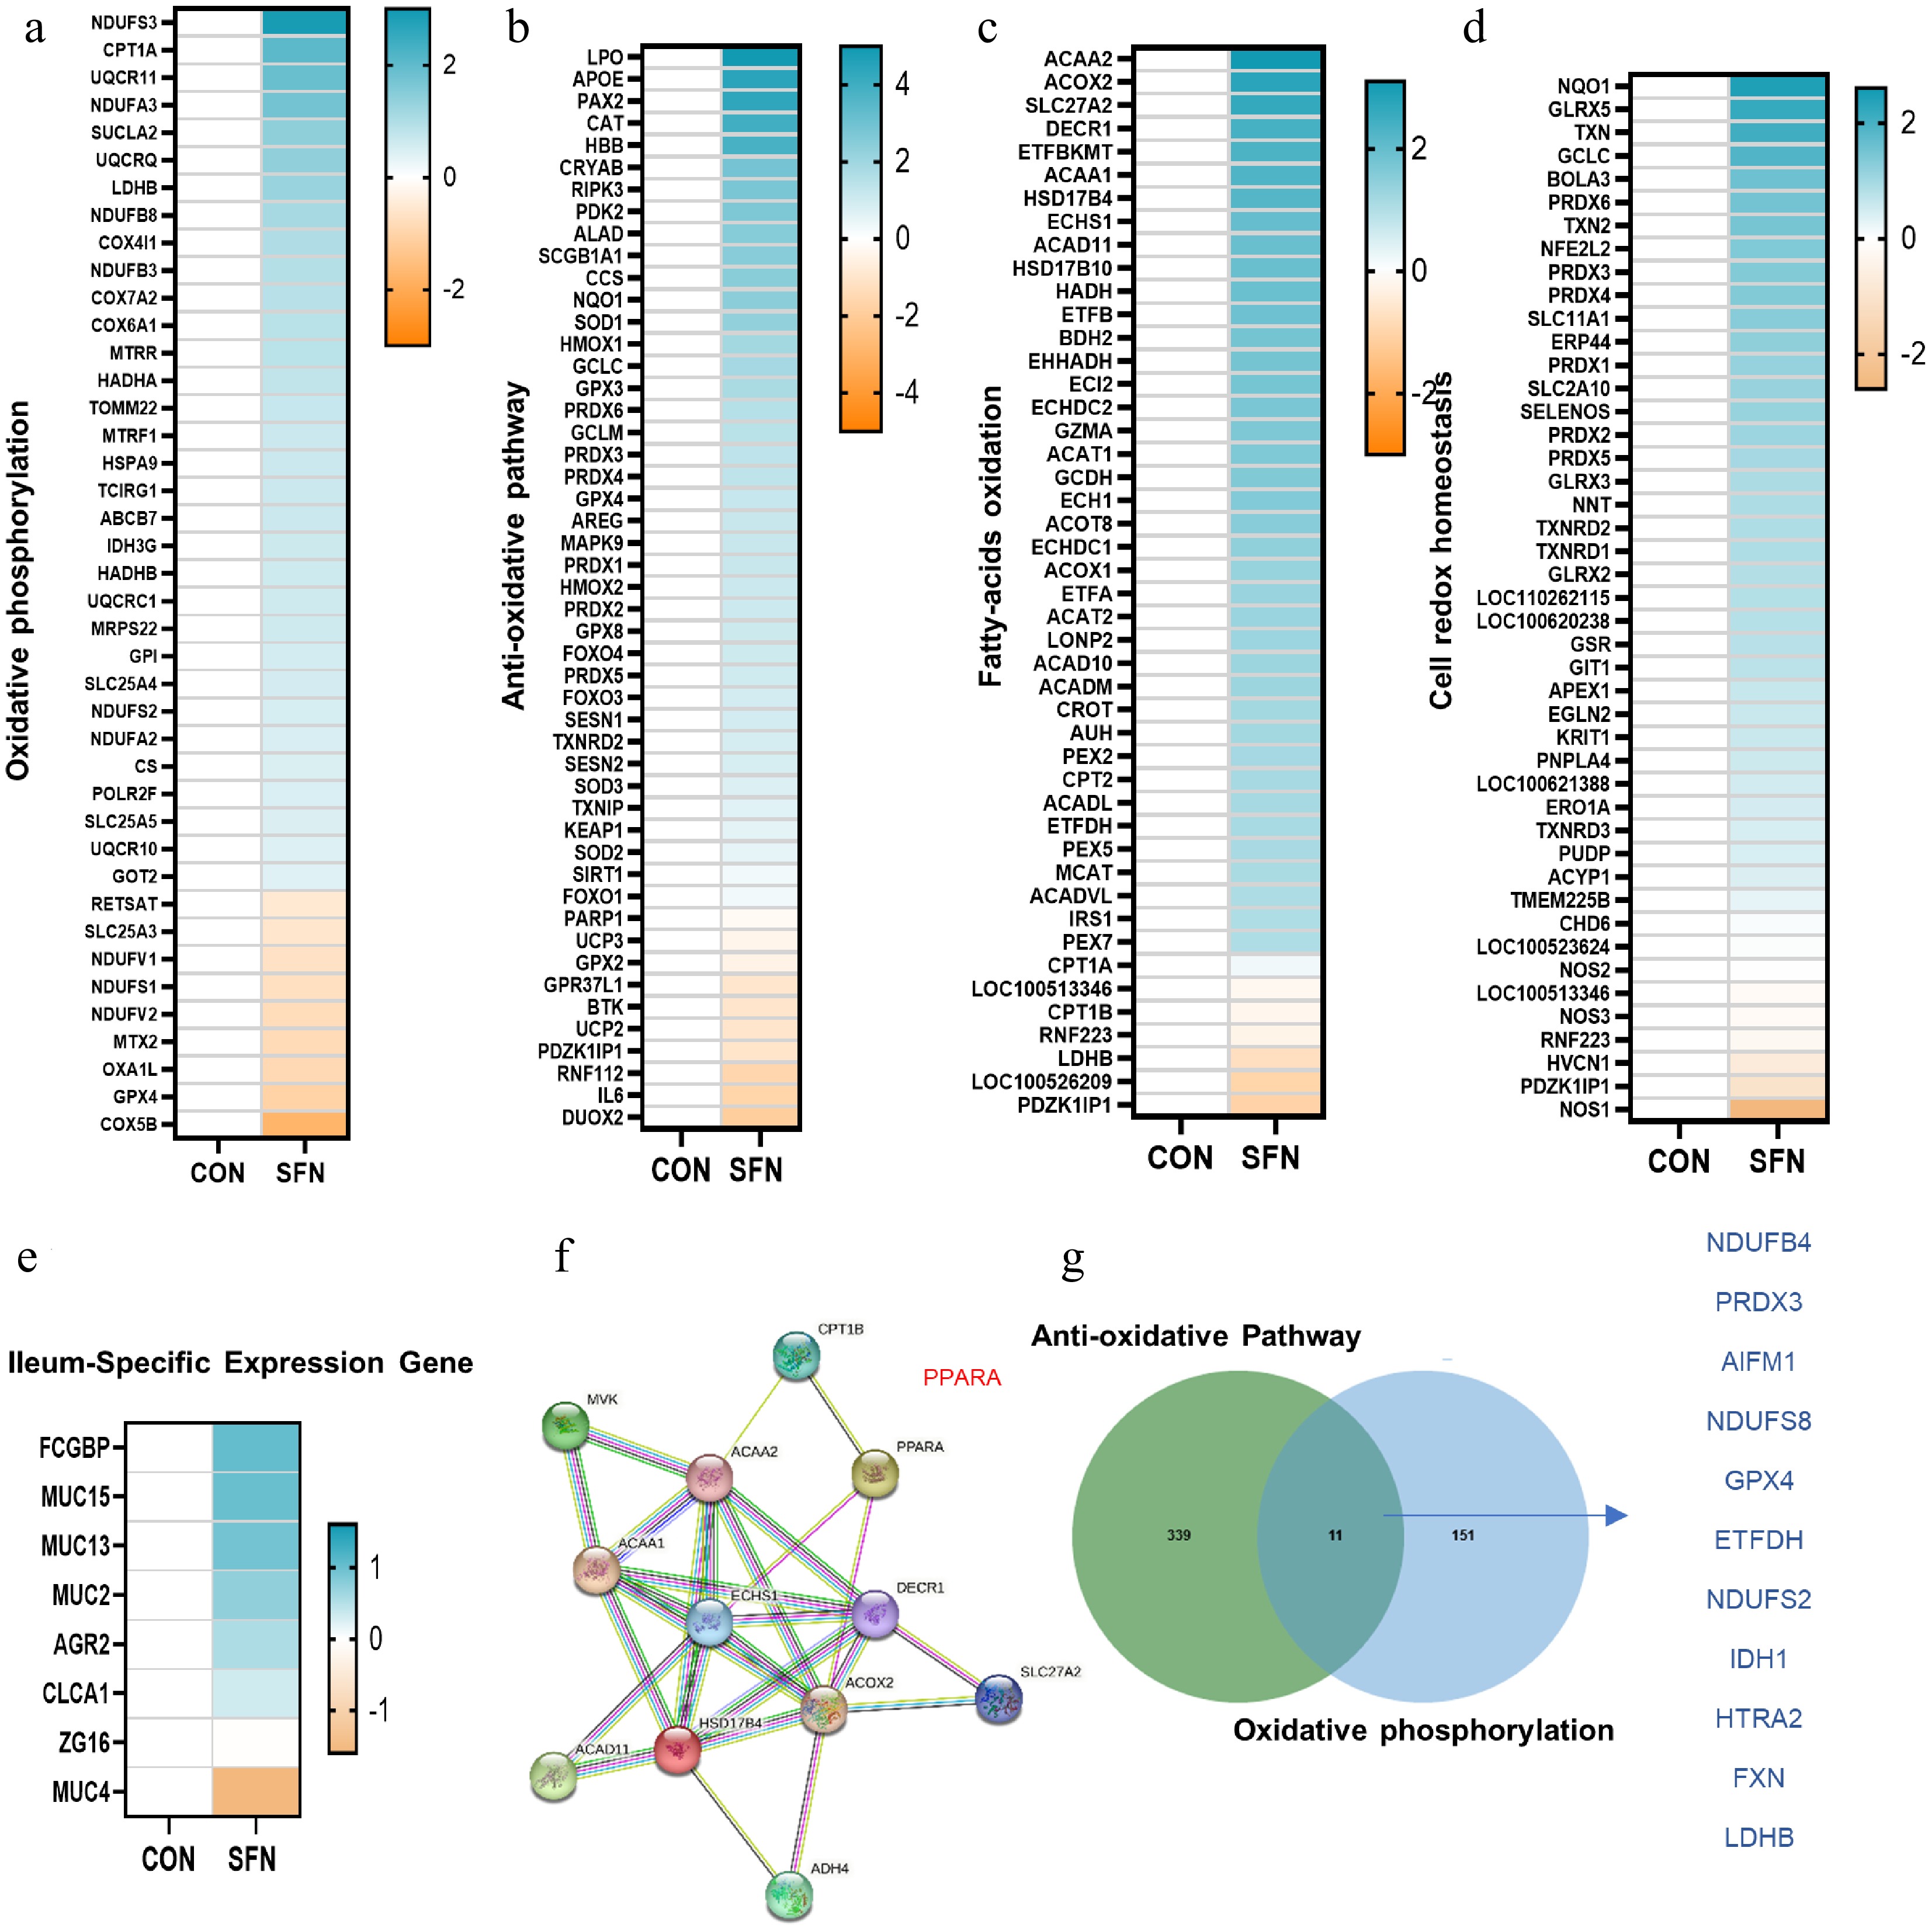
Figure 3.
(a)–(d) Heatmaps of mRNA expression (RNA-seq, log2 transformed) changes of oxidative phosphorylation, anti-oxidative stress, fatty acid β-oxidation, and cell-redox-homeostasis. (e) Heatmaps of mRNA expression (RNA-seq, log2 transformed) changes of the ileum-specific expression genes. (f) STRING-ELIXIR analysis predicts PPARA as a key transcript factor in interaction with lipid oxidation key proteins. (g) Venn diagram of the genes with significantly differential expression (log2 fold change < –0.5) shared by SFN vs control in anti-oxidative and oxidative phosphorylation pathways.
-
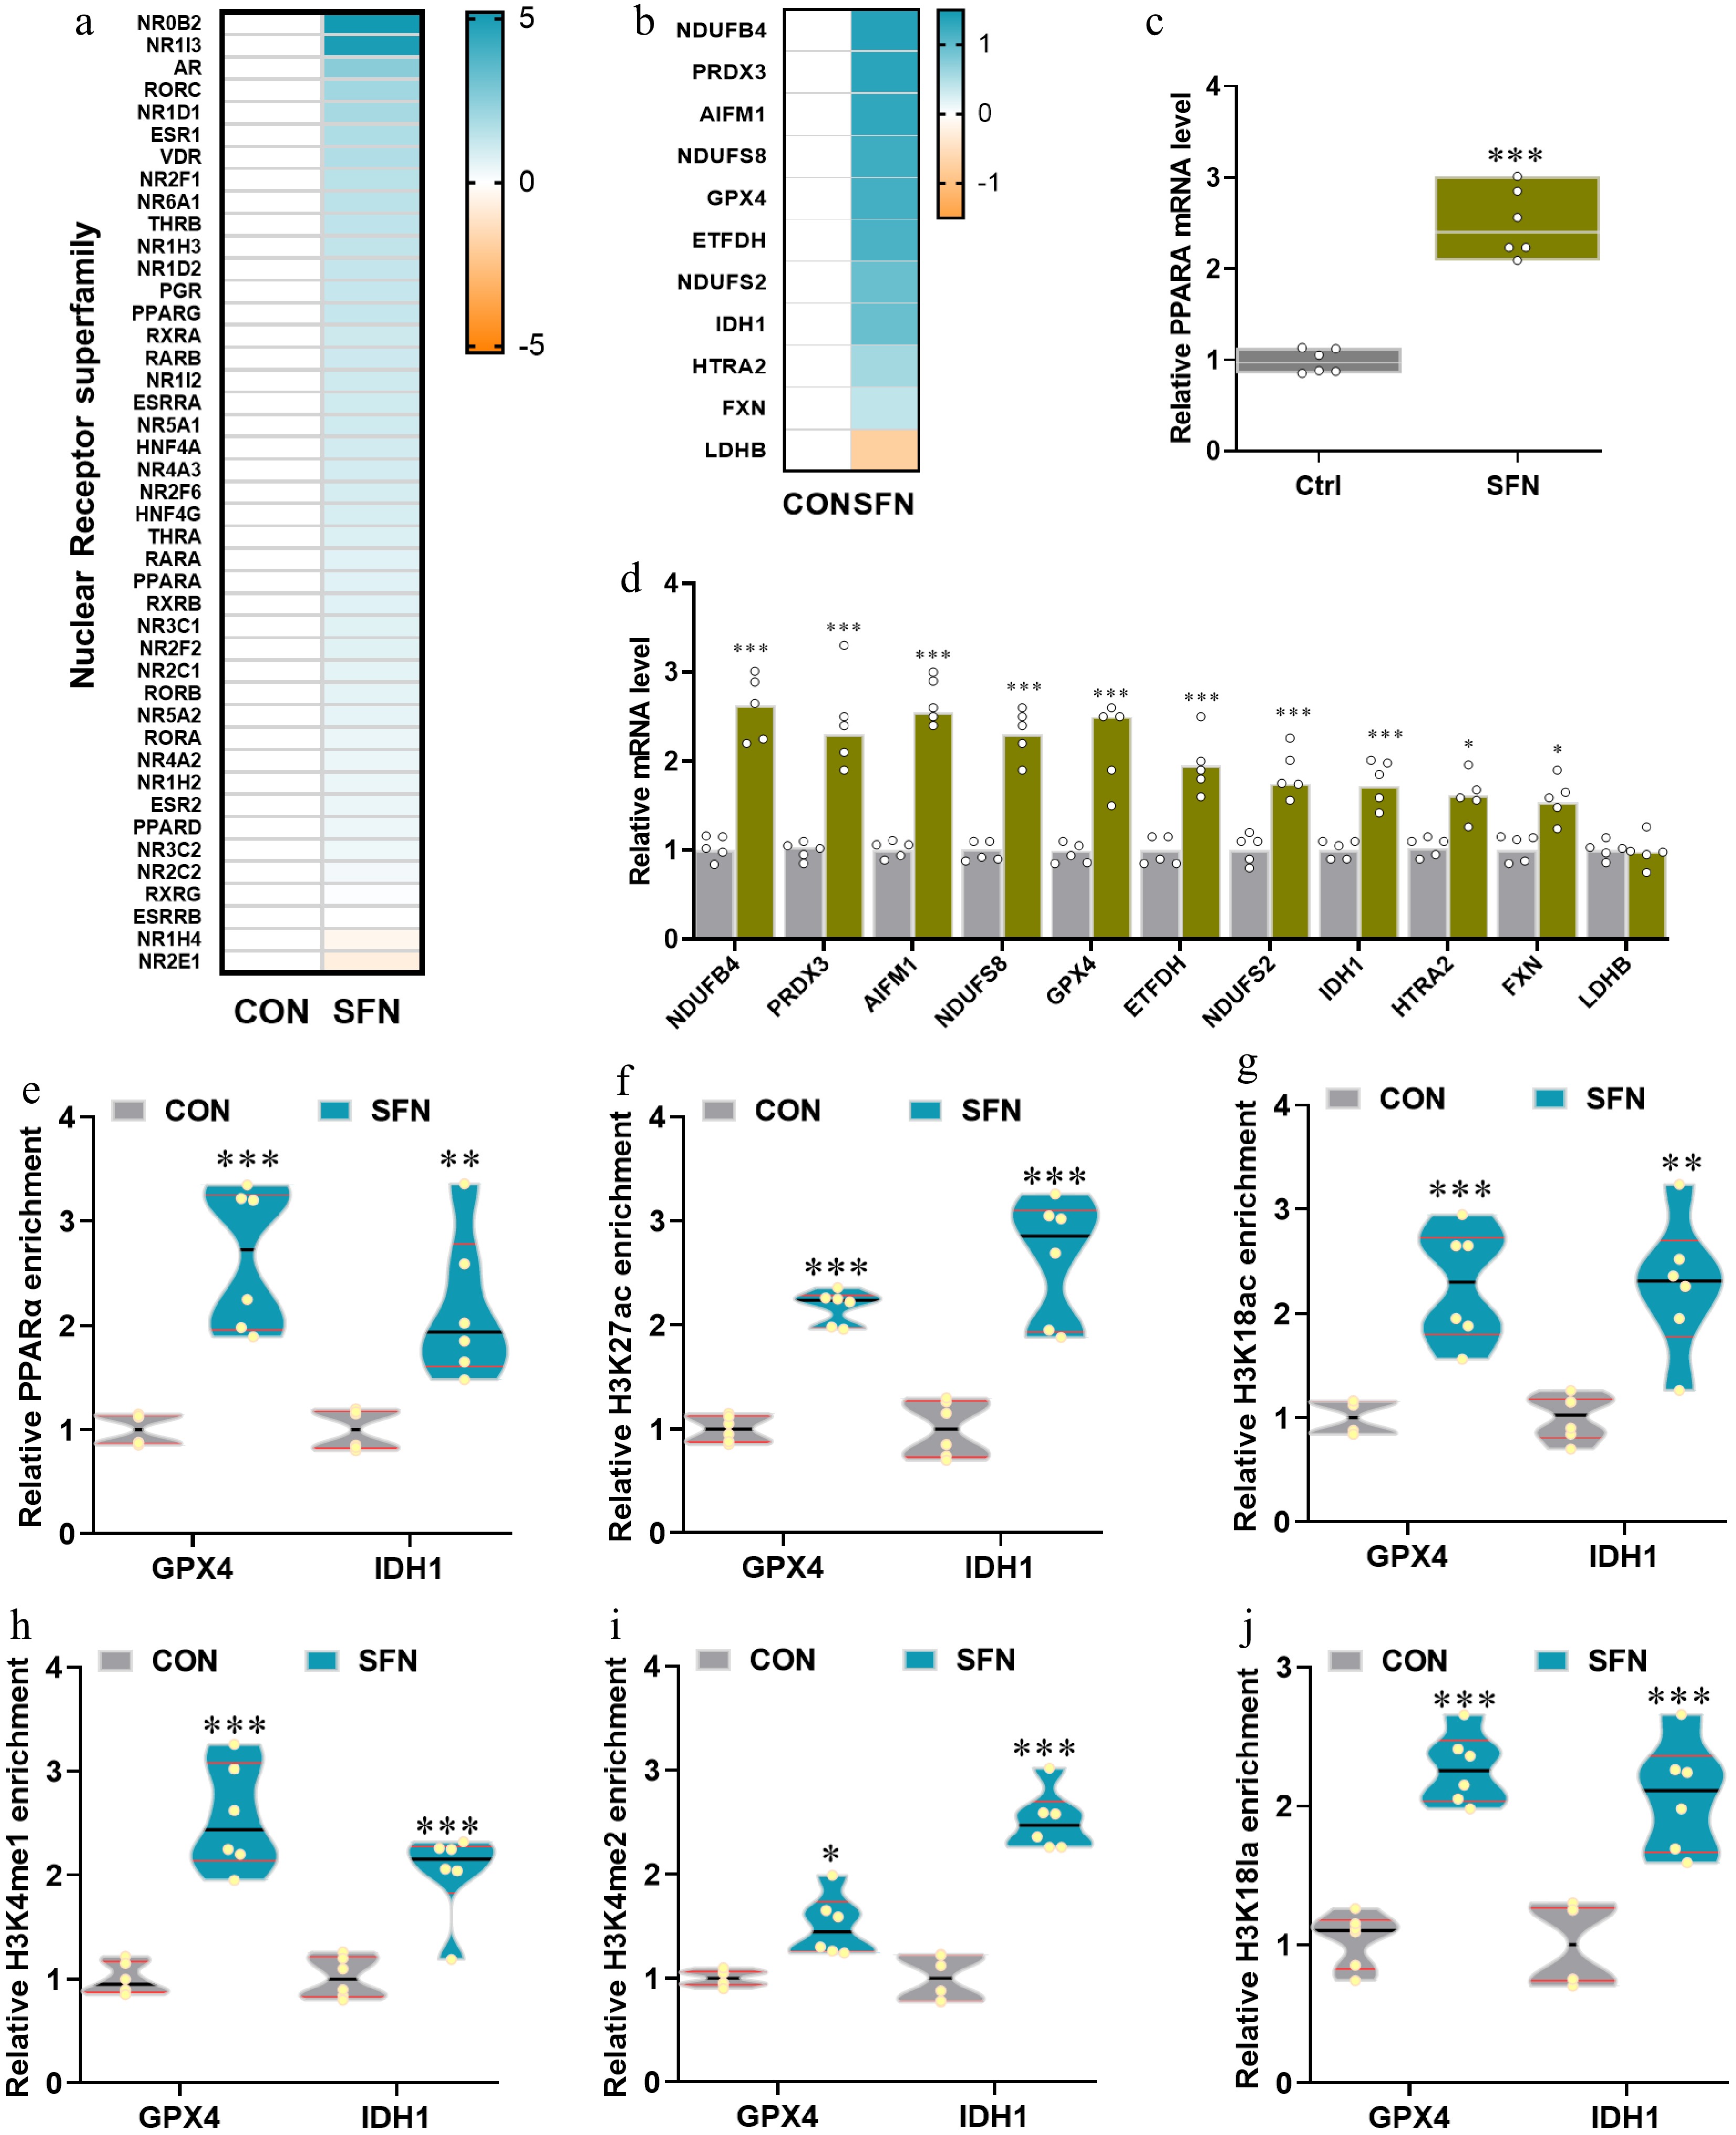
Figure 4.
(a), (b) Heatmaps of mRNA expression (RNA-seq, Log2 transformed) changes of the nuclear receptor superfamily and the genes with significantly differential expression shared by SFN vs control in anti-oxidative and oxidative phosphorylation pathways. (c), (d) qRT-PCR validations of the expression of PPARA and SFN-induced significance. (e)–(j) The relative enrichments of PPARA, H3K27ac, H3K18ac, H3K4me1, H3K4me2, and H3K18la at the key anti-oxidative genes GPX4 and IDH1 were analyzed by ChIP-qPCR. Data are presented as means ± SD. * p < 0.05, ** p < 0.01, *** p < 0.001.
Figures
(4)
Tables
(0)