-
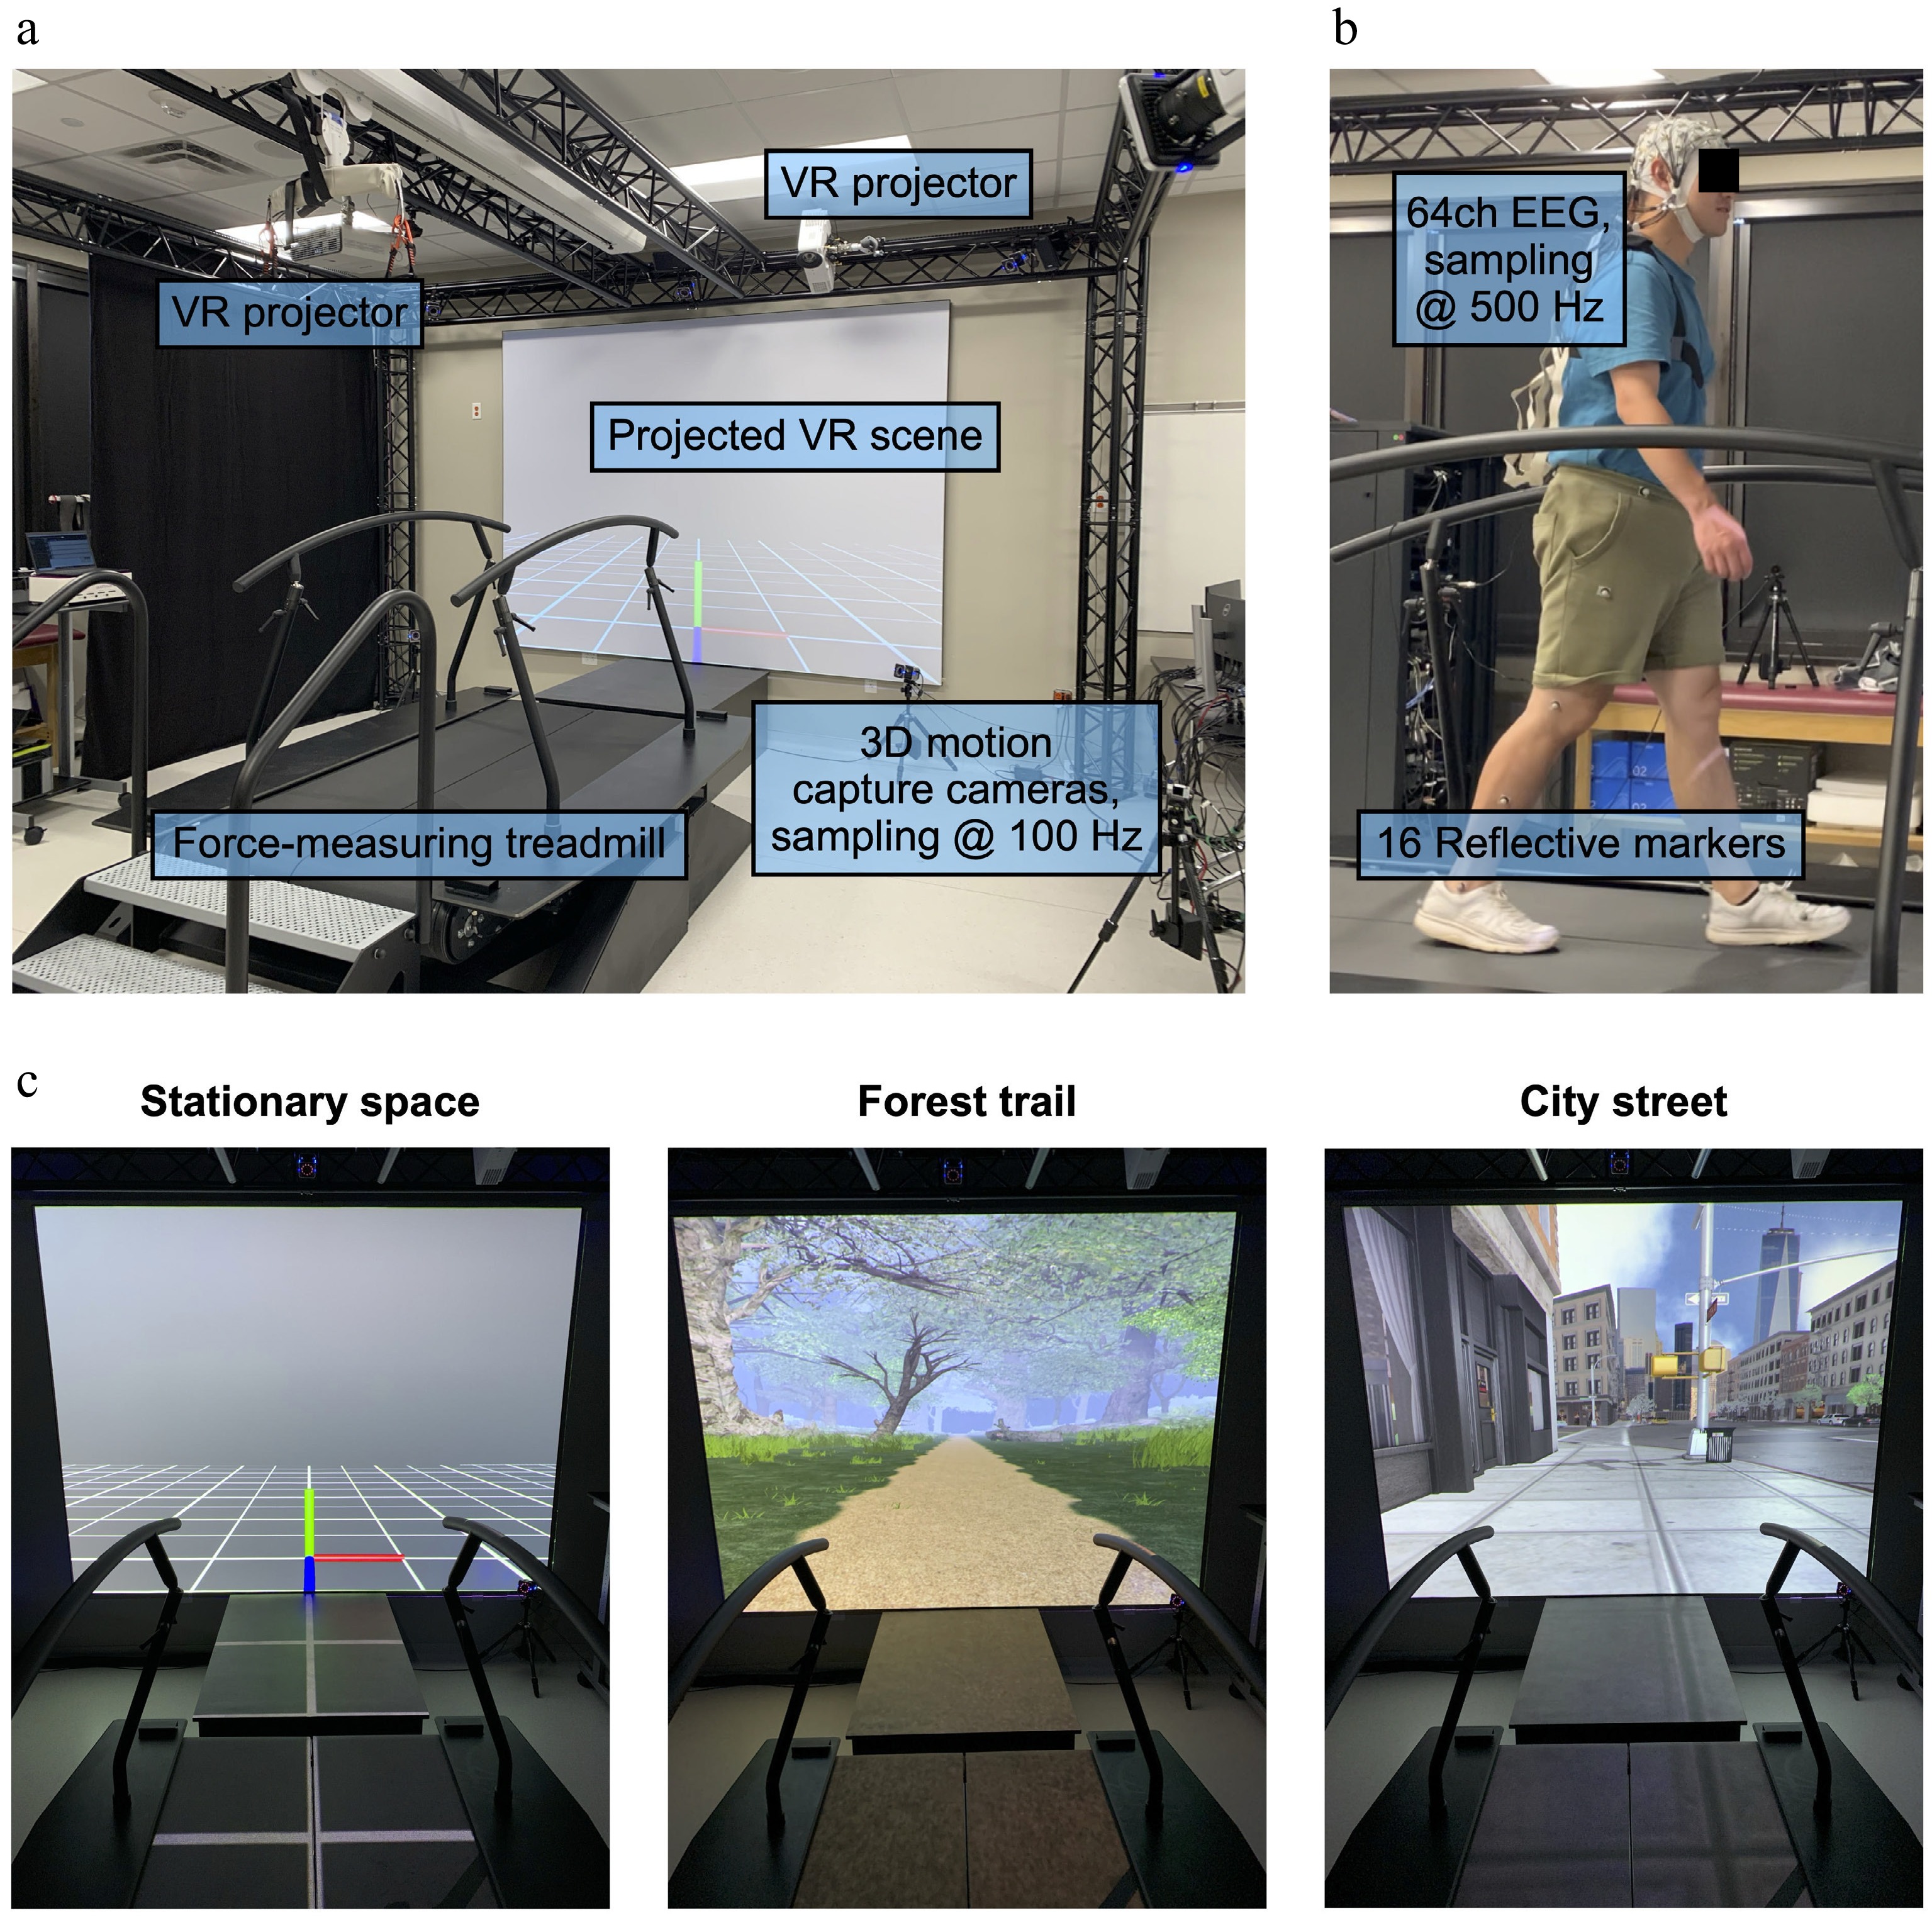
Figure 1.
(a) Experimental setup. (b) Instrumented participant. (c) Virtual reality environments: (1) stationary empty space, (2) a moving forest trail, and (3) a moving city street that matched the treadmill belt's speed. VR, virtual reality.
-
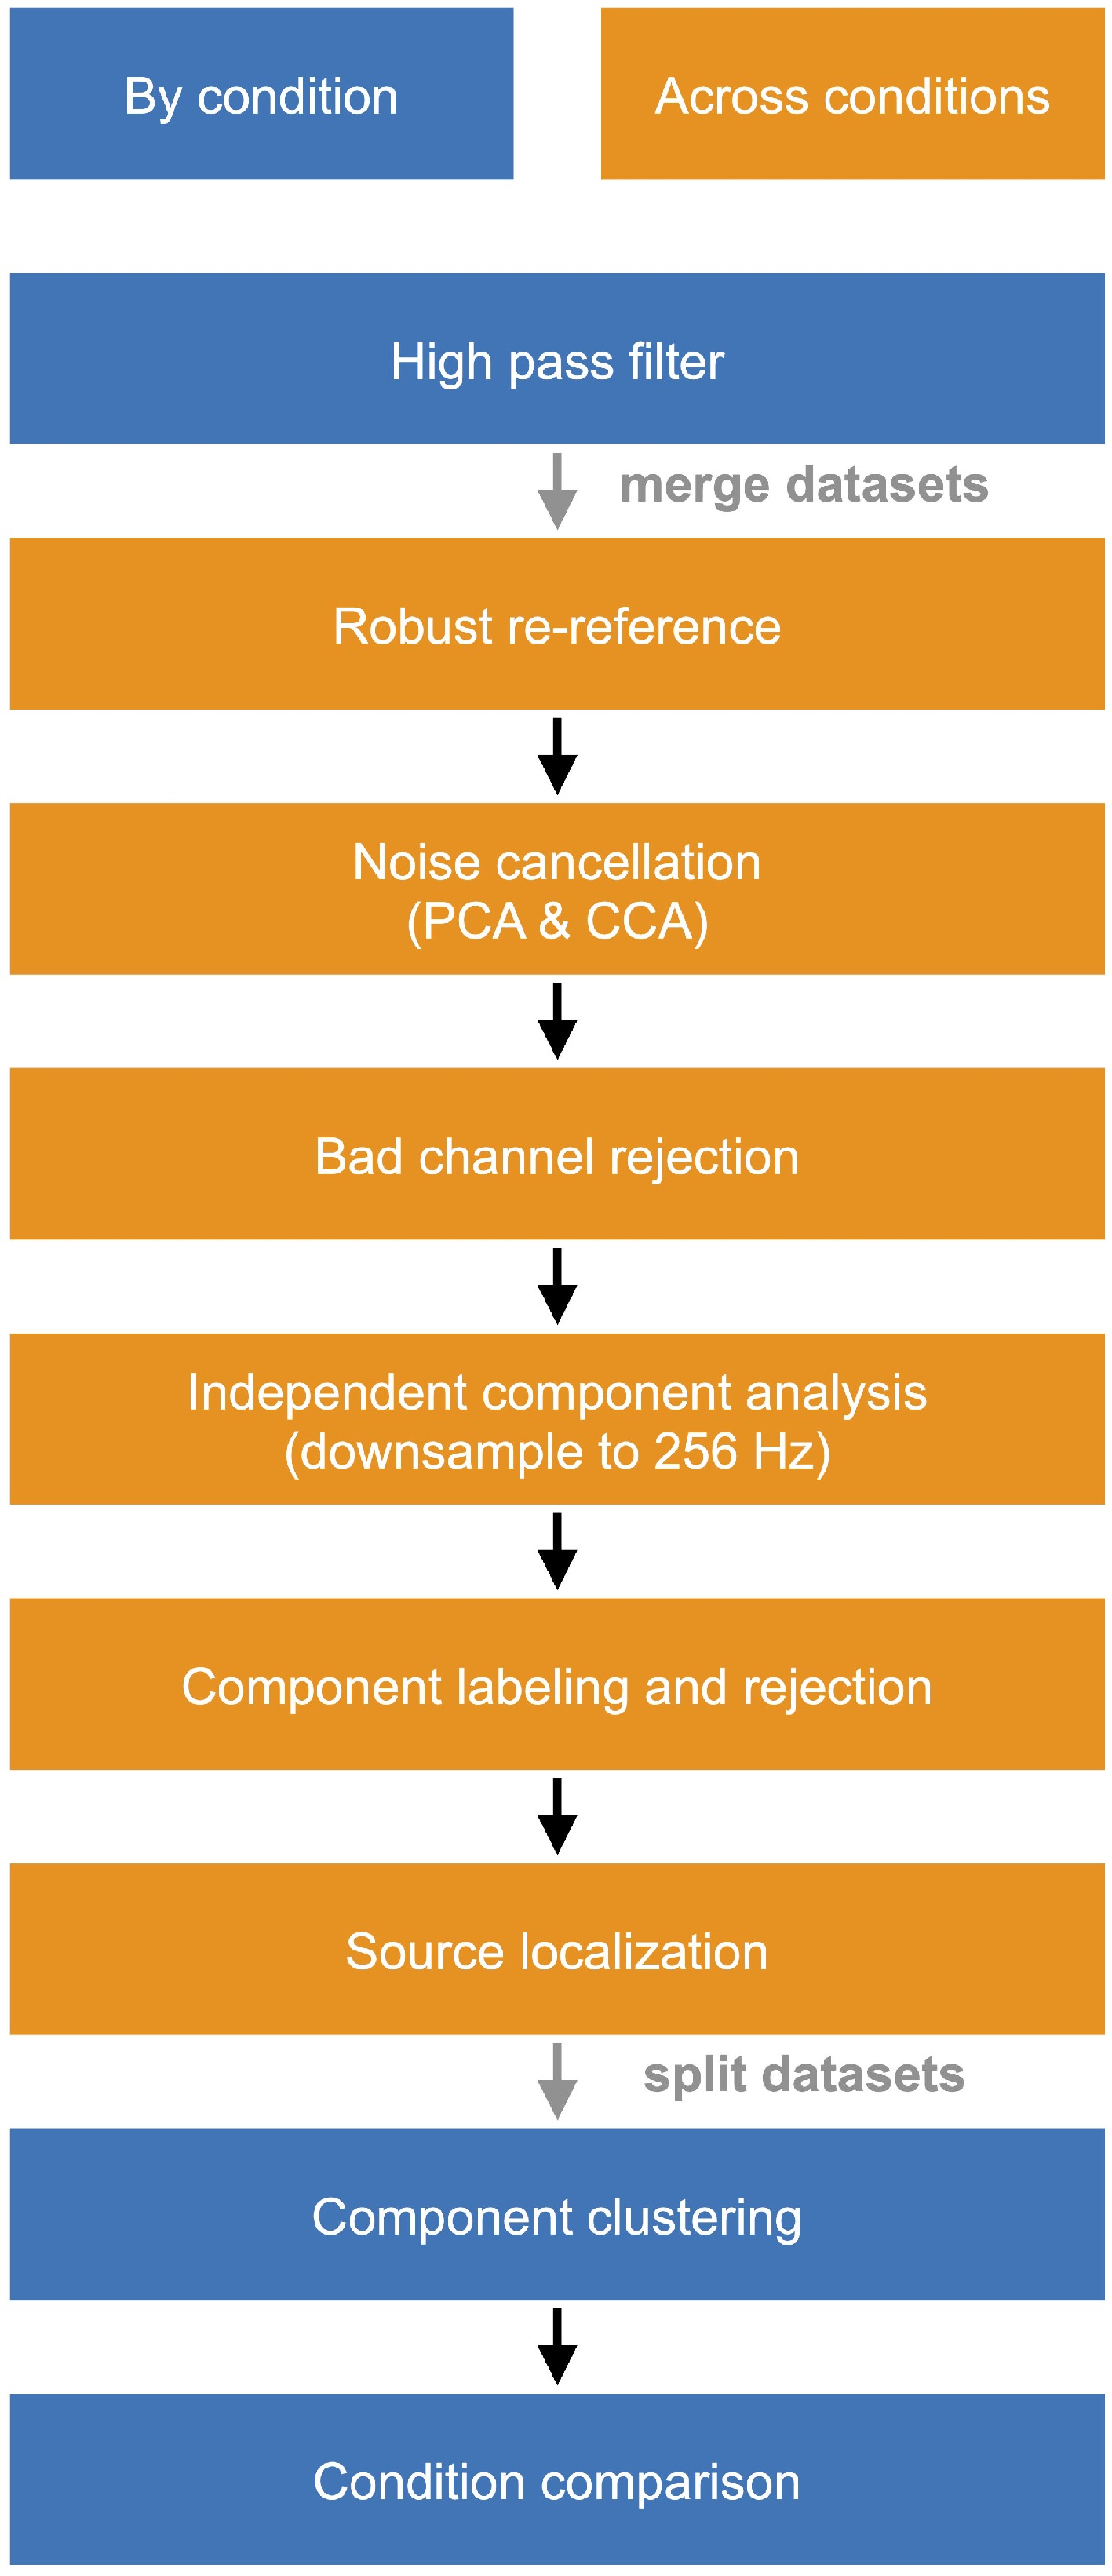
Figure 2.
EEG data processing pipeline. PCA, principal component analysis; CCA, canonical correlation analysis.
-
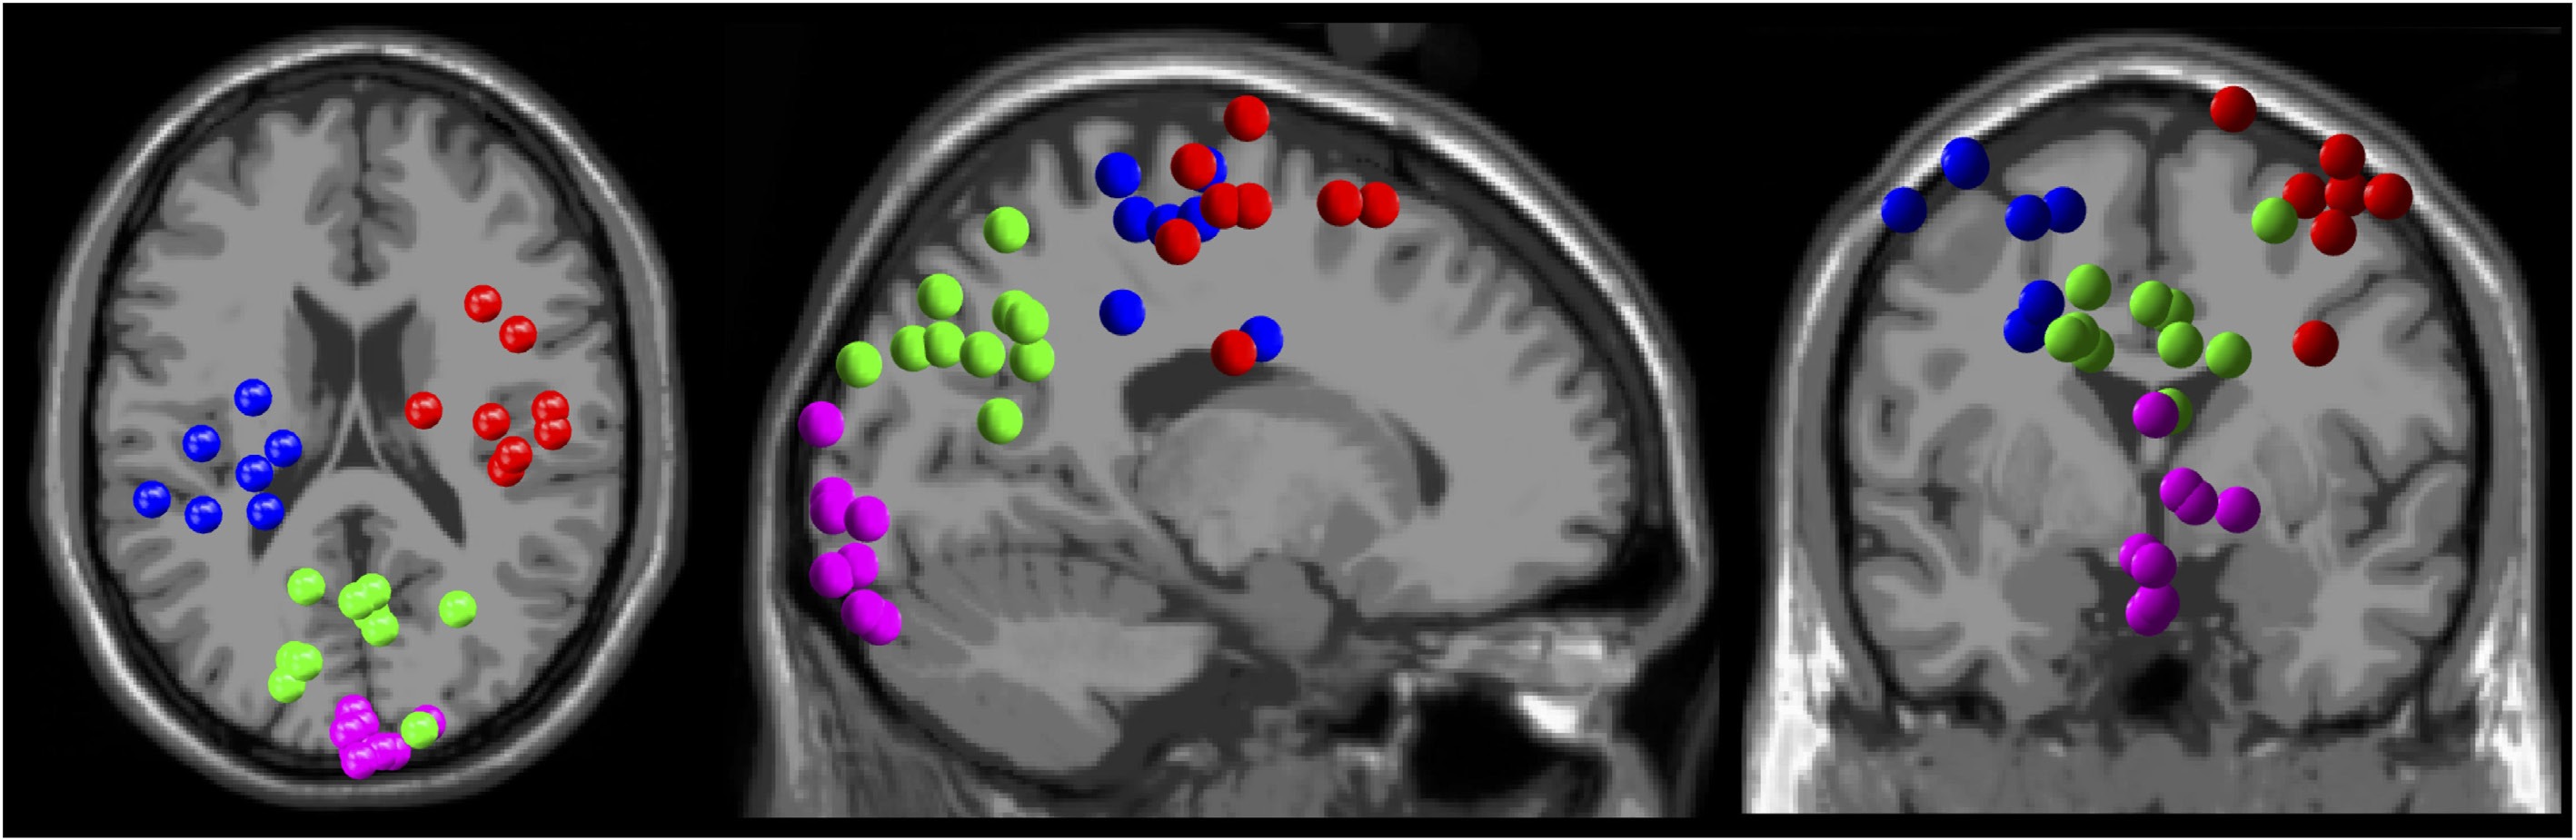
Figure 3.
Electrocortical dipole cluster locations. Left sensorimotor (blue), right sensorimotor (red), parietal (green), and visual (magenta) cortices.
-
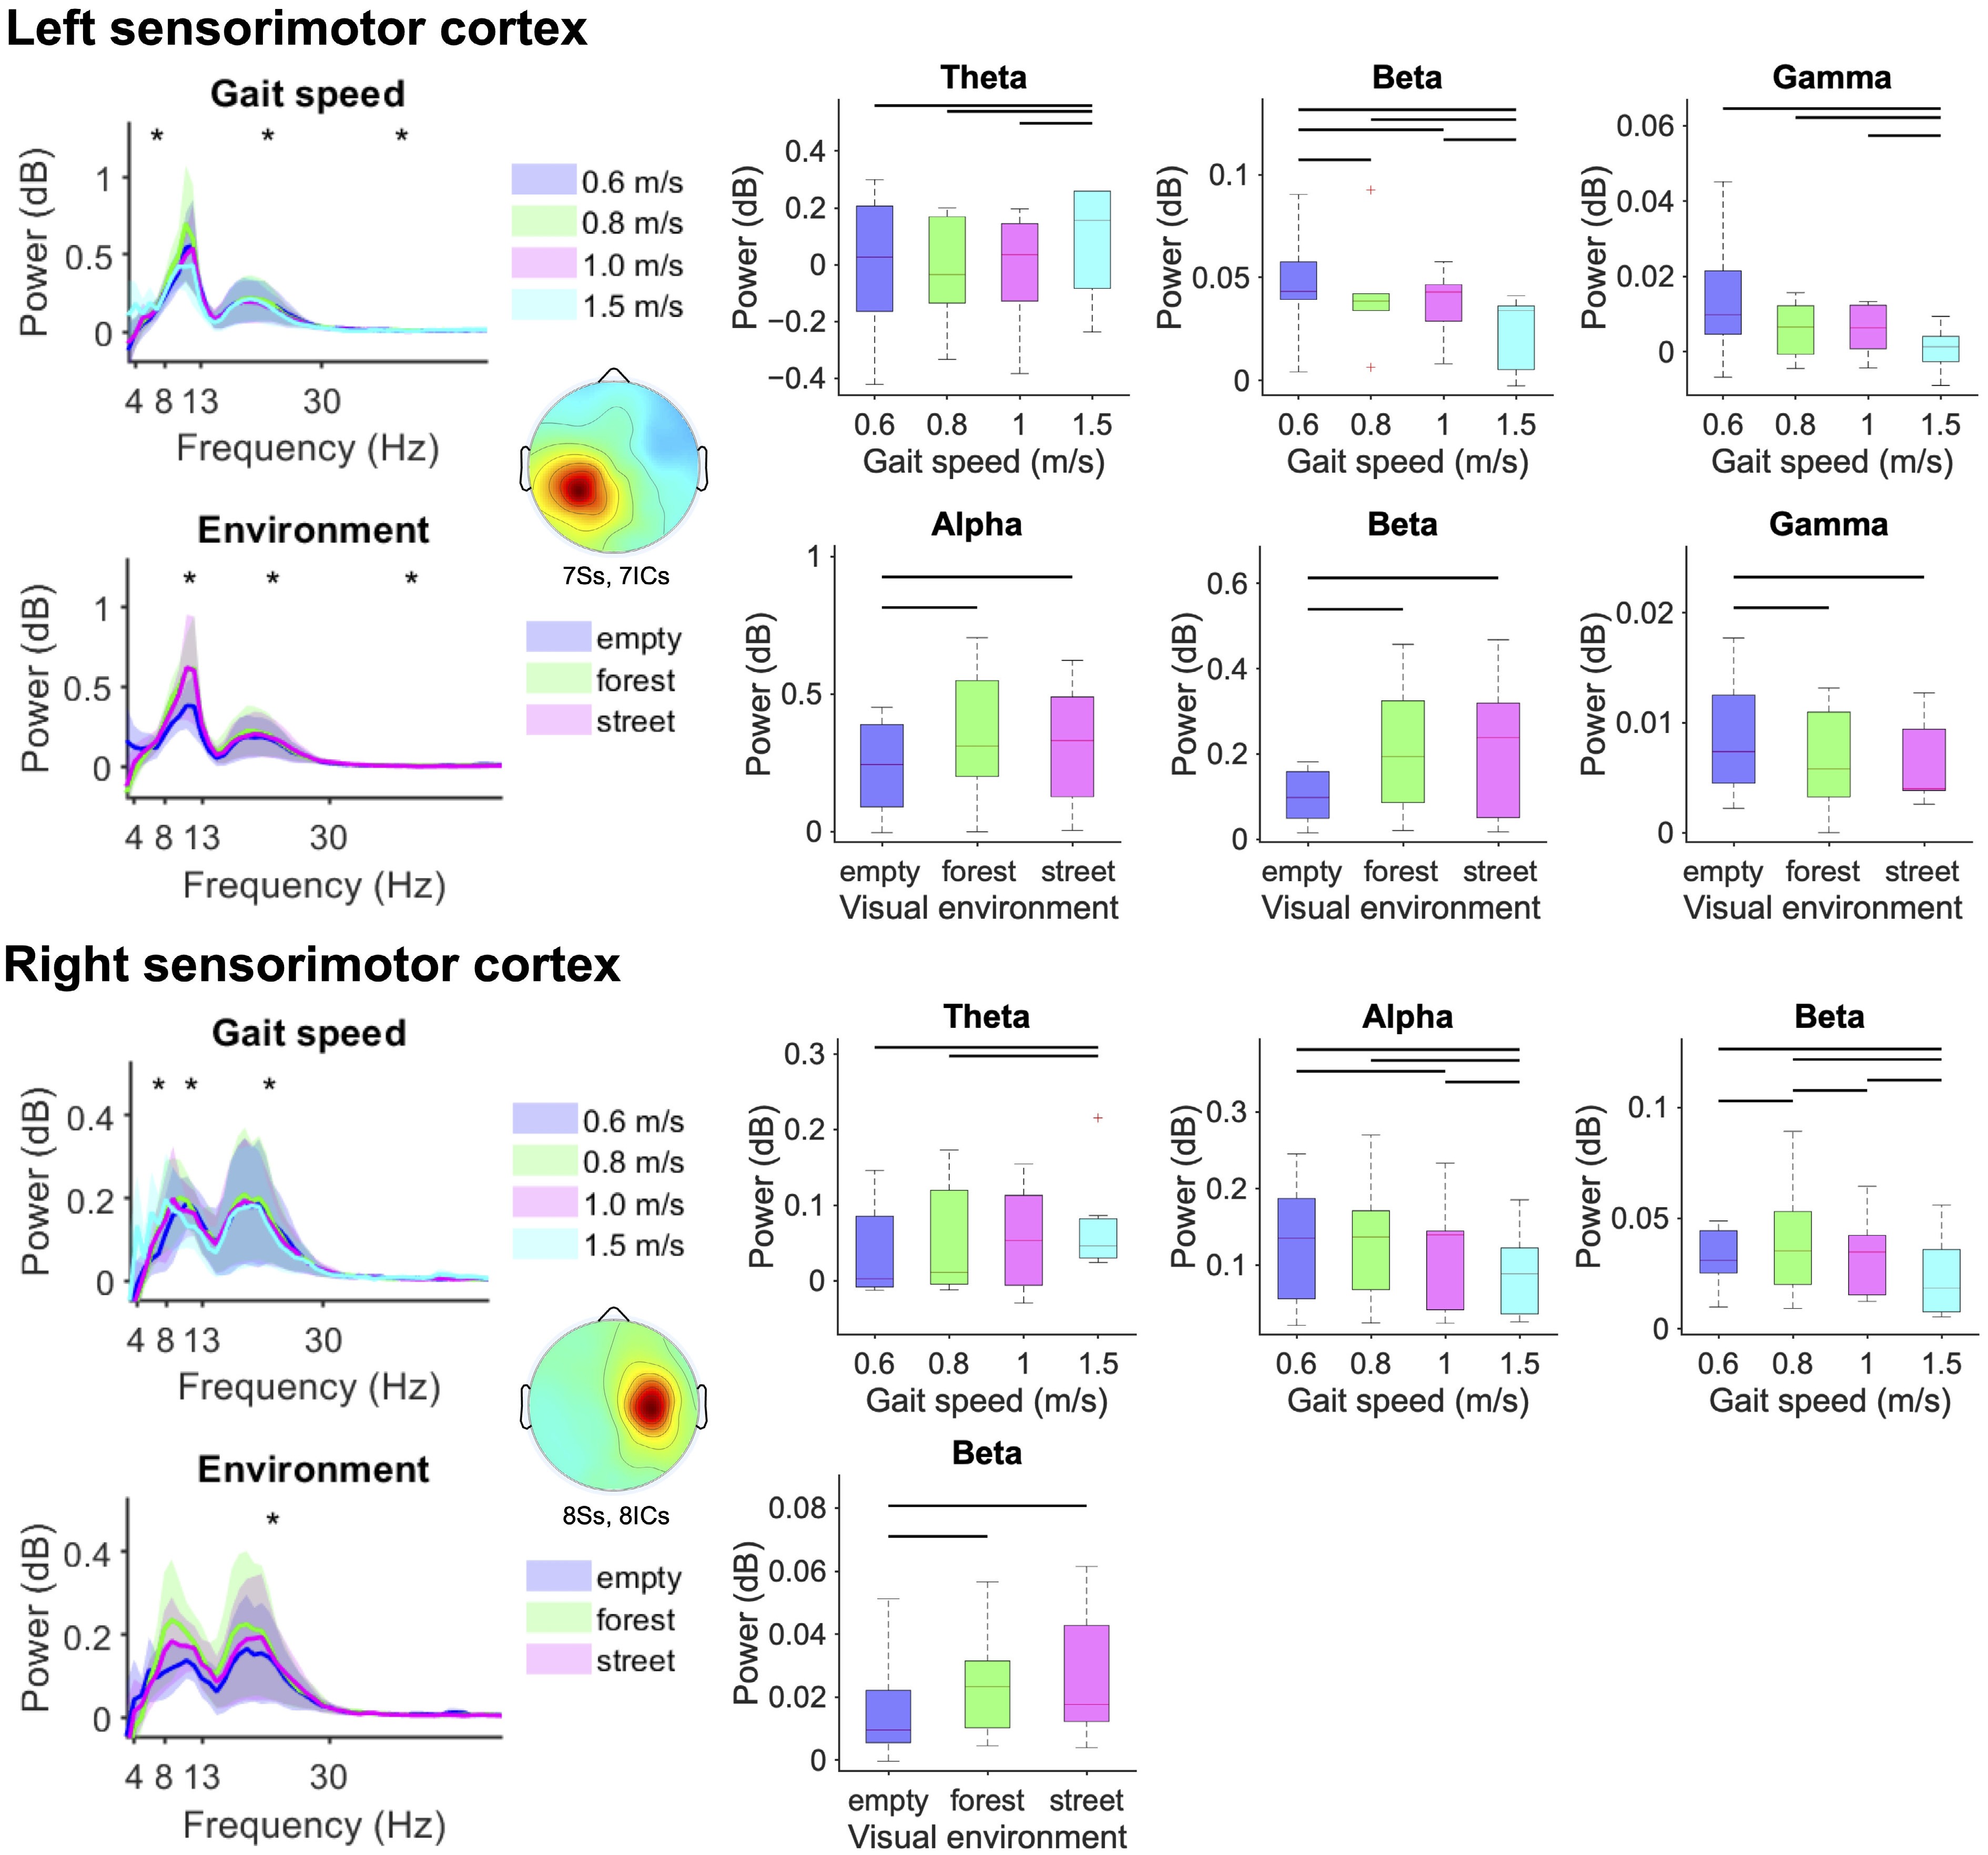
Figure 4.
Mean left and right sensorimotor electrocortical spectral power (left) and boxplots aggregated within the theta (4−8 Hz), alpha (8−13 Hz), beta (13−30 Hz), and gamma (30−50 Hz) bands (standard error of the mean) (right) for each gait speed (top) and visual environment (bottom). Statistically significant differences among conditions are highlighted with black asterisk(s) for theta, alpha, beta, and gamma frequency bands (left) and black lines over the boxplots (right) (bootstrap ANOVA, p < 0.05, FDR corrected).
-
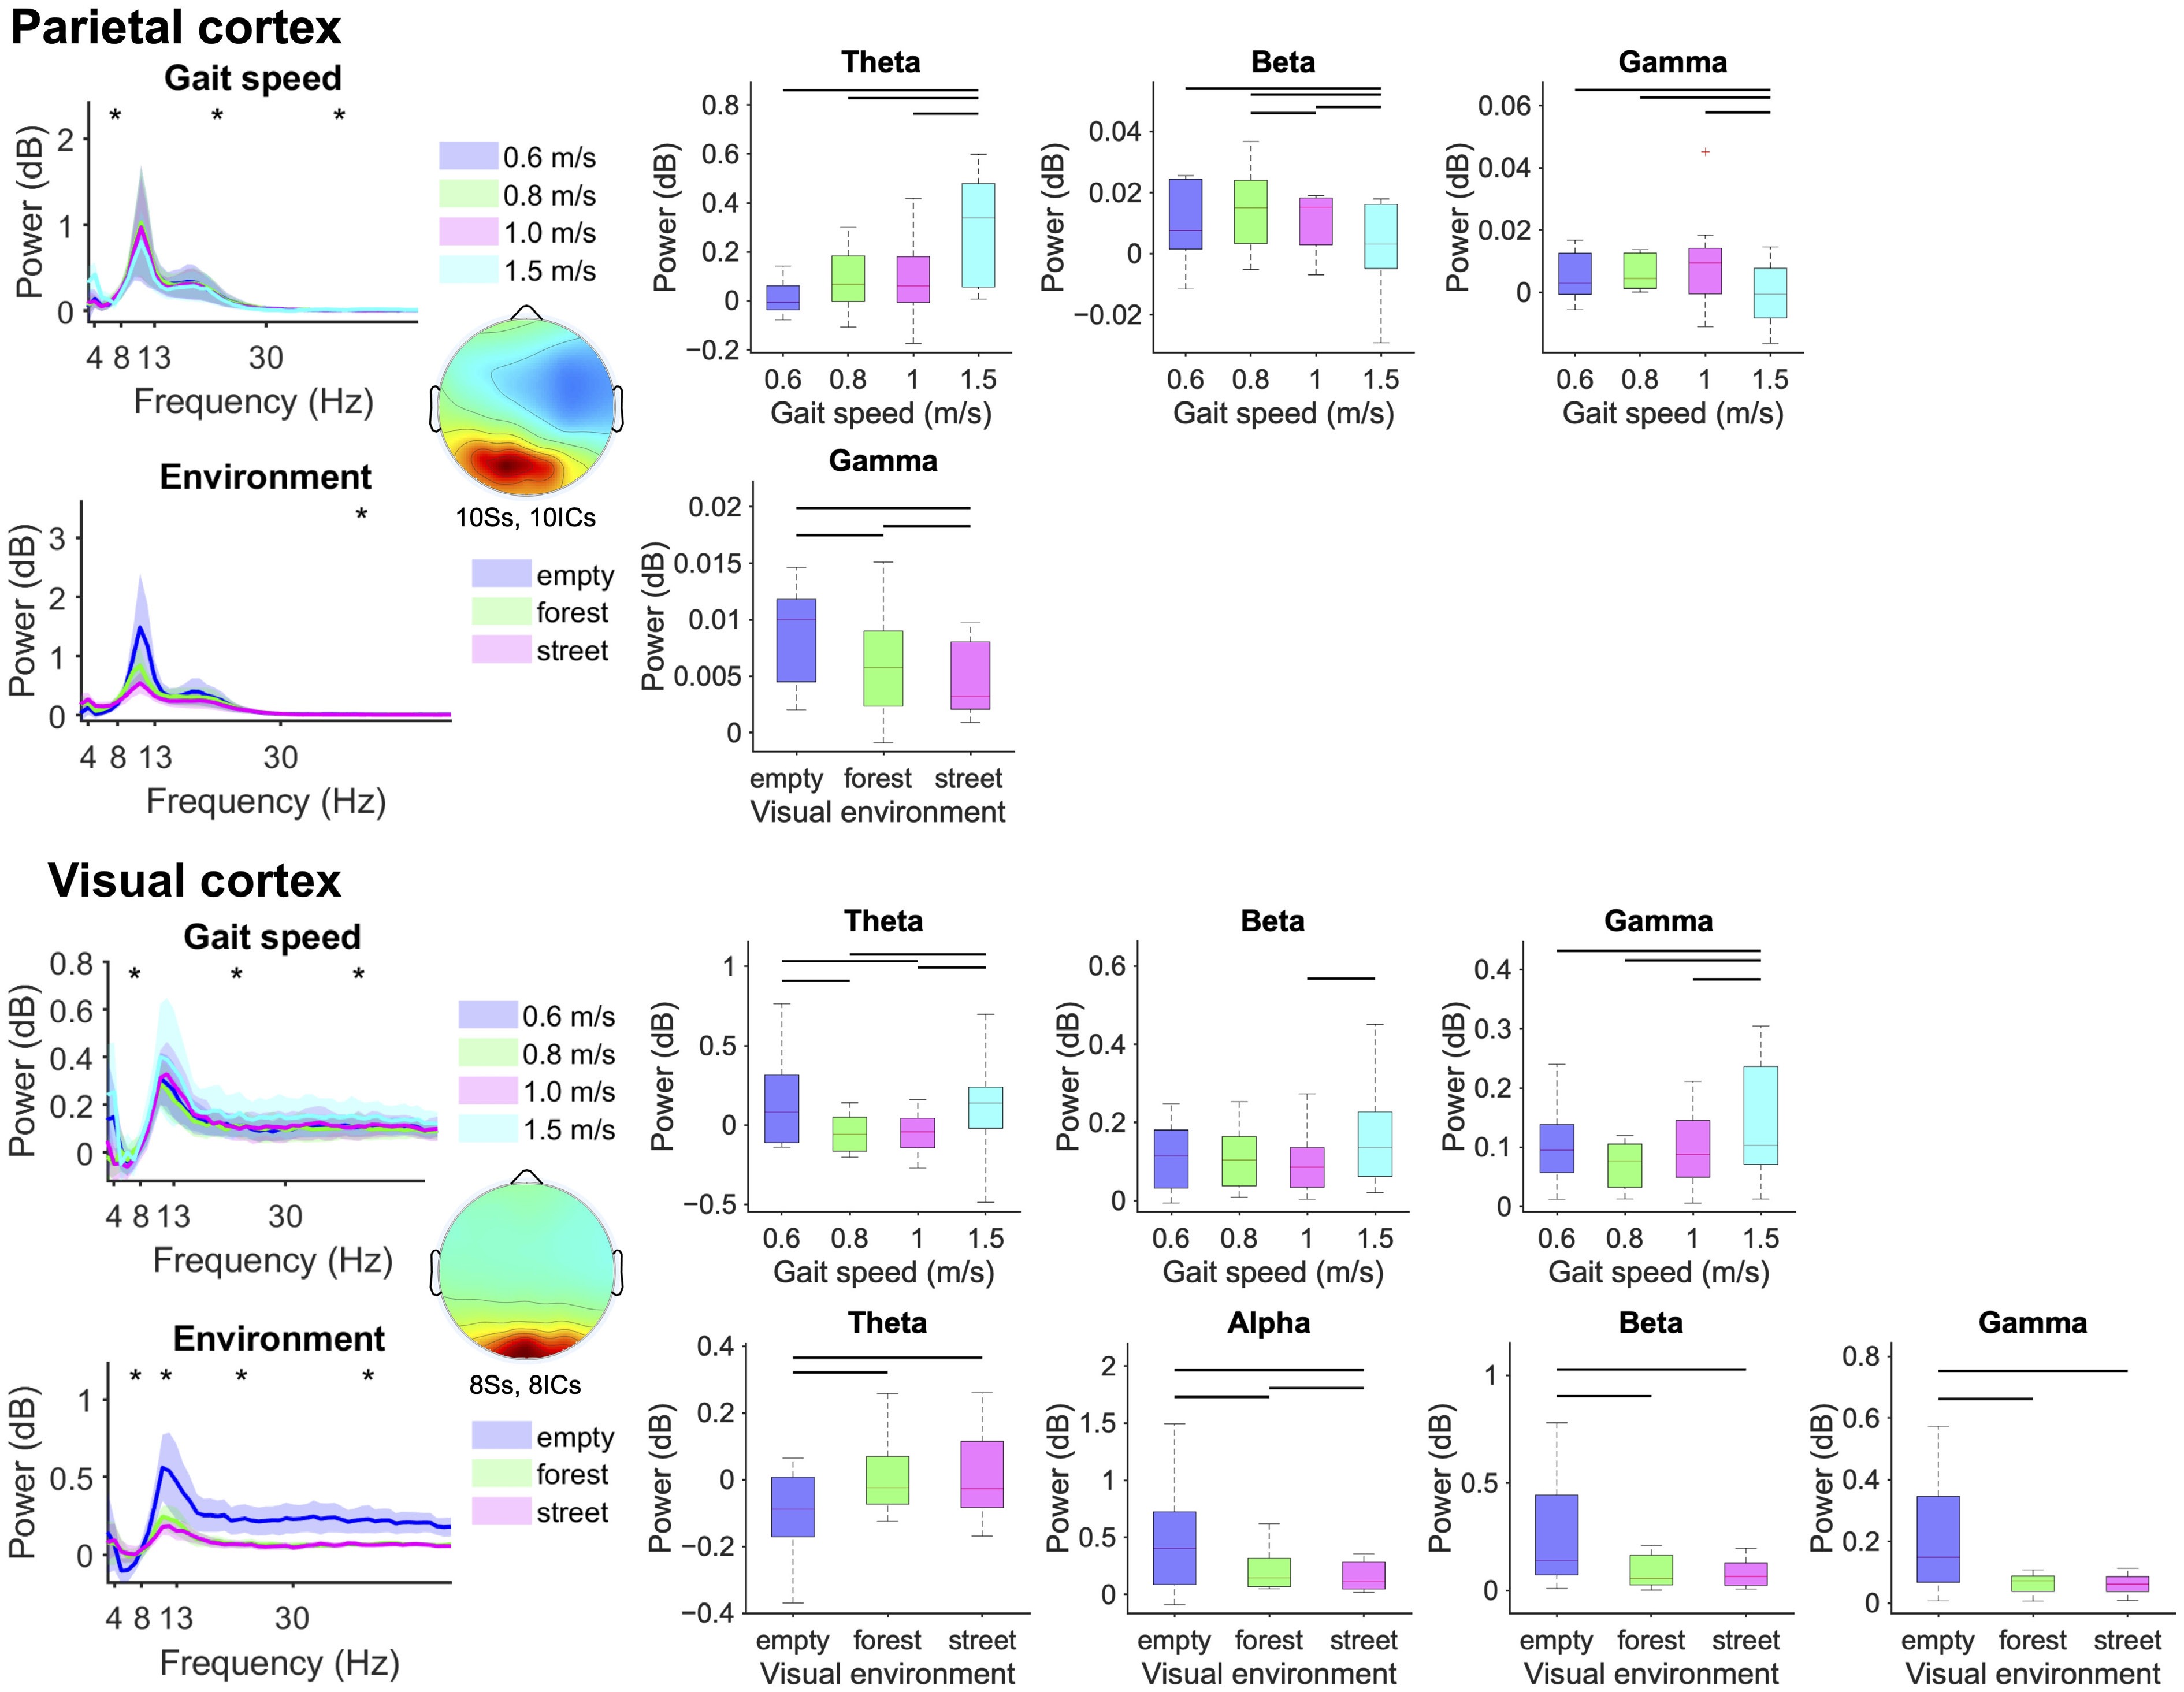
Figure 5.
Mean parietal and visual electrocortical spectral power (left) and boxplots aggregated within the theta (4−8 Hz), alpha (8−13 Hz), beta (13−30 Hz), and gamma (30−50 Hz) bands (standard error of the mean) (right) for each gait speed (top) and visual environment (bottom). Statistically significant differences among conditions are highlighted with black asterisk(s) for the theta, alpha, beta, and gamma frequency bands (left) and black lines over the boxplots (right) (bootstrap ANOVA, p < 0.05, FDR corrected).
Figures
(5)
Tables
(0)