-
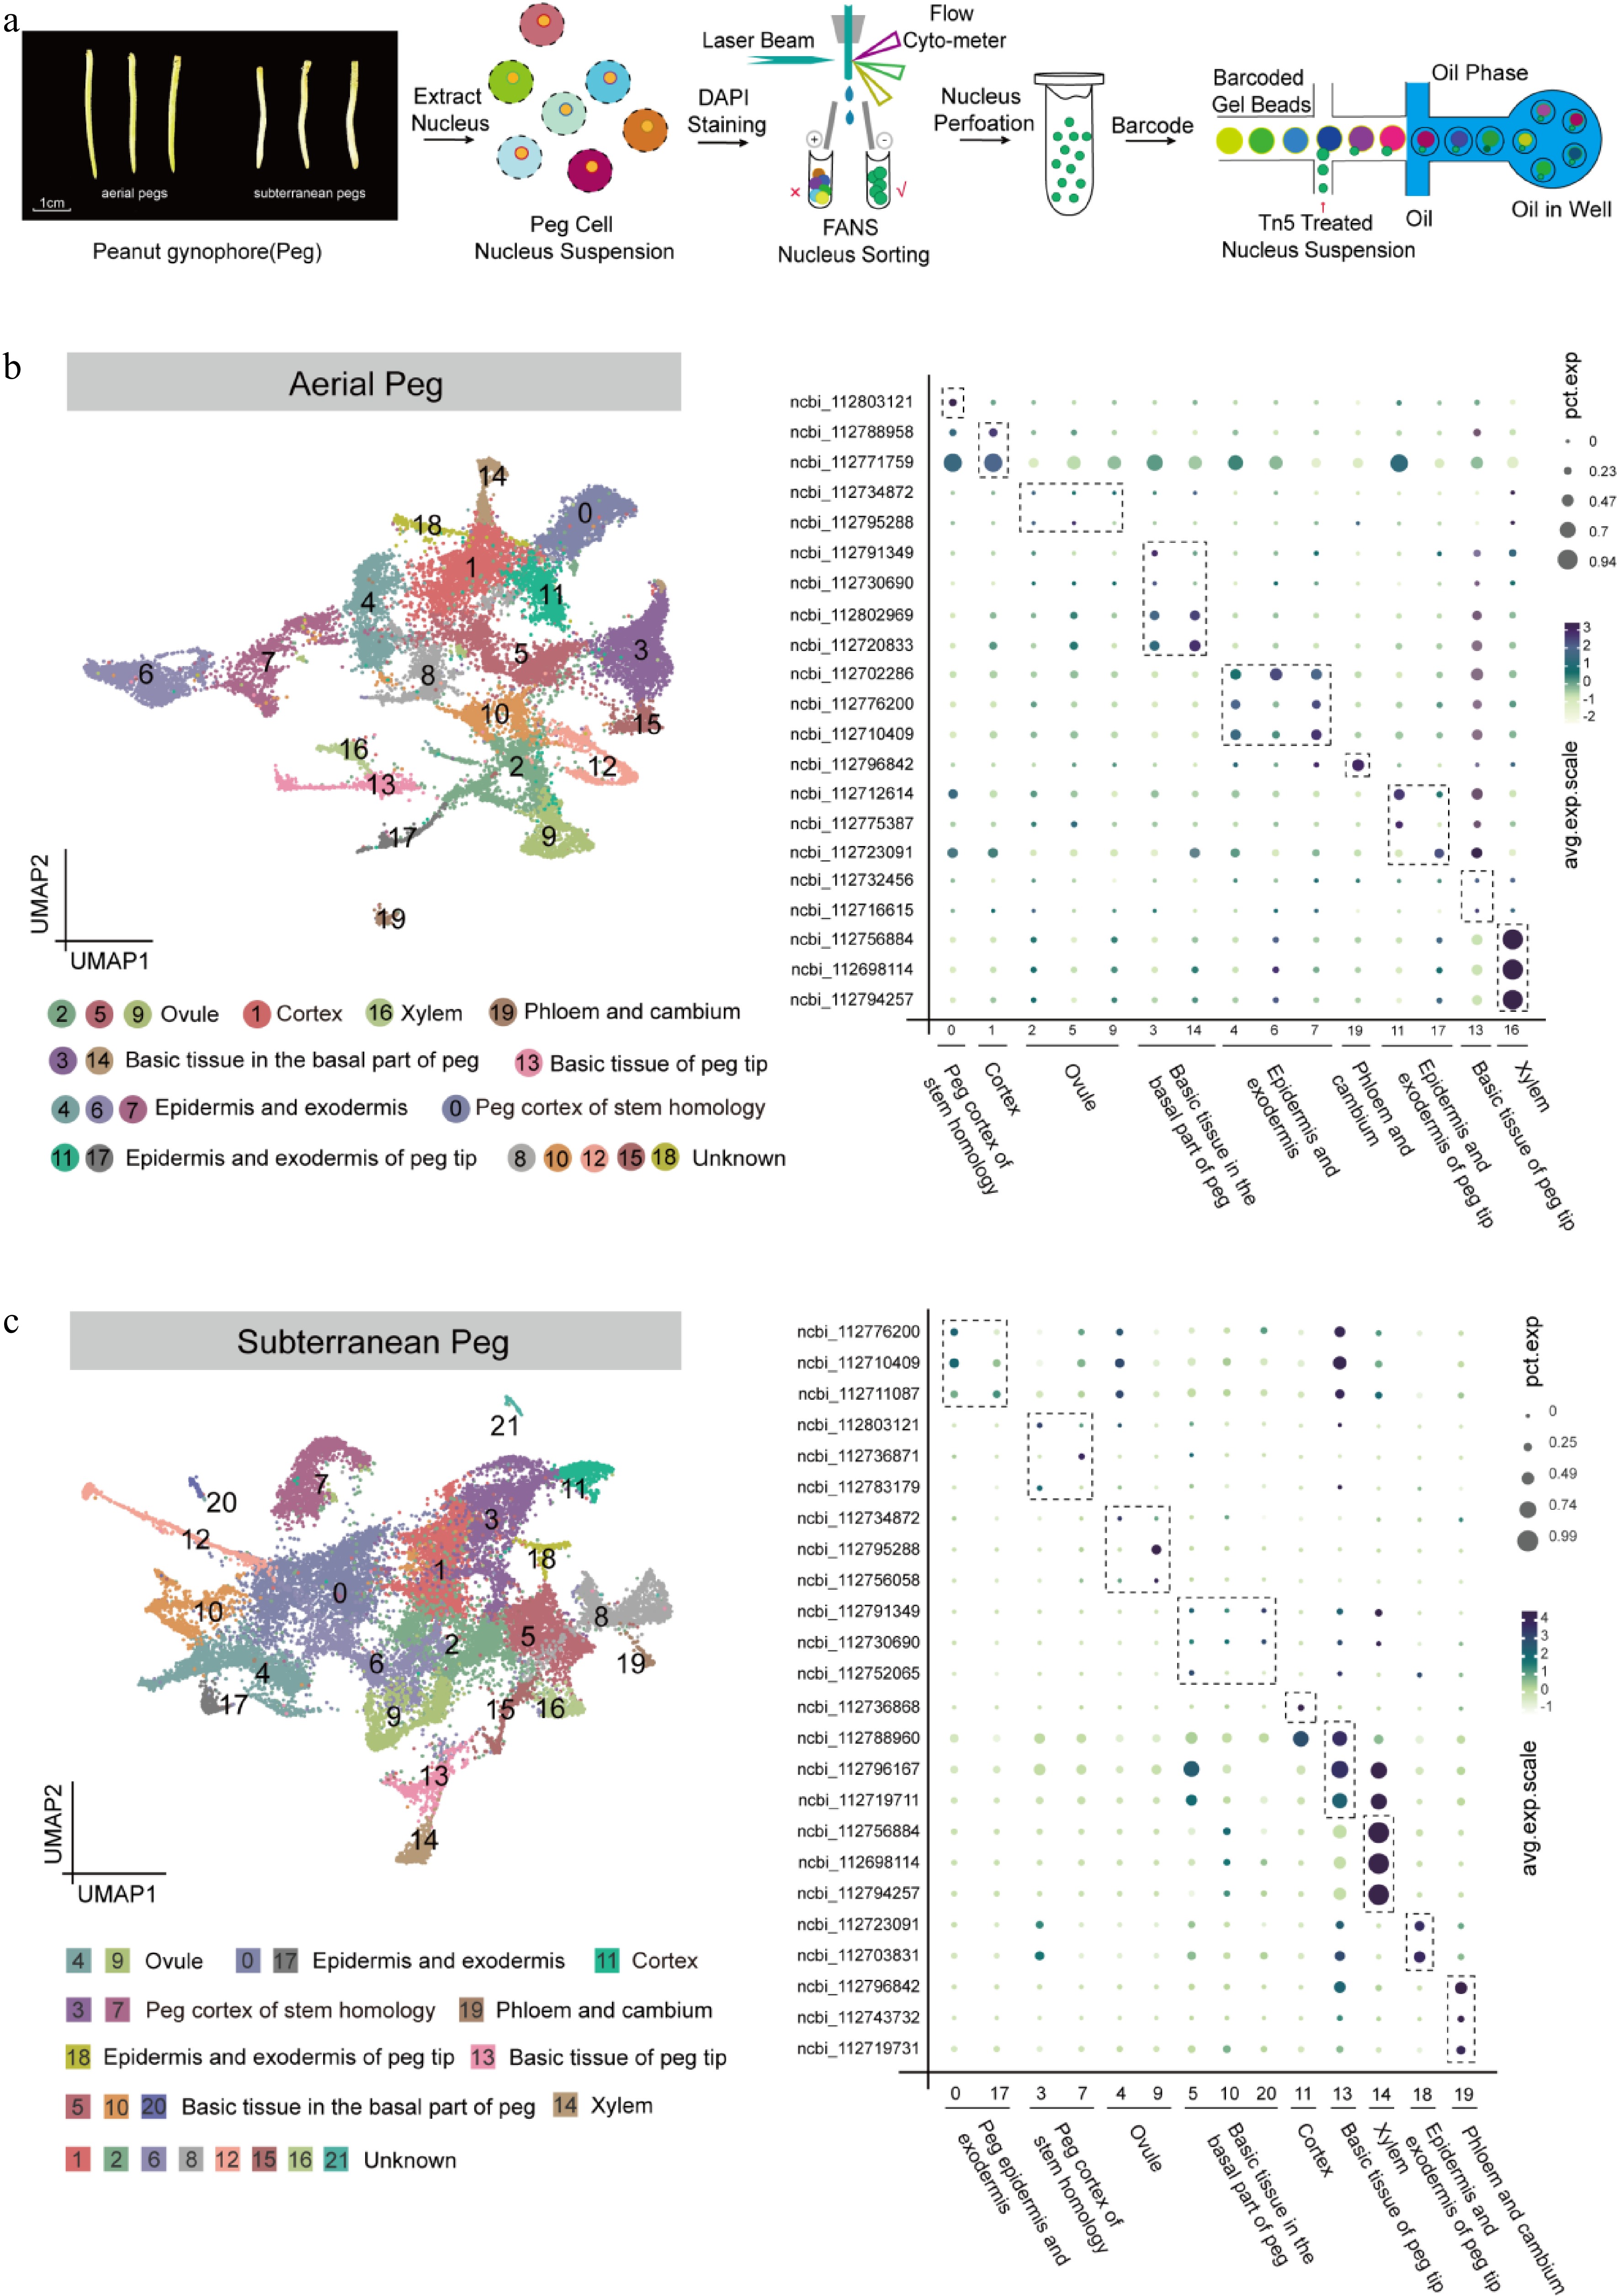
Figure 1.
Identification of cell types in aerial and subterranean pegs based on snRNA-seq. (a) Schematic overview of snRNA-seq experimental strategy based on 10× Genomics platform in aerial and subterranean pegs. Aerial pegs were collected 3 d after aboveground peg elongation, and subterranean pegs were collected 2 d after soil penetration. The nuclei solution was stained by DAPI (10 μM) and collected nucleus extraction concentration was adjusted to approximately 1,000 cells/μL, the single-nuclei suspensions were subsequently loaded onto 10× Genomics platform for snRNA-seq. (b) Uniform Manifold Approximation and Projection (UMAP) plot of 23,539 nuclei according to transcriptomic profiles in the aerial pegs. These nuclei were clustered in 20 different groups, and nine cell types were assigned based on the expression levels of cell marker genes. Each dot represents individual cell. (c) UMAP visualization identifying 22 putative cell clusters from 27,364 cells in subterranean pegs, comprising nine different cell types. Each dot denotes a single cell.
-
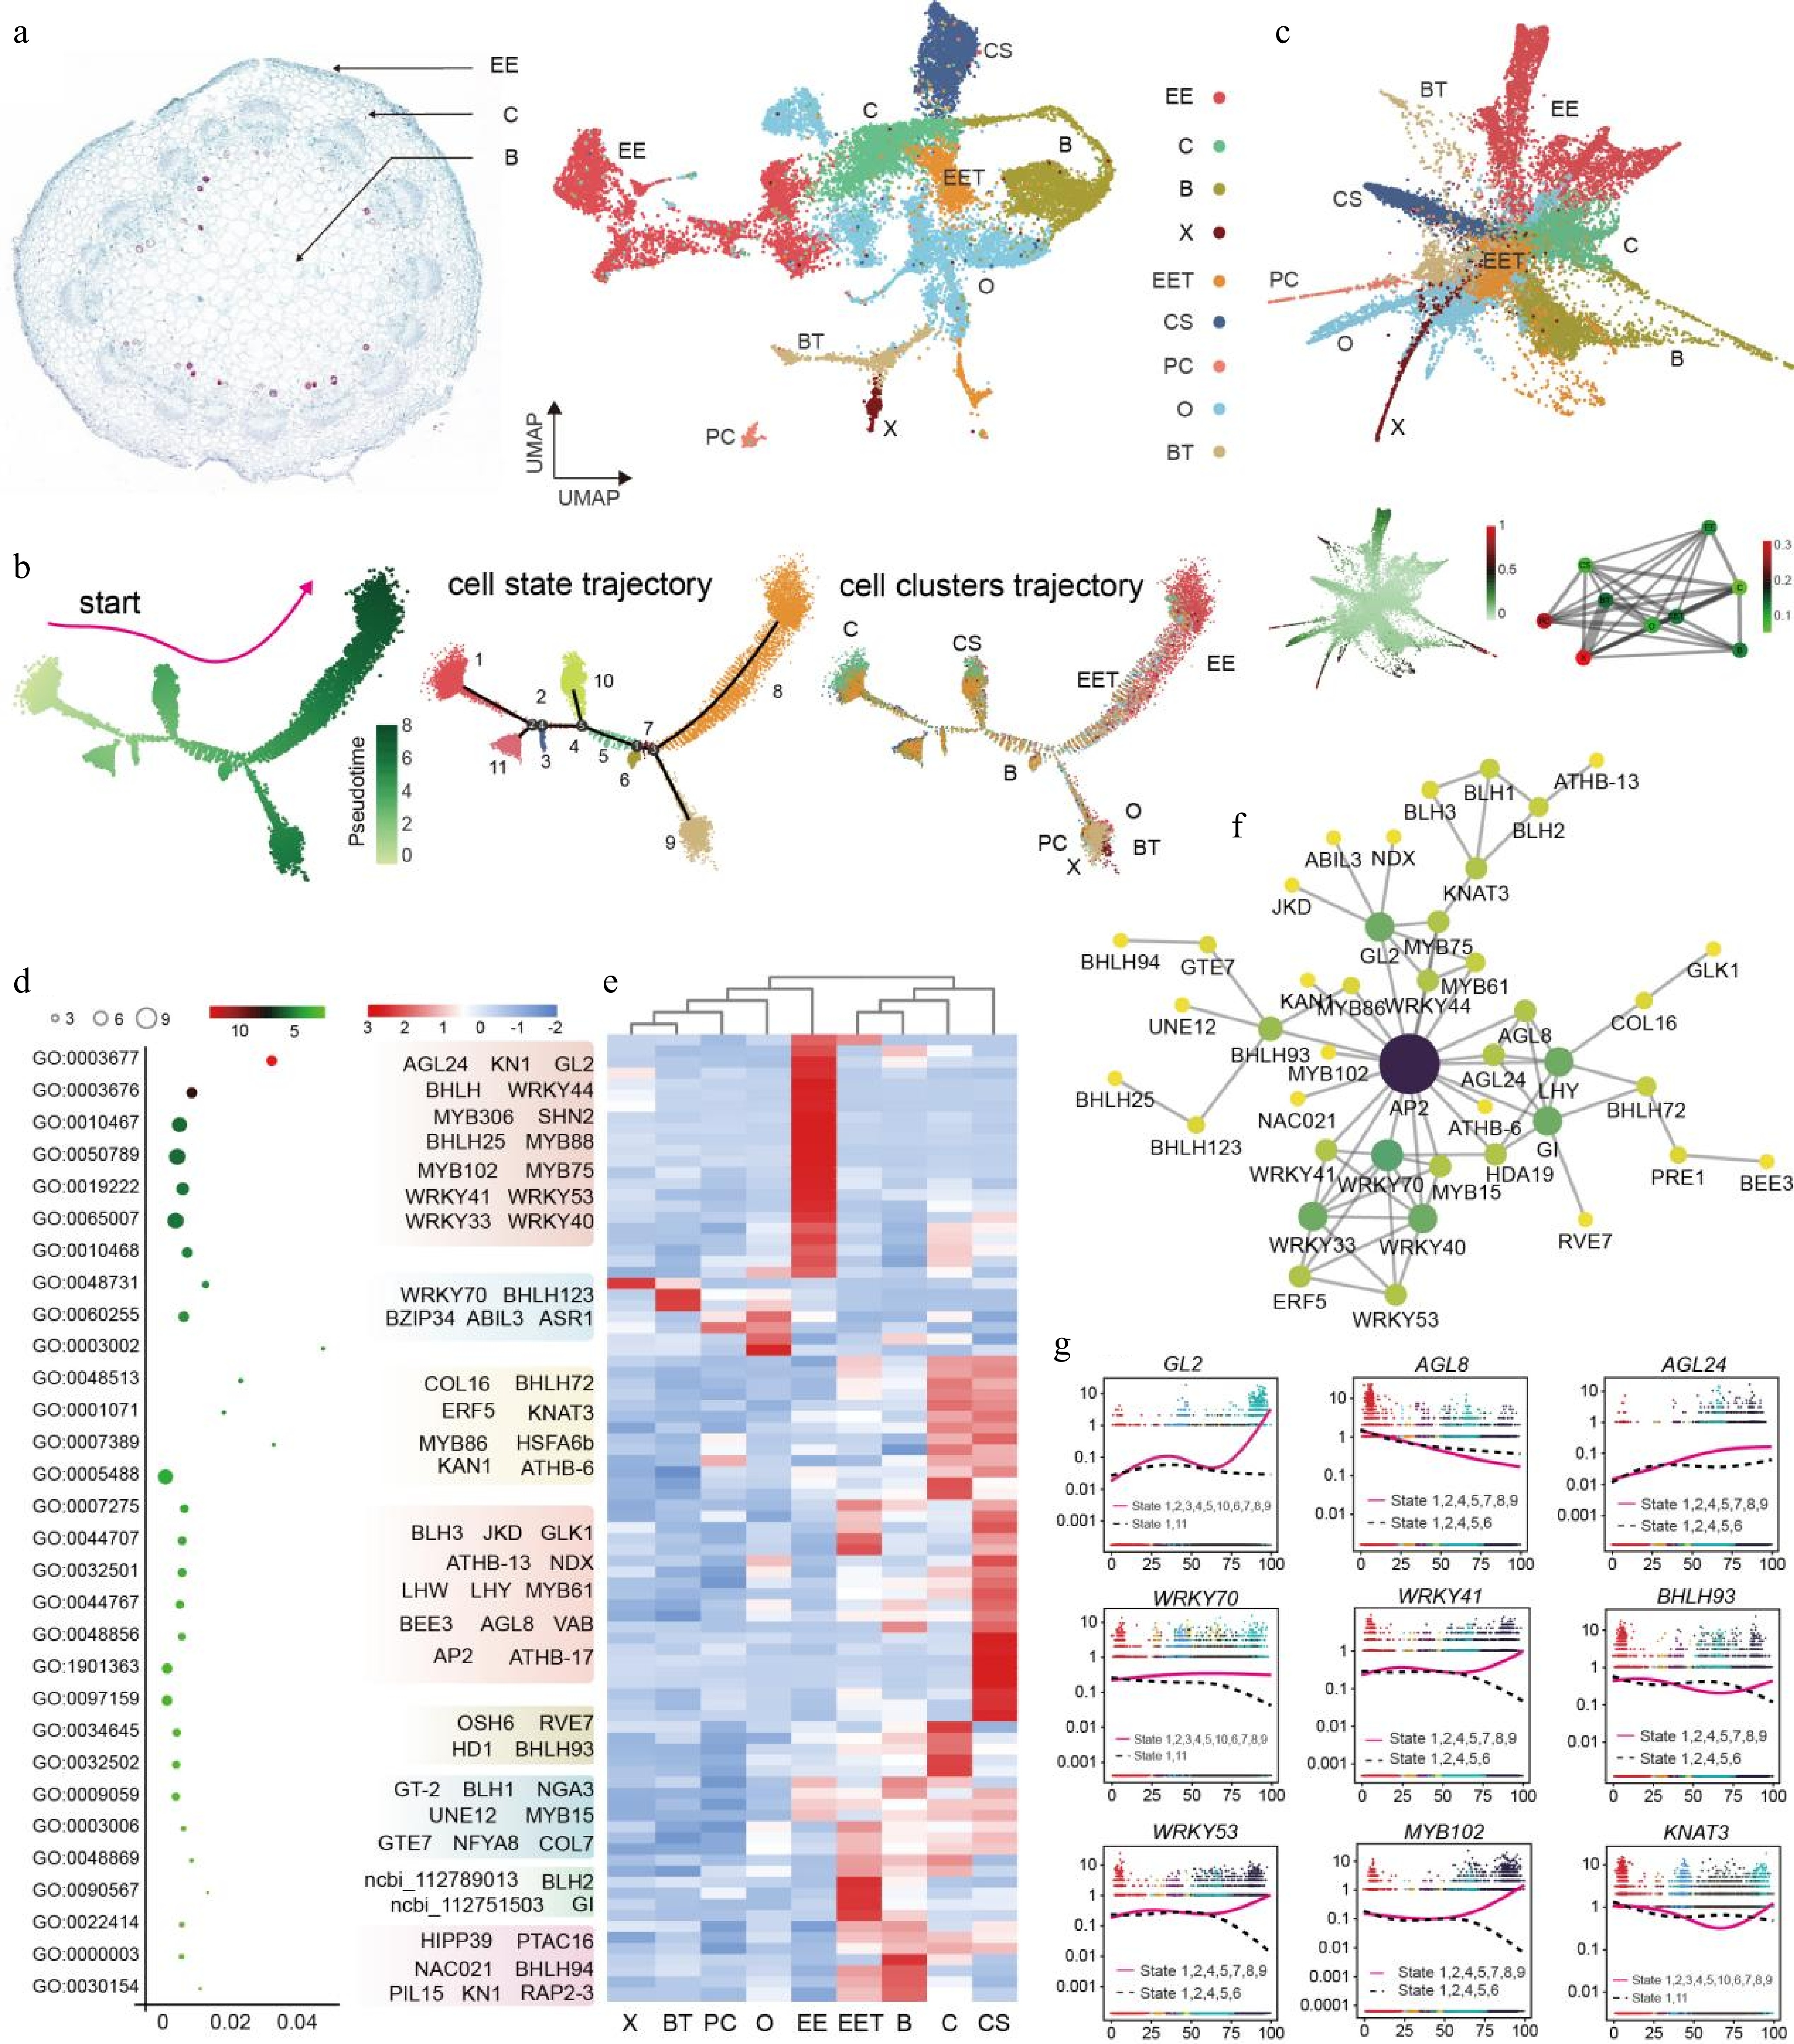
Figure 2.
Construction of differentiation trajectories and identification of key TFs in peanut aerial pegs. (a) UMAP visualization of nine identified cell types in aerial pegs. O, Ovule; EE, Epidermis and exodermis; B, Basic tissue in the basal part of peg; CS, Peg cortex of stem homology; C, Cortex; EET, Epidermis and exodermis of peg tip; BT, Basic tissue of peg tip; X, Xylem; PC, Phloem and cambium. (b) Distribution of cells in each cluster along with aerial peg pseudo-time trajectory analyzed by Monocle 2. Each dot indicates a single cell. Color bar 0−8 represents pseudotime level. (c) Partition-based graph abstraction (PAGA) trajectory of aerial pegs. (d) Gene Ontology (GO) enrichment analysis and heatmap displaying the expression patterns of 87 core TFs in the different cell types identified in aerial pegs; GO terms are represented by circles, with circle size proportional to the number of genes. For the heatmap, each row represents a gene and each column represents cell type. (e) Expression profiling of 87 core TFs cross different cell types in aerial pegs. X, Xylem; BT, Basic tissue of peg tip; PC, Phloem and cambium; O, Ovule; EE, Epidermis and exodermis; EET, Epidermis and exodermis of peg tip; B, Basic tissue in the basal part of peg; C, Cortex; CS, Peg cortex of stem homology. (f) Construction of predicted interaction network of identified regulatory TFs based on their homologs in the Arabidopsis genome. (g) Expression patterns of nine TFs in the differentiated state. The pink solid and dashed lines in the diagrams represent the expression patterns of the gene along different developmental trajectories.
-
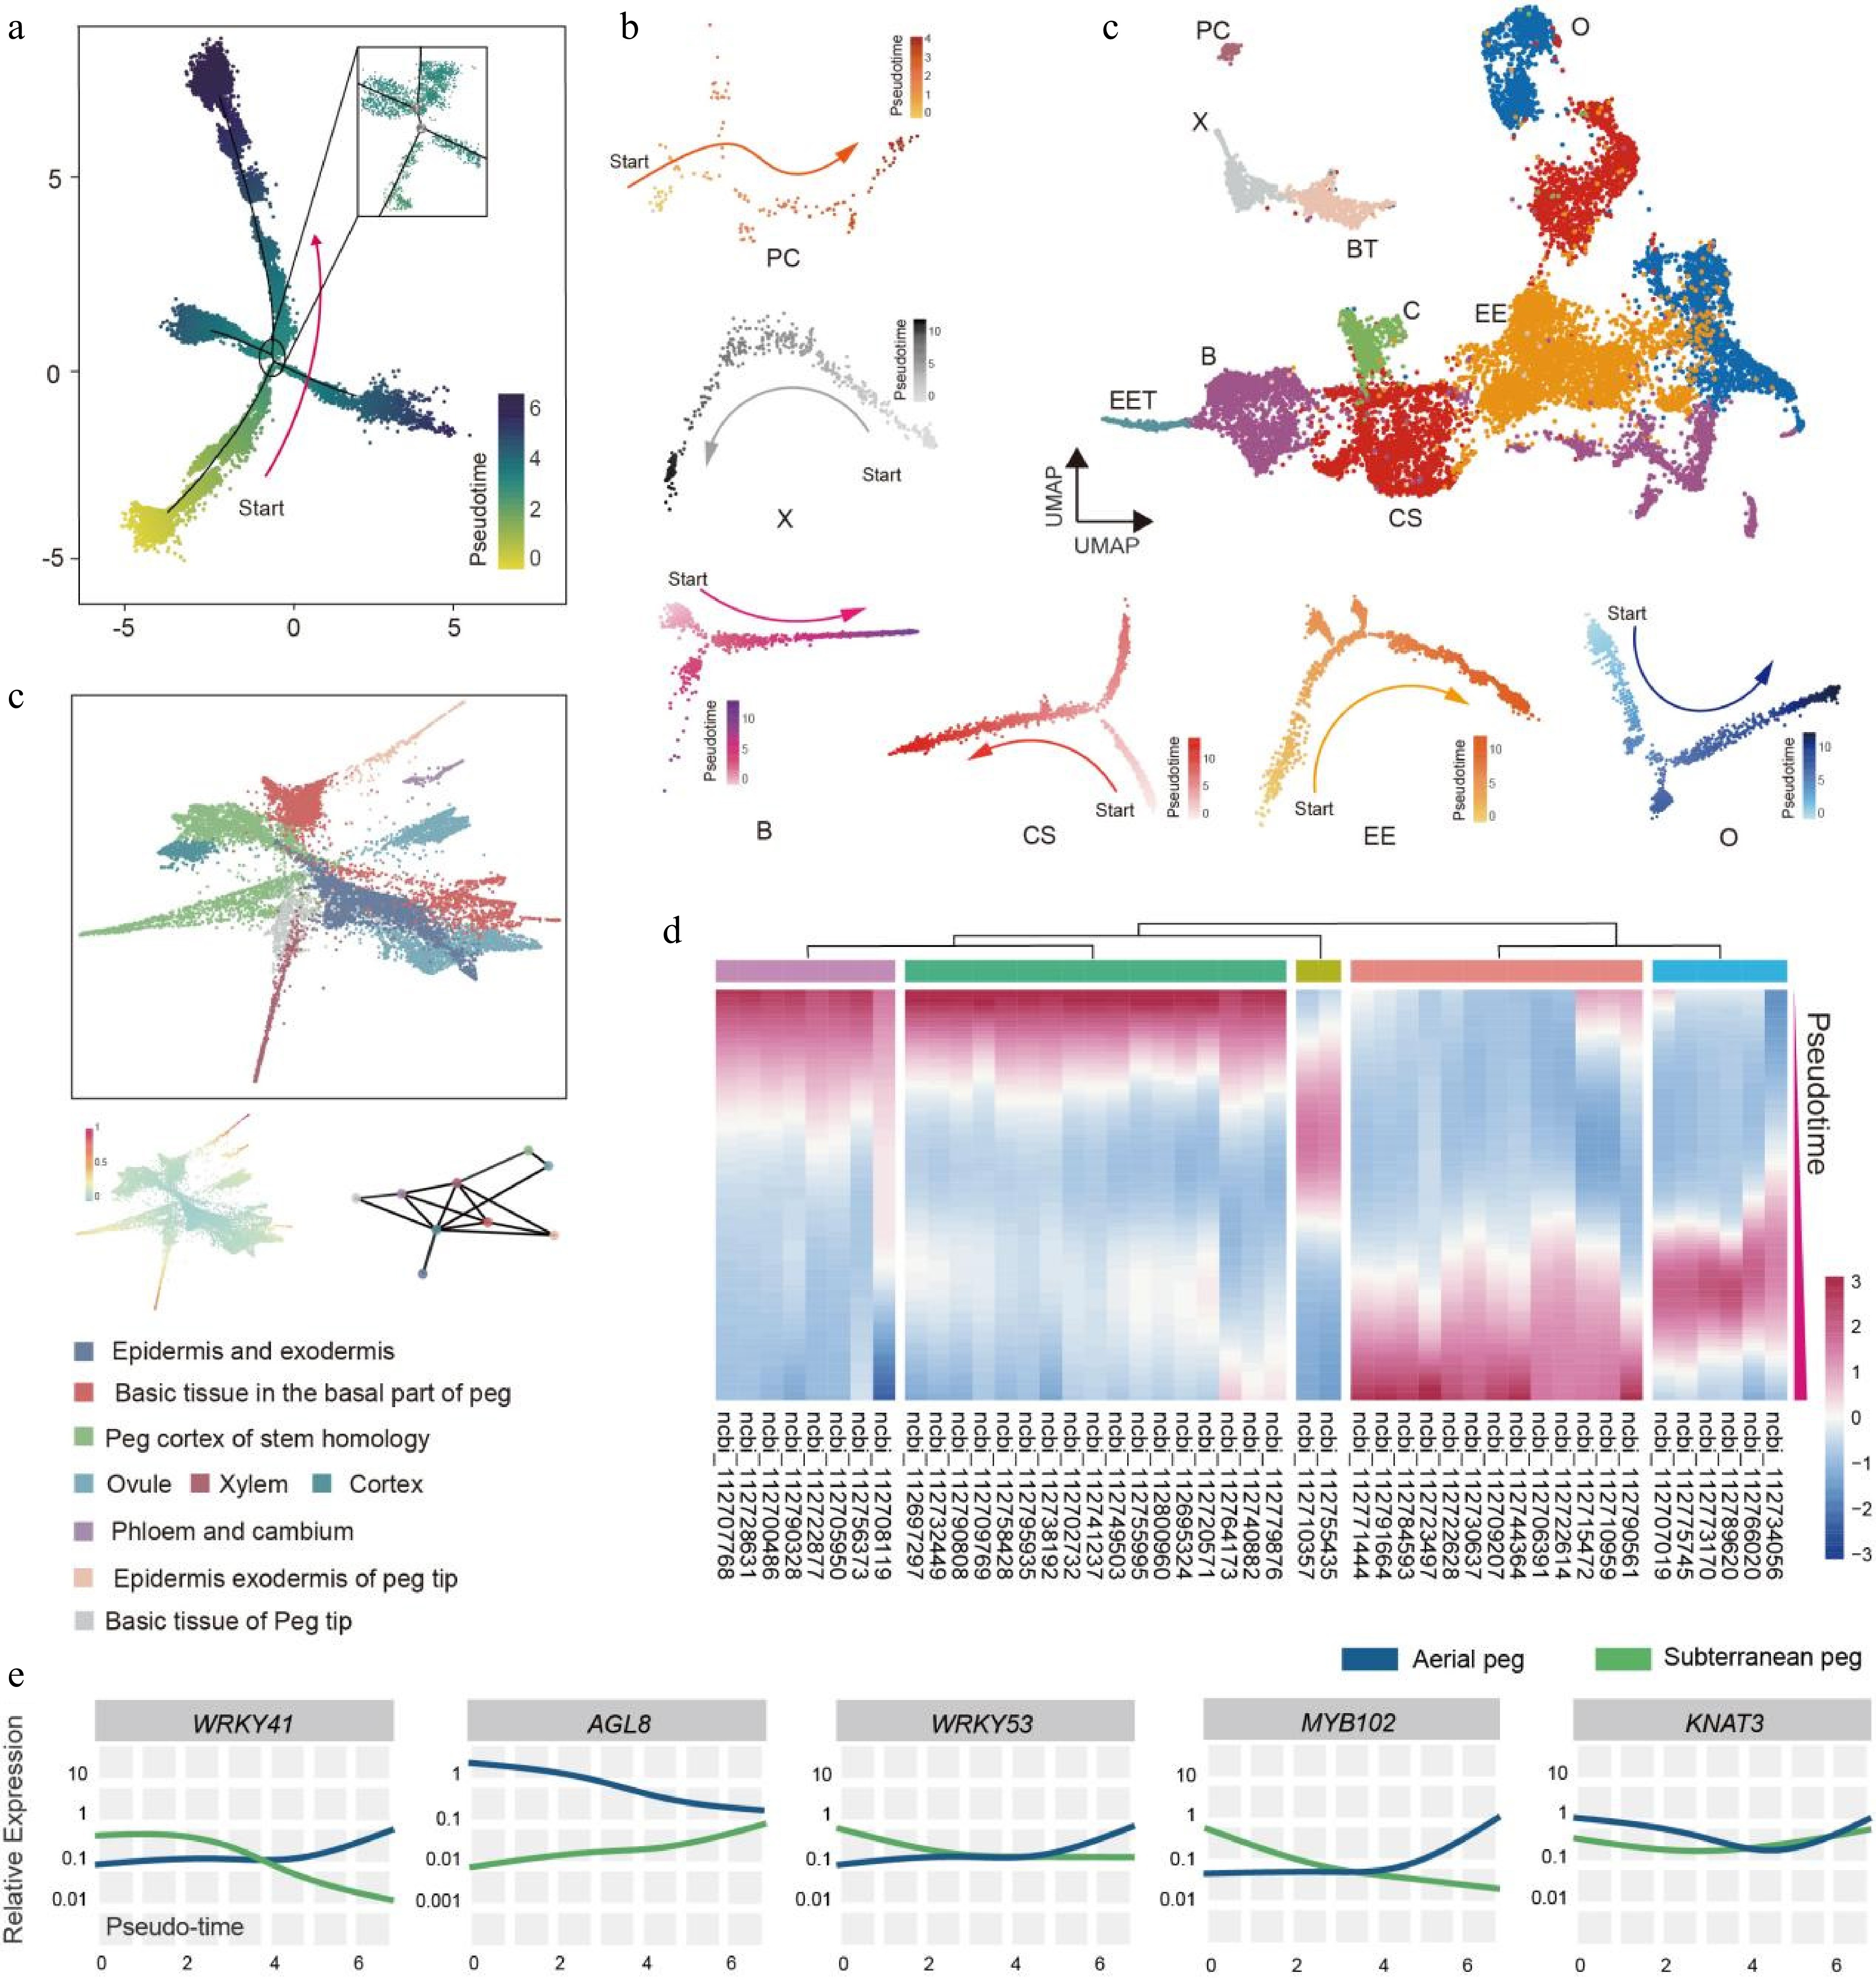
Figure 3.
Construction of differentiation pseudo-time trajectory for subterranean pegs. (a) Development differentiation pseudo-time trajectory of peanut subterranean pegs analyzed by Monocle 2. Each dot represents a single cell. (b) Differentiation trajectory of identified subterranean pegs cell types. O, Ovule; EE, Epidermis and exodermis; B, Basic tissue in the basal part of peg; CS, Peg cortex of stem homology; C, Cortex; EET, Epidermis and exodermis of peg tip; BT, Basic tissue of peg tip; X, Xylem; PC, Phloem and cambium. (c) PAGA trajectory of differentiation in subterranean pegs. (d) Clustering and expression kinetics of 46 TFs along the cell differentiation trajectory. (e) Expression patterns of five TFs along the development differentiation pseudo-time trajectory in aerial and subterranean pegs.
-
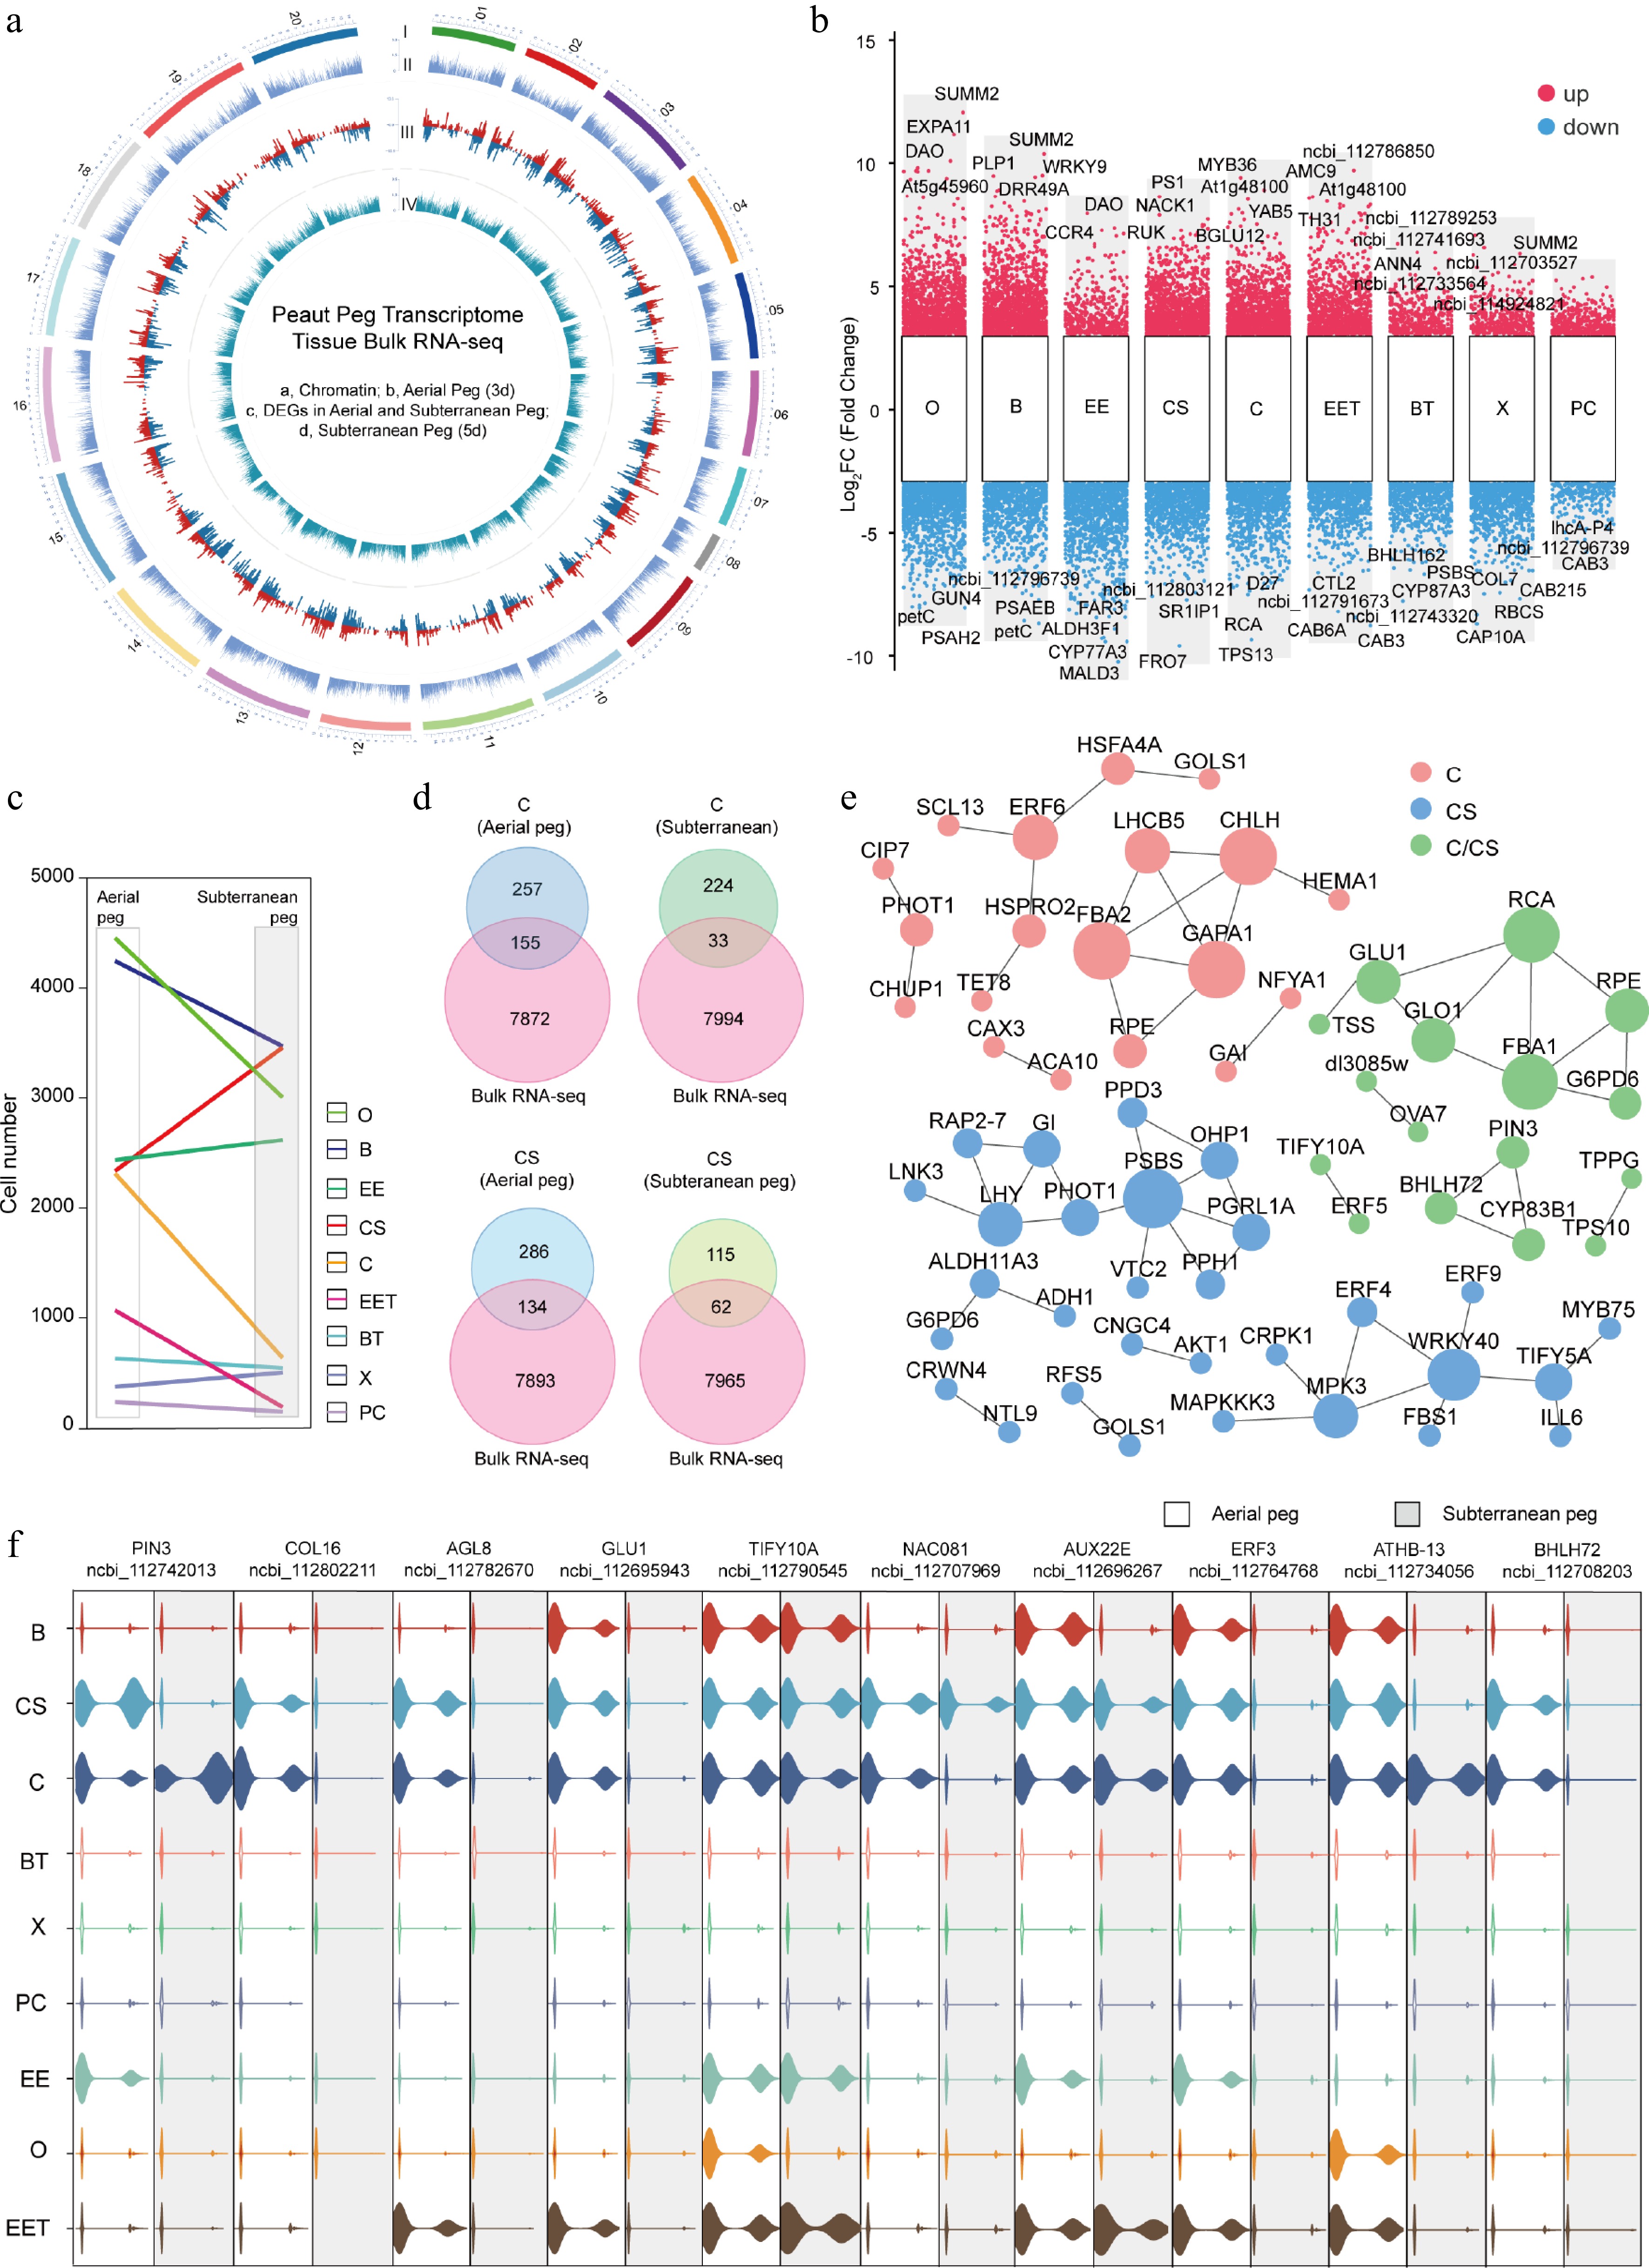
Figure 4.
Integrated analysis of single-cell and bulk transcriptome in aerial and subterranean pegs. (a) Circular map of gene expression atlas in aerial and subterranean pegs based on bulk transcriptome analysis. I, Outer circle, peanut genome 20 chromosome distribution; II, second circle, all identified expressed genes in aerial peg by bulk transcriptome; III, third circle, bulk RNA-seq identified DEGs between aerial and subterranean pegs; IV, inner circle, all identified expressed genes in subterranean pegs by bulk transcriptome. (b) Up- and down-regulated DEGs identified by snRNA-seq and bulk RNA-seq in various cell types. (c) Frequencies of the different cell types in aerial and subterranean pegs. (d) Venn diagram showing DEGs in cortex of stem homology (CS) and cortex (C) cells between aerial and subterranean pegs. (e) DEGs from aerial and subterranean pegs cortex of stem homology and cortex cells comprised a regulatory predicted interaction network. (f) Violin plots showing the relative expression level of potential key DEGs between aerial and subterranean pegs. O, Ovule; EE, Epidermis and exodermis; B, Basic tissue in the basal part of peg; CS, Peg cortex of stem homology; C, Cortex; EET, Epidermis and exodermis of peg tip; BT, Basic tissue of peg tip; X, Xylem; PC, Phloem and cambium.
-
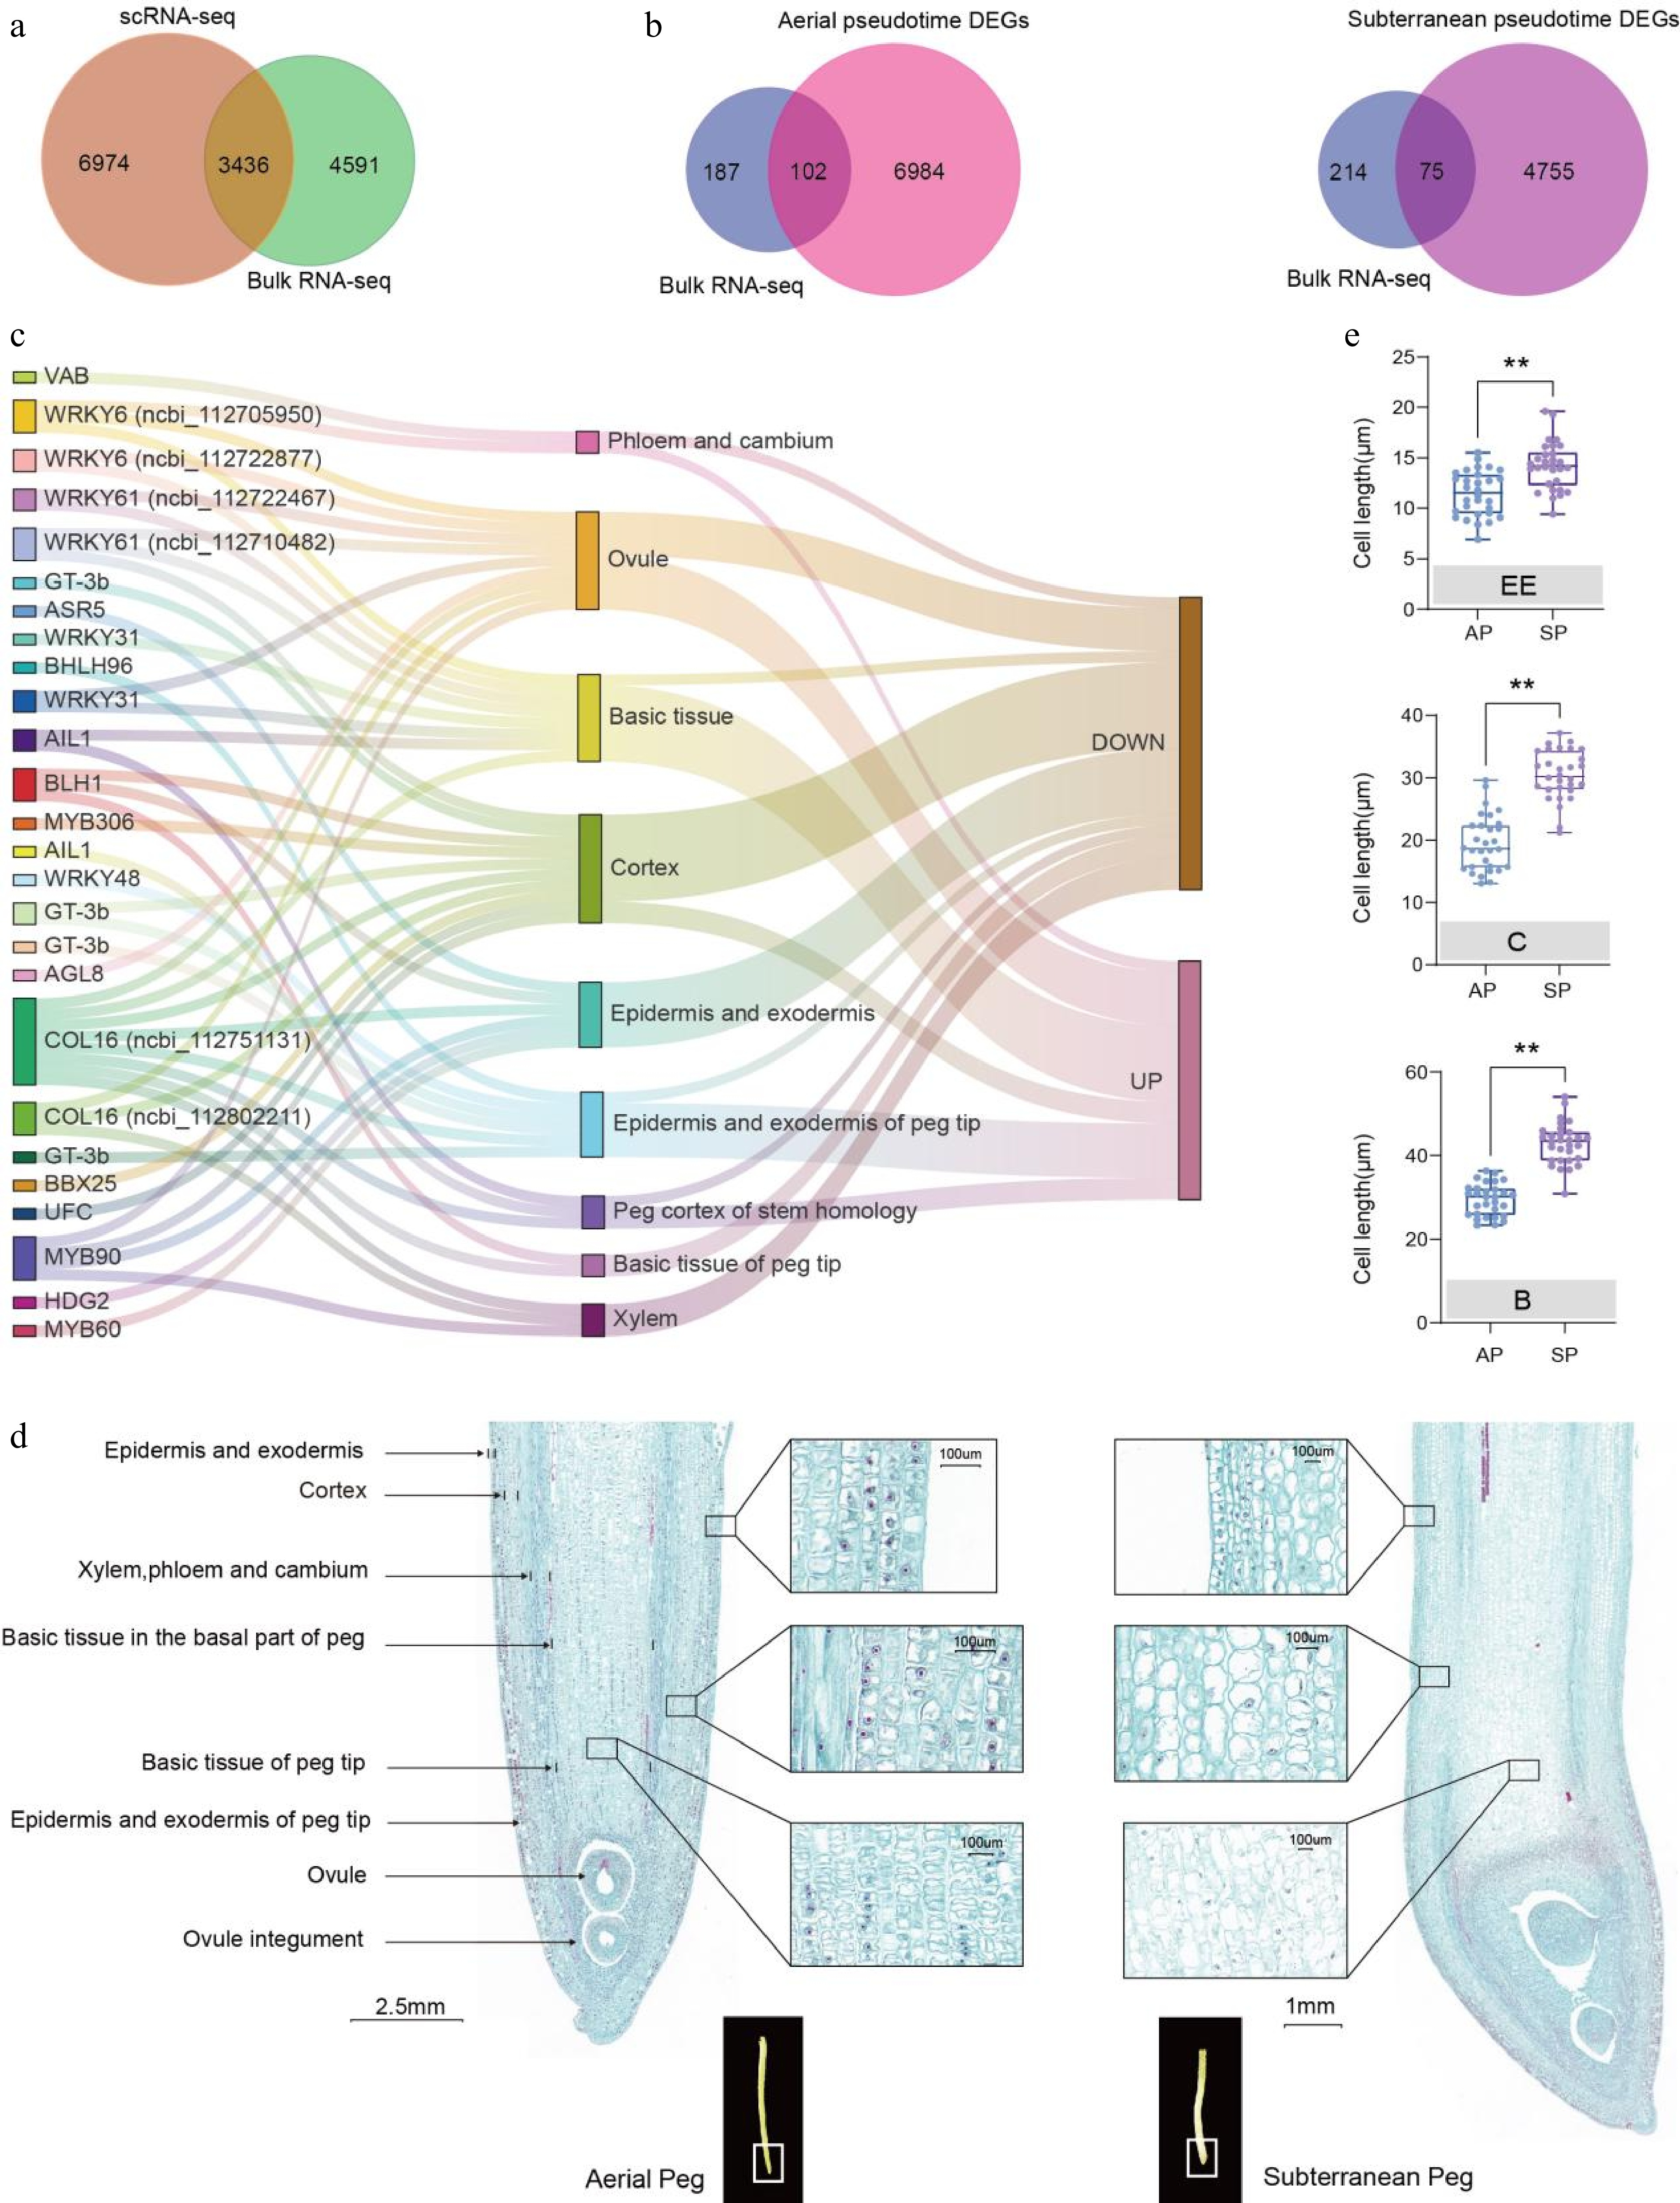
Figure 5.
Comparison of the transcriptomic atlases of aerial and subterranean pegs revealed key regulators involved in cell differentiation. (a) Comparative visualization of bulk RNA-seq and snRNA-seq derived differentially expressed genes (DEGs) between aerial and subterranean pegs. (b) Venn diagram showing 102 and 75 overlapping TFs were simultaneously upregulated or downregulated in bulk RNA-seq and snRNA-seq profiles in the pseudo-time trajectory of aerial and subterranean pegs, respectively. (c) Distribution and upregulation or downregulation of 26 potential key TFs in nine clusters based on a Sankey diagram. (d) Longitudinal section of aerial and subterranean pegs. (e) Statistical analysis of different cell sizes between aerial and subterranean pegs. A total of 30 individuals from three biological replicates were used for cell size calculation. EE: epidermis and exodermis; C: cortex; B: basic tissue in the basal part of the peg. ** Indicates a statistically significant difference between aerial and subterranean pegs at p < 0.01.
-
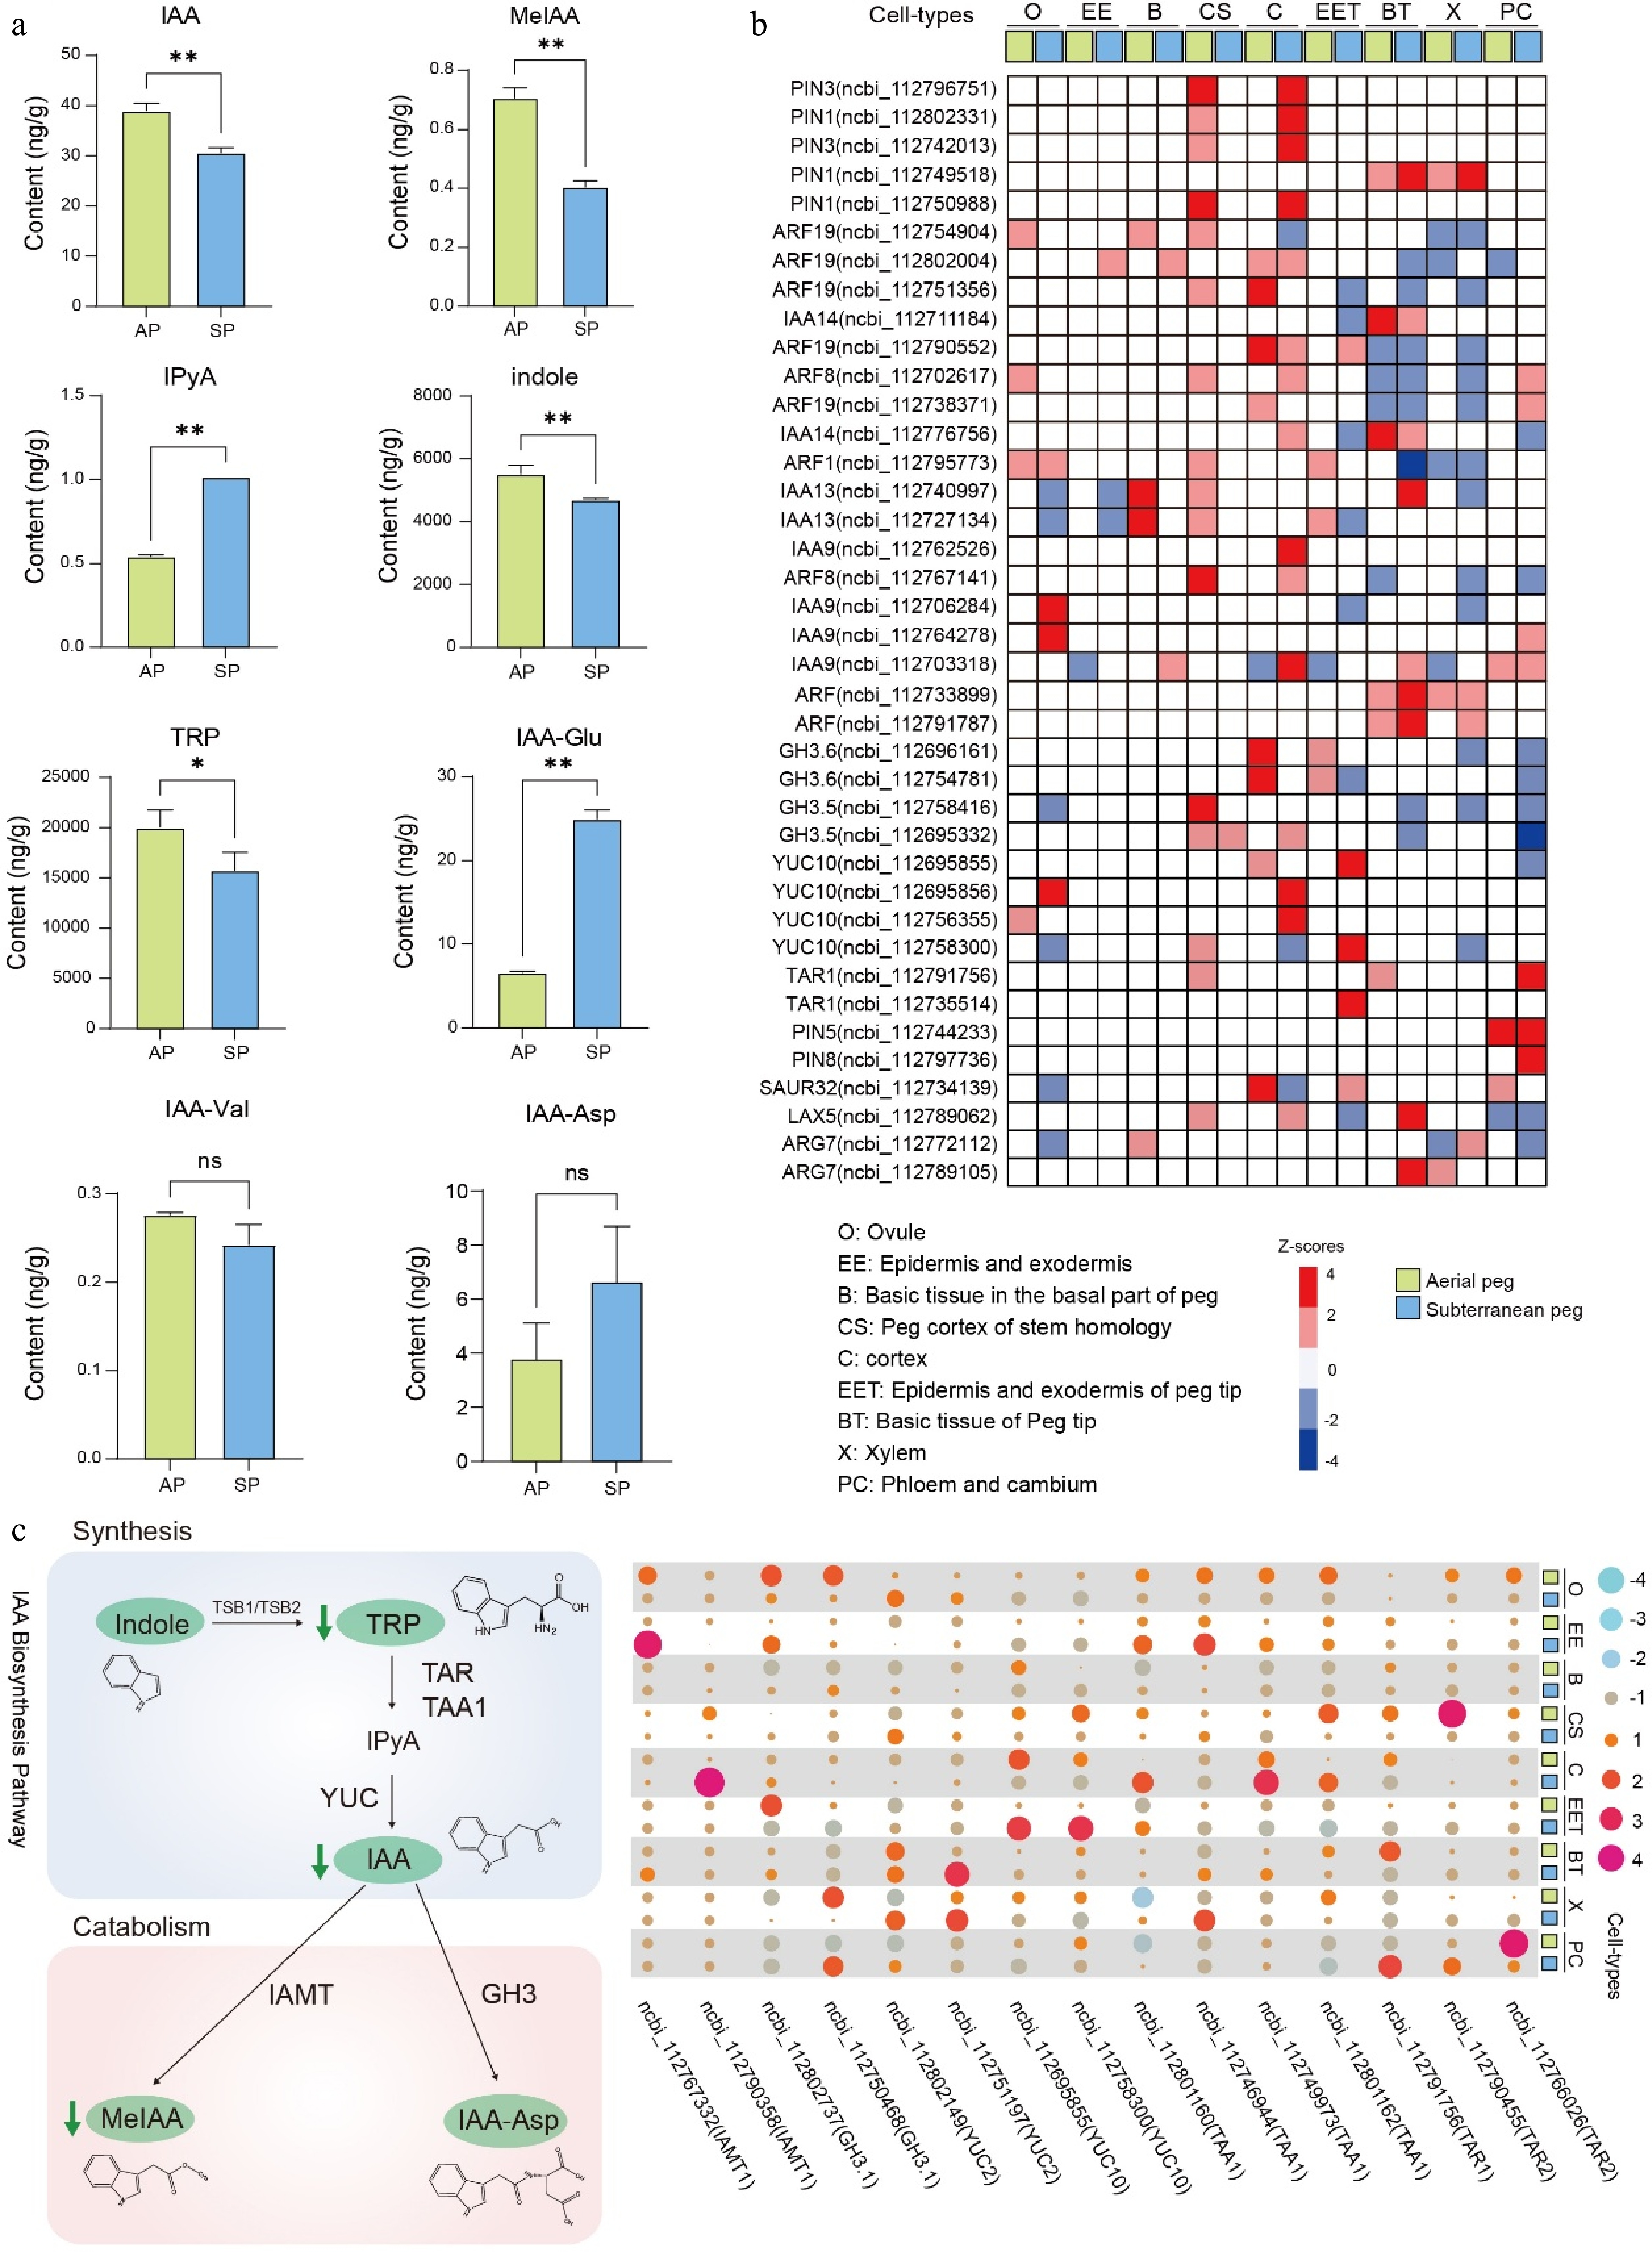
Figure 6.
Auxin pathway participating in peg development. (a) IAA and its derivatives measurement between aerial and subterranean pegs. * and ** indicate statistically significant difference between aerial and subterranean pegs at p < 0.05 and p < 0.01, respectively. (b) Cell-type-specific expression of biosynthesis, signal transport, and transduction genes of auxin based on snRNA-seq atlas in both aerial and subterranean pegs. (c) The expression profiling of genes involved in auxin metabolism.
Figures
(6)
Tables
(0)