


-
Peanut (Arachis hypogaea L.), also known as groundnut, is an important leguminous crop of the Fabaceae family in tropical and subtropical regions that is cultivated primarily for its edible seeds, which contain high amounts of oil, protein, carbohydrates, phenolics, polyphenols, vitamins, and macro minerals[1]. The unique seed production process of peanuts involves the flowers aerially and then the fertilized ovaries elongate and stretch downward into the soil via specialized organs known as pegs or gynophores[2,3]. The peg serves as a specialized, positively geotropic tube-like structure that is critical for reproduction, pod formation, and ultimately determining peanut yield. Understanding the molecular mechanisms governing peg development is therefore essential for enhancing peanut crop productivity.
The insertion of peanut pegs into soil is affected by various factors, including hormonal signaling, light exposure, mircoRNA, as well as environmental conditions[4−6]. Several key hormones like auxin, ethylene, and cytokinin, which play crucial roles in plant gravity responses, are implicated in regulating peg development in peanuts; for instance, the growth rate of pegs and the process of gravity stimulation are affected by the asymmetric distribution of auxin[7,8]. Auxin produced in the peanut peg tip region is distributed basipetally in a polar manner to assist gravitropism[3,9]. Conversely, ethylene generally acts antagonistically to auxin, showing a strong correlation during peg gravitropism[3,10]. Other phytohormones, such as abscisic acid (ABA) and gibberellins (GAs), contribute to the growth and development of peanut pegs[10−12]. Although a connection between hormones and peg development has been established in peanut, the precise molecular mechanisms governing this process remain poorly understood.
In multicellular organisms, cells perform discrete functions by enacting cell type-specific gene regulation, and the development of high-throughput single-cell RNA sequencing (scRNA-seq) based analyses have greatly facilitated the examination of individual cell behaviors in plant cell atlases. For instance, in 2019, a single-cell transcriptome atlas of Arabidopsis seedling roots was created by several research groups independently[13−17]. High-throughput scRNA-seq has been widely applied to define cell identity, reconstruct developmental trajectories, and decipher gene regulatory networks in different crop plants, including maize, rice, tobacco, peanut, and cassava[18−23]. Previously, we described the transcriptome landscape at the single-cell level in peanut leaf blades and identified AHL23 (AT-HOOK MOTIF NUCLEAR LOCALIZED PROTEIN 23) as a positive regulator of plant growth and development[24], and subsequently used scRNA-seq to demonstrate that FATTY ACID DESATURASE 2(FAD2) mutation repressed leaf growth and cell differentiation by regulating hormone pathways in peanut[25]. More recently, simultaneous profiling of the transcriptome and chromatin accessibility in the same individual cell was performed using fluorescence-activated sorted single nuclei in peanut leaves, providing novel biological insights into the dynamic processes of cell development at the cellular level[26]. In peanut, pegs initially develop from elongation of meristematic cells located in the basal ovary, following which the budding ovary grows horizontal to the soil surface to form subterranean pods. Thus, given the involvement of cell growth and differentiation in pegging, scRNA-seq emerges as a valuable tool to explore cell heterogeneity during peg development.
To elucidate the molecular mechanisms regulating pod formation in peanut, snRNA-seq expression atlases were constructed for both aerial and subterranean pegs at the single-cell level. Various key pathways and TFs were identified during the development of the peg differentiation pseudo-time trajectory. Several hormones and derivative levels were substantially altered between aerial and subterranean pegs, and further analysis indicated that auxin signaling participates extensively in gravity-regulated peg formation. Taken together, the present findings provide insights into the complex developmental regulation of pegs in peanut, and the dataset generated serves as a valuable resource for future investigations into the pegging process.
-
The peanut variety Hanghua2hao (HH2), developed by the Crops Research Institute of Guangdong Academy of Agriculture Science (GDAAS), Guangdong, China, was used as the experimental plant material. Aerial pegs were collected 3 d after aboveground peg elongation, while subterranean pegs were collected 2 d after soil penetration. Collected samples were harvested with liquid nitrogen and stored immediately at −80 °C.
The fluorescence-activated nuclei sorting (FANS) method was used to isolate and profile nuclei in both aerial and subterranean peanut pegs, and snRNA-seq was performed using a microfluidic technology platform (Fig. 1a). Briefly, approximately 1 g of fresh pegs was ground into a powder with liquid nitrogen. Extracted powder was then transferred into a 10 mL nuclei isolation buffer (5% dextran T40, 0.4 M sucrose, 10 mM MgCl2, 1 mM DTT, 100 mM Tris-HCl pH 7.4, 2 U/μL RNase inhibitor, 0.1% Triton X-100) and centrifuged at 300 g for 1 min, following which supernatants were filtered through miracloth (70 μm), and re-filtered through a 40 μm cell strainer (BD Falcon). After additional centrifugation at 2,000 × g for 5 min, the resulting pellet was resuspended in wash buffer (10 mL solution: 10 mM PBS, 1% BSA, 2 U/μL RNAase inhibitor). The nuclei solution was stained by DAPI (10 μM) and loaded on a flow cytometer (BD FACSAriaII) with a 70 μm nozzle (20 psi), after which the nuclei extraction concentration was adjusted to 1,000 cells/μL. SnRNA-seq libraries were constructed using Chromium Single-Cell 3' GEM (Gel Beads in-Emulsion) Library & Gel Bead Kit (v3), in accordance with the manufacturer's instructions. snRNA-seq libraries were sequenced using the paired-end mode of an Illumina sequencing platform.
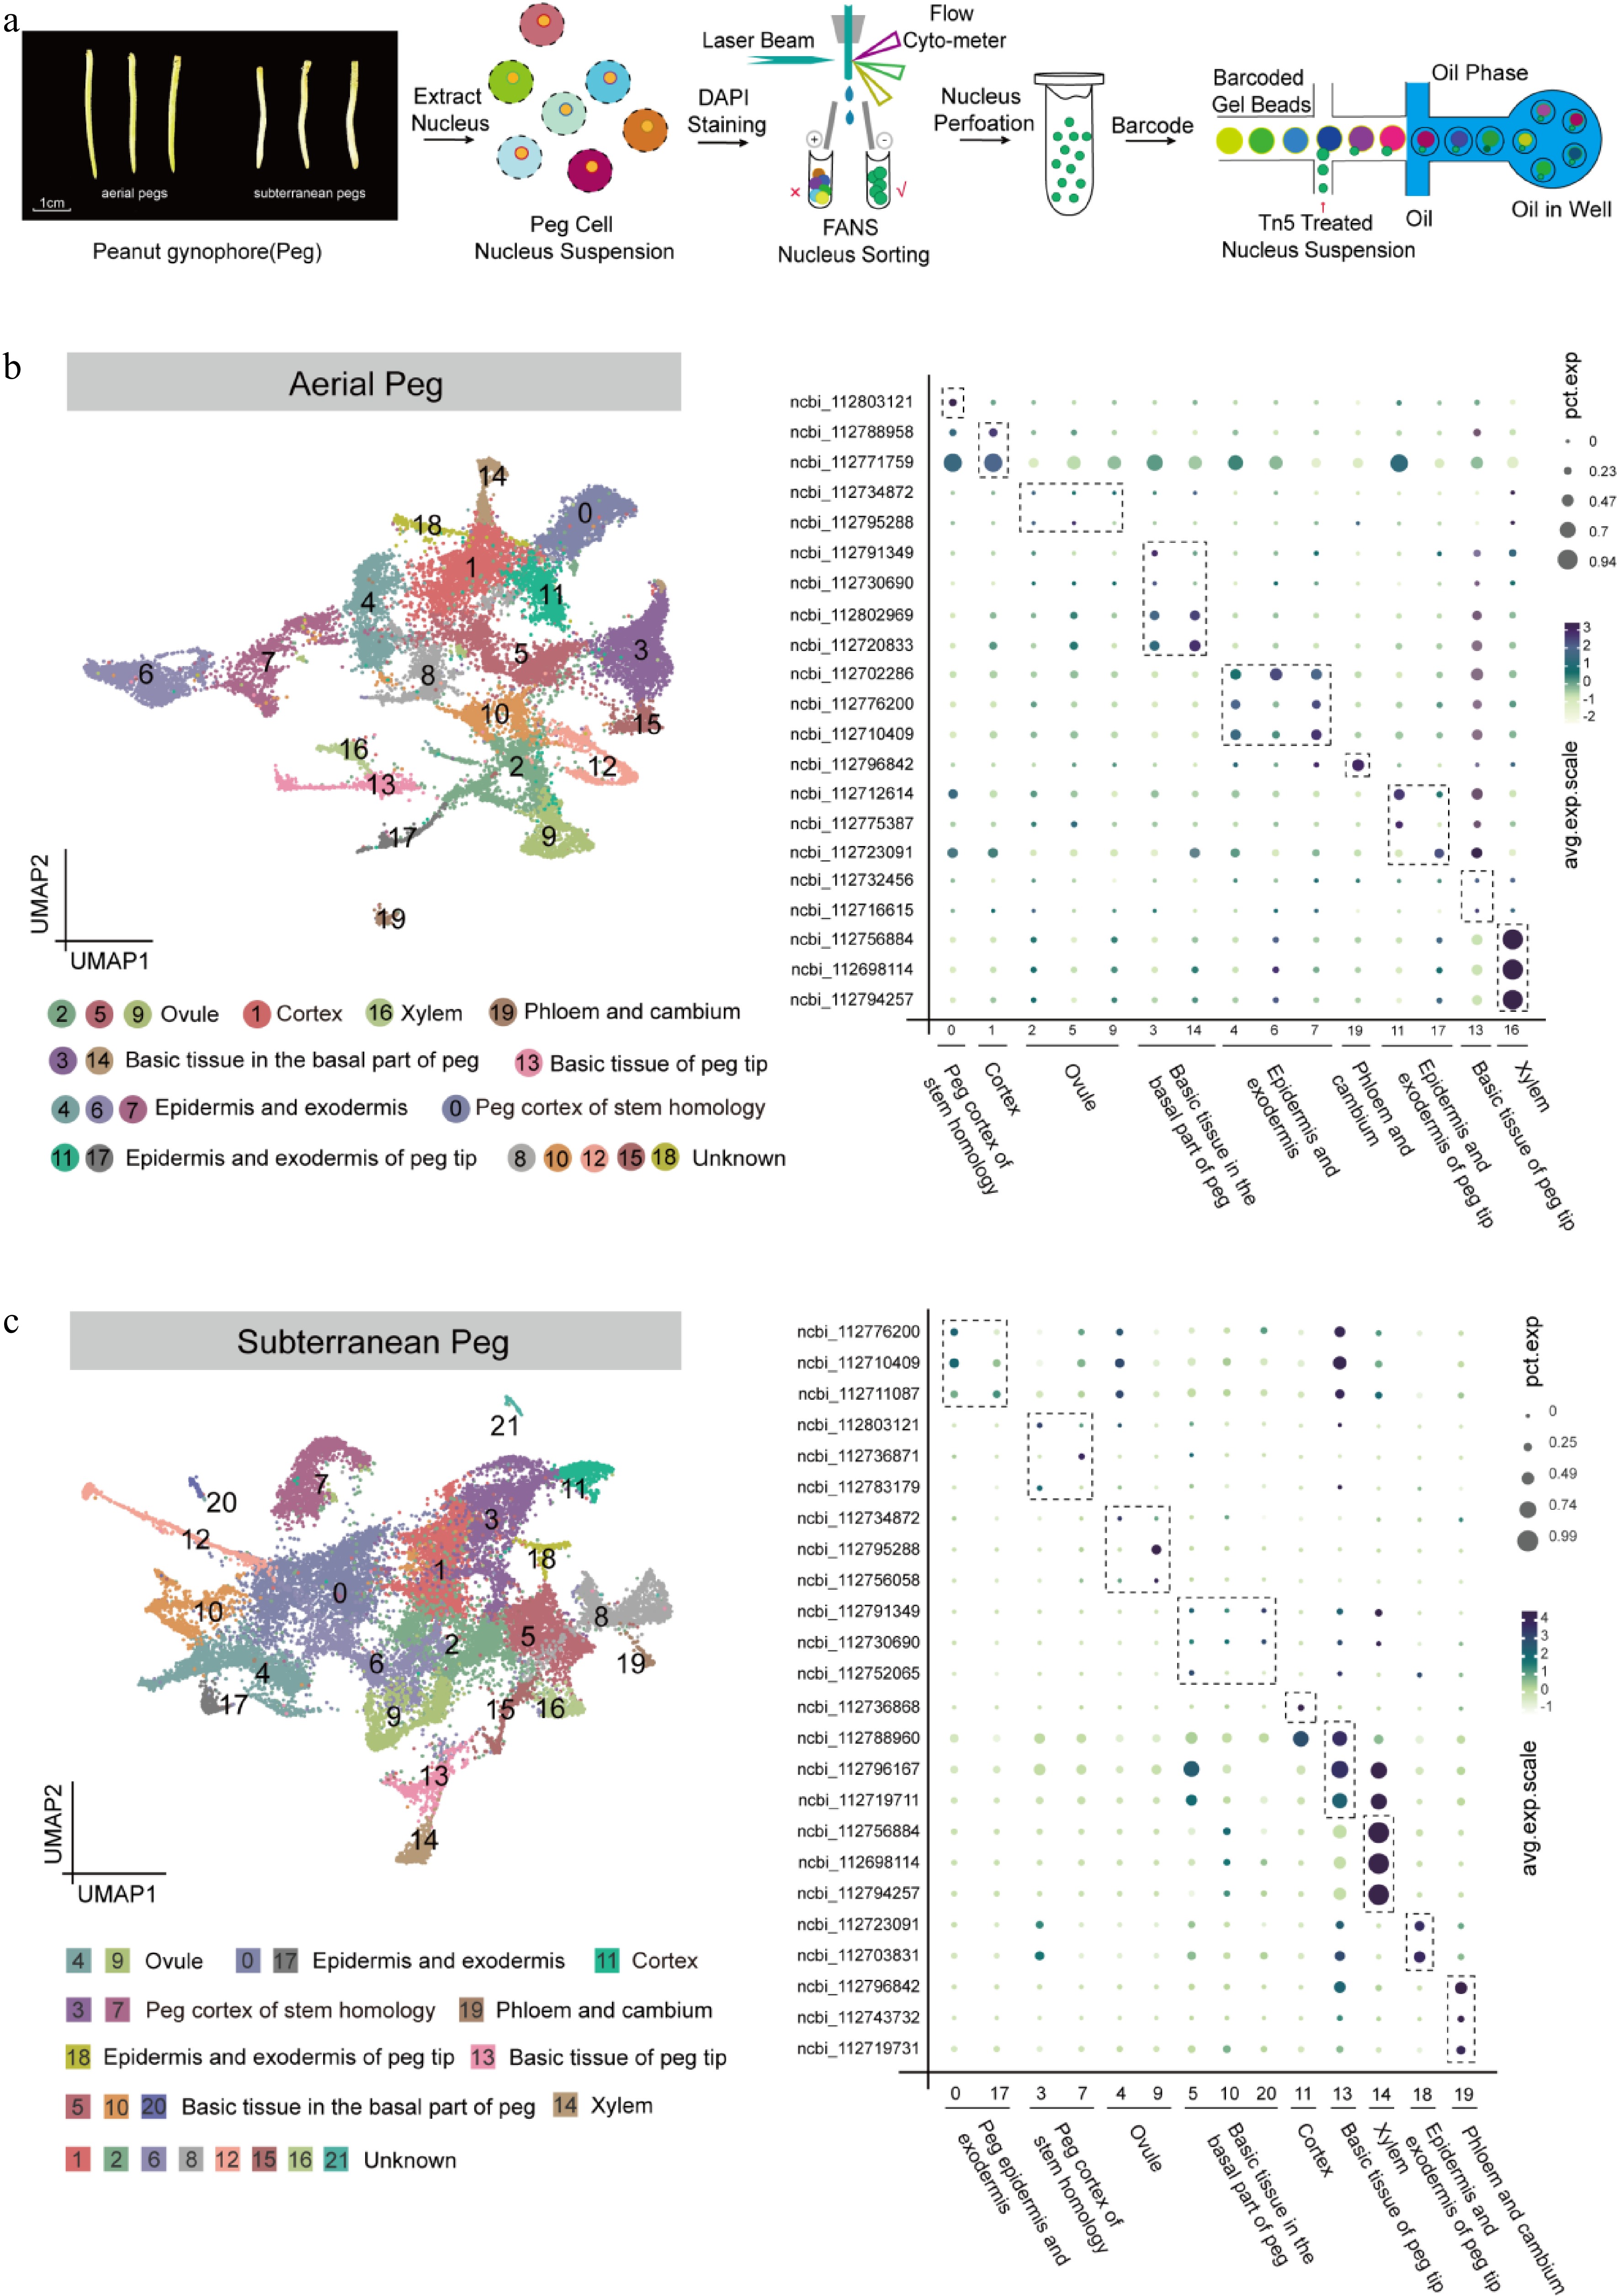
Figure 1.
Identification of cell types in aerial and subterranean pegs based on snRNA-seq. (a) Schematic overview of snRNA-seq experimental strategy based on 10× Genomics platform in aerial and subterranean pegs. Aerial pegs were collected 3 d after aboveground peg elongation, and subterranean pegs were collected 2 d after soil penetration. The nuclei solution was stained by DAPI (10 μM) and collected nucleus extraction concentration was adjusted to approximately 1,000 cells/μL, the single-nuclei suspensions were subsequently loaded onto 10× Genomics platform for snRNA-seq. (b) Uniform Manifold Approximation and Projection (UMAP) plot of 23,539 nuclei according to transcriptomic profiles in the aerial pegs. These nuclei were clustered in 20 different groups, and nine cell types were assigned based on the expression levels of cell marker genes. Each dot represents individual cell. (c) UMAP visualization identifying 22 putative cell clusters from 27,364 cells in subterranean pegs, comprising nine different cell types. Each dot denotes a single cell.
Pegs RNA extraction and bulk RNA sequencing
-
Bulk RNA sequencing was performed 3 d after aerial peg elongation and 2 d after peg penetration of the soil. Total RNA was extracted from each sample using the TRIzol reagent, in accordance with the manufacturer's instructions. Before library preparation, RNA concentration, purity, and integrity were verified using NanoDrop2000 and Agilent 2100 Nano. RNA-seq libraries were constructed following high-throughput Illumina string-specific RNA-sequencing library protocols and sequenced on the Illumina HiSeq platform using Gene Denovo Biotechnology Co., Ltd (Guangzhou, China). The sequencing libraries were constructed with Chromium Single Cell 3' Reagent Kits (v2), in accordance with the manufacturer's instructions. The final Single Cell 3' Libraries contained the P5 and P7 primers used in the Illumina bridge amplification PCR. Barcoded sequencing libraries were quantified using a standard curve-based qPCR assay (KAPA Biosystems, USA) and Agilent Bioanalyzer 2100 (Agilent, Loveland, CO, USA). Subsequently, library sequencing was performed using an Illumina HiSeq 4000 with a custom paired-end sequencing mode of 26 bp (read 1) × 98 bp (read 2). RNA-seq reads were obtained using the Trinity method, and the assembled reads were compared to the peanut genome.
Raw data from the Illumina platform were processed using in-house Perl scripts, after which clean reads were obtained by removing reads, including adapters, poly-N, or low-quality reads; thus, all downstream analyses were based on high-quality clean data. Gene expression levels were normalized using Fragments per kilobase of transcript per million mapped reads (FPKM) and quantified with RSEM software based on a counting table output from sequence assembly. Differential expression across samples was estimated using the R package DESeq. The expression matrix was imported into R (version 4.1.0) for differential gene expression analysis using the DESeq2 package (version 1.32.0), a method based on the negative binomial distribution. Genes with an adjusted p-value < 0.05 and a Log2 fold change (FC) ≥ |1| were considered differentially expressed.
In situ hybridization
-
Peg samples were collected 3 d after aerial peg elongation and 2 d after peg penetration of the soil. Tissues were subsequently rinsed with PBS and then immediately immersed in-situ hybridization fixative for fixation for more than 12 h. Subsequently, the fixed tissues were stored and transported at 4 °C. Following fixation, tissue blocks from the target area were cut with a thickness of approximately 3 mm in a fume hood. The sections underwent dehydration using a gradient of low to high alcohol concentrations, followed by transparency with xylene and embedding in wax.
Sections used for in situ RNA hybridization were boiled in sodium citrate buffer for 10−15 min, naturally cooled post-dewaxing and dehydration. Proteinase K was added, and the slides were then incubated at 37 °C for 30 min. This was followed by the addition of pre-hybridization solution and a 1-h incubation at 37 °C. Subsequently, the slides were transferred to the probe hybridization solution after discarding the pre-hybridization solution. The prepared slides were incubated at 42 °C for 3 h with a digoxin-labeled RNA probe, followed by thorough washing and signal detection. The sequences of the probes used in this study are detailed in Supplementary Table S1.
Single-nucleus transcriptome data analysis
-
Raw data from snRNA-seq were processed using the 10× Genomics software Cell Ranger ARC (v2.0), which converted the raw files into FASTQ files and aligned to the peanut genome (GCF_003086295 available at
www.peanutbase.org ). During quality control, Doubletfinder was used to calculate the probability of GEMs being doublets. Based on the relationship between the number of valid cells and the doublet rate, the doublet rates for samples were calculated, the doublet filtering threshold determined for each sample, and doublet filtering sequentially performed. Subsequently, single cells containing 500−6,500 identified genes were filtered, and single cells with a total UMI count below 15,000 were excluded. Knee plots and empty drop cutoffs were identified by the Cell Ranger filtering algorithms in aerial and subterranean pegs (Supplementary Fig. S1). Seurat was utilized as a clustering tool for snRNA-seq data, aiding cell clustering, quality control, and information extraction from snRNA-seq data. Harmony was employed for batch correction to generate t-distributed Stochastic Neighbor Embedding (t-SNE) and Uniform Manifold Approximation and Projection (UMAP). Both tools allocate cells in high- and low-dimensional spaces based on similar local neighborhoods. The Wilcoxon rank-sum test was used to identify markers for each cluster in the snRNA-seq and to reveal distinct accessibility within each cluster. For the identification of up-regulated DEGs, gene expression fold-changes of DEGs in divergent cell clusters were calculated using Log2FC (fold change). The threshold for upregulated DEGs was set as abs Log2FC > 0.25, p-value < 0.05.GO and KEGG pathway enrichment analyses were performed with Geneontology.org and Kyoto Encyclopedia of Genes and Genomes databases (
www.genome.jp/kegg/genome ). Monocle was used to construct a pseudo-time trajectory. Monocle reduces the space to one by two dimensions and orders the cells; once the cells were ordered, the trajectory was visualized in a reduced-dimensional space. The trajectory had a tree-like structure, including tips and branches. The cell pseudo-time trajectories were calculated using partition-based graph abstraction (PAGA). Key genes related to development and differentiation processes were identified by analyzing the DEGs associated with the developmental trajectory, cell differentiation state, and cell fate. DEGs sequences were aligned with the reference TAIR database to identify homologs in Arabidopsis and protein-protein interactions were analyzed using the STRING database and Cytoscape. RCircos was performed using the R package. For the chromosome backbone construction (circle a), the RCircos.Set.Core.Components function: set tracks.inside = 3 (three circles plotted within the chromosome), tracks.outside = 0, chr.exclude <− NULL, was used to plot all 20 chromosomes based on the peanut reference genome (fasta)[27]. For internal gene expression histogram plotting, the RCircos.Histogrom.Plot function was used, importing data with four columns: Chr, Start, End, Valve. parameter settings: data.col <− 4, side <− 'in'. Circle b, c, and d set data.track <− 1, 2, 3, respectively. The rest of the parameters were set as default[27].Quantification of phytohormones and their derivatives
-
Samples of aerial and subterranean pegs were collected 3 d after aboveground peg elongation and 2 d after peg penetration in the soil, respectively. All materials were frozen immediately in liquid nitrogen and ground into a powder. The levels of phytohormones and their derivatives were detected by Gene Denovo Biotechnology Co., Ltd. (Guangzhou, China) based on the ultra-performance liquid chromatography-tandem mass spectrometry (UPLC-MS/MS) platform as previously described[26]. In brief, powder (50 mg) of each sample was mixed with isotopic internal standards and extracted with 1 mL of an extraction solvent mixture (methanol : ultrapure water : formic acid = 15:4:1, v/v/v). The extraction solutions were concentrated and re-solubilized with 100 μL of 80% methanol, filtered through a 0.22 μm syringe membrane, and placed in the injection vial, qualitative and quantitative phytohormone and their derivatives profiles were subsequently examined with internal isotopic standards.
-
Pegs have a unique mechanism for embedding fertilized ovaries of flowers into the ground. To investigate the spatiotemporal regulation of gene regulatory networks during peg growth and development, single-cell RNA sequencing was performed in aerial and subterranean pegs in peanut. As a result, 23,539 and 27,364 cells were obtained in aerial and subterranean pegs with two replicates, respectively (Supplementary Table S2). A total of 20 clusters (0−19), and 22 clusters (0−21) were identified and subsequently visualized using uniform manifold approximation and projection (UMAP) algorithm and t-distributed Stochastic Neighbor Embedding (t-SNE) (Fig. 1b, c; Supplementary Fig. S2).
For aerial pegs, data quality control indicated that a median of 2,270 filtered UMI and 1,775 genes were distributed in each cell type (Supplementary Fig. S3). The cell types were then annotated based on the expression levels of cell marker genes[24,28], in situ hybridization, and the correlation between two cell clusters calculated to further annotate the cell types (Supplementary Figs S4, S5). For example, clusters 2, 5, and 9 were designated as ovule, since ncbi_112734872 and ncbi_112795288, the marker genes of ovule cells[28], were preferentially expressed in clusters 2, 5, and 9 (Fig. 1b). Cluster 16 belonged to xylem since several marker genes were highly expressed, including ncbi_112756884, ncbi_112698114, and ncbi_112794257 (Fig. 1b)[28]. ncbi_112702286, ncbi_112776200, and ncbi_112710409 were proven to be epidermis and exodermis marker genes[28], predominantly represented in clusters 4, 6, and 7 (Fig. 1b). In summary, nine cell types were assigned in aerial pegs, including ovule (clusters 2, 5, and 9), cortex (cluster 1), xylem (cluster 16), basic tissue in the basal part of the peg (clusters 3, and 14), basic tissue of the peg tip (cluster 13), epidermis and exodermis (clusters 4, 6, and 7), peg cortex of stem homology (cluster 0), epidermis and exodermis of the peg tip (clusters 11, and 17), phloem and cambium (cluster 19) (Fig. 1b). A similar strategy was applied to assign cell identities to 22 clusters in subterranean pegs, and nine cell types were successfully annotated (Fig. 1c). To confirm the cell type annotation, RNA in situ hybridization was conducted in aerial and subterranean pegs, and corresponding signals were observed in different cell type, such as xylem, phloem, epidermis, and exodermis (Supplementary Fig. S5). Overall, the transcriptional maps for both aerial and subterranean pegs were established at a single-cell resolution.
Key TFs identification during aerial pegs development
-
A UMAP was generated for peanut aerial pegs based on the identified cell types excluding unknown cell types (Fig. 2a). The snRNA-seq dataset enabled exploration of the differentiation trajectory of a developmental process at the single-cell level; therefore, to investigate cell developmental patterns of the aerial peg and dissect the spatial and temporal distribution of the identified cells, a pseudo-time trajectory was constructed, revealing the developmental process consisted of 11 differentiation states (Fig. 2b). Subsequently, a total of 7,086 proposed pseudo-time differentially expressed genes (DEGs) were identified that could potentially determine the differentiation trajectory (Supplementary Table S3, Supplementary Fig. S6). Additionally, partition-based graph abstraction (PAGA) was used to arrange the low-dimensional projection positions of cells based on the similarity and dynamic change characteristics of gene expression patterns[29], which show both the positional relationship of each cell in two-dimensional space and the trajectory of cell development (Fig. 2c). Furthermore, a total of 1,052 key genes related to the development and differentiation process were identified by analyzing the overlapping DEGs in cell trajectories, cell state, cell fate, and PAGA (Supplementary Table S4, Supplementary Fig. S6). TF interactions play a pivotal role in regulating changes in gene expression patterns during plant growth and development, and 87 TFs were identified from the 1,052 overlapping DEGs (Fig. 2d).
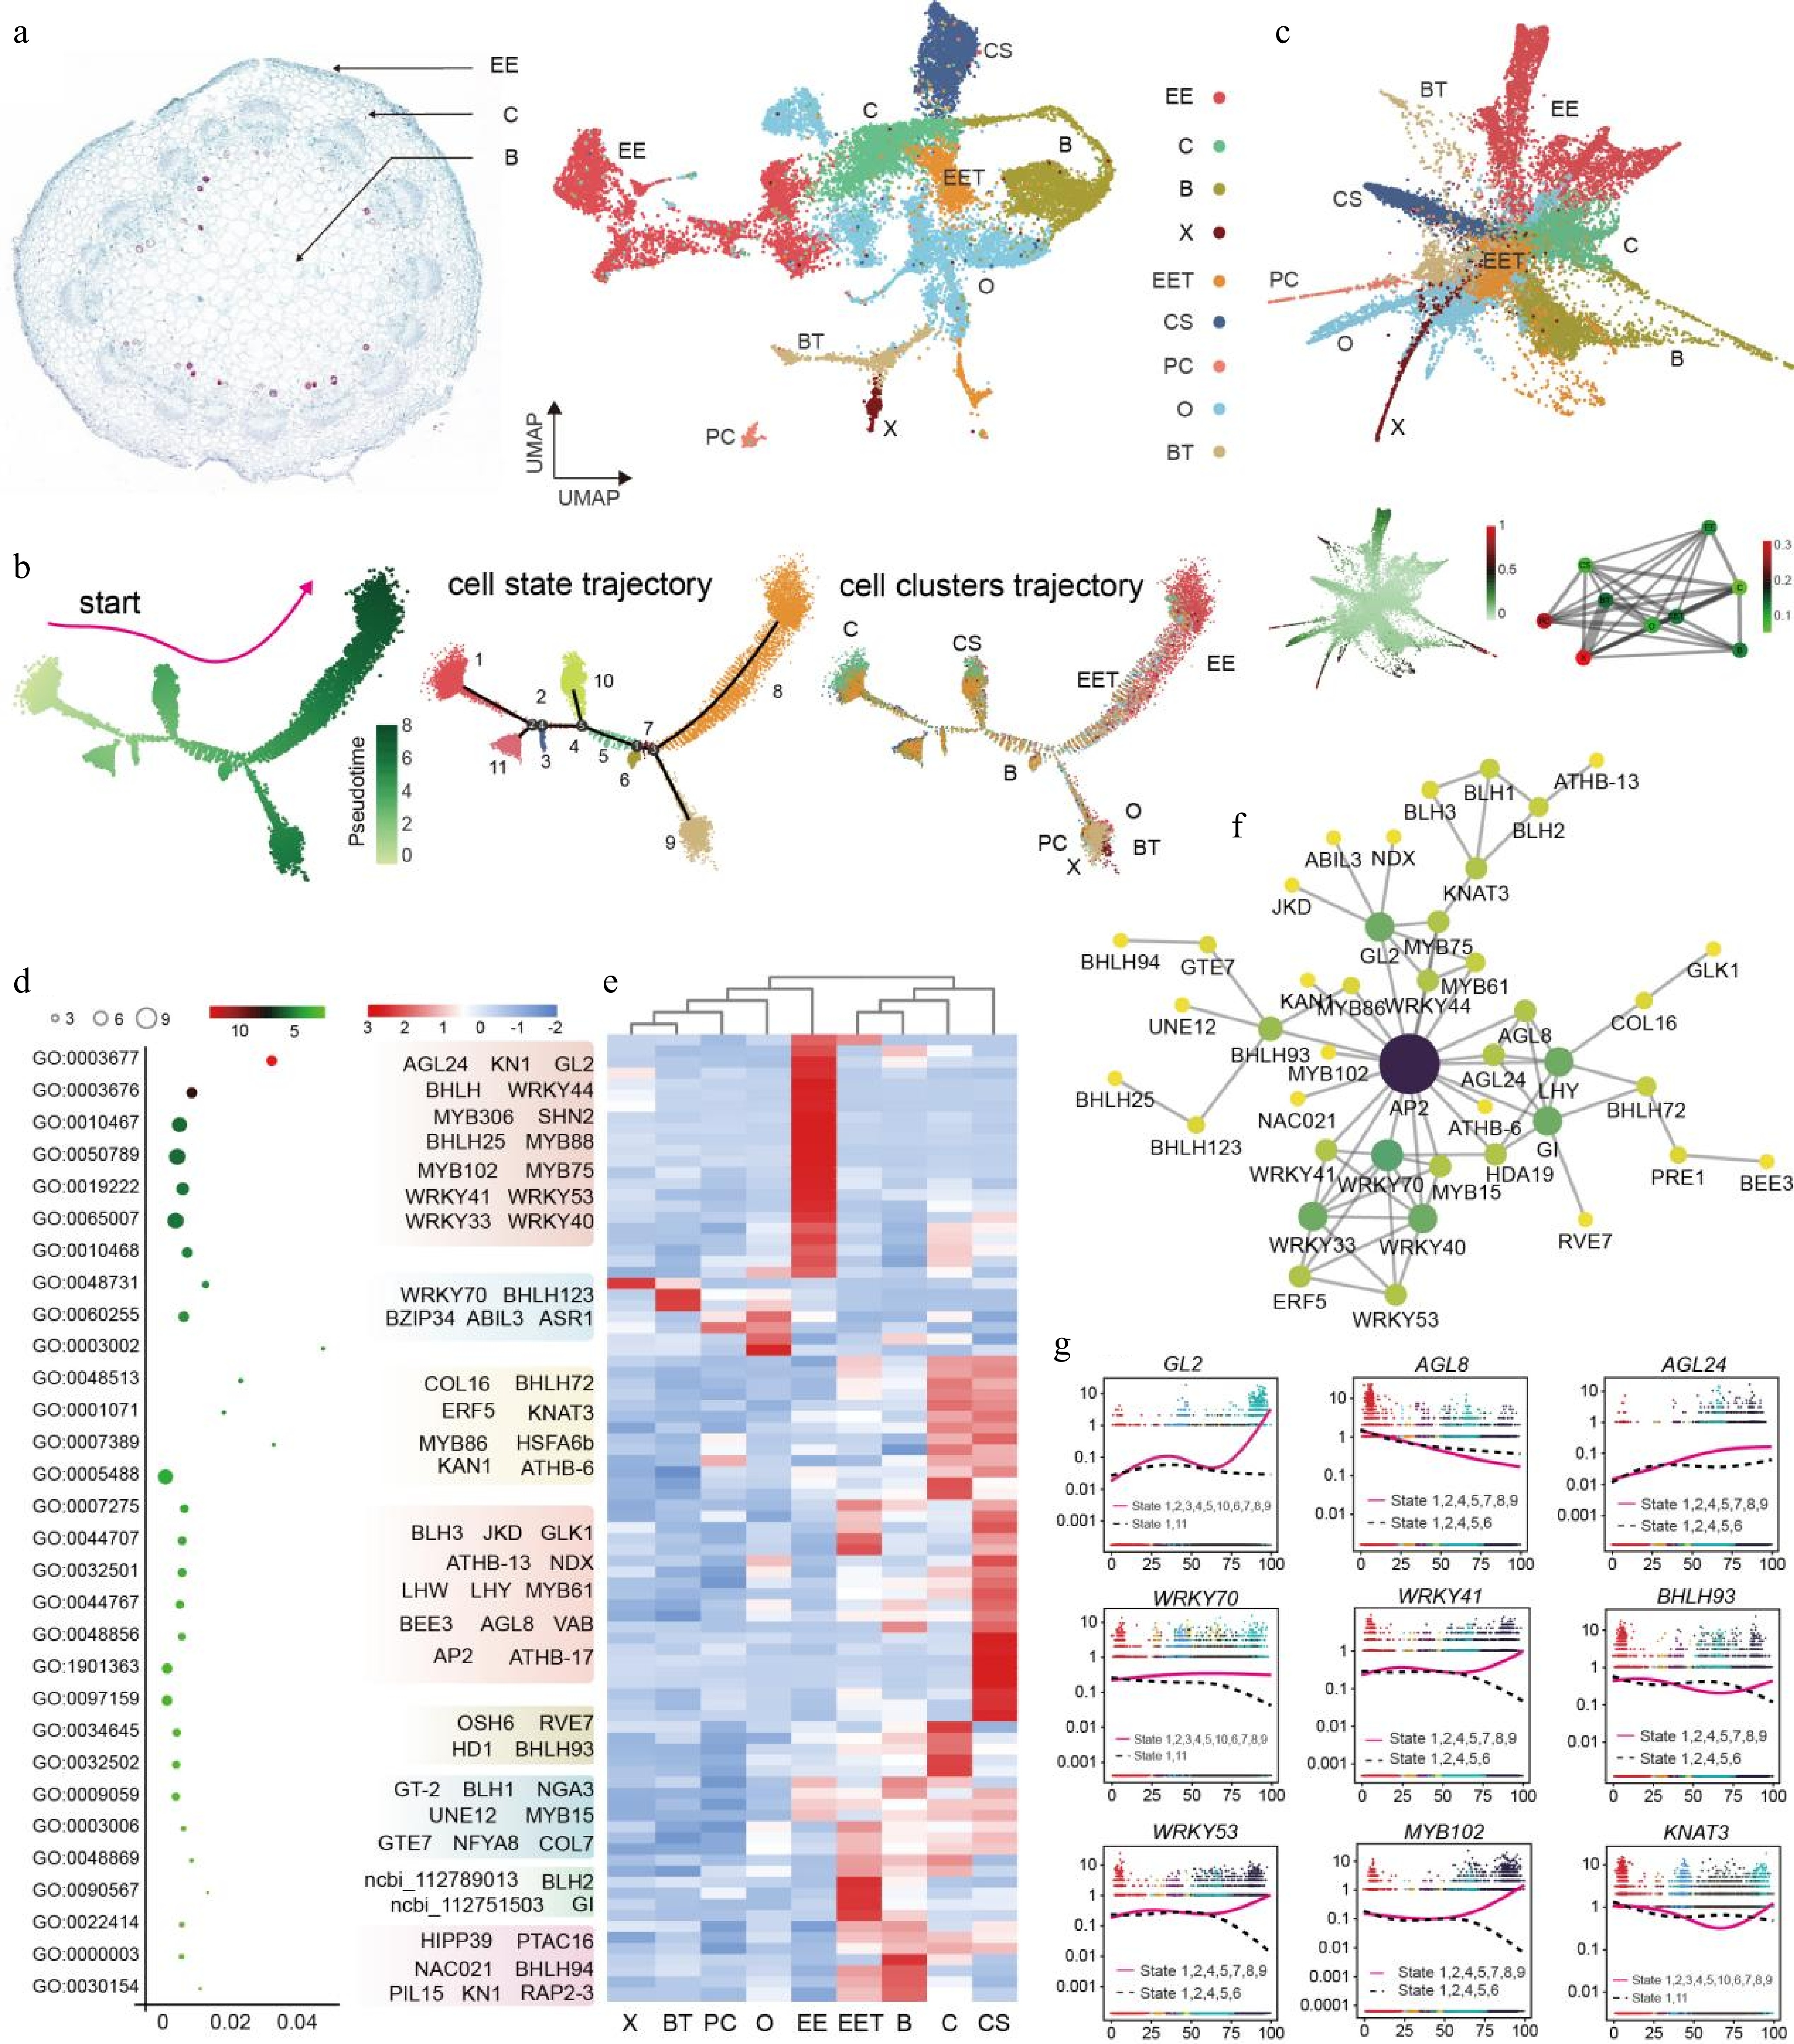
Figure 2.
Construction of differentiation trajectories and identification of key TFs in peanut aerial pegs. (a) UMAP visualization of nine identified cell types in aerial pegs. O, Ovule; EE, Epidermis and exodermis; B, Basic tissue in the basal part of peg; CS, Peg cortex of stem homology; C, Cortex; EET, Epidermis and exodermis of peg tip; BT, Basic tissue of peg tip; X, Xylem; PC, Phloem and cambium. (b) Distribution of cells in each cluster along with aerial peg pseudo-time trajectory analyzed by Monocle 2. Each dot indicates a single cell. Color bar 0−8 represents pseudotime level. (c) Partition-based graph abstraction (PAGA) trajectory of aerial pegs. (d) Gene Ontology (GO) enrichment analysis and heatmap displaying the expression patterns of 87 core TFs in the different cell types identified in aerial pegs; GO terms are represented by circles, with circle size proportional to the number of genes. For the heatmap, each row represents a gene and each column represents cell type. (e) Expression profiling of 87 core TFs cross different cell types in aerial pegs. X, Xylem; BT, Basic tissue of peg tip; PC, Phloem and cambium; O, Ovule; EE, Epidermis and exodermis; EET, Epidermis and exodermis of peg tip; B, Basic tissue in the basal part of peg; C, Cortex; CS, Peg cortex of stem homology. (f) Construction of predicted interaction network of identified regulatory TFs based on their homologs in the Arabidopsis genome. (g) Expression patterns of nine TFs in the differentiated state. The pink solid and dashed lines in the diagrams represent the expression patterns of the gene along different developmental trajectories.
Gene Ontology (GO) enrichment analysis indicated that TFs were largely assigned to separate categories, including biological processes and molecular functions (Fig. 2d), and a heatmap of 87 TFs revealed that some were highly expressed in specific cell types (Fig. 2e). For example, several Myeloblastosis (MYB) gene family members, such as MYB75 and 102, were highly expressed in the epidermis and exodermis (EE) compared to other cell types (Fig. 2e), whereas other MYB genes, such as MYB61, was highly expressed in the peg cortex of stem homology (CS) (Fig. 2e). The TF regulatory interaction network was further used to group 42 core TFs to uncover gene-to-gene correlations, with results suggesting that APETALA2/ETHYLENE RESPONSIVE FACTOR (AP2/ERF, ncbi_112748547) might play an essential role in the TF-mediated regulation of aerial plant development (Fig. 2f). Previous studies have shown that AP2/ERF is extensively involved in hormonal and stress responses in different plant species[30,31]. Nine genes with high connectivity were selected from the network and found to potentially play significant roles in aerial peg growth and development, such as GLABRA2 (GL2), AGL8, WRKY41, 53, and 70 (Fig. 2g). In summary, the key regulators during the pseudo-time trajectory of aerial peg differentiation were investigated and the TF matrix was identified as a possible resource for understanding the transcriptional dynamics during aerial peg development.
Construction of development differentiation pseudo-time trajectory for subterranean pegs
-
Next, a pseudo-time developmental trajectory was constructed for subterranean pegs (Fig. 3a), with 4,830 DEGs identified as potentially being involved in the development of the differentiation trajectory (Supplementary Table S5). Developmental differentiation pseudo-time trajectories for the various identified cell types were also analyzed in the subterranean pegs, including the epidermis and exodermis of the peg tip, peg cortex of stem homology, and xylem (Fig. 3b; Supplementary Fig. S7). KEGG enrichment analyses were performed for the DEGs, as this provided insight into the molecular functioning of peanut subterranean peg developmental processes. KEGG enrichment analysis of the 4,830 DEGs indicated that biosynthesis of secondary metabolites, fatty acid degradation, and flavonoid biosynthesis pathways were enriched (Supplementary Fig. S8).
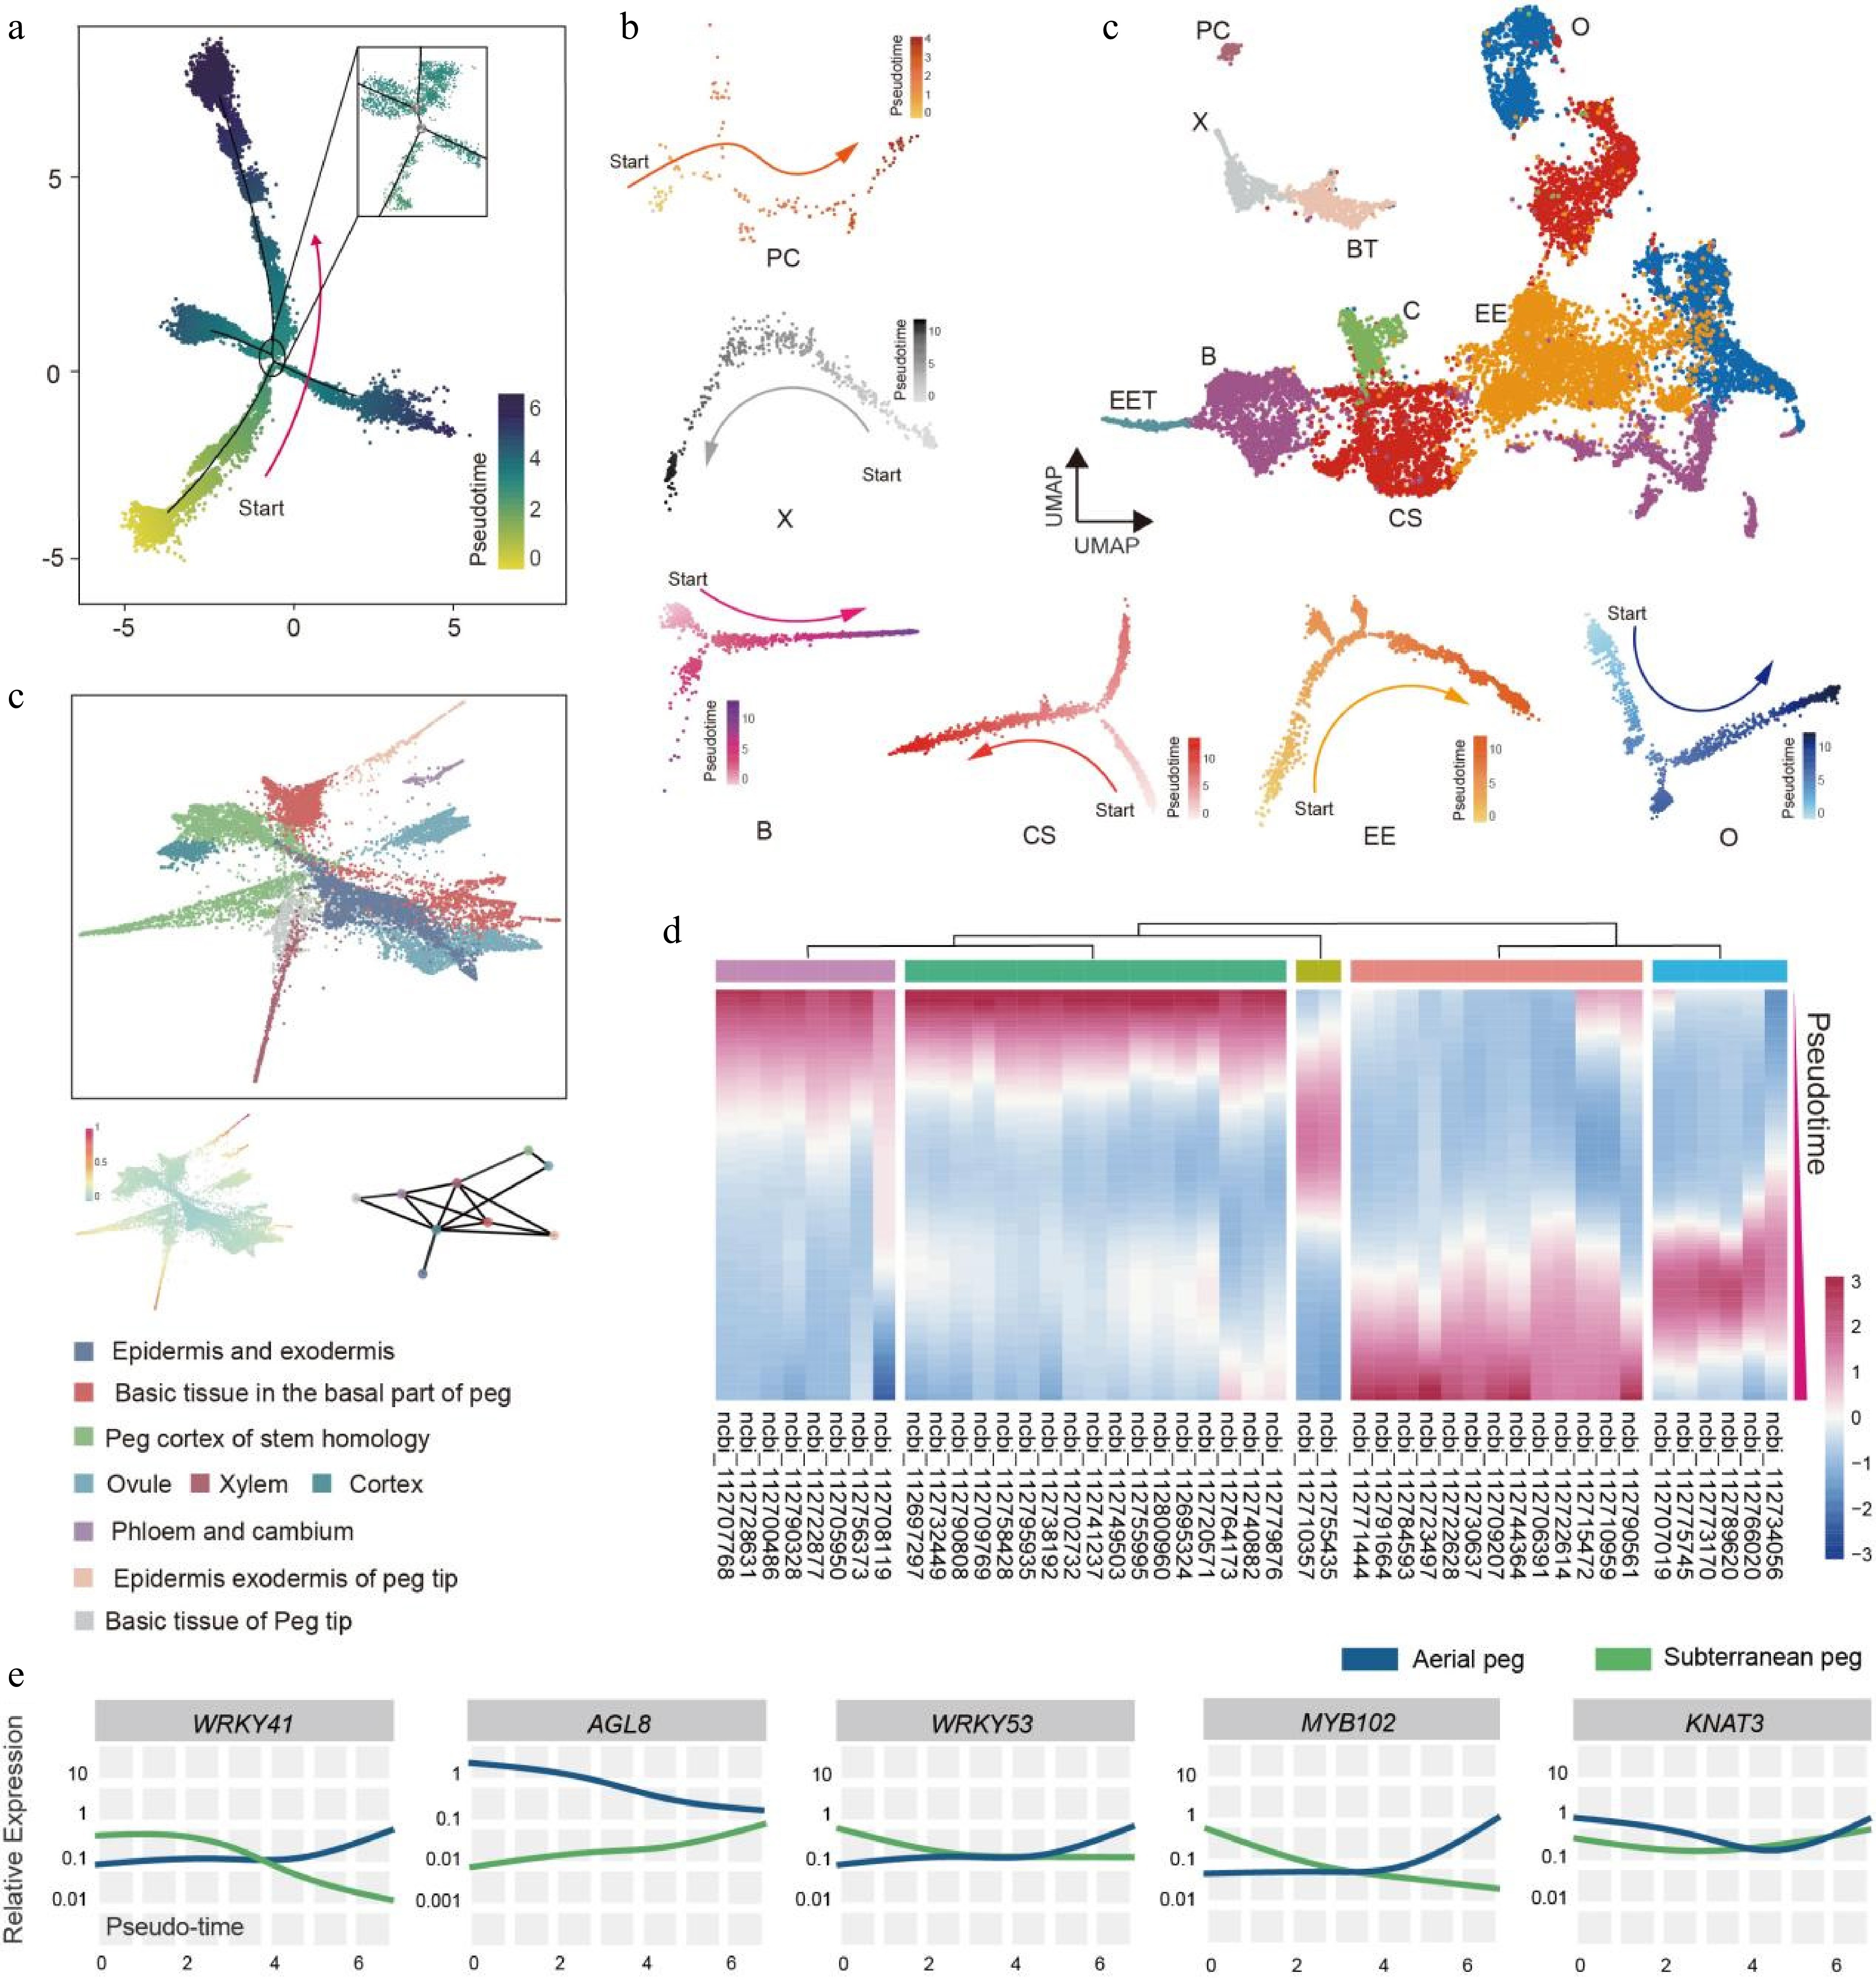
Figure 3.
Construction of differentiation pseudo-time trajectory for subterranean pegs. (a) Development differentiation pseudo-time trajectory of peanut subterranean pegs analyzed by Monocle 2. Each dot represents a single cell. (b) Differentiation trajectory of identified subterranean pegs cell types. O, Ovule; EE, Epidermis and exodermis; B, Basic tissue in the basal part of peg; CS, Peg cortex of stem homology; C, Cortex; EET, Epidermis and exodermis of peg tip; BT, Basic tissue of peg tip; X, Xylem; PC, Phloem and cambium. (c) PAGA trajectory of differentiation in subterranean pegs. (d) Clustering and expression kinetics of 46 TFs along the cell differentiation trajectory. (e) Expression patterns of five TFs along the development differentiation pseudo-time trajectory in aerial and subterranean pegs.
To estimate the effectiveness of the pseudo-time differentiation trajectory, PAGA was used to validate the correlation between distinct cell clusters in the subterranean peg development trajectory map, and analyses of cell state and cell fate during subterranean peg differentiation were performed (Fig. 3c, Supplementary Fig. S9). A total of 579 DEGs were identified by cross-comparing cell trajectories, cell state, cell fate, and PAGA. Among these, 42 crucial TFs were highlighted in the interaction network, indicating their significant role in transcriptional dynamics (Supplementary Fig. S9, Supplementary Table S6). The clustering and expression kinetics of TFs along the cell differentiation trajectory were also examined (Fig. 3d; Supplementary Fig. S10); notably, several TFs were found to be involved in both aerial and subterranean peg development differentiation pseudo-time trajectories, including WRKY41, 53, AGL8, MYB102, and KNAT3 (Fig. 3e), and most of TFs displayed distinct expression pattern between aerial and subterranean peg developmental trajectory (Fig. 3e). The differences in TF expression between the two types of pegs may represent further clues about the molecular mechanisms underlying aerial and subterranean pegs growth and development. Moreover, by combining datasets from both aerial and subterranean pegs, three potential lineages of differentiation and development trajectories were identified through slingshot analysis (Supplementary Fig. S11a & b). Meanwhile, a pseudotime trajectory analysis of nine cell types in aerial and subterranean pegs was conducted to demonstrate the changes in different cell types during peanut growth (Supplementary Fig. S11c).
Integration of single-cell and bulk transcriptome to construct the gene regulatory network (GRN) during peg development
-
To define expression changes at the global and cellular levels, bulk RNA-seq analysis was performed for both aerial and subterranean pegs (Supplementary Fig. S12), and the expression levels of the identified genes were anchored onto the chromosomes (Fig. 4a). By integrating snRNA-seq with bulk RNA-seq for differential expression genes (DEGs) analysis, a series of genes cross various cell types were identified, including DAO, SUMM2, and EXPA11 (Fig. 4b). Notably, DAO impacted anther dehiscence, pollen fertility, and lemma/palea opening in rice[32]; in peanut, the homologous gene was significantly upregulated in the ovule of the peg, the peg epidermis, and the exodermis of fruiting needles (Fig. 4b), indicating that DAO may play potential role in the development of fruiting needles in peanut plants. Moreover, AtDAO1 and AtDAO2 were also found to play facilitating roles in the development of reproductive organs in Arabidopsis[33].
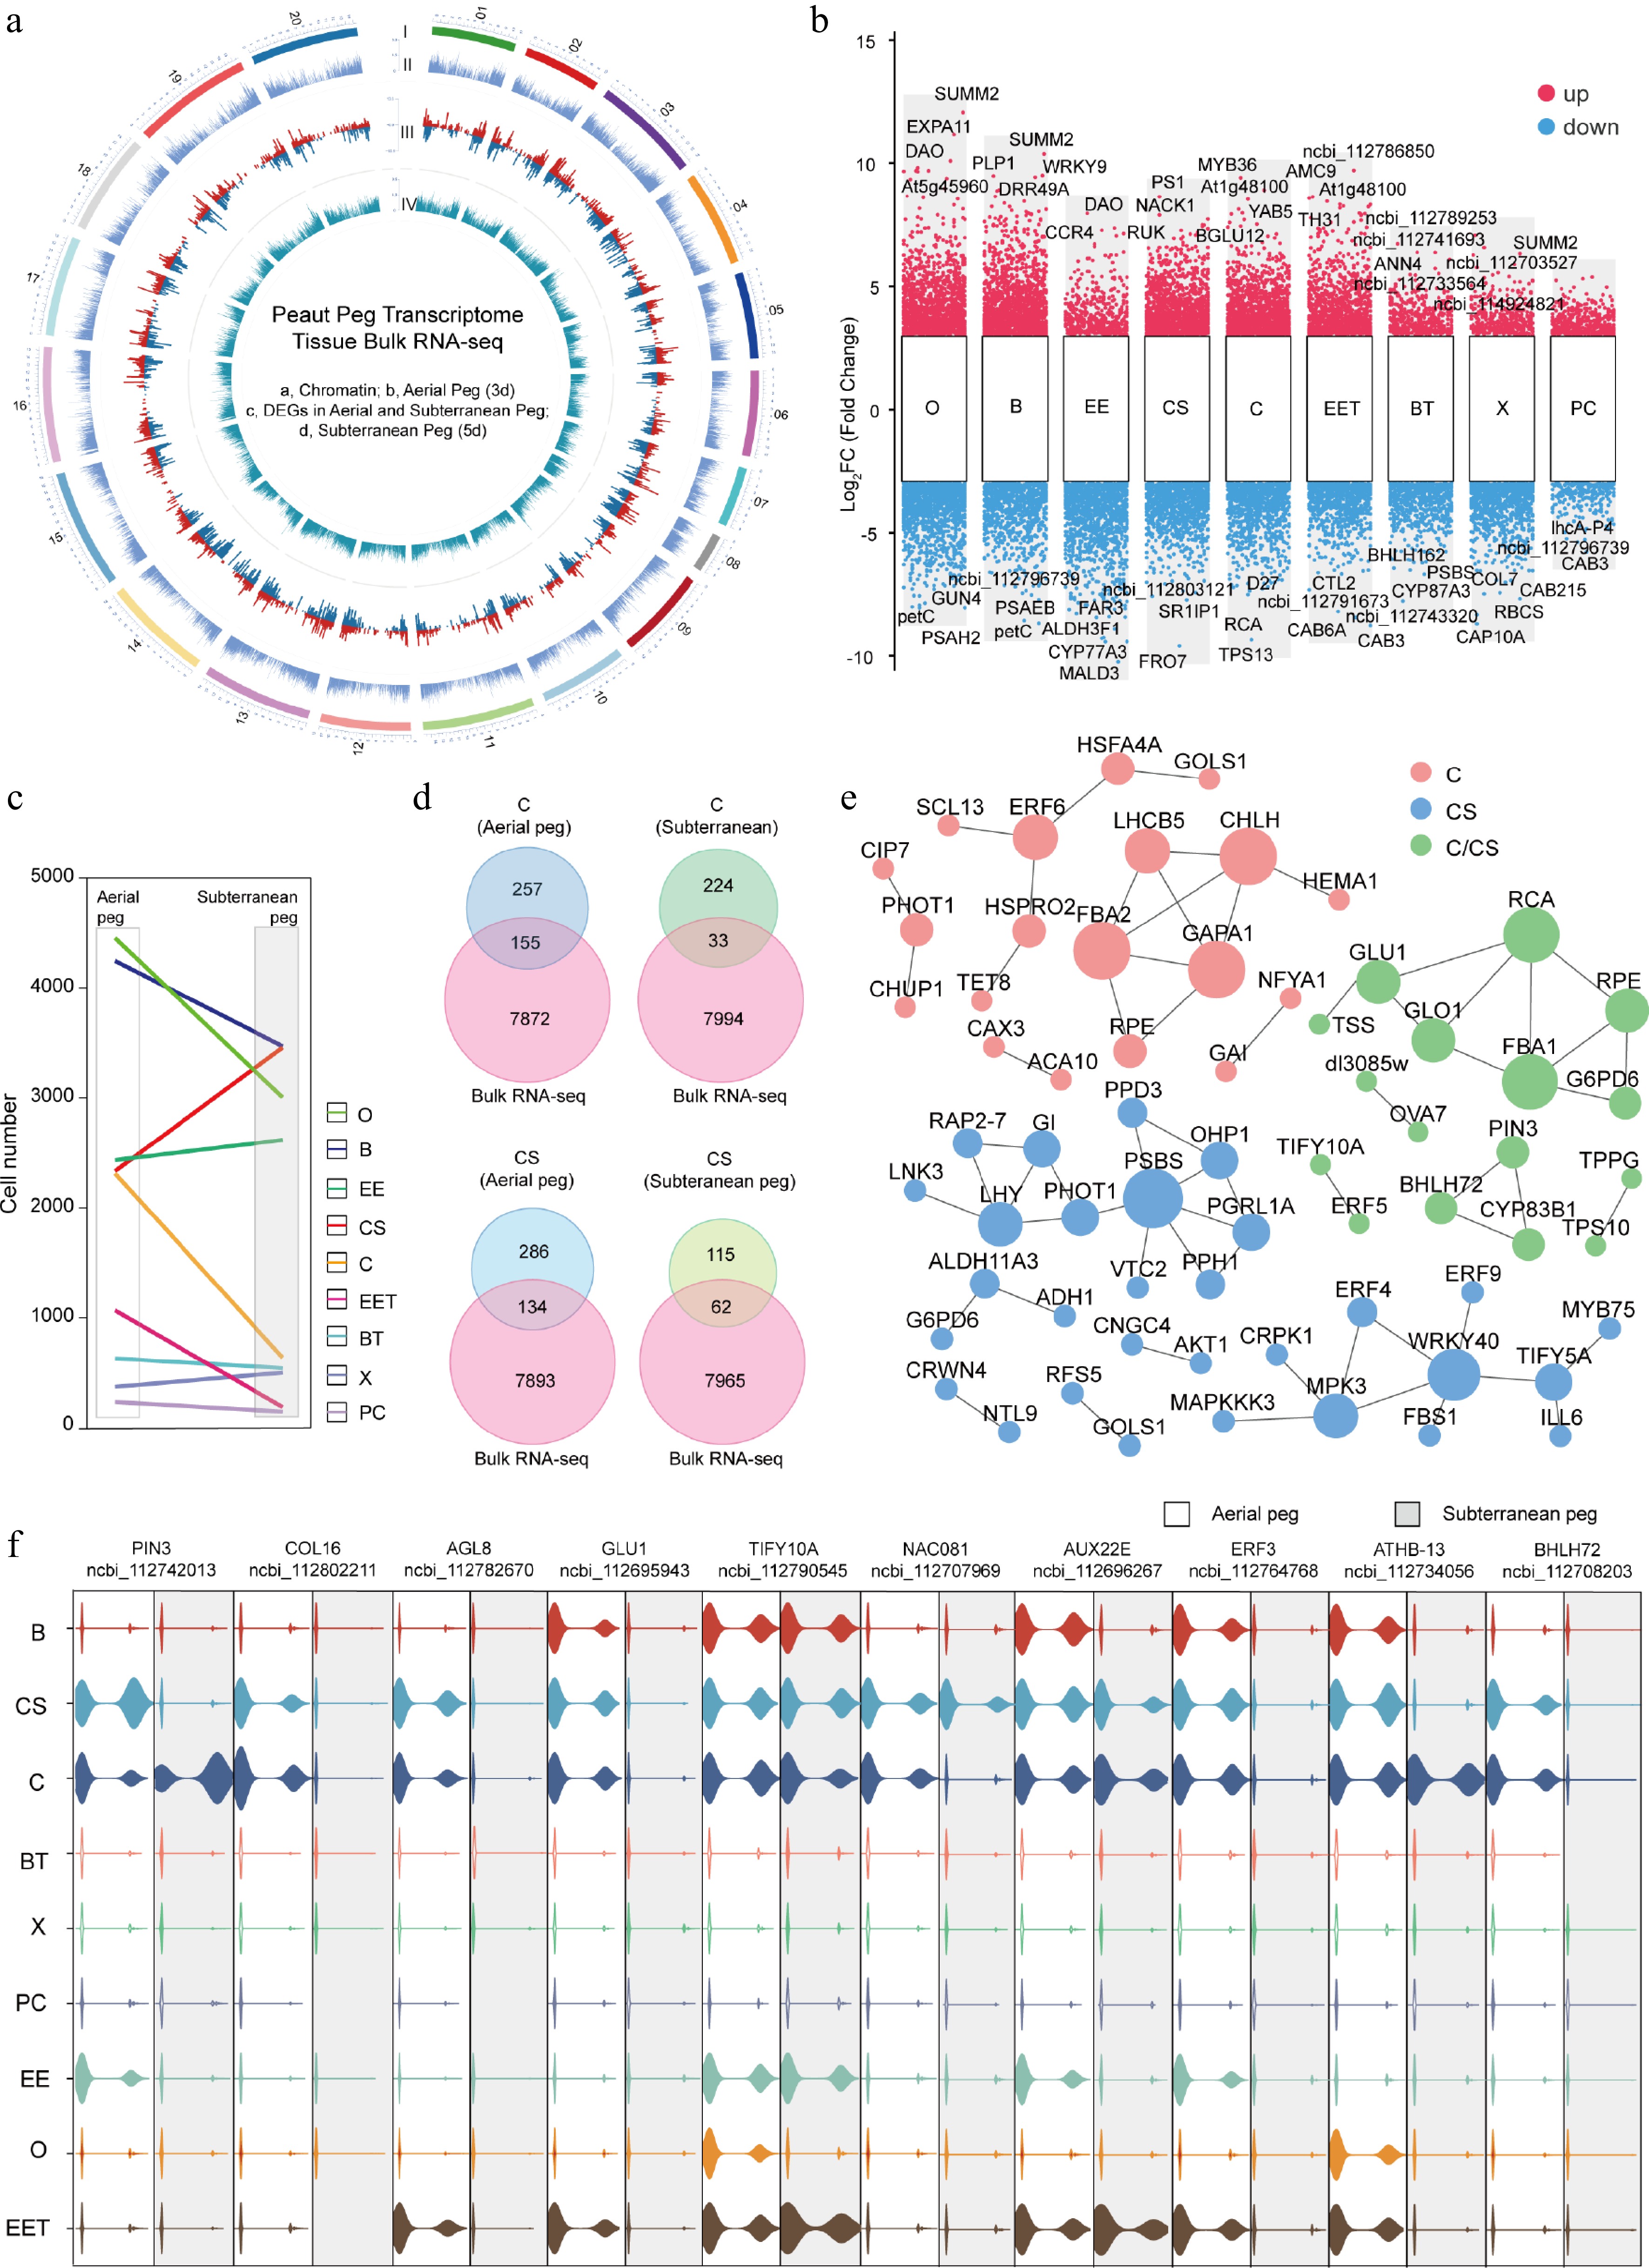
Figure 4.
Integrated analysis of single-cell and bulk transcriptome in aerial and subterranean pegs. (a) Circular map of gene expression atlas in aerial and subterranean pegs based on bulk transcriptome analysis. I, Outer circle, peanut genome 20 chromosome distribution; II, second circle, all identified expressed genes in aerial peg by bulk transcriptome; III, third circle, bulk RNA-seq identified DEGs between aerial and subterranean pegs; IV, inner circle, all identified expressed genes in subterranean pegs by bulk transcriptome. (b) Up- and down-regulated DEGs identified by snRNA-seq and bulk RNA-seq in various cell types. (c) Frequencies of the different cell types in aerial and subterranean pegs. (d) Venn diagram showing DEGs in cortex of stem homology (CS) and cortex (C) cells between aerial and subterranean pegs. (e) DEGs from aerial and subterranean pegs cortex of stem homology and cortex cells comprised a regulatory predicted interaction network. (f) Violin plots showing the relative expression level of potential key DEGs between aerial and subterranean pegs. O, Ovule; EE, Epidermis and exodermis; B, Basic tissue in the basal part of peg; CS, Peg cortex of stem homology; C, Cortex; EET, Epidermis and exodermis of peg tip; BT, Basic tissue of peg tip; X, Xylem; PC, Phloem and cambium.
KEGG analysis categorized these DEGs related to various biological processes (Supplementary Fig. S13), for example, pathways Ko00195 (photosynthesis), and Ko01110 (biosynthesis of secondary metabolites) were significantly downregulated during peg development (Supplementary Fig. S13). Notably, KEGG categorization revealed the presence of many DEGs related to Ko04075 (plant hormone signal transduction), which were upregulated throughout the peg development (Supplementary Fig. S13), suggesting that the phytohormone signal may be involved in the process of aerial peg growth toward the ground and subsequent penetration into the soil, triggering development of the subterranean peg.
To characterize the changes in gene expression patterns across different cells, the frequencies of various cell types obtained through snRNA-seq were compared. The results showed that during peg development, the number of cells in the peg cortex cluster was significantly reduced. In contrast, the cell number stem homology peg cortex cluster was notably increased (Fig. 4c). Therefore, bulk transcriptome was used to compare DEGs between the aerial and subterranean peg cortex cells, 155 and 33 DEGs were identified by comparing snRNA-seq and bulk RNA-seq in cortex cells of aerial and subterranean pegs (Fig. 4d), an additional 134 and 62 DEGs were identified in the cortex of stem homology in both aerial and subterranean pegs, respectively (Fig. 4d). The DEGs involved in the predicted interaction network were probably dedicated to the transcription dynamics during cortex differentiation (Fig. 4e). Several potential key DEGs exhibited distinct expression patterns in various cell types between aerial and subterranean pegs. For example, expression of the auxin efflux regulator PIN3 in the cortex of stem homology was higher in aerial pegs compared to subterranean pegs (Fig. 4f). NAC081 (ncbi_112707969) exhibited high expression levels specifically in the cortex of stem homology (CS), whereas its expression in the cortex (C) was significantly downregulated in subterranean pegs compared to their aerial counterparts (Fig. 4f). Additionally, ncbi_112708203, an ortholog of bHLH72, displayed elevated expression in the CS and C of aboveground pegs, with a marked reduction observed in subterranean (Fig. 4f). In summary, the simultaneous profiling of single-cell and bulk transcriptomes revealed the key regulators of cortical differentiation in peanut pegs.
Comparison of transcriptomic atlases of aerial and subterranean pegs reveals key regulators of cell differentiation
-
Gravitropic aerial pegs grow downward and ultimately penetrate the soil to form subterranean pods. To explore the molecular mechanisms underlying peg development, bulk RNA-seq and snRNA-seq DEG profiles between aerial and subterranean pegs were compared, a total of 3,436 DEGs (1,422 upregulated and 2,014 downregulated genes, Fig. 5a; Supplementary Table S7) were identified. Subsequently, 289 TFs potentially involved in developmental processes were selected from the DEGs based on their functions and annotations (Supplementary Table S8); of these, members of the ARR-B gene family of TFs, which engage in the binding of cytokinin-responsive elements and activation of the expression of cytokinin-responsive genes, were the most abundant (Supplementary Fig. S14).
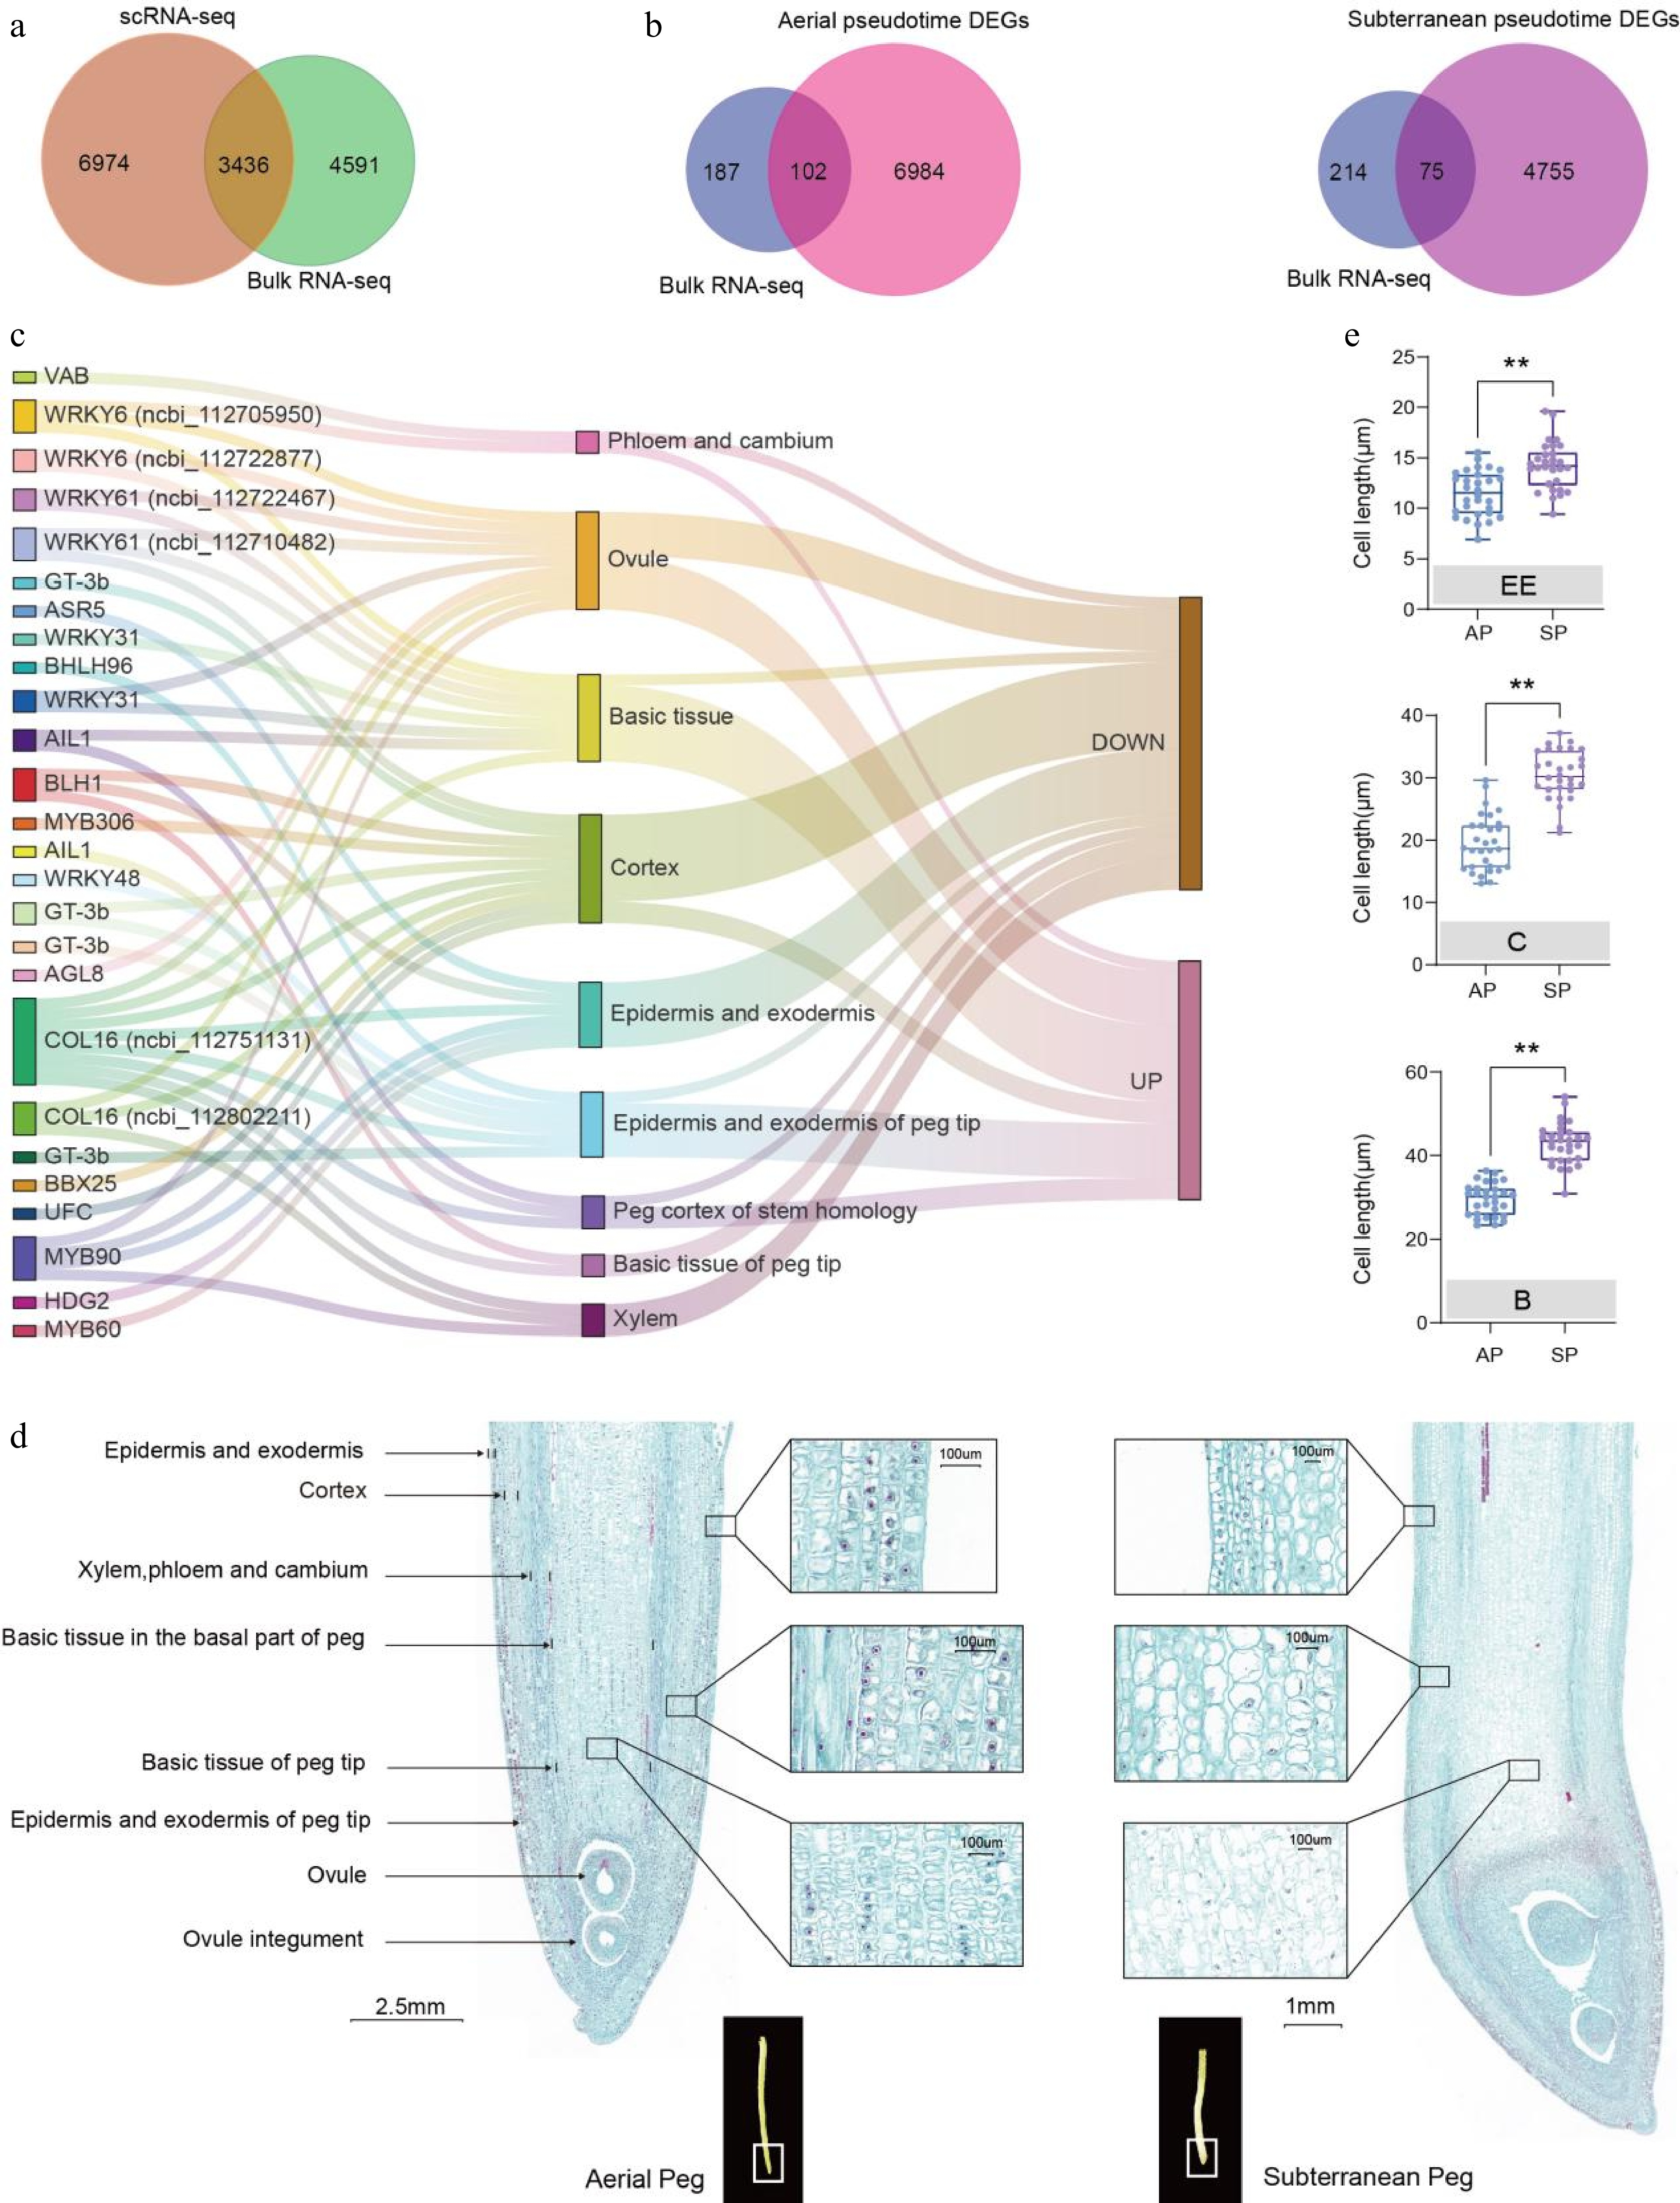
Figure 5.
Comparison of the transcriptomic atlases of aerial and subterranean pegs revealed key regulators involved in cell differentiation. (a) Comparative visualization of bulk RNA-seq and snRNA-seq derived differentially expressed genes (DEGs) between aerial and subterranean pegs. (b) Venn diagram showing 102 and 75 overlapping TFs were simultaneously upregulated or downregulated in bulk RNA-seq and snRNA-seq profiles in the pseudo-time trajectory of aerial and subterranean pegs, respectively. (c) Distribution and upregulation or downregulation of 26 potential key TFs in nine clusters based on a Sankey diagram. (d) Longitudinal section of aerial and subterranean pegs. (e) Statistical analysis of different cell sizes between aerial and subterranean pegs. A total of 30 individuals from three biological replicates were used for cell size calculation. EE: epidermis and exodermis; C: cortex; B: basic tissue in the basal part of the peg. ** Indicates a statistically significant difference between aerial and subterranean pegs at p < 0.01.
Previous analysis has revealed that 7,086 and 4,830 DEGs are present during the processes of aerial and subterranean peg differentiation, respectively (Figs 2b, 3a). Overlapping TFs that were simultaneously upregulated or downregulated were investigated in both bulk RNA-seq and snRNA-seq profiles, from which 102 and 75 key TFs were identified in aerial and subterranean pegs, respectively (Fig. 5b); subsequent homology interaction network analysis of TFs revealed that LATE ELONGATED HYPOCOTYL (LHY) might participate in the regulation of aerial and subterranean pegs (Supplementary Fig. S15). LHY is known to function as part of the oscillatory mechanism of the circadian clock and regulates abscisic acid biosynthesis and signaling pathways in Arabidopsis[34]. Additionally, a series of CONSTANS-like (CO-like, COL) proteins and WRKYs may be involved in peg regulation, such as COL2, 7, 16, WRKY6, 44, and 48 (Supplementary Fig. S15).
A total of 26 potential key TFs in nine clusters were analyzed using a Sankey diagram, with results showing that a large number of TFs were located in the ovule, basic tissue in the basal part of peg, and cortex (Fig. 5c). Genes enriched in the epidermis and exodermis were generally downregulated (Fig. 5c). Cell maintenance, proliferation, and differentiation in multicellular organisms are largely associated with different sets of expressed genes; thus, aerial and subterranean peg cell structures were further examined, with quantitative measurements indicating that cell size in the epidermis and exodermis, the basic tissue in the basal part of pegs, and cortex tissues generally increased significantly after pegs entered the soil (Fig. 5d, e). Based on this finding, it was speculated that these factors may be involved in peg cell maintenance, proliferation, and differentiation.
Auxin has a crucial effect on peg development
-
Many studies have highlighted that phytohormones, particularly gravity-associated hormones, are extensively involved in aerial peg growth and subterranean pod formation in peanut. Our previous analysis also suggested that hormone signals potentially regulate peg development (Fig. 4e; Supplementary Figs S13, S14). To explore the regulatory mechanism of peg development mediated by phytohormones, dozens of hormones and their derivatives were initially detected in both aerial and subterranean pegs, results showed that several hormones and derivatives were significantly changed between aerial and subterranean pegs (Supplementary Table S9), including Indole-3-acetic acid (IAA), ABA, Salicylic acid (SA), trans-Zeatin (tZT), and cis-Zeatin (cZT) (Fig. 6a; Supplementary Table S9).
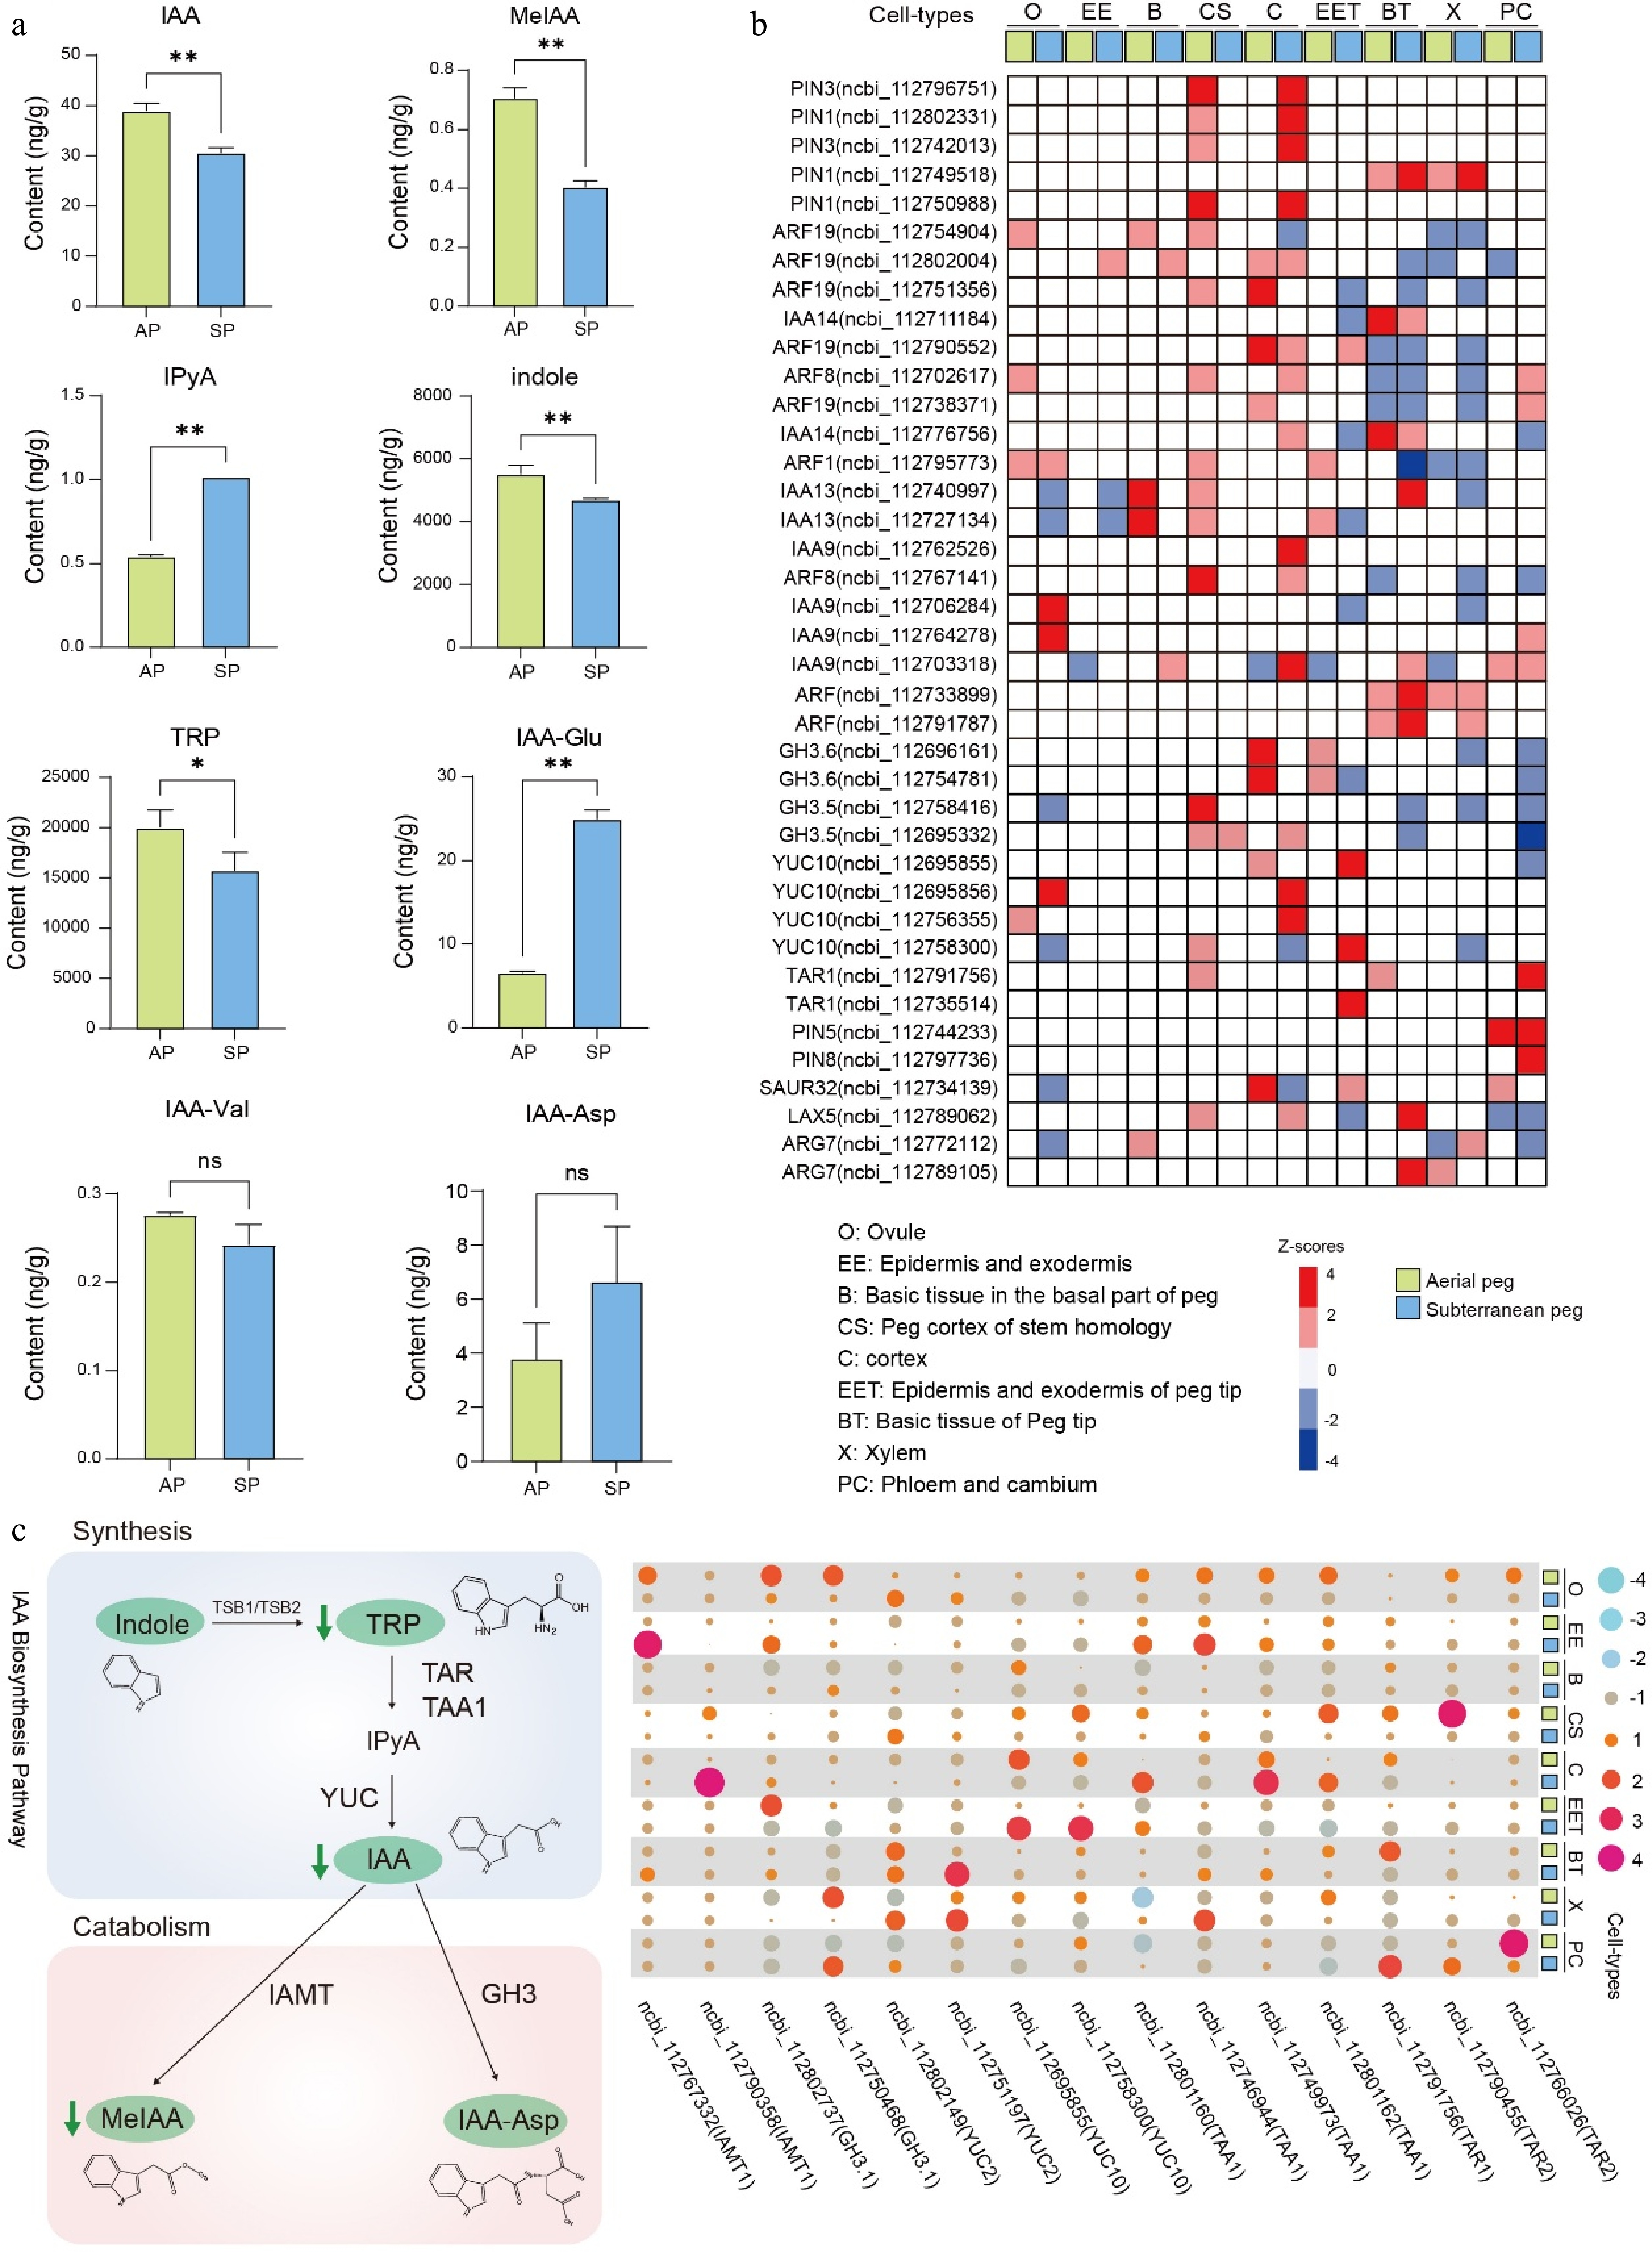
Figure 6.
Auxin pathway participating in peg development. (a) IAA and its derivatives measurement between aerial and subterranean pegs. * and ** indicate statistically significant difference between aerial and subterranean pegs at p < 0.05 and p < 0.01, respectively. (b) Cell-type-specific expression of biosynthesis, signal transport, and transduction genes of auxin based on snRNA-seq atlas in both aerial and subterranean pegs. (c) The expression profiling of genes involved in auxin metabolism.
Considering that auxin plays an essential role in gravity-regulated peg formation. Moreover, previous studies demonstrate that auxin regulates various developmental processes. Thus, a systematic analysis of gene abundance related to auxin signal transport and transduction pathways with the snRNA-seq dataset was conducted. For example, auxin response factors (ARFs) are TFs that specifically bind to auxin response elements (AuxREs) in promoters of early auxin-responsive genes, thereby triggering auxin-mediated developmental responses. ARF8 (ncbi_1127032617) was obvious downregulated in ovule (O), xylem (X), and peg cortex of stem homology (CS), whereas upregulated in cortex (C) as well as phloem and cambium (PC) in aerial pegs compared to subterranean pegs (Fig. 6b). Tryptophan (Trp)-dependent auxin biosynthesis involves a simple two-step pathway that converts tryptophan to IAA. The pathway involves the GH3 gene family catalyzing the conjugation of IAA to amino acids, and IAA CARBOXYL METHYLTRANSFERASE1 (IAMT1) is responsible for converting IAA to methyl-IAA ester (MeIAA)[35], results showed that both tryptophan, IAA and MeIAA levels were decreased in aerial pegs compared to subterranean pegs (Fig. 6a & c), and a series of genes involved in auxin metabolism displayed significant changes in different cell types between aerial and subterranean pegs (Fig. 6c). Collectively, the present findings demonstrate that auxin metabolic and signal transduction pathways play essential roles during gravity-regulated peg formation in peanut.
-
Angiosperms exhibit distinct reproductive mechanisms that allow for the formation of aerial fruits that harbor seeds. However, peanut plants have a uniquely pronounced fruit dimorphism in which aerial fruits are produced above the ground, but subterranean fruits (pods) develop in the soil. A pivotal adaptive feature in peanut is the formation of a structure known as the peg, which develops after double fertilization, moves downward in response to gravity, and then penetrates the soil and subsequently forms subterranean pods. The successful generation of pegs and formation of subterranean pods are critical stages in the life cycle of peanut, with the failure of pegs to penetrate the soil leading to the loss of developing embryos and reduced crop yield.
To investigate the molecular mechanisms driving peg formation and development in peanut, a single-cell transcriptomic atlas of both aerial and subterranean pegs was constructed based on droplet-based snRNA-seq. A total of 23,539 and 27,364 cells were identified in the aerial and subterranean pegs, respectively (Fig. 1b, c). Uniform manifold approximation and projection (UMAP) and t-distributed stochastic neighbor embedding (t-SNE) visualized the identified cell populations, comprising 20 clusters and 22 clusters, respectively (Fig. 1b, c; Supplementary Fig. S2). Both methods serve the core purpose of visualizing high-dimensional single-cell data in 2D space to reveal cell clusters. However, they are not functionally identical, and their complementary strengths provide distinct, valuable insights into the dataset. ScRNA-seq has proven to be a powerful tool for revealing cellular heterogeneity, discovering new cell types, and investigating cell-cell communications at an unprecedented resolution. A total of nine cell types were assigned in aerial and subterranean pegs (Fig. 1), and RNA in situ hybridization was further used to validate the accuracy of cell clustering, such as xylem, phloem, epidermis, and exodermis (Supplementary Fig. S5). Unfortunately, all cell types used were not validated with ISH individually. This might be due to challenges in performing ISH on aerial peanut pegs, attributed to their fragile morphology, high mucilage content, and susceptibility to tissue damage during processing. Droplet-based high-throughput scRNA-seq approaches were initially and successfully applied to various types of human and animal cells[36−39], however, plant cell walls reduce the effectiveness of this technique for the study of plants. To overcome protoplast isolation limitations in plants, FANS technique and high-throughput snRNA-seq with a microfluidic technology platform were employed to isolate and profile nuclei within peanut peg cells.
Many biological processes manifest as a continuum of dynamic changes in the cellular state. A unique aspect of scRNA-seq data is the ability to construct pseudo-time trajectories along branches and paths based on the gene expression profiling of tens of thousands of cells. This type of analysis along a pseudo-time trajectory symbolizes a biological process such as cell development and differentiation. In this study, a pseudo-time analysis of both aerial and subterranean pegs was used to describe the developmental trajectory and interaction network of TFs during peg growth. From this analysis, a total of 7,086 and 4,830 proposed pseudo-time DEGs were identified as key genes directing the differentiation trajectory of aerial and subterranean pegs (Figs 2b, 3a). Given that the pseudo-time trajectory represents the biological process of cell differentiation, proliferation, and development[40], the amassed single-cell gene expression data can facilitate disentangling of the dynamic gene regulatory networks along continuous biological processes.
TFs play a vital role in regulating the transcription of target genes by binding to specific promoters. ScRNA-seq datasets have allowed us to identify key potential TFs that drive cell maintenance, proliferation, and differentiation. For example, we previously reported on peanut leaf blade single-cell transcriptomics, in which an interaction network of TFs was identified in various cell types during leaf growth[24]; of these TFs, AHL23 (AT-HOOK MOTIF NUCLEAR LOCALIZED PROTEIN 23) was confirmed to positively promote leaf cell growth[24]. Recently, we constructed a single-nucleus resolution atlas of transcriptome and chromatin accessibility in peanut leaves and identified an AT-hook protein AhAHL11, which promotes leaf expansion by modulating auxin[26]. In the present study, a series of TFs were identified as potential key regulators of aerial and subterranean peg development, such as AGL8, WRKY41, and 53 (Fig. 3), suggesting that these TFs participate in peg growth regulation in peanut. DELLA and GRAS TFs are targeted by miRNAs ahy-miR171 and ahy-miR319 in the peanut peg, and DELLA protein as a crucial negative regulator of the GA-signaling pathway, is known to be involved in gravitropism[41].
Fertilization is an important process during pegging in peanuts. After fertilization, embryonic development remains limited, and intercalary meristematic cells under the short stalk (pedicel) begin to divide rapidly to form pegs[3,7]. Microscopic analysis has shown that anatomically the peg is similar to a typical dicotyledon stem, with vascular bundles arranged in a ring-like structure (cortex) surrounding the central core (pith) near the outer edge[42]. Despite its stem-like morphology, functionally the peg behaves more like a root because it has gravitropic properties, and grows downward to enter the soil[42]. It is widely accepted that peanut pegging is regulated by a complex interplay of various signaling mechanisms, including those mediated by the hormones auxin, ethylene, and gibberellin[3]. However, the precise relationship between hormones and regulation of peg development in peanut remains unclear.
In the present study, to investigate the association between hormonal change and peg growth, dozens of hormones and their derivatives were initially examined between aerial and subterranean pegs. The results revealed that several hormones were remarkably changed, including IAA, ABA, SA, tZT, and cZT (Fig. 6a; Supplementary Table S9). Peg development is a dynamic and complex physiological process tightly regulated by a network of plant hormones, each contributing distinct yet interconnected roles in coordinating cellular activities such as initiation, elongation, branching, and maturation. For example, the aerial peg shows a clear trend in ABA regulation, with high levels produced during its initial growth, followed by a steady decline as the peg penetrates the soil and the pod development[10]. Beyond their individual roles, hormones exert profound regulatory effects through crosstalk, integrating signals to ensure precise control of peg development.
Auxin acts as a signaling molecule, and its importance has been highlighted in many aspects of plant growth and development. Notably, a signaling network orchestrated by the auxin triggers the sense of the gravity stimulus, which is crucial for plants in response to gravity[43]. It is generally recognized that the asymmetrical distribution of auxins during gravitropism causes differential directional growth in organs affected by gravitropism. Arabidopsis, as a model plant, has been used in countless studies focusing on the relationship between gravitropic response and auxin transport, as well as auxin distribution. For example, many auxins transport single mutants displayed root gravitropic defects in Arabidopsis[44−48]. The AUX1 gene mutant displayed an auxin-resistant root growth phenotype and regulated root gravitropic curvature by coordinating the localized redistribution of auxins in the Arabidopsis root apex[49,50]. Auxin signal transduction is also involved in the regulation of shoot gravitropism and tiller angle in rice. Recently, the rice tiller angle mutant lazy3 (la3) was identified through map-based cloning, with further investigations revealing that lateral auxin transport and shoot gravitropism were defective in la3 mutants upon gravistimulation and that LA3 negatively regulates the tiller angle by acting upstream of LA1 to mediate asymmetric auxin distribution[51].
In peanut, flowers wither following fertilization, and the ovary elongates to develop into a peg, which accumulates amyloplasts and reacts to gravity, first turning vertically toward the ground and then growing horizontally[52]. Notably, the gravitropic response dramatically decreased upon excision of the ovular region of the peg and was restored by application of exogenous auxin to the excised tip[7]. Therefore, the successful pegging of peanut is regulated by gravitropic perception and response. In the present study, the IAA level was significantly decreased in subterranean pegs compared to aerial pegs, which collected samples at 3 d after aerial peg elongation and 2 d after peg penetration into the soil, and speculated that IAA activity might retarded once the peg has penetrated the soil.
Peanut is unique because it produces aerial cleistogamous flowers that in turn produce subterranean pods. In the present study, profiling of single-cell transcriptional atlases in aerial and subterranean pegs provides new insights into the regulation of peg development in peanuts. However, the findings primarily emphasize the predicted gene network without providing precise molecular-level characterization. Therefore, further research will be necessary to elucidate the functions of the identified TFs and hormones that govern the distinct directional growth of gravitropic organs in peanuts, with the aim of developing high-productivity peanut plants.
This work was supported by the Guangdong Provincial Key Research and Development Program-Modern Seed Industry (2022B0202060004), the National Key Research and Development Project (2023YFD1202800), the Open Competition Program of Top 10 Critical Priorities of Agricultural Science and Technology Innovation for the 14th Five-Year Plan in Guangdong Province (2022SDZG05), The National Natural Science Foundation of China (32272121, 32172051, 32301869), the Guangdong Science and Technology Plan Project (2023B1212060038), the Guangdong Basic and Applied Basic Research Foundation (2021A1515010811, 2023A1515010098, 2023A1515010569, 2023A04J0776), the China Agriculture Research System of MOF and MARA (CARS-13), the Special Fund for Scientific Innovation Strategy-Construction of High Level Academy of Agriculture Science (R2020PY-JX004, R2020PY-JG005, R2021PY-QY003, R2022YJ-YB3025), the Foundation of Director of Crop Research Institute of Guangdong Academy of Agriculture Sciences (202101, 202201, 202306), Special Funds for the Revitalization of Agriculture through Seed Industry under the Provincial Rural Revitalization Strategy (2022-NPY-00-022), the Project of Collaborative Innovation Center of GDAAS (XTXM202203), the Special Support Program of Guangdong Province (2021TX06N789), Science and Technology Planning Project of Heyuan City (Heyuan She Nong Da Zhuan Xiang 2022002), and the Science and Technology Project of Qingyuan City 2023 (2023KJJ002).
-
The authors confirm their contributions to the paper as follows: study conception: Hong Y; methodology: Xu M; data curation: Jin W, Xu M, Huang L, Zhou Y, Zhong W, Liang Y, Zheng Z; Yu Q, Li S, Wang R, Wang W, Liu H; resources: Huang L, Hong Y; investigation: Varshney RK; visualization: Zhou Y, Zhong W, Liang Y, Zheng Z; writing - original draft: Jin W; review & editing: Xu M, Huang L, Lu Q, Wang W, Liu H, Xiao Y; project administration, funding acquisition: Hong Y, Wang W, Liu H, Chen X; supervision: Varshney RK, Hong Y, Wang W, Liu H. All authors reviewed the results and approved the final version of the manuscript.
-
The raw sequence data reported in this paper have been deposited in the Genome Sequence Archive (GSA) in National Genomics Data Center, China National Center for Bioinformation Beijing Institute of Genomics, Chinese Academy of Sciences[53]. Peanut peg tissue bulk RNA-seq raw data (GSA: CRA014817) and peanut peg snRNA-seq raw data (GSA: CRA014828) that are publicly accessible at https://ngdc.cncb.ac.cn/gsa.
-
The authors declare that they have no conflict of interest.
-
# Authors contributed equally: Weicai Jin, Mengyun Xu, Lu Huang
- Supplementary Table S1 Probes used for RNA in situ hybridization.
- Supplementary Table S2 Statistics of scRNA-seq data results.
- Supplementary Table S3 7,086 pseudo-temporally differentially expressed genes identified.
- Supplementary Table S4 1,052 DEGs were screened by cross-comparing in aerial peg.
- Supplementary Table S5 4,830 DEGs potentially involved in the development of differentiation trajectory maps.
- Supplementary Table S6 579 DEGs were screened by cross-comparing in subterranean peg.
- Supplementary Table S7 3,436 DEGs in Bulk RNA-seq and snRNA-seq.
- Supplementary Table S8 289 TFs potentially involved in developmental processes.
- Supplementary Table S9 56 hormones and derivatives changed significantly between aerial and subterranean pegs.
- Supplementary Fig. S1 Knee plots and empty drop cutoffs identified by the Cell Ranger filtering algorithms in aerial and subterranean pegs.
- Supplementary Fig. S2 t-distributed Stochastic Neighbor Embedding(t-SNE) visualization identifying 20 and 22 putative cell clusters in aerial and subterranean pegs, respectively.
- Supplementary Fig. S3 Median number of gene and filtered UMI in different samples determined by data quality control.
- Supplementary Fig. S4 The correlation between different cell clusters in aerial and subterranean pegs.
- Supplementary Fig. S5 RNA in situ hybridization assays to validate the expression pattern of marker genes.
- Supplementary Fig. S6 Venn diagram showing DEGs of aerial peg cell differentiation trajectory, cell differentiation states, cell fate, and PAGA.
- Supplementary Fig. S7 Transverse section of subterranean peg.
- Supplementary Fig. S8 KEGG pathway enrichment analysis of 4,830 DEGs in subterranean pegs trajectory.
- Supplementary Fig. S9 Venn diagram showing DEGs of subterranean peg cell differentiation trajectory, cell differentiation states, cell fate, and PAGA.
- Supplementary Fig. S10 The expression patterns of ten TFs along the subterranean peg cell differentiation trajectory.
- Supplementary Fig. S11 Analysis of the cell differentiation and developmental trajectory of identical cell types combining datasets from aerial and subterranean pegs.
- Supplementary Fig. S12 Analysis of upregulated and downregulated genes with bulk transcriptome between aerial and subterranean pegs.
- Supplementary Fig. S13 KEGG analysis categorized bulk RNA-seq and snRNA-seq DEGs related to various biological process.
- Supplementary Fig. S14 The number of TFs of simultaneously upregulated or downregulated in bulk RNA-seq and snRNA-seq profiles in the pseudo-time trajectory of aerial and subterranean pegs.
- Supplementary Fig. S15 Interaction network analysis of 177 TFs in aerial and subterranean pegs.
- Copyright: © 2025 by the author(s). Published by Maximum Academic Press on behalf of Chongqing University. This article is an open access article distributed under Creative Commons Attribution License (CC BY 4.0), visit https://creativecommons.org/licenses/by/4.0/.
-
About this article
Cite this article
Jin W, Xu M, Huang L, Zhou Y, Xiao Y, et al. 2025. Single-cell resolution transcriptional atlases of aerial and subterranean pegs reveals auxin signaling associated with peg development in peanut (Arachis hypogaea L.). Plant Hormones 1: e019 doi: 10.48130/ph-0025-0019 

Single-cell resolution transcriptional atlases of aerial and subterranean pegs reveals auxin signaling associated with peg development in peanut (Arachis hypogaea L.)
- Received: 30 May 2025
- Revised: 10 August 2025
- Accepted: 14 August 2025
- Published online: 16 September 2025
Abstract: Peanut pegging is a unique characteristic in which flowers are produced aerially, penetrating the soil and developing into subterranean pods. However, the gene networks that regulate peg development in peanut remain largely unknown. To investigate the spatiotemporal regulation of gene regulatory networks during peg growth and development, a single-nucleus resolution transcriptomic atlas of both aerial and subterranean pegs comprising 50,903 individual cells was constructed, and nine major cell types were annotated using cell markers and in situ hybridization. Transcription factors (TFs), developmental differentiation trajectories, and predicted interaction networks were identified during peg development. A combination of single-nucleus RNA sequencing (snRNA-seq), and bulk RNA sequencing in aerial and subterranean pegs highlighted phytohormone signaling as a key driver of peg formation. In addition, the present findings suggest that auxin signal transduction pathways are crucial for gravity-regulated peg formation. This study advances our understanding of aerial and subterranean pegs development at cell-type resolution and provides a resource for exploring the molecular mechanisms underlying cell maintenance and differentiation during pod formation.