-
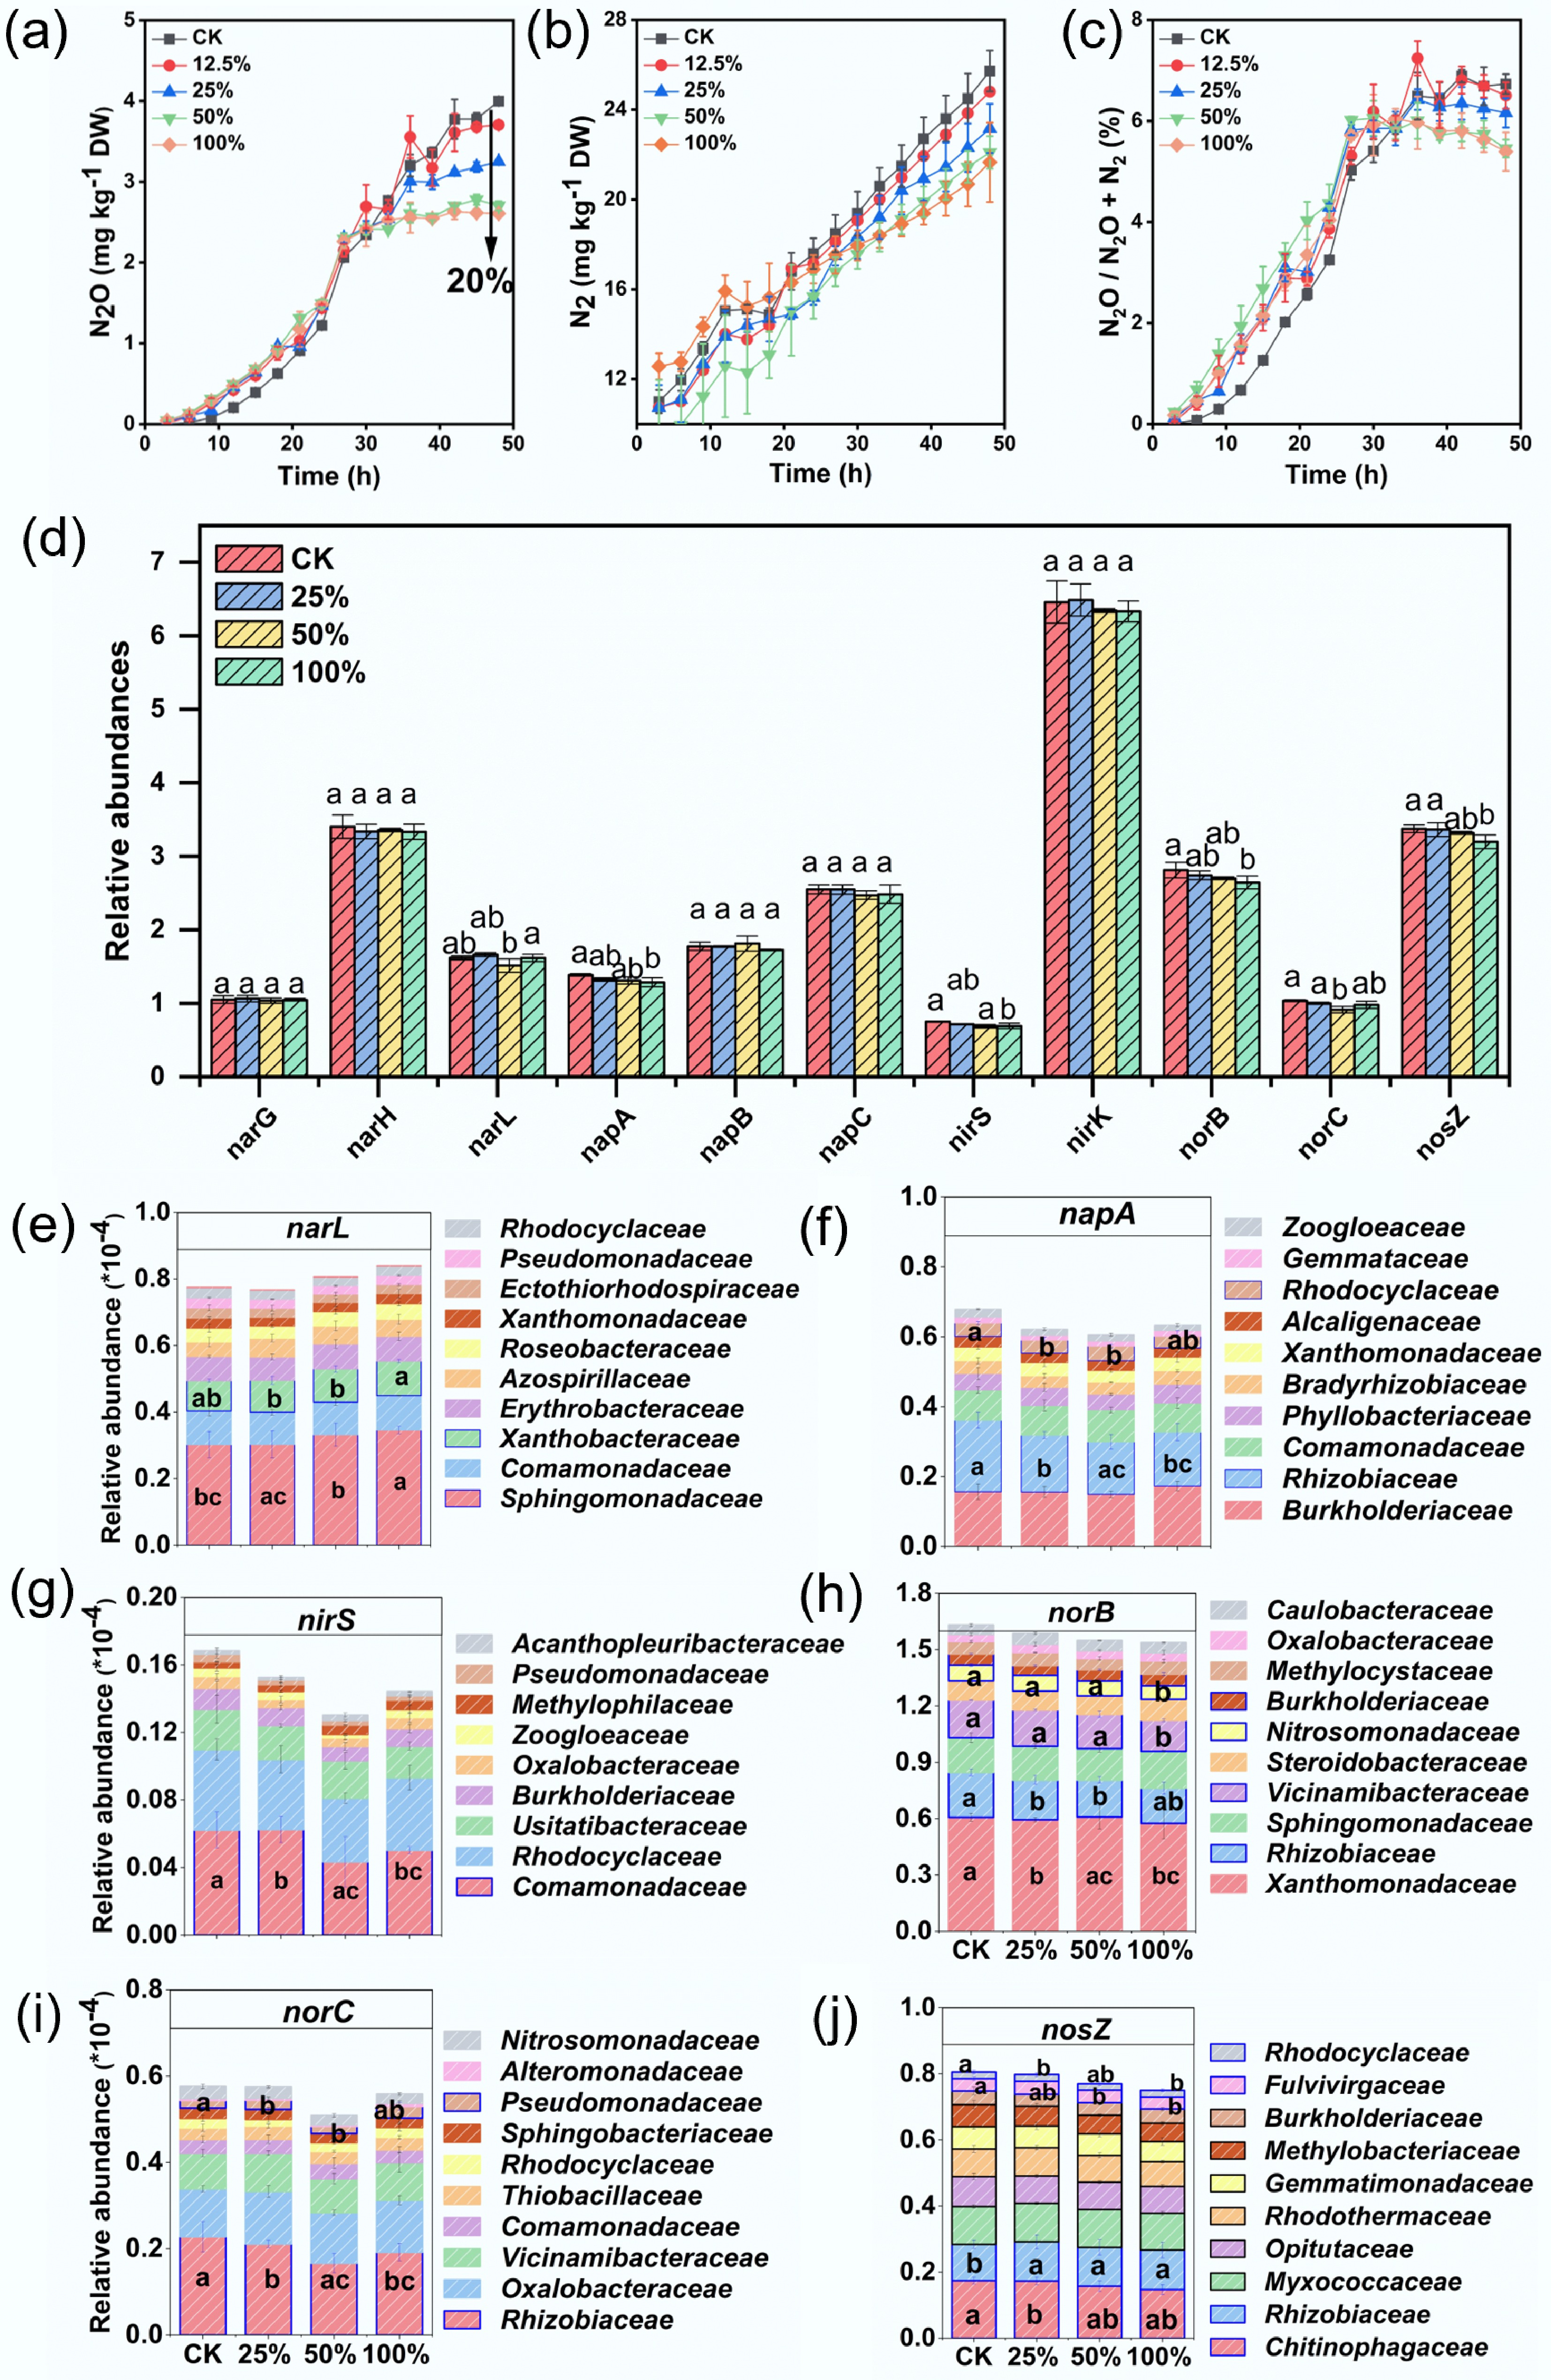
Figure 1.
Effects of viral concentrations on the end products of denitrification, functional gene abundance, and denitrifying community composition. Viral treatments are represented as percentages: 100% indicates 10 mL live virus extract + 0 mL inactivated virus extract (similar definitions apply for other percentages). (a–c) Gaseous products of denitrification and their ratios. (d) Changes in the abundance of key denitrification-related functional genes under varying viral treatments. (e–j) Relative abundance of microbial taxa harboring denitrification-related genes under different viral treatments. Different letters above the data points indicate significant differences at p < 0.05.
-
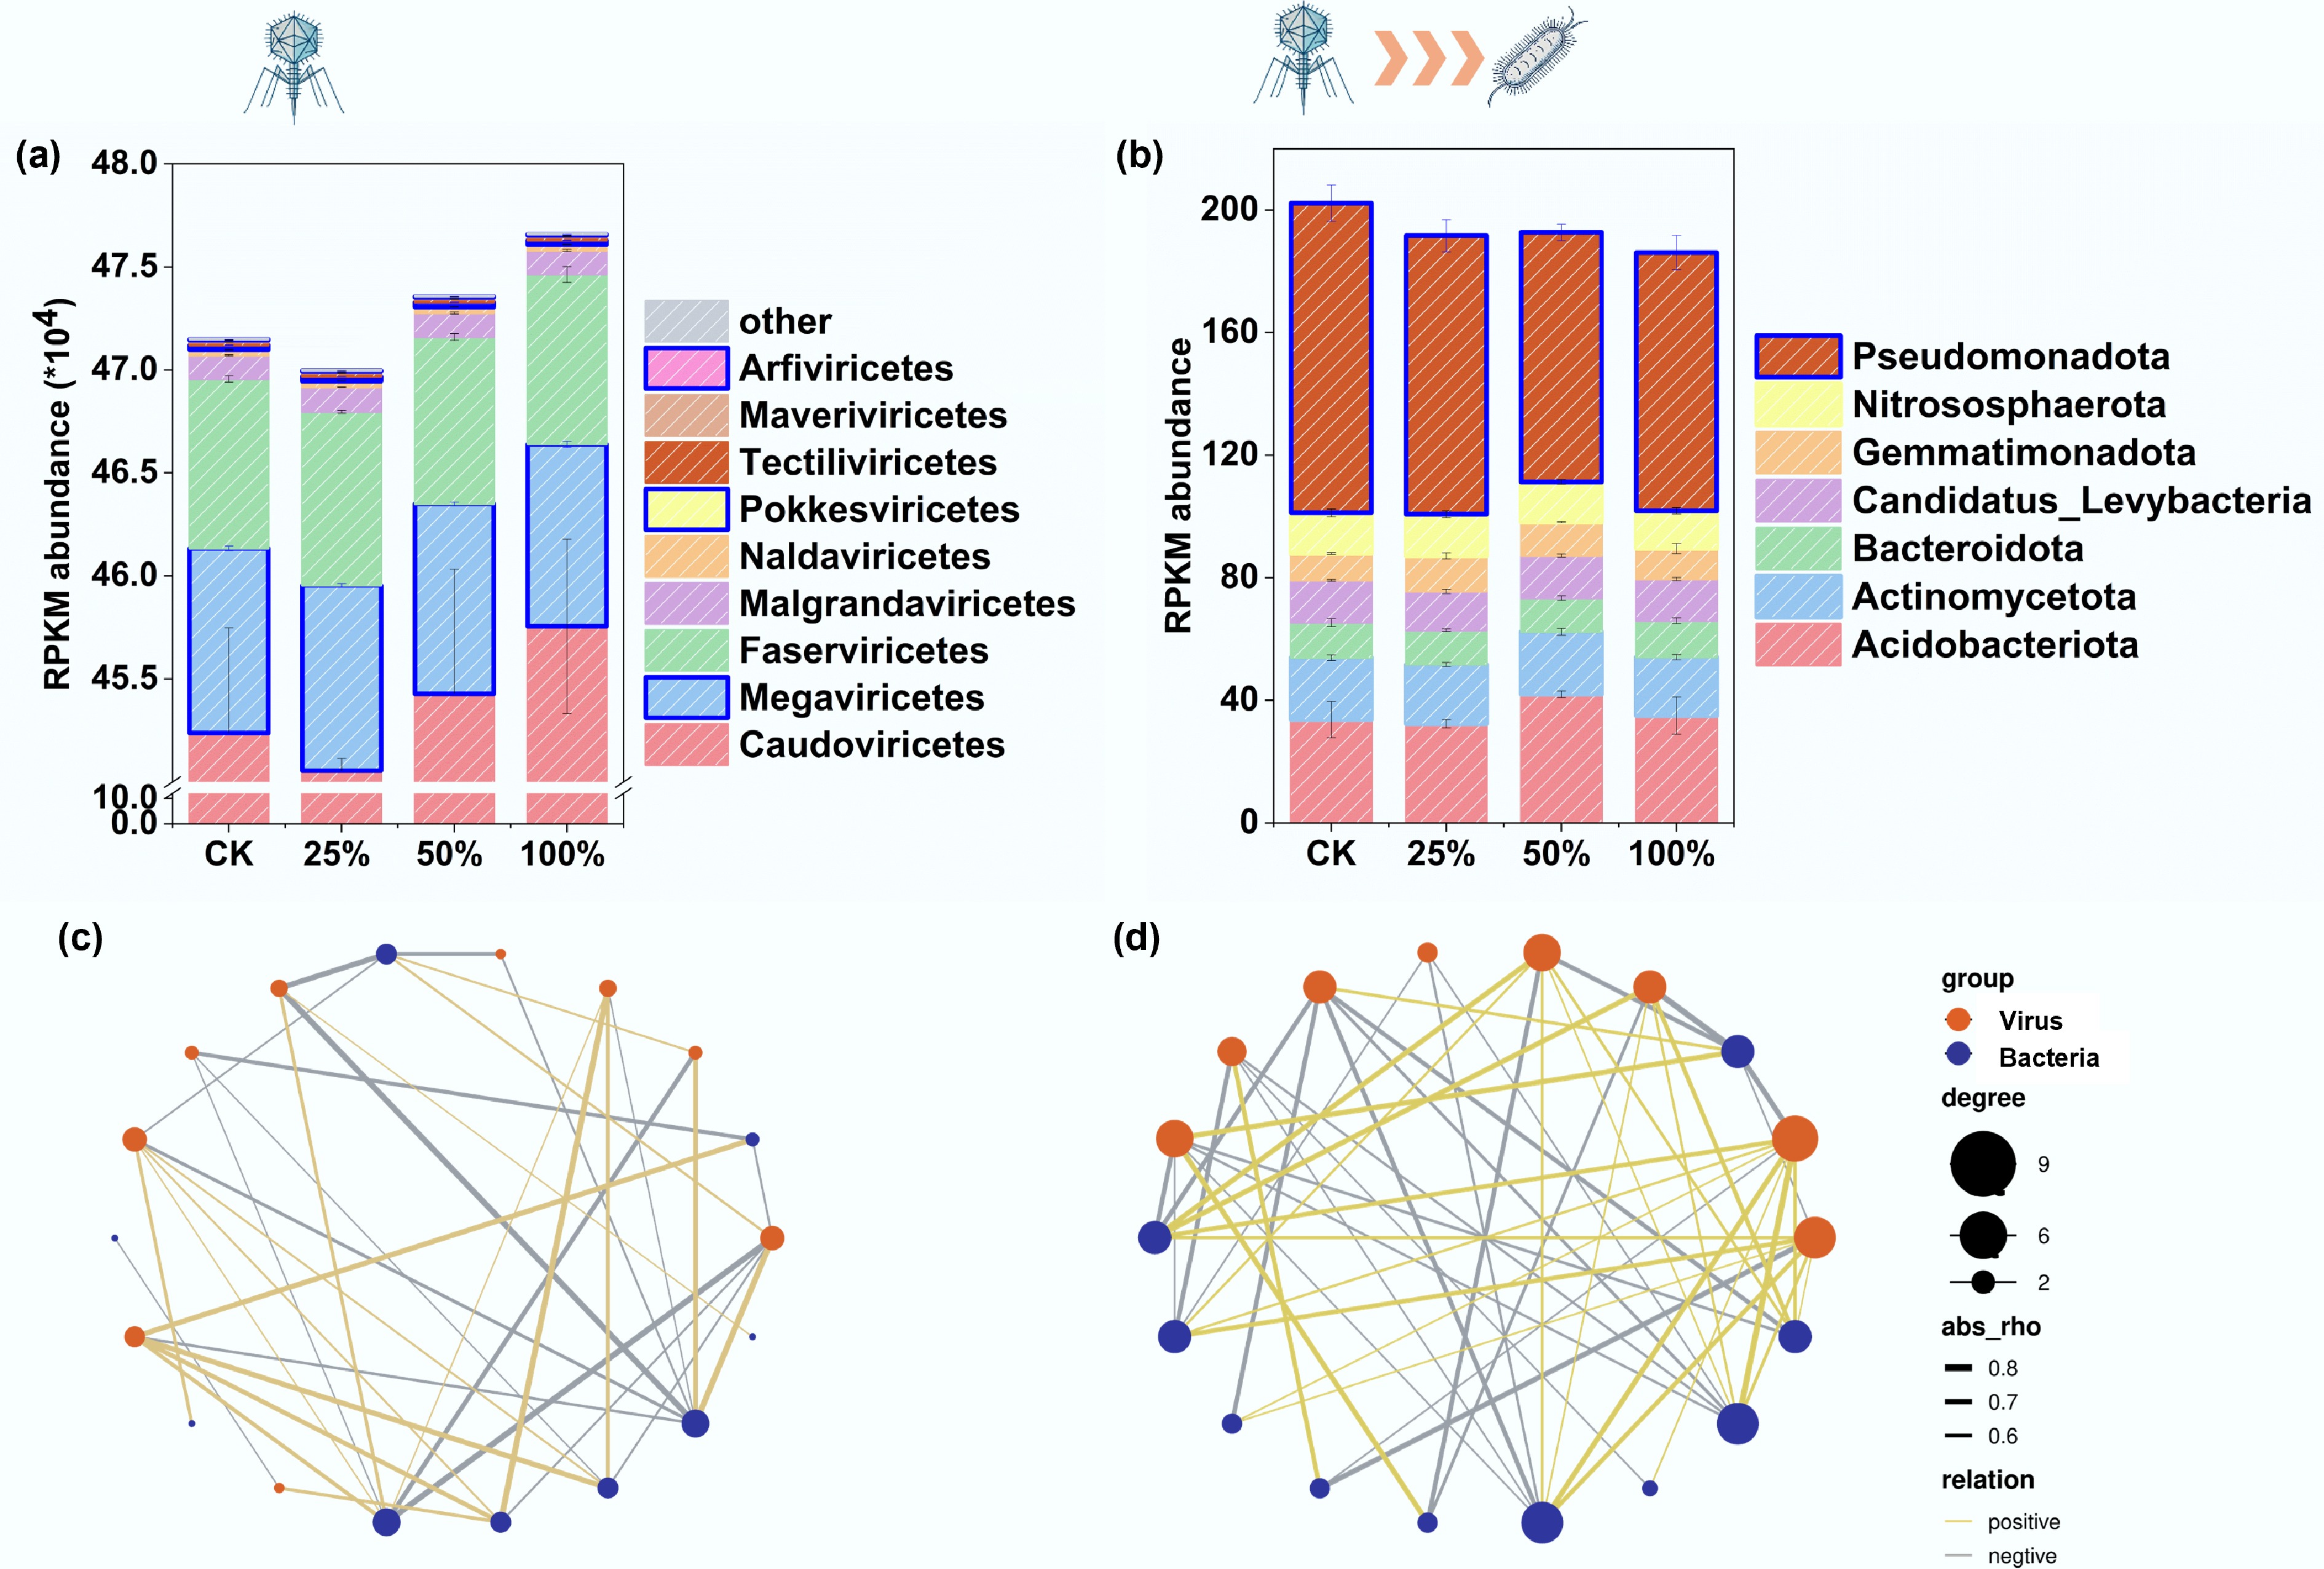
Figure 2.
Characterization of viral and host communities and virus–microbe interaction networks under varying viral concentrations. (a) Viral community composition, (b) hosts of Megaviricetes, (c) virus–microbe networks at 0% and 25% viral concentrations, and (d) virus–microbe networks at 50% and 100% viral concentrations. Different colors denote significant differences (p < 0.05) among treatments.
Figures
(2)
Tables
(0)