-
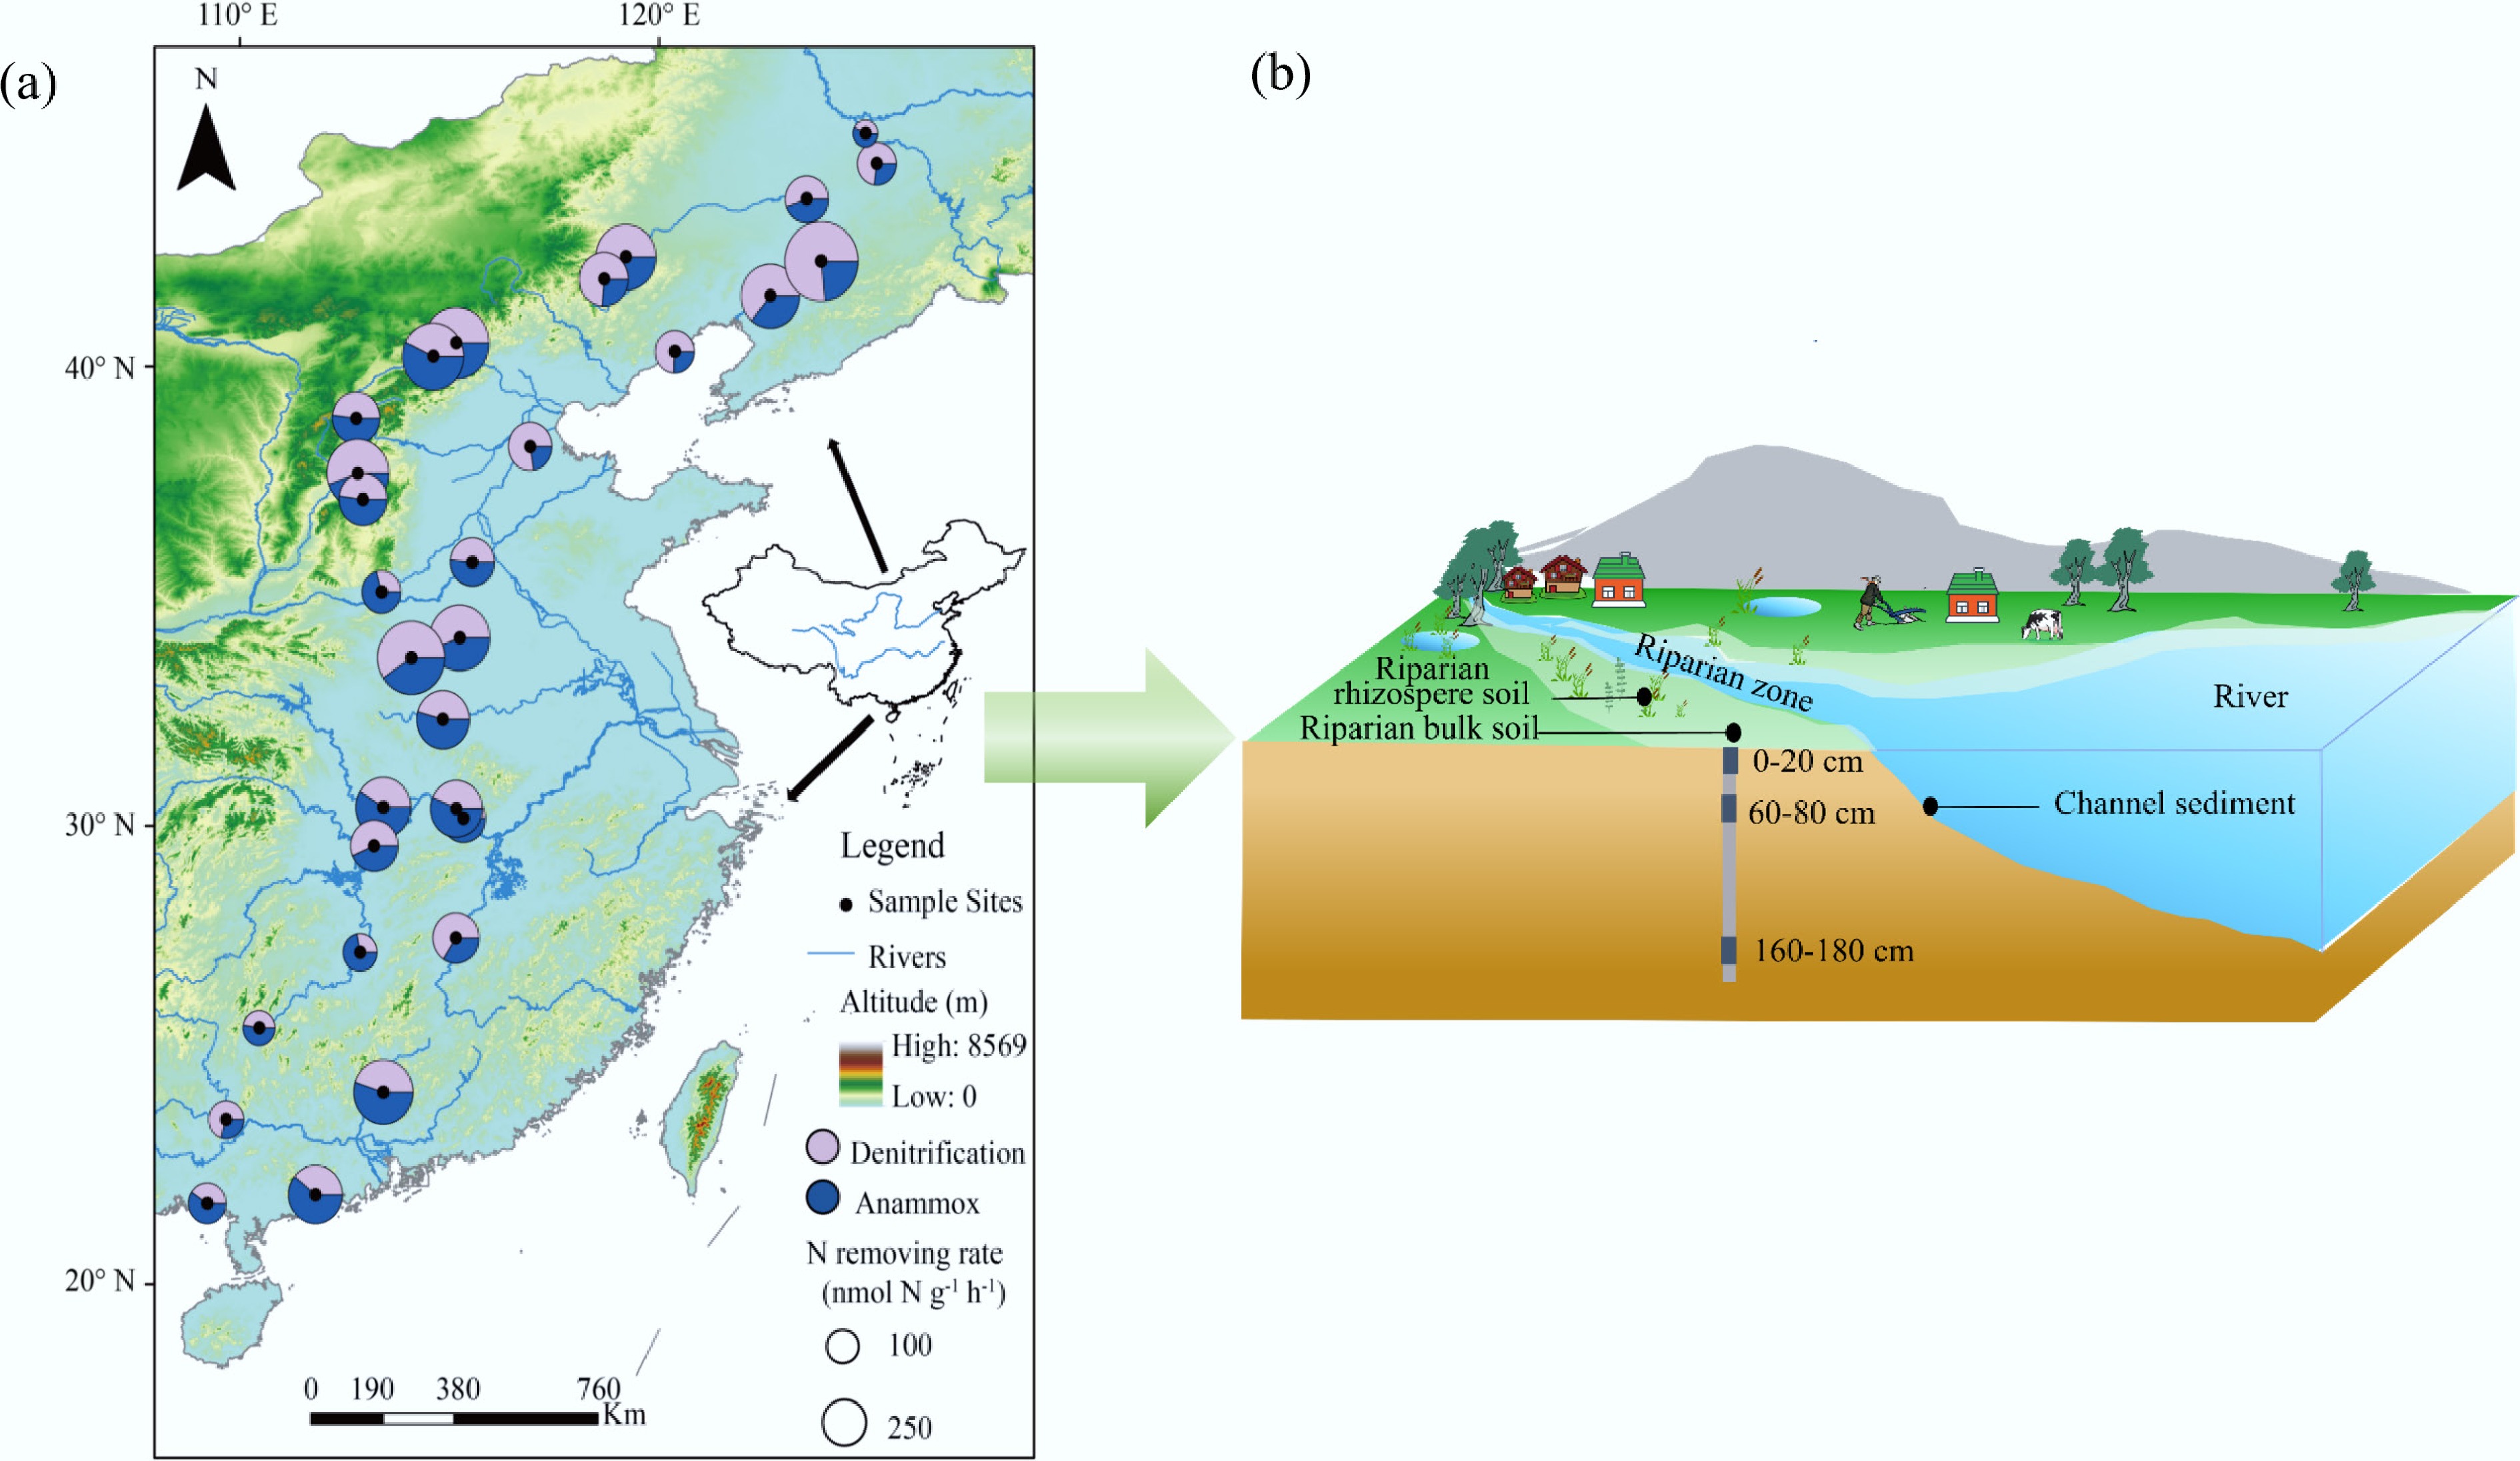
Figure 1.
(a) Biogeographical distribution of denitrification (purple), and anammox (blue) rates across 30 sampling sites, and (b) the schematic diagram of the sampling strategy. Each black circle represents a sampling site, with circle size proportional to the N removal rates at that location. N removal rates are calculated as the sum of values from channel sediments, riparian rhizosphere soils, and riparian bulk soils at three depth intervals (0–20, 60–80, and 160–180 cm).
-
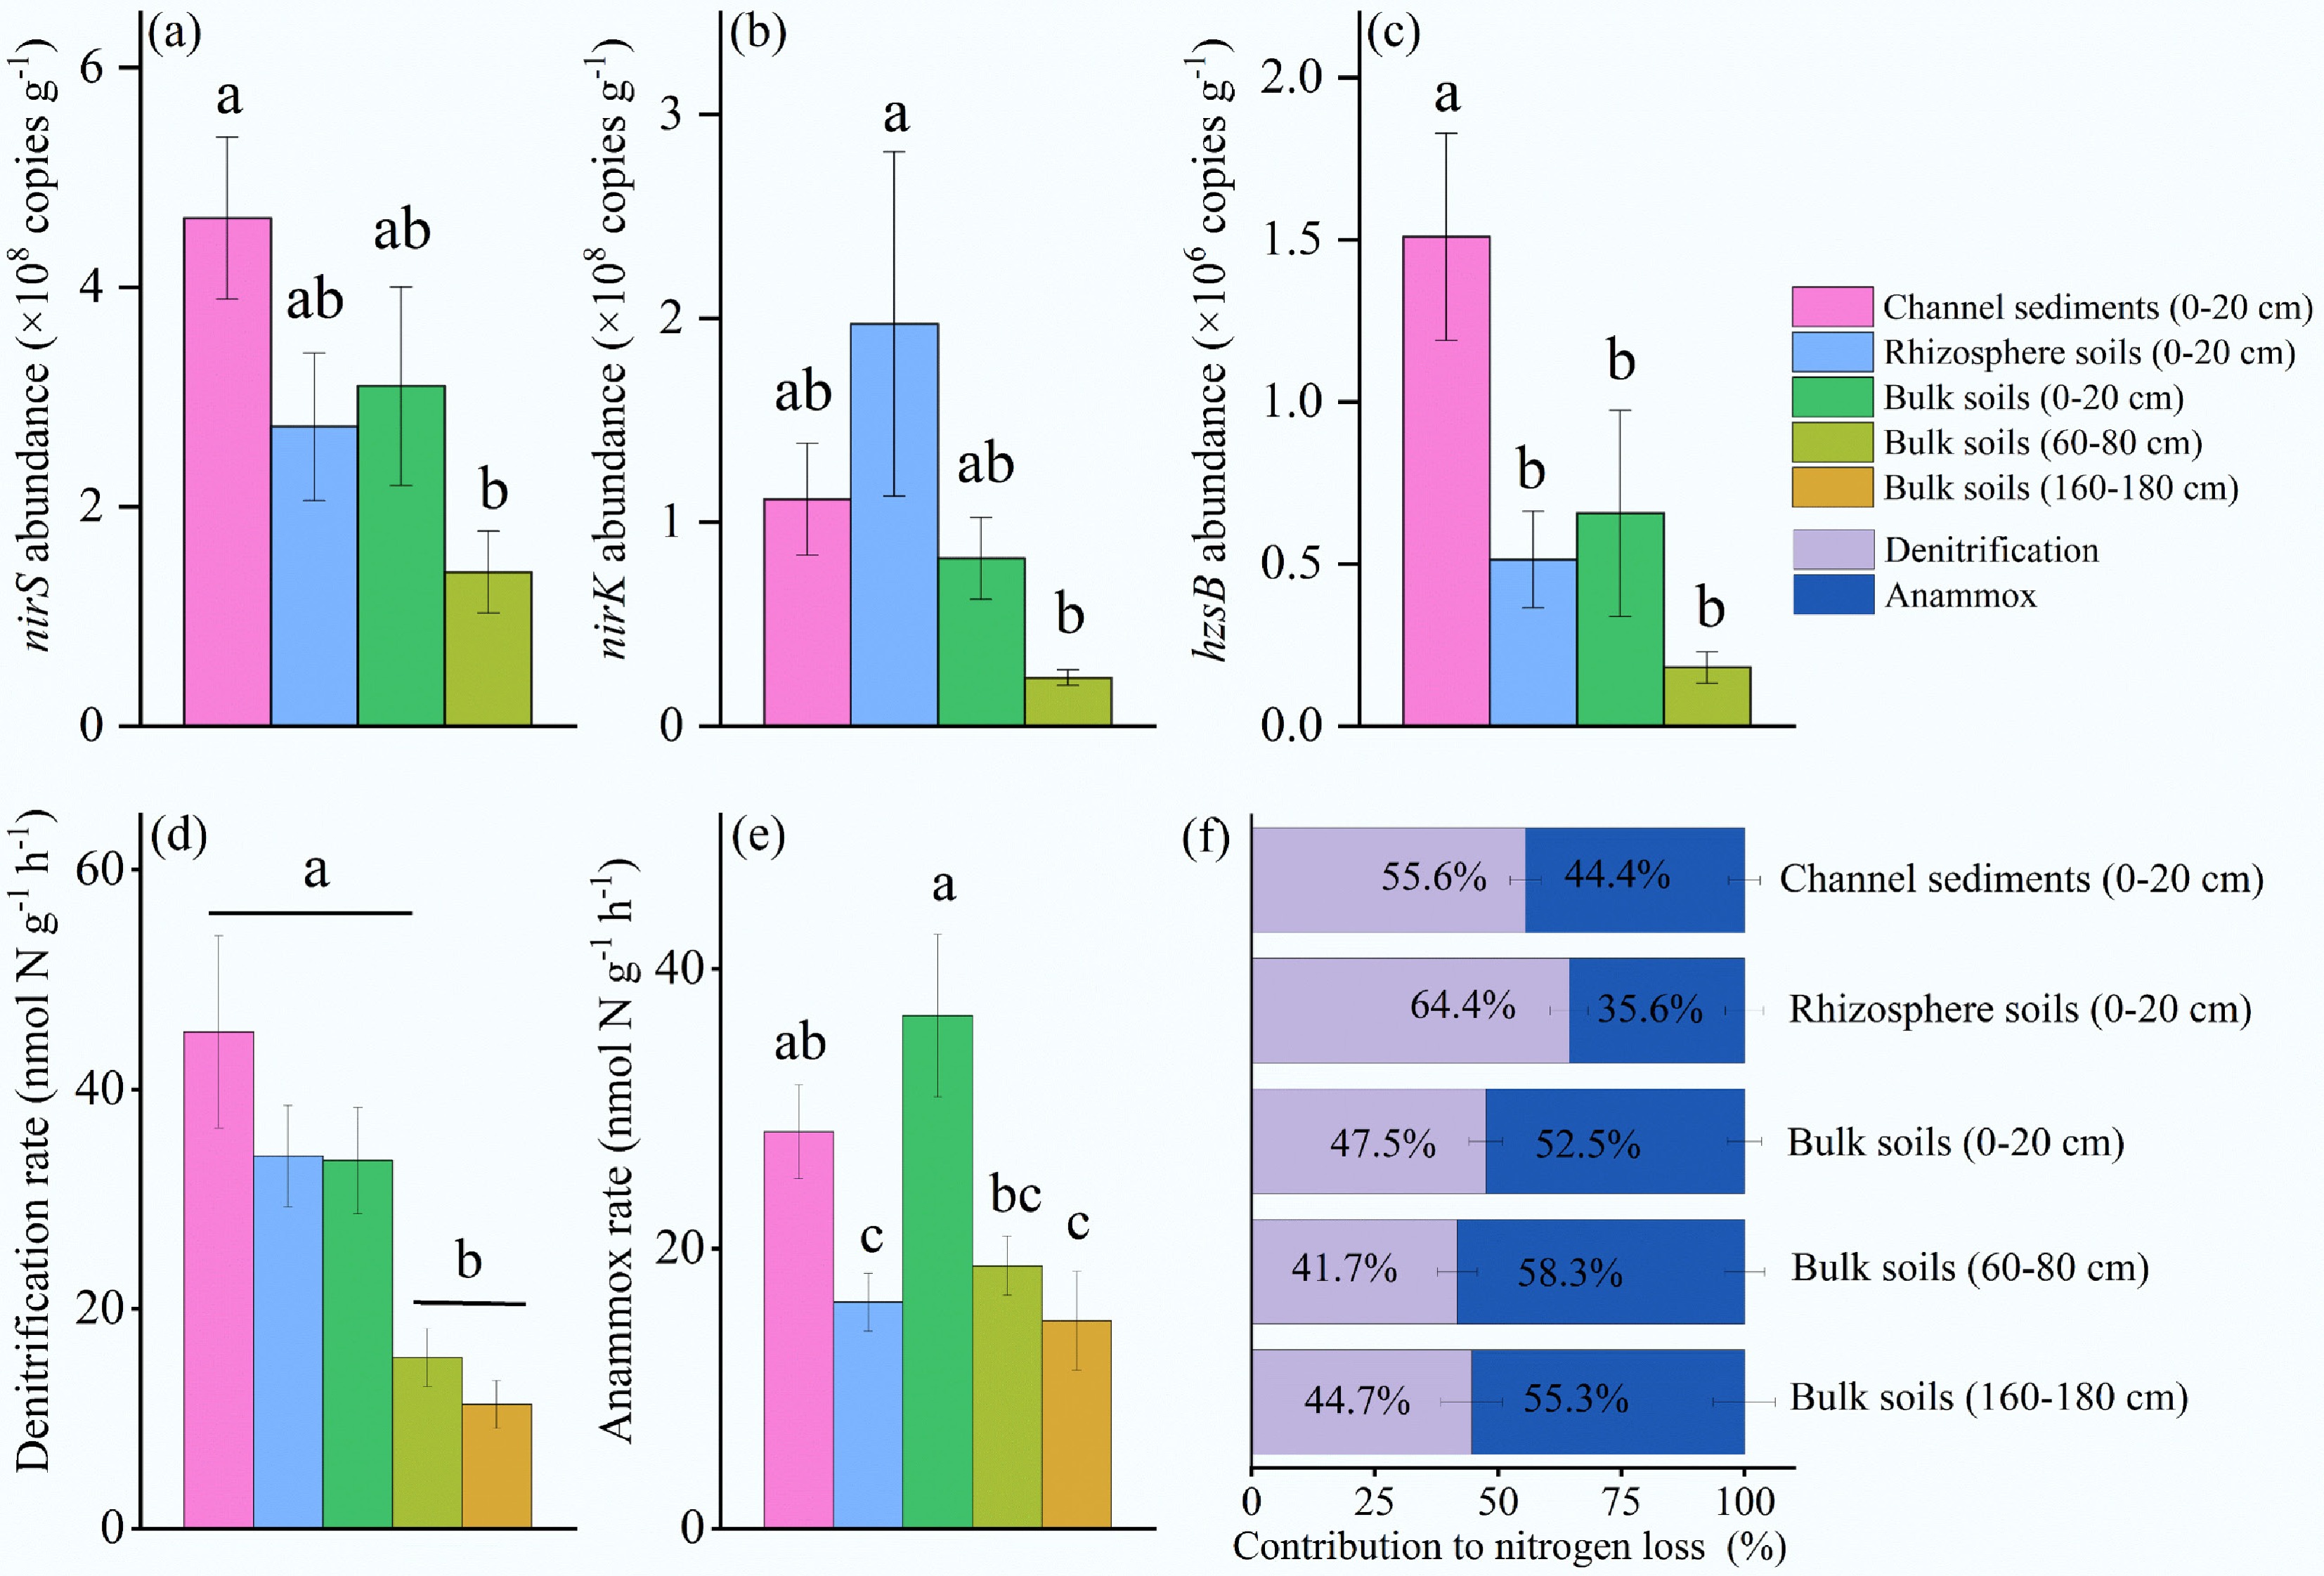
Figure 2.
(a)−(f) Abundances of nirS, nirK, and hzsB genes, denitrification and anammox rates, and their relative contributions to N removal (mean ± SE) in channel sediments, riparian rhizosphere soils, and riparian bulk soils. Different lowercase letters above the bars indicate significant differences (p < 0.05) among soil types.
-
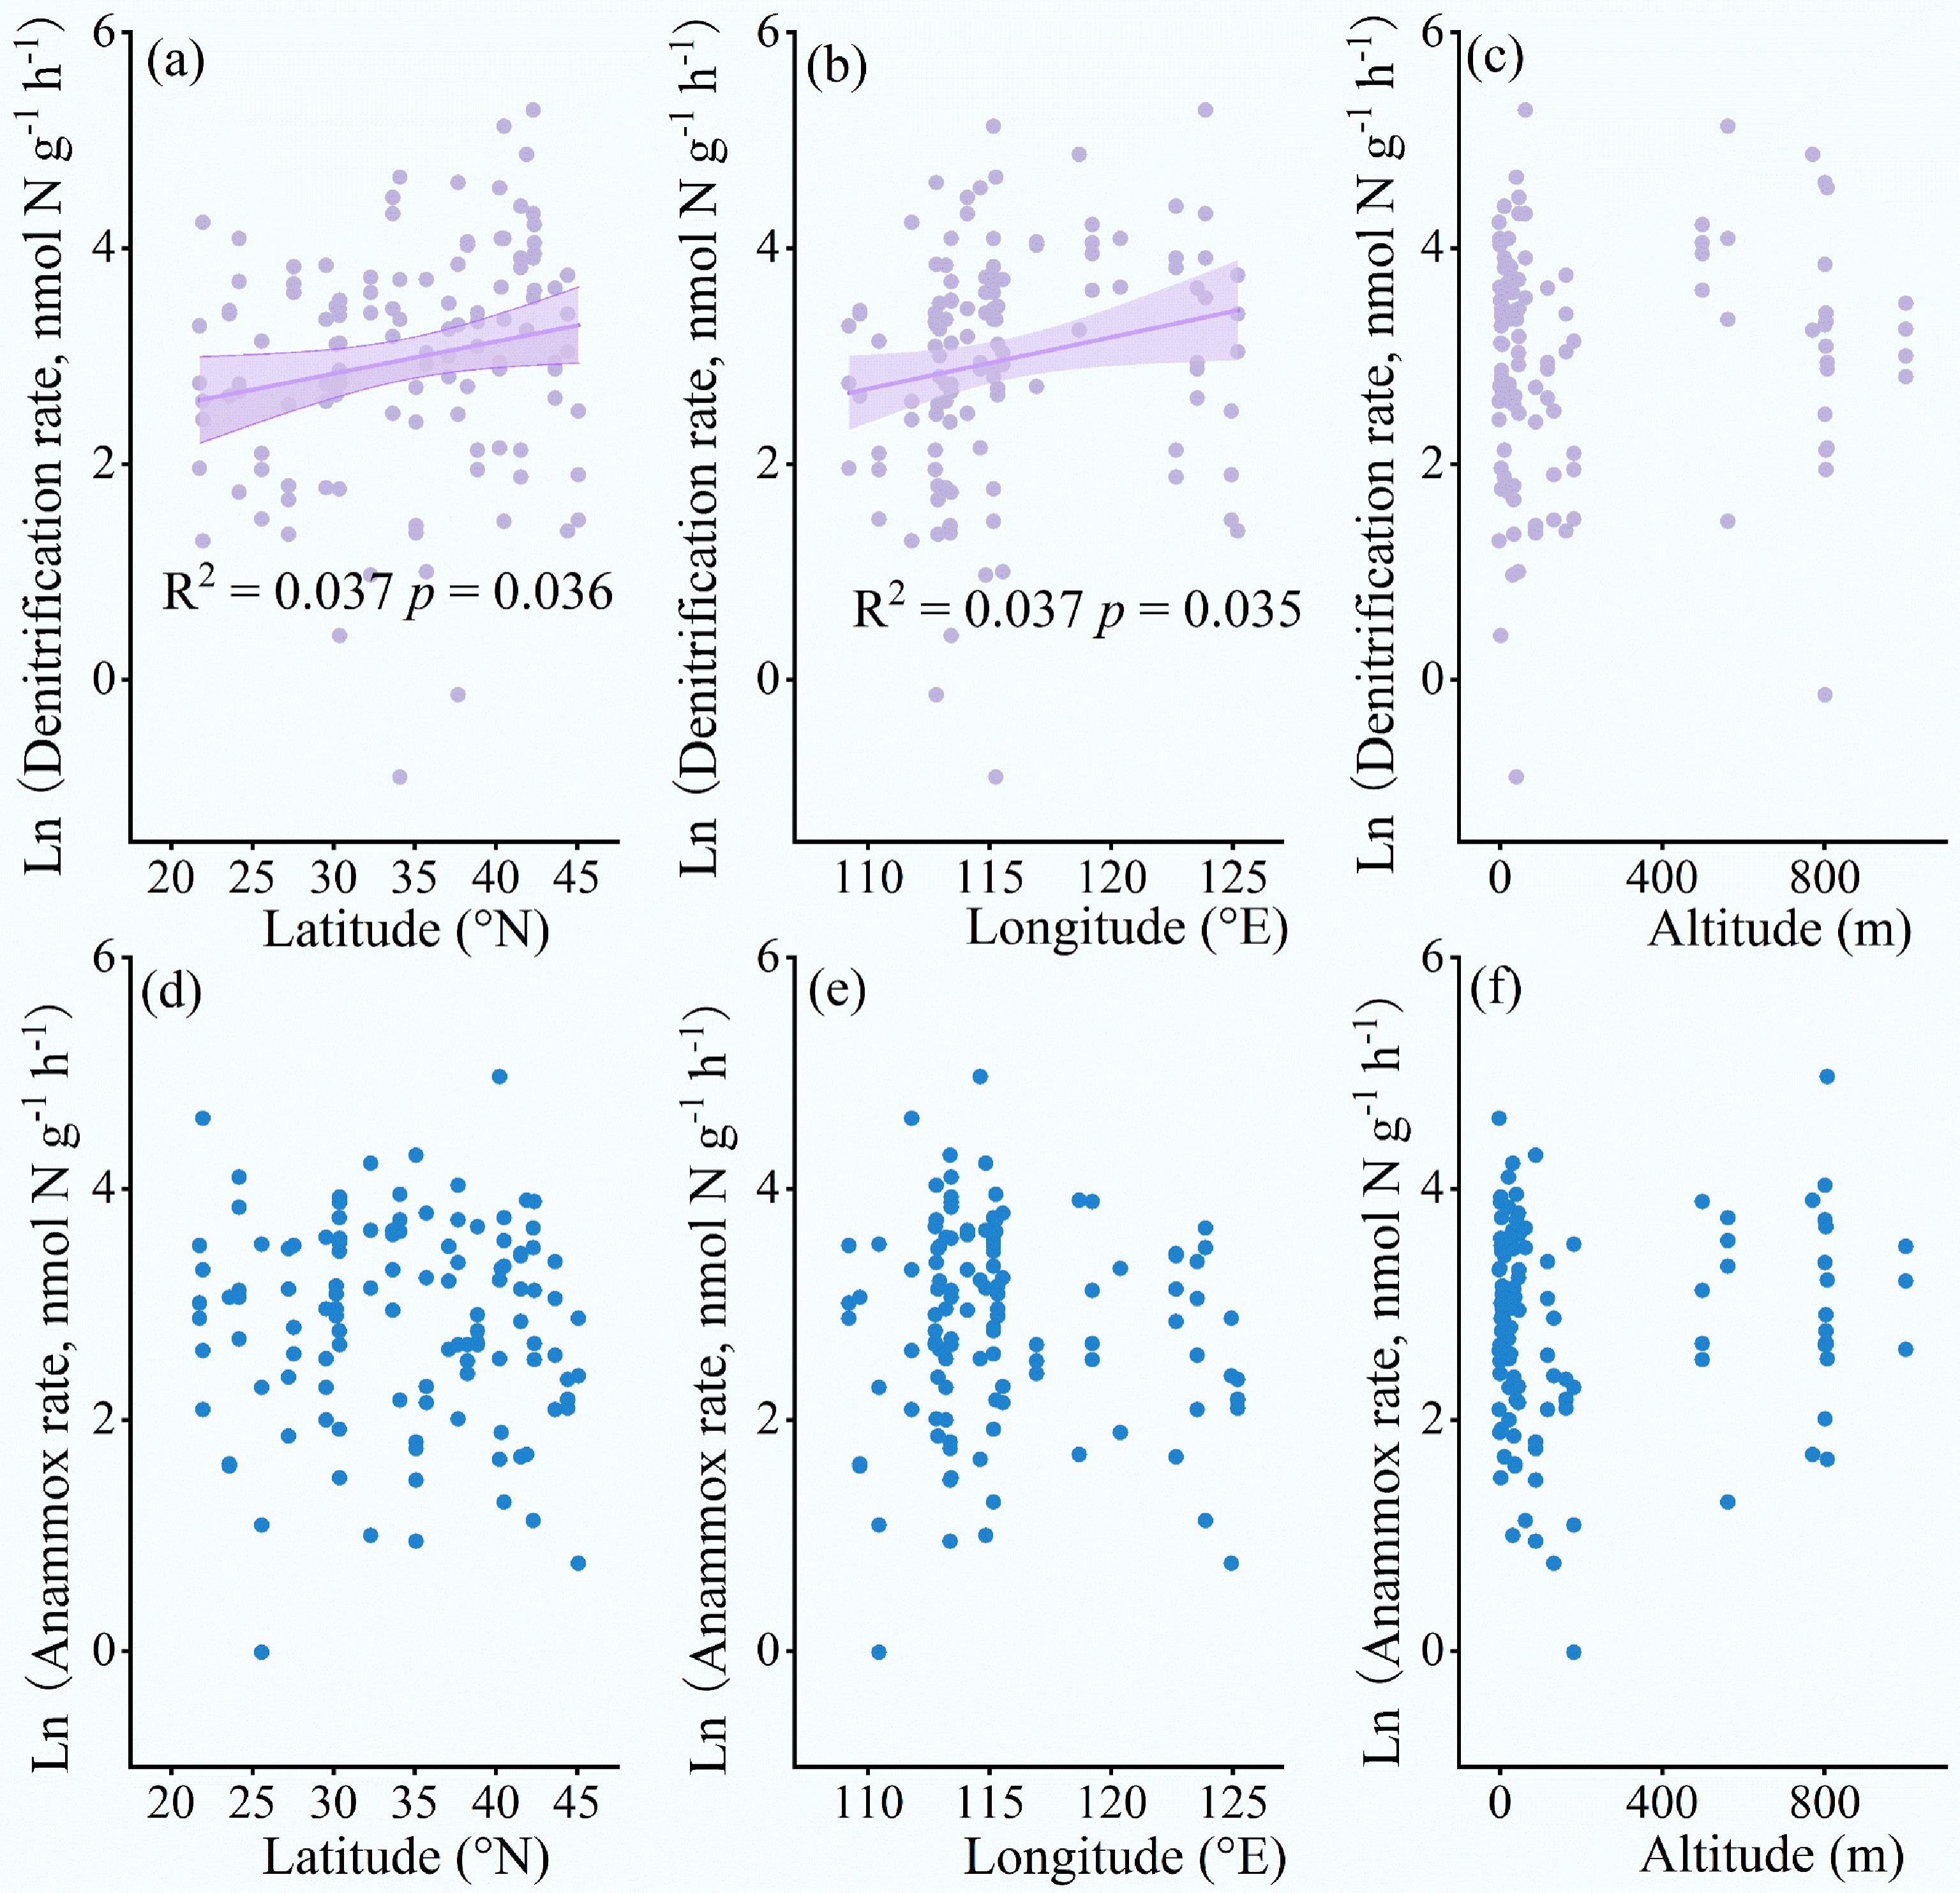
Figure 3.
(a)−(f) Relationships between denitrification and anammox rates and geographic variables (latitude, longitude, and altitude). The purple lines are the slopes from the linear regression models, while the purple shadings are the 95% confidence intervals.
-
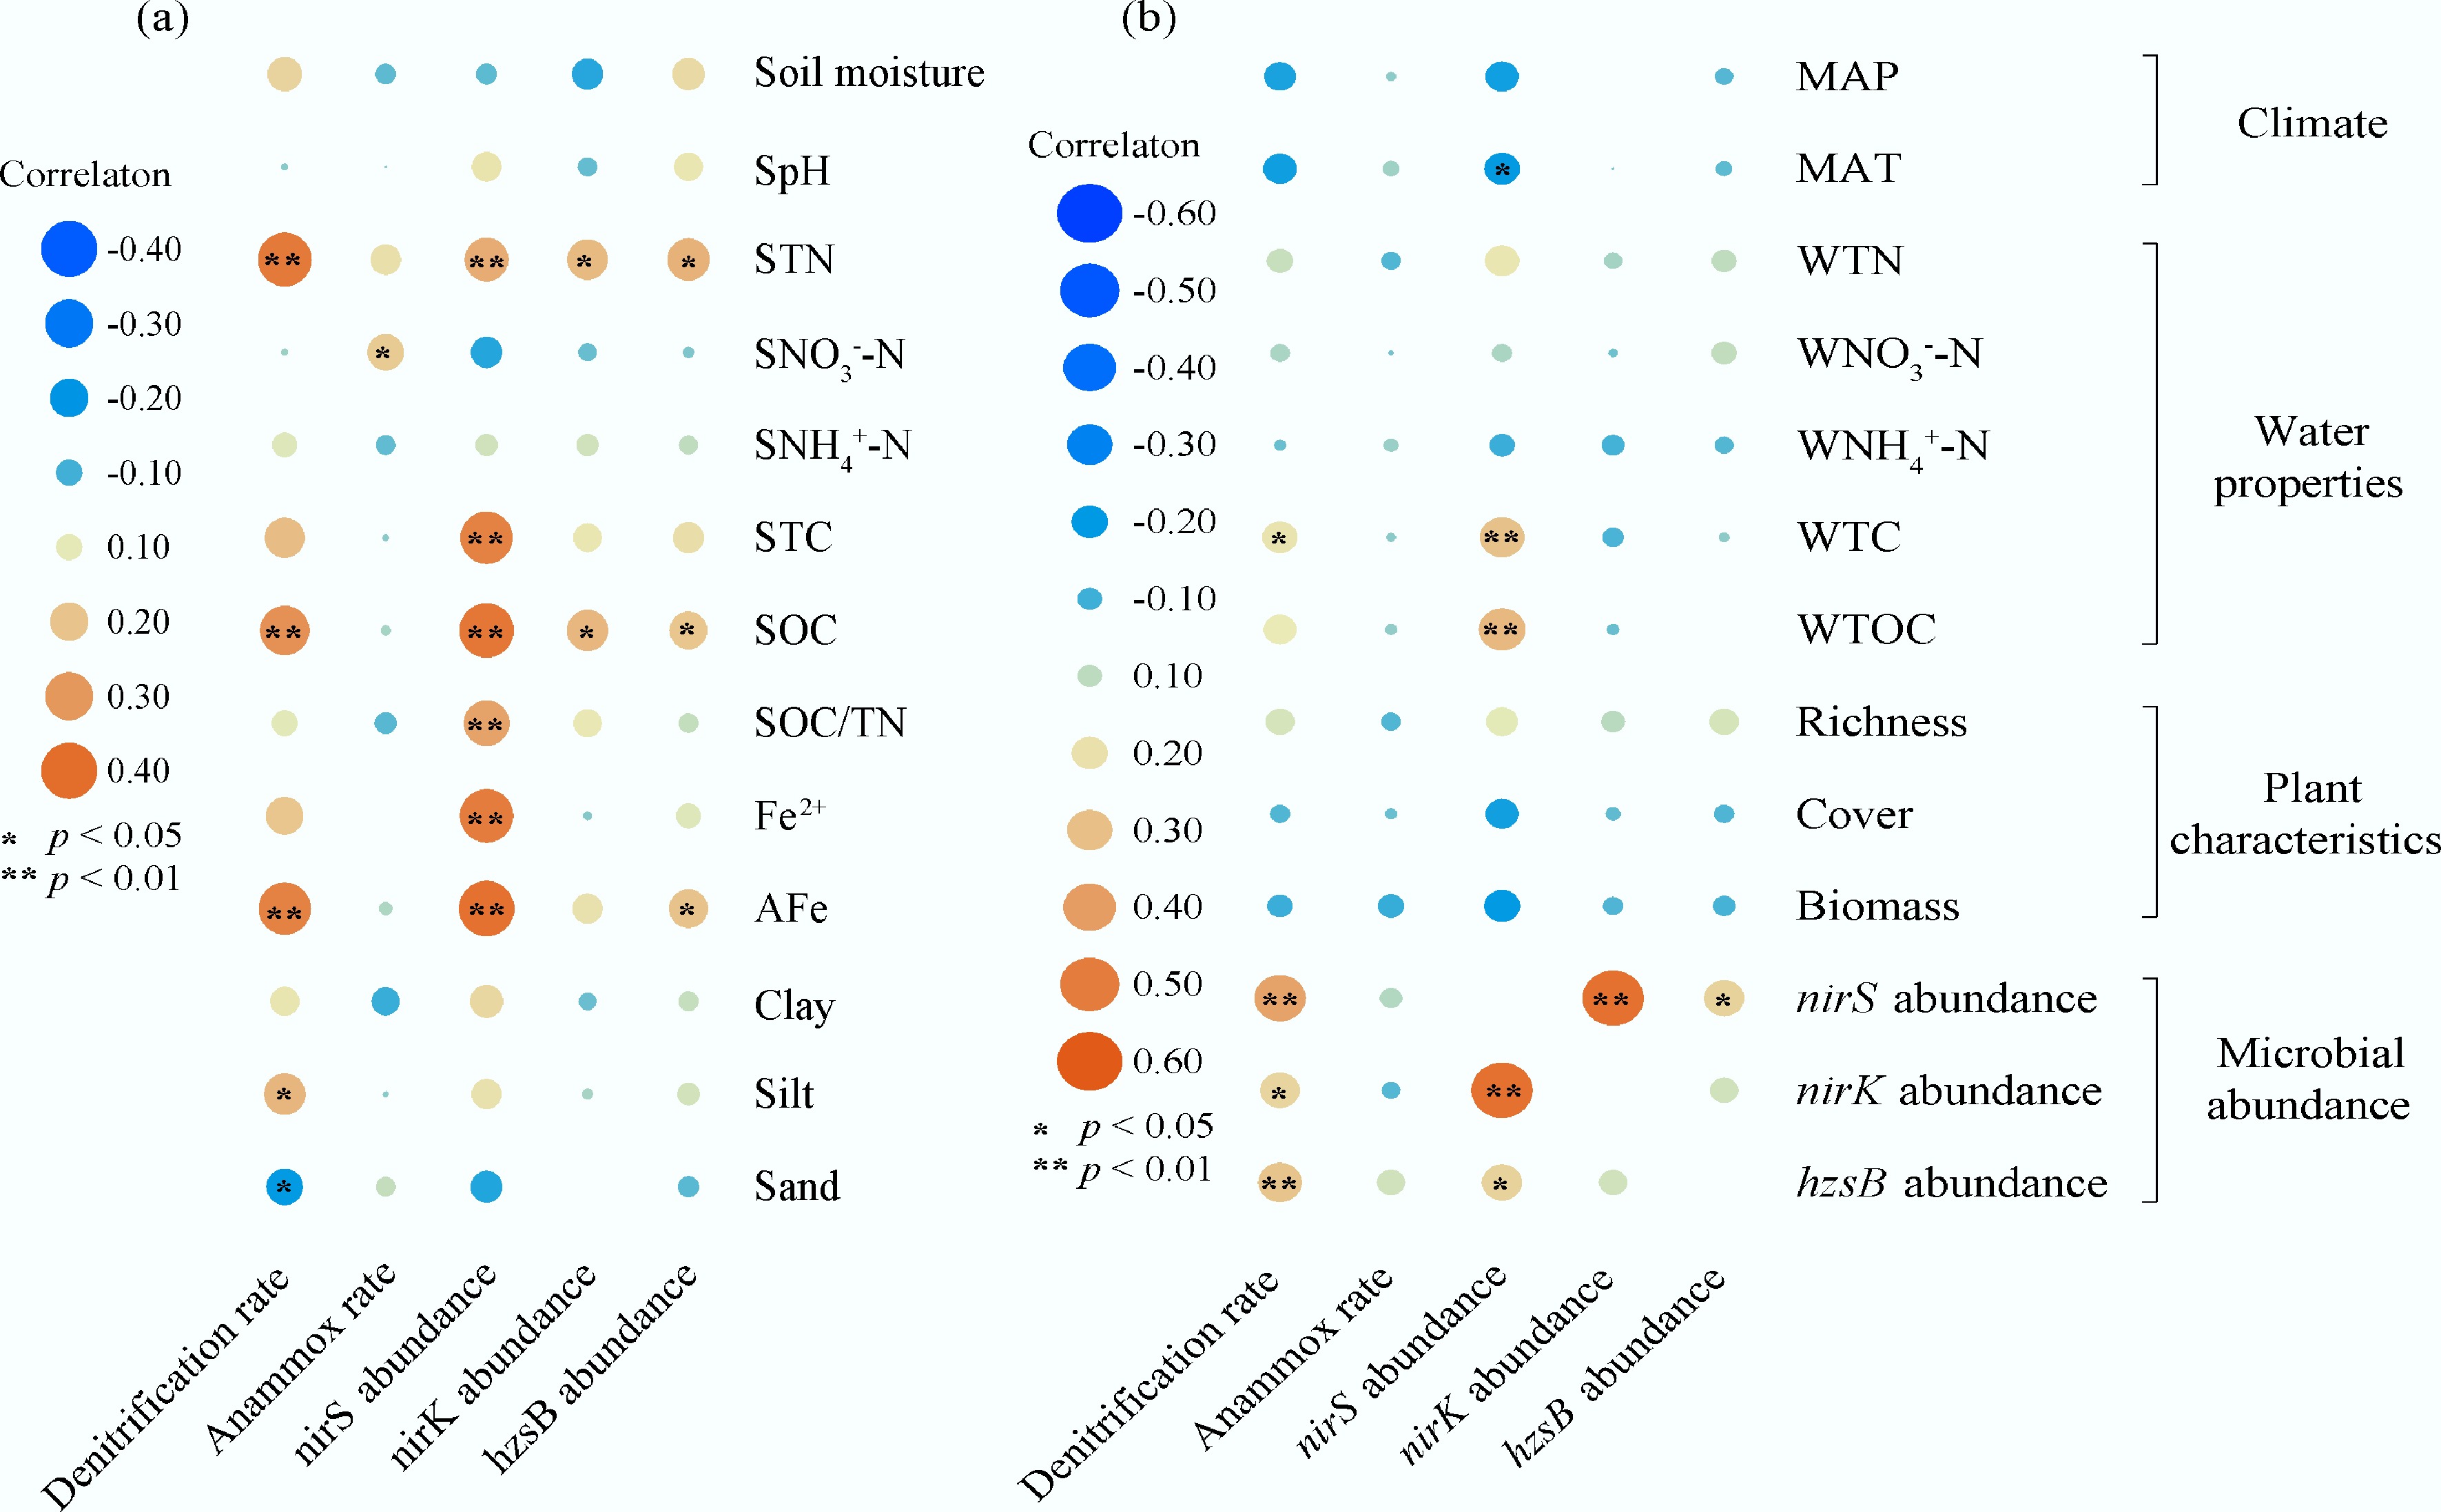
Figure 4.
Pearson correlation coefficients between denitrification rates, anammox rates, and the abundances of nirS, nirK, and hzsB genes with abiotic and biological variables across all soil types. (a) Soil physicochemical properties. (b) Climate variables, water properties, plant characteristics, and microbial abundance.
-
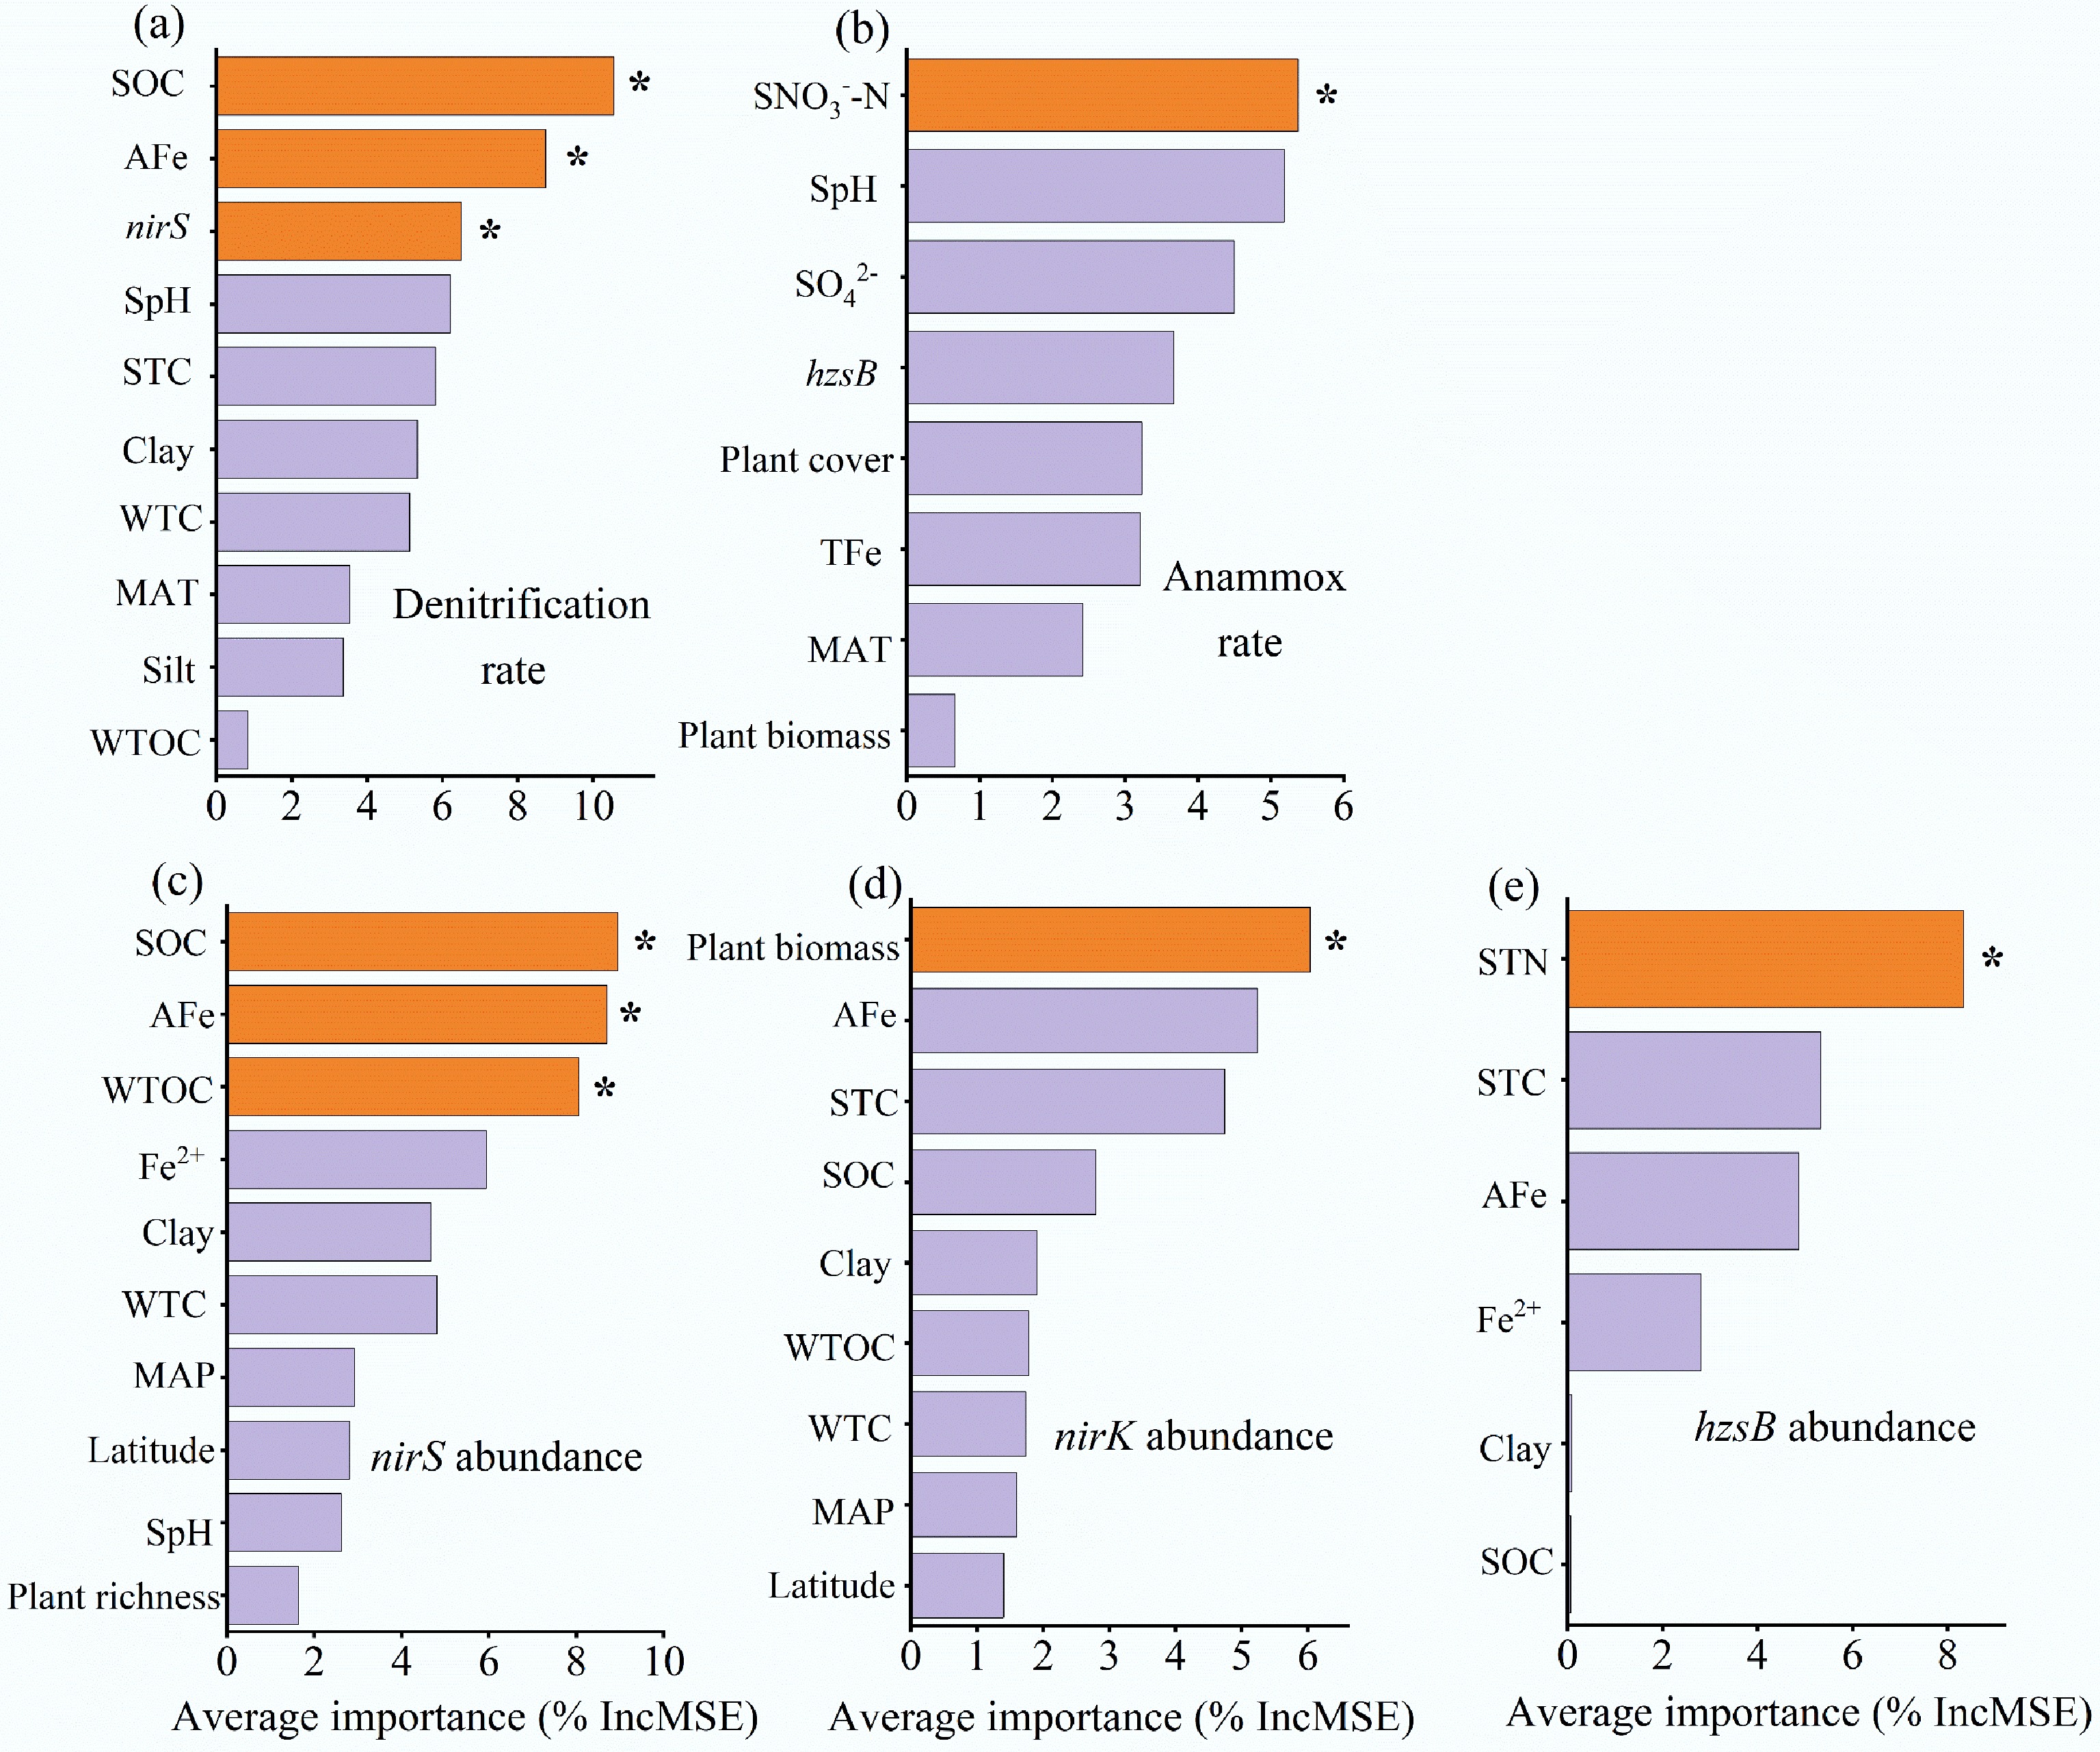
Figure 5.
(a)−(e) Relative importance of the main predictive factors in explaining denitrification rates, anammox rates, and the abundances of nirS, nirK, and hzsB genes. * Indicate variables with significant importance (p < 0.05).
-
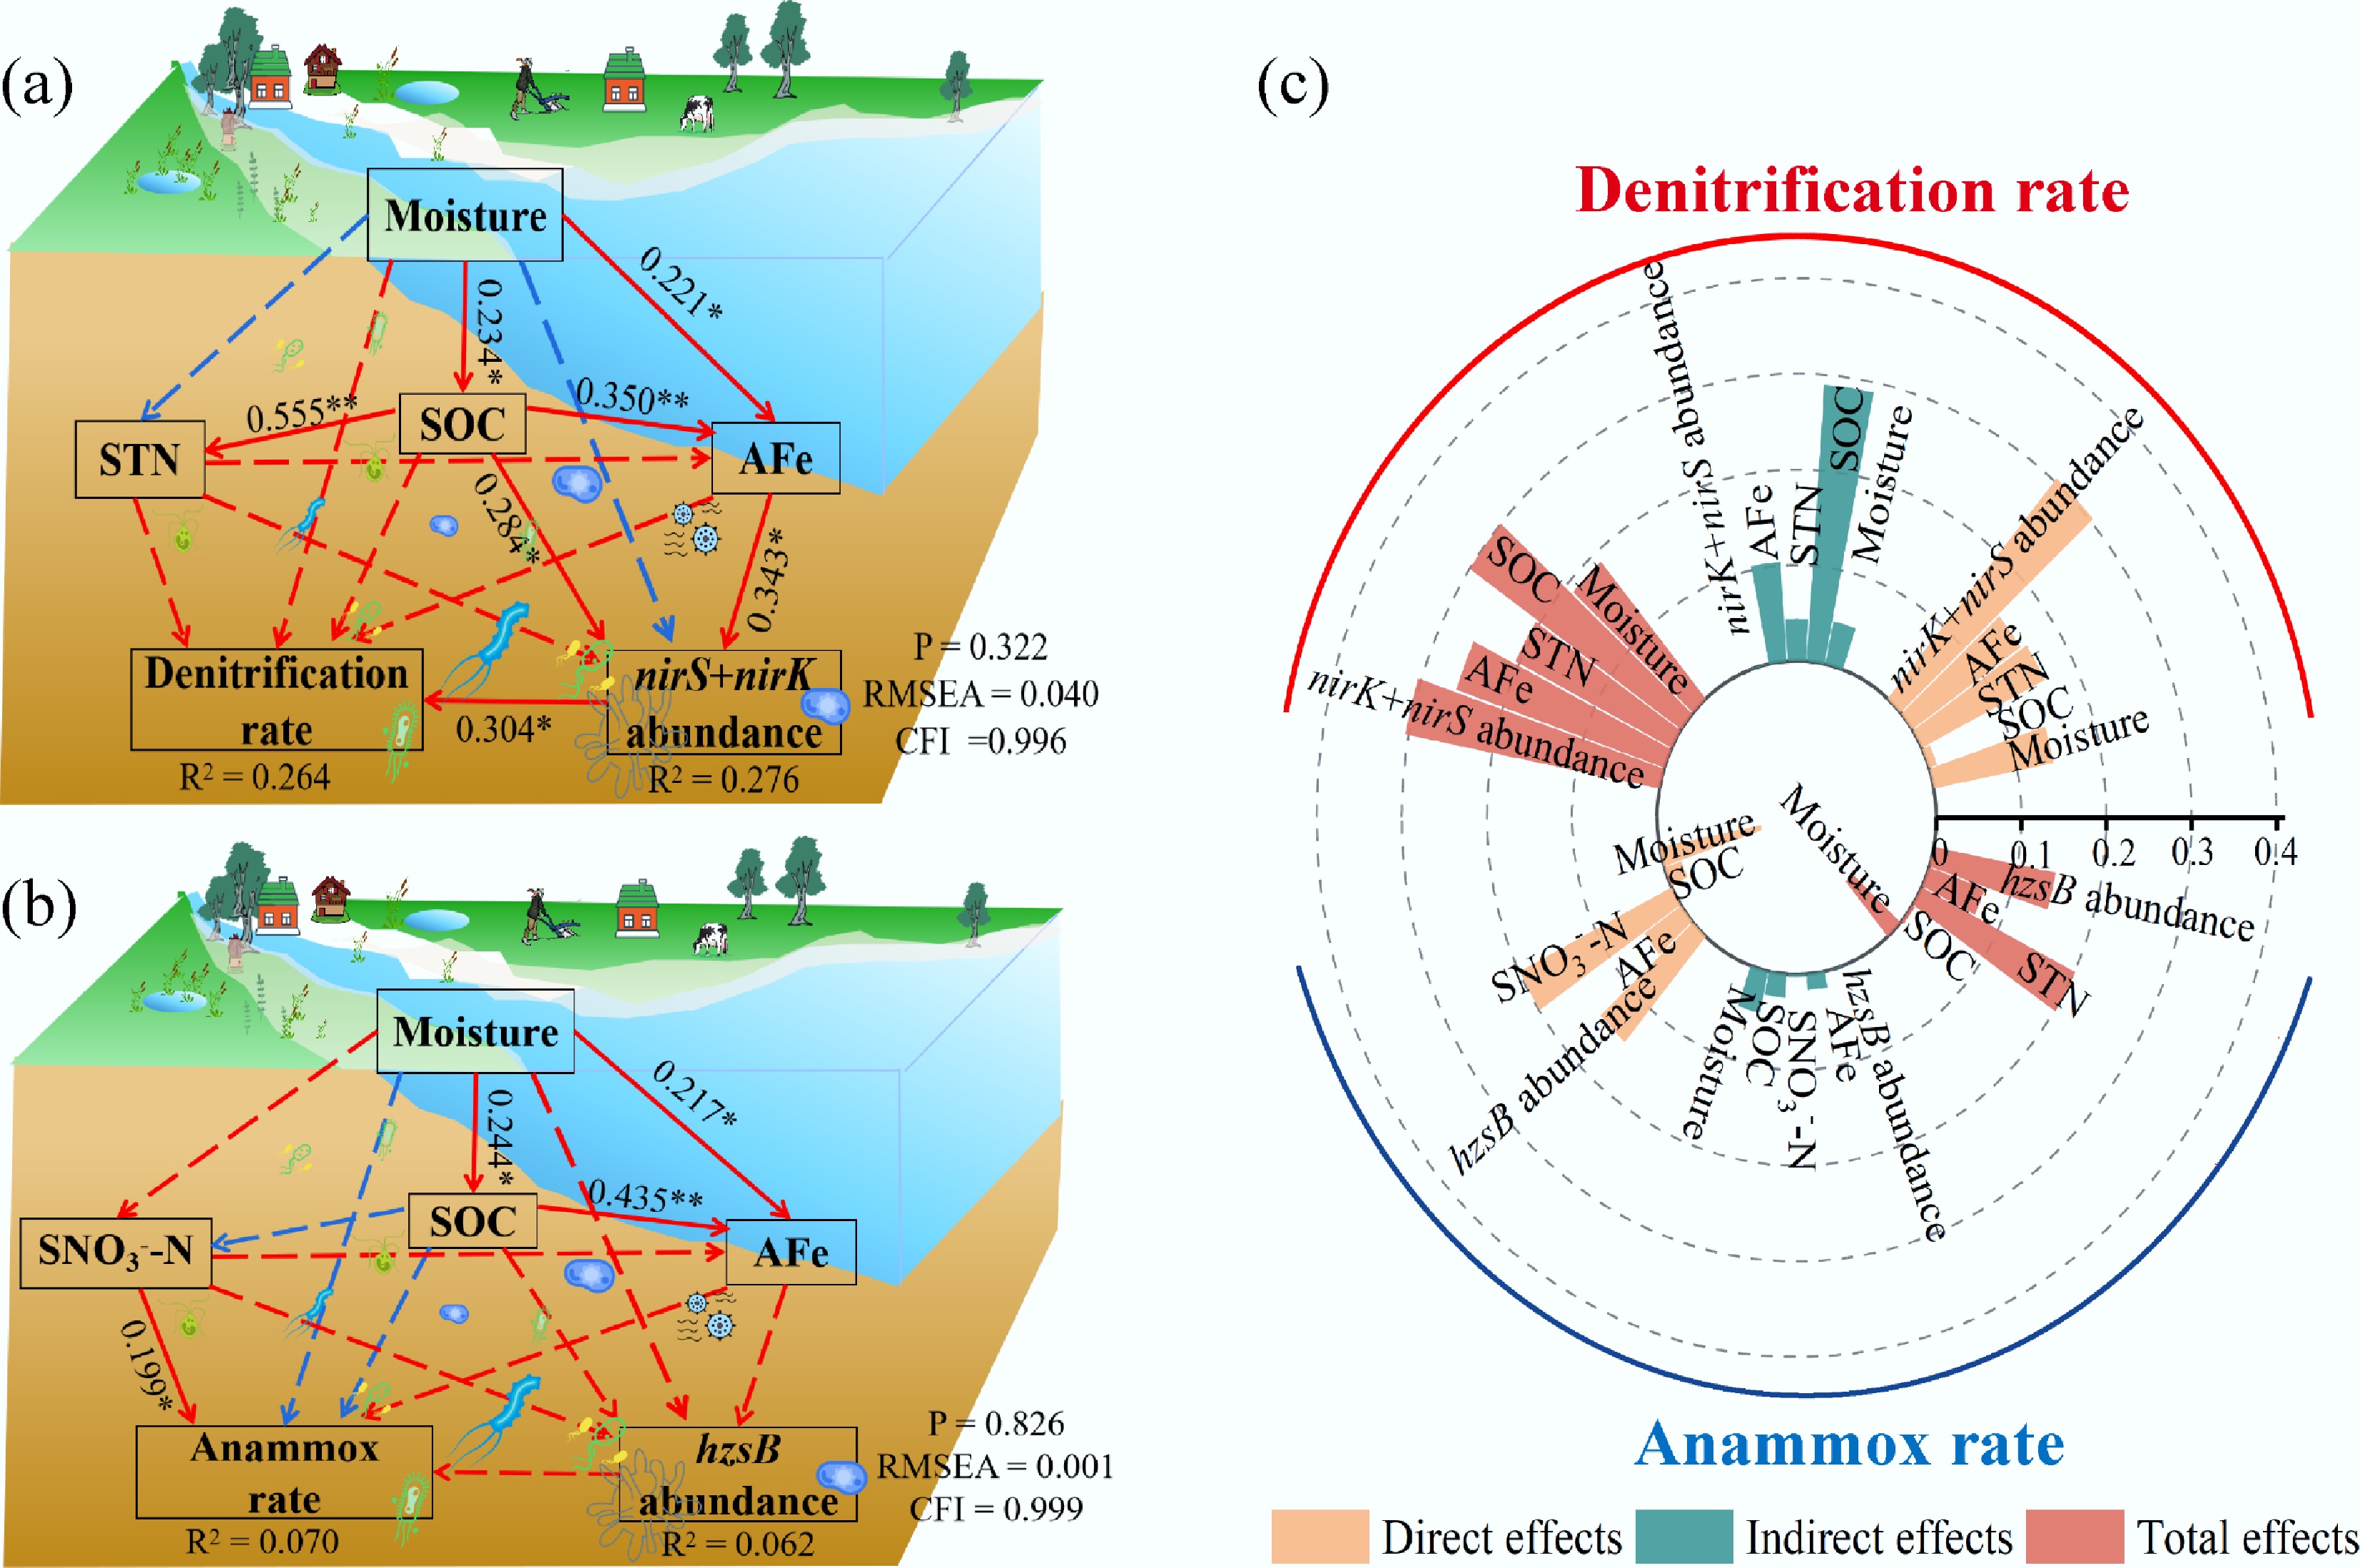
Figure 6.
Structural equation models illustrating the direct and indirect effects of selected variables on (a) denitrification rates, and (b) anammox rates. (c) Shows the direct, indirect, and total effects of these variables on denitrification and anammox rates, respectively. Red and blue arrows indicate positive and negative effects, respectively. Solid and dashed lines represent significant and nonsignificant paths, respectively. Numbers next to the arrows are standardized path coefficients (* p < 0.05, and ** p < 0.01).
Figures
(6)
Tables
(0)