-
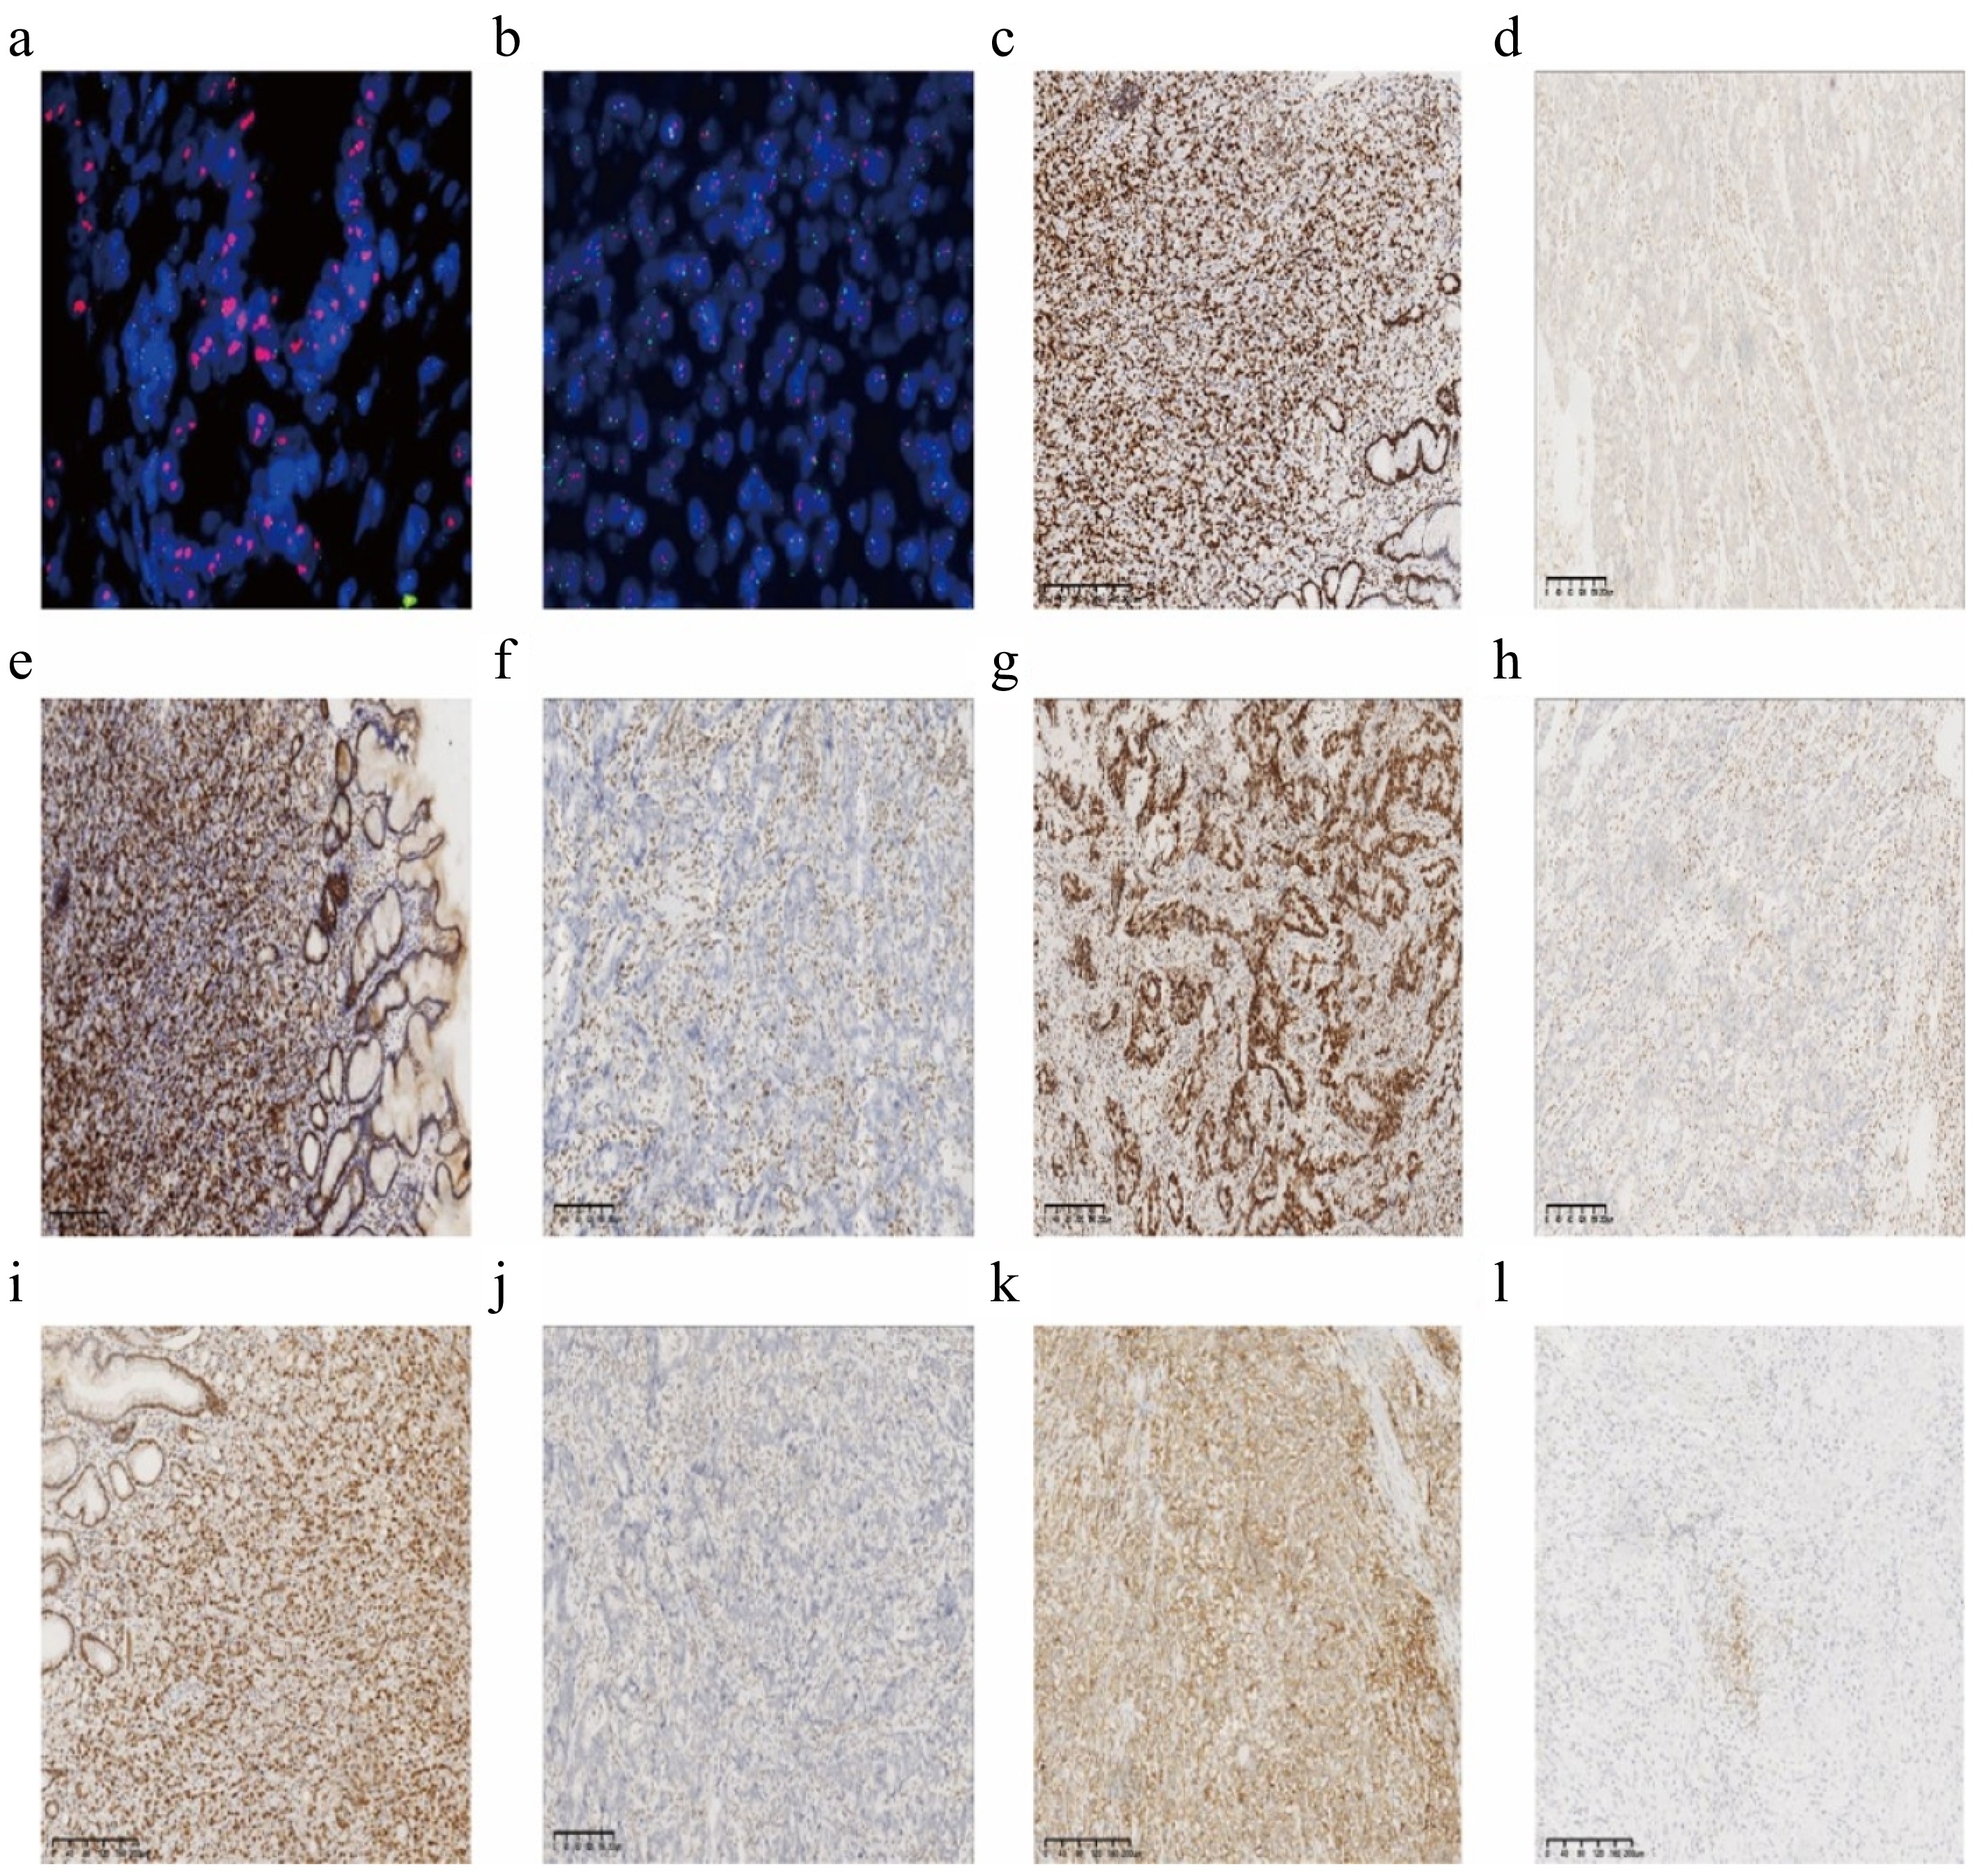
Figure 1.
Representative immunohistochemical staining in gastric adenocarcinoma. (a) ERBB2 amplification (HER-2 positive); (b) ERBB2 amplification was not obvious (HER-2 negative); (c) expression of MLH1 protein; (d) deletion of MLH1 protein; (e) expression of MSH2 protein; (f) deletion of MSH2 protein; (g) expression of MSH6 protein; (h) deletion of MSH6 protein; (i) expression of PMS2 protein; (j) deletion of PMS2 protein; (k) positive PD-L1 (CPS ≥ 5); (l) PD-L1 negative (CPS < 5). Scale = 200 μm.
-
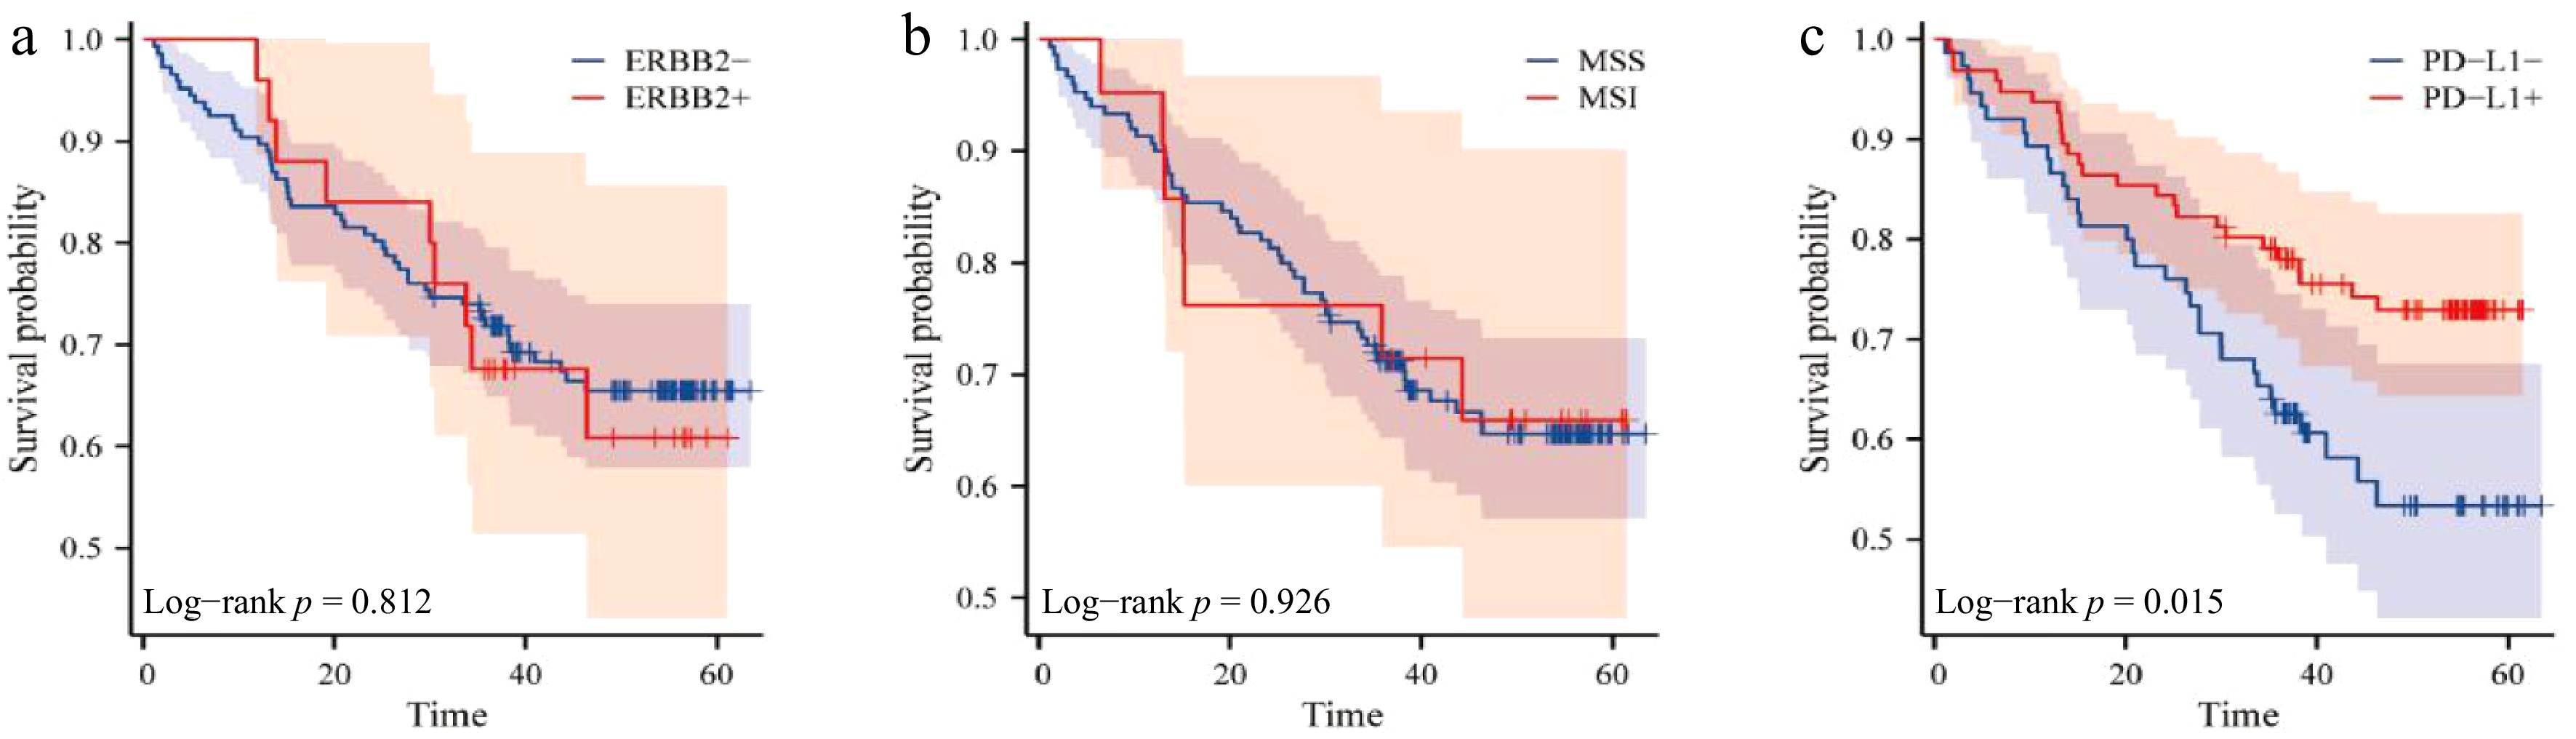
Figure 2.
The relationship between ERBB2, microsatellite status, PD-L1 expression, and prognosis of patients. (a) Survival curve of ERBB2 expression and prognosis; (b) survival curve of microsatellite status and prognosis; (c) survival curve of PD-L1 expression and prognosis.
-
Target protein Company Product name Item No. Batch No. Clone No. Antibody type PMS2 Beijing Zhongshan Jinqiao Biotechnology PMS2 protein ZM-0407 24090414 OTI4B2 Mouse monoclonal MSH2 Beijing Zhongshan Jinqiao Biotechnology MSH2 protein ZA-0702 25012033 OTIR1B12 Rabbit monoclonal MSH6 Beijing Zhongshan Jinqiao Biotechnology MSH6 protein ZM-0367 24111703 UMAB258 Mouse monoclonal MLH1 Beijing Zhongshan Jinqiao Biotechnology MLH1 protein ZM-0152 24112706 OTI4H4 Mouse monoclonal HER-2 Roche Diagnostics GmbH HER-2/NEU antibody reagent (IHC method) − (10) M22565 − − PD-L1 Dako Monoclonal Mouse Anti-PD-L1, Clone 22C3 − 11756940 22C3 Mouse monoclonal Table 1.
Antibodies and reagents used in the study.
-
Clinicopathological features ERBB2(−)
(n = 150)ERBB2(+)
(n = 26)χ2 p-value Gender 1.997 0.158 Male 107 (71.33%) 22 (84.62%) Female 43 (28.67%) 4 (15.38%) Age 0.798 0.372 < 65 66 (44.00%) 9 (34.62%) ≥ 65 84 (56.00%) 17 (65.38%) Differentiation degree 8.935 0.047 High differentiated 3 (2.00%) 0 (0%) Moderately differentiated 54 (36.00%) 13 (50.00%) Poorly differentiated 73 (48.67%) 6 (23.08%) Signet ring cell 4 (2.67%) 0 (0%) NA 16 (10.67%) 7 (26.92%) Surgery 2.618 0.270 Initial surgery 135 (90.00%) 21 (80.77%) Neoadjuvant post-surgery 5 (3.33%) 2 (7.69%) None 10 (6.67%) 3 (11.54%) T stage 1.719 0.622 T1 14 (9.33%) 1 (3.85%) T2 39 (26.00%) 8 (30.77%) T3 81 (54.00%) 16 (61.54%) T4 16 (10.67%) 1 (3.85%) N stage 1.881 0.610 N0 52 (34.67%) 7 (26.92) N1 24 (16.00%) 6 (23.08%) N2 36 (24.00%) 8 (30.77%) N3 38 (25.33%) 5 (19.23%) M stage 0.151* M0 137 (91.33%) 21 (80.77%) M1 13 (8.67%) 5 (19.23%) * Fisher's exact test was used for M stage analysis. Table 2.
Relationship between ERBB2 gene amplification and clinicopathological features.
-
Clinicopathological features pMMR
(n = 154)dMMR
(n = 22)χ2 p-value Gender 13.473 <0.001 Male 120 (77.92%) 9 (40.91%) Female 34 (22.08%) 13 (59.09%) Age 0.083 0.773 < 65 65 (42.21%) 10 (45.45%) ≥ 65 89 (57.79%) 12 (54.55%) Differentiation degree 11.385 0.011 High differentiated 2 (1.30%) 1 (4.55%) Moderately differentiated 53 (34.42%) 14 (63.64%) Poorly differentiated 75 (48.70%) 4 (18.18%) Signet ring cell 3 (1.95%) 1 (4.55%) NA 21 (13.64%) 2 (9.09%) Surgery 0.535 0.861 Initial surgery 135 (87.66%) 21 (95.45%) Neoadjuvant post-surgery 7 (4.55%) 0 (0%) None 12 (7.79%) 1 (4.55%) T stage 6.253 0.069 T1 11 (7.14%) 4 (18.18%) T2 39 (25.32%) 8 (36.36%) T3 87 (56.49%) 10 (45.45%) T4 17 (11.04%) 0 (0%) N stage 4.507 0.208 N0 47 (30.52%) 12 (54.54%) N1 27 (17.53%) 3 (13.64%) N2 40 (25.97%) 4 (18.18%) N3 40 (25.97%) 3 (13.64%) M stage 1.000* M0 138 (89.61%) 20 (90.91%) M1 16 (10.39%) 2 (9.09%) * Fisher's exact test was used for M stage analysis. Table 3.
Relationship between mismatch repair (MMR) gene status and clinicopathological features.
-
Clinicopathological
featuresERBB2(−)
(n = 150)ERBB2(+)
(n = 26)χ2 p-value Mismatch repair status 0.206* pMMR 129 (86.00%) 25 (96.15%) dMMR 21 (14.00%) 1 (3.85%) * Fisher's exact test was used for statistical analysis. Table 4.
Association between ERBB2 expression and mismatch repair status.
-
Clinicopathological features Events
(n)Mean DFS
(months) ± SDχ2 p-value ERBB2 status 0.057 0.812 Negative (−) 48 40.312 ± 17.40 Positive (+) 9 38.003 ± 13.73 MMR status 0.009 0.926 pMMR 50 40.67 ± 14.36 dMMR 7 40.18 ± 14.49 PD-L1 expression 5.898 0.015* Negative (−) 32 41.08 ± 17.27 Positive (+) 25 40.31 ± 17.40 * p < 0.05 indicates statistical significance. Table 5.
Association of ERBB2, MMR, and PD-L1 expression with patient prognosis.
Figures
(2)
Tables
(5)