-
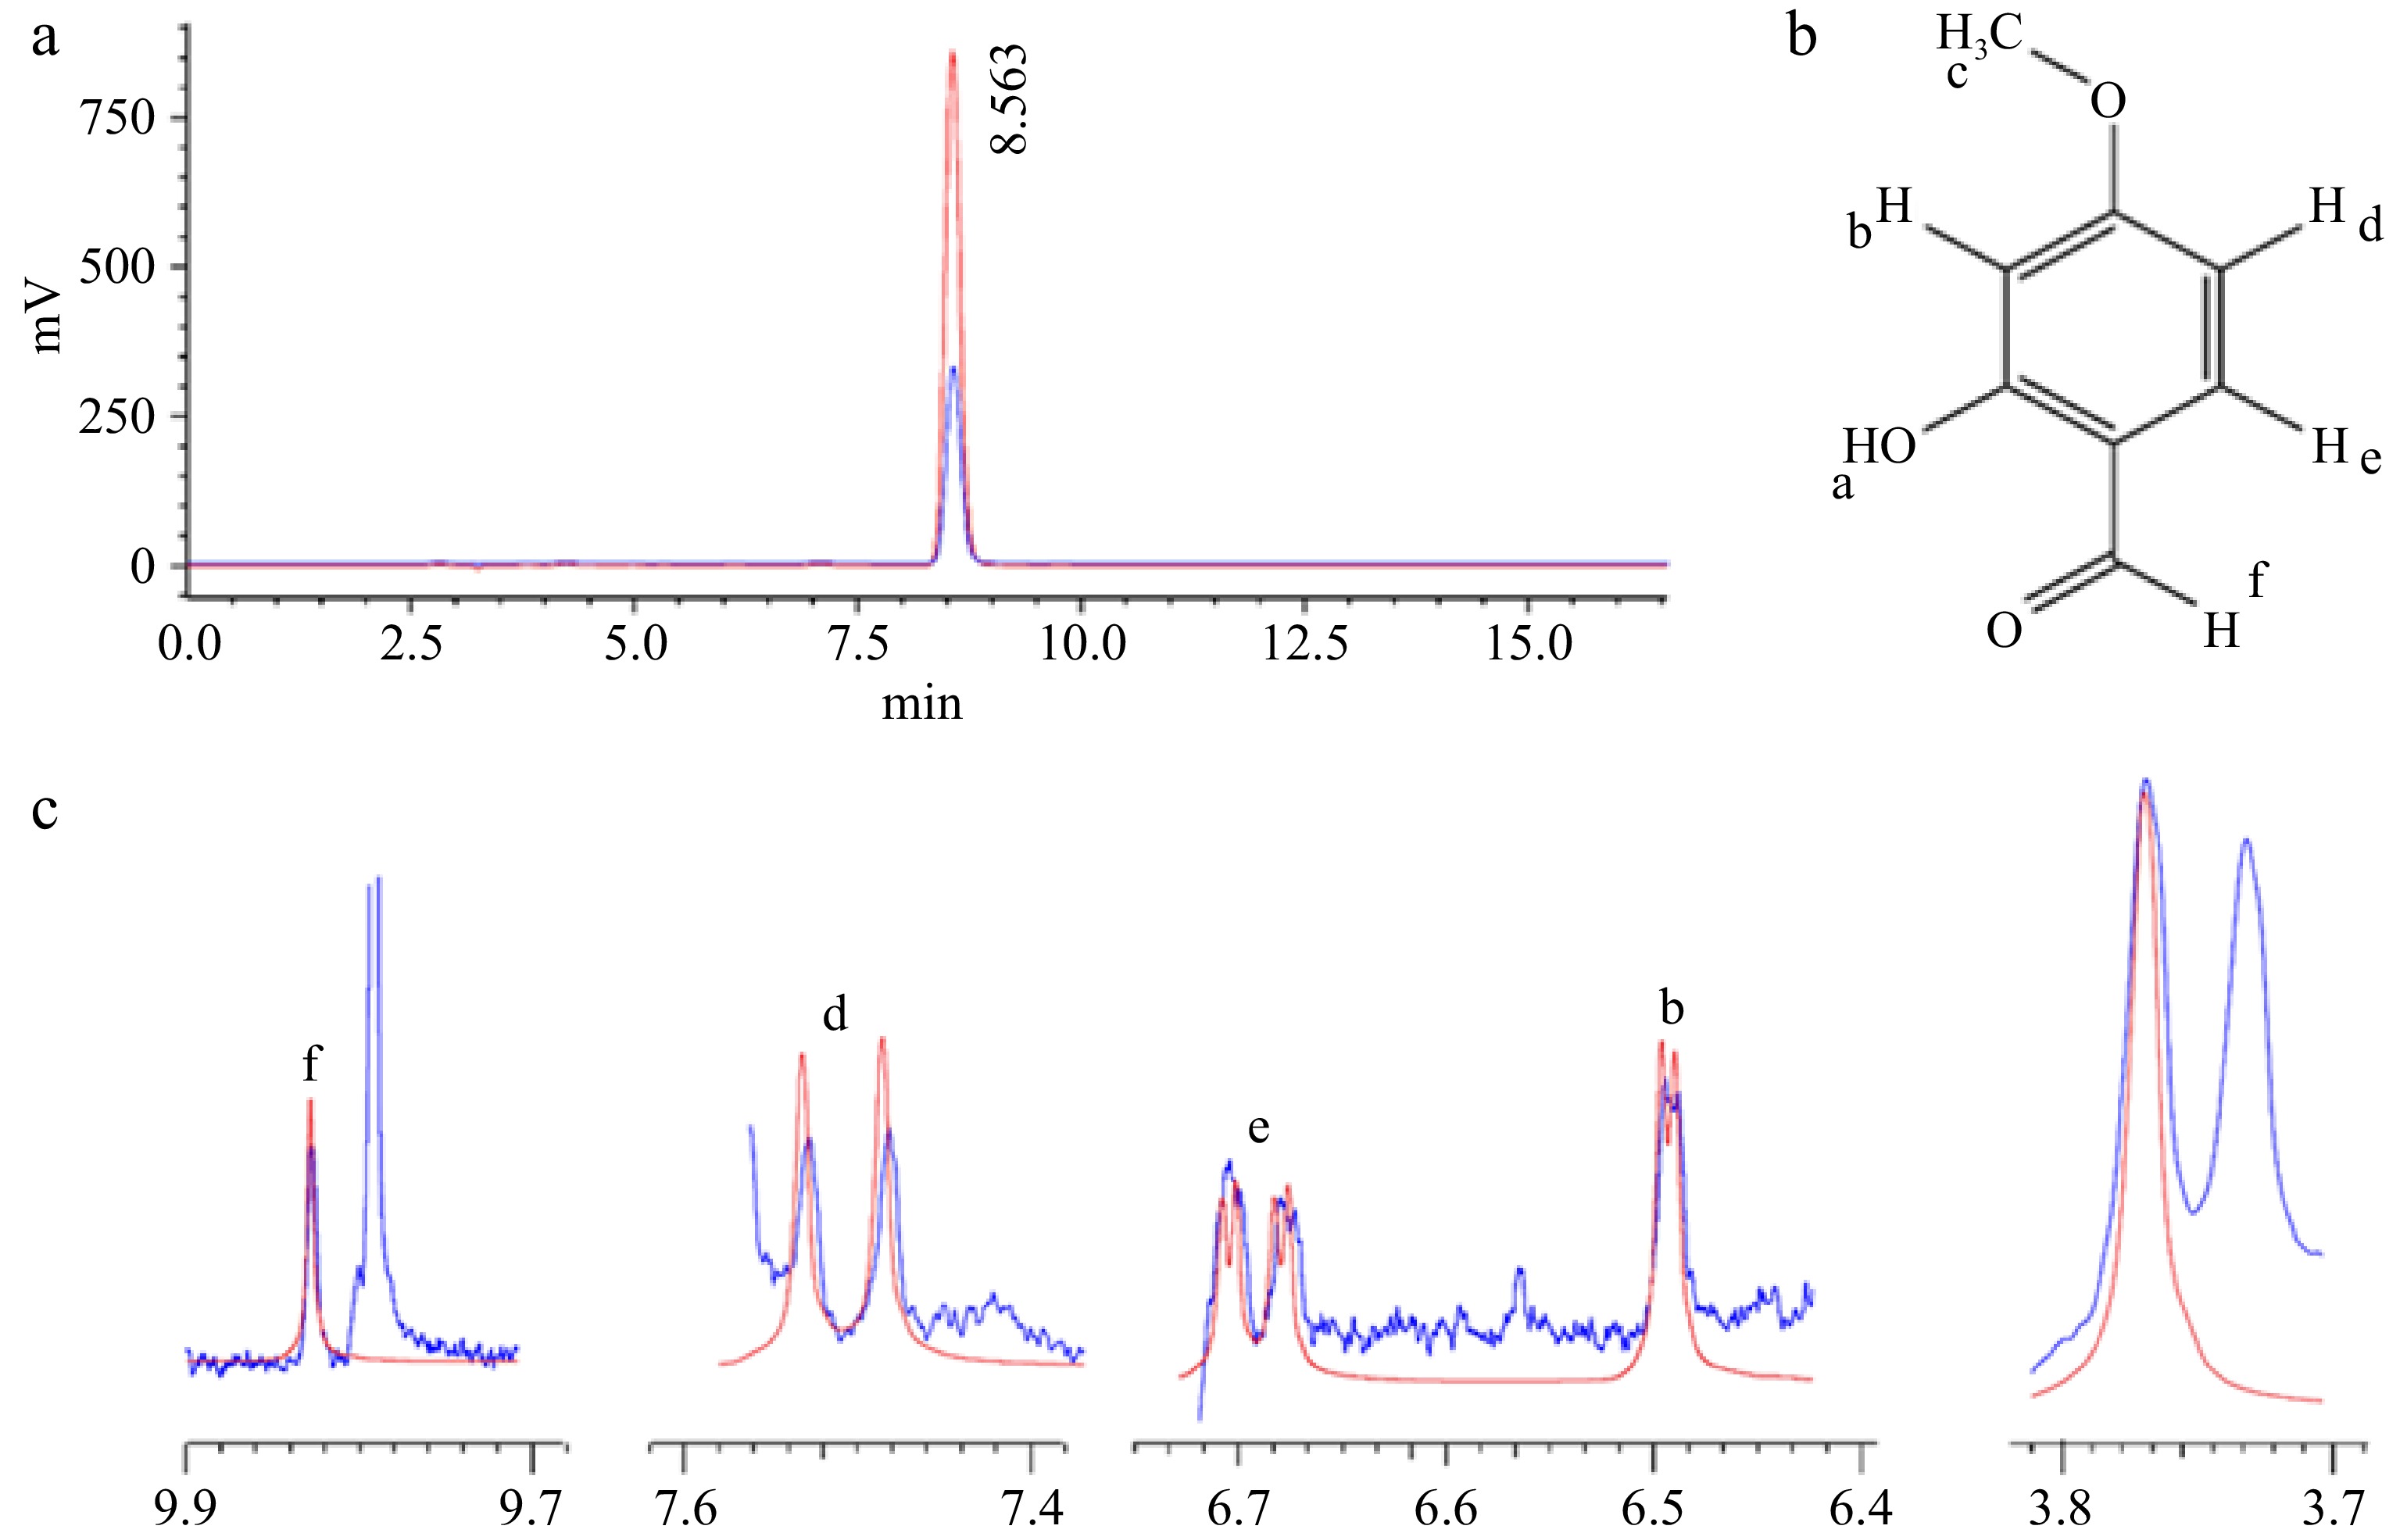
Figure 1.
HPLC and 1H-NMR spectra of the vanillin flavor molecule 2H4MB. A: HPLC chromatogram of the standard (red) and the spray-dried sodium caseinate sample (blue). B: Structure of 2H4MB. C: Overlay of the 1H-NMR spectrum of the standard 2H4MB and the spray-dried sodium caseinate sample (lowercase letters b, d, e, f indicate functional groups).
-
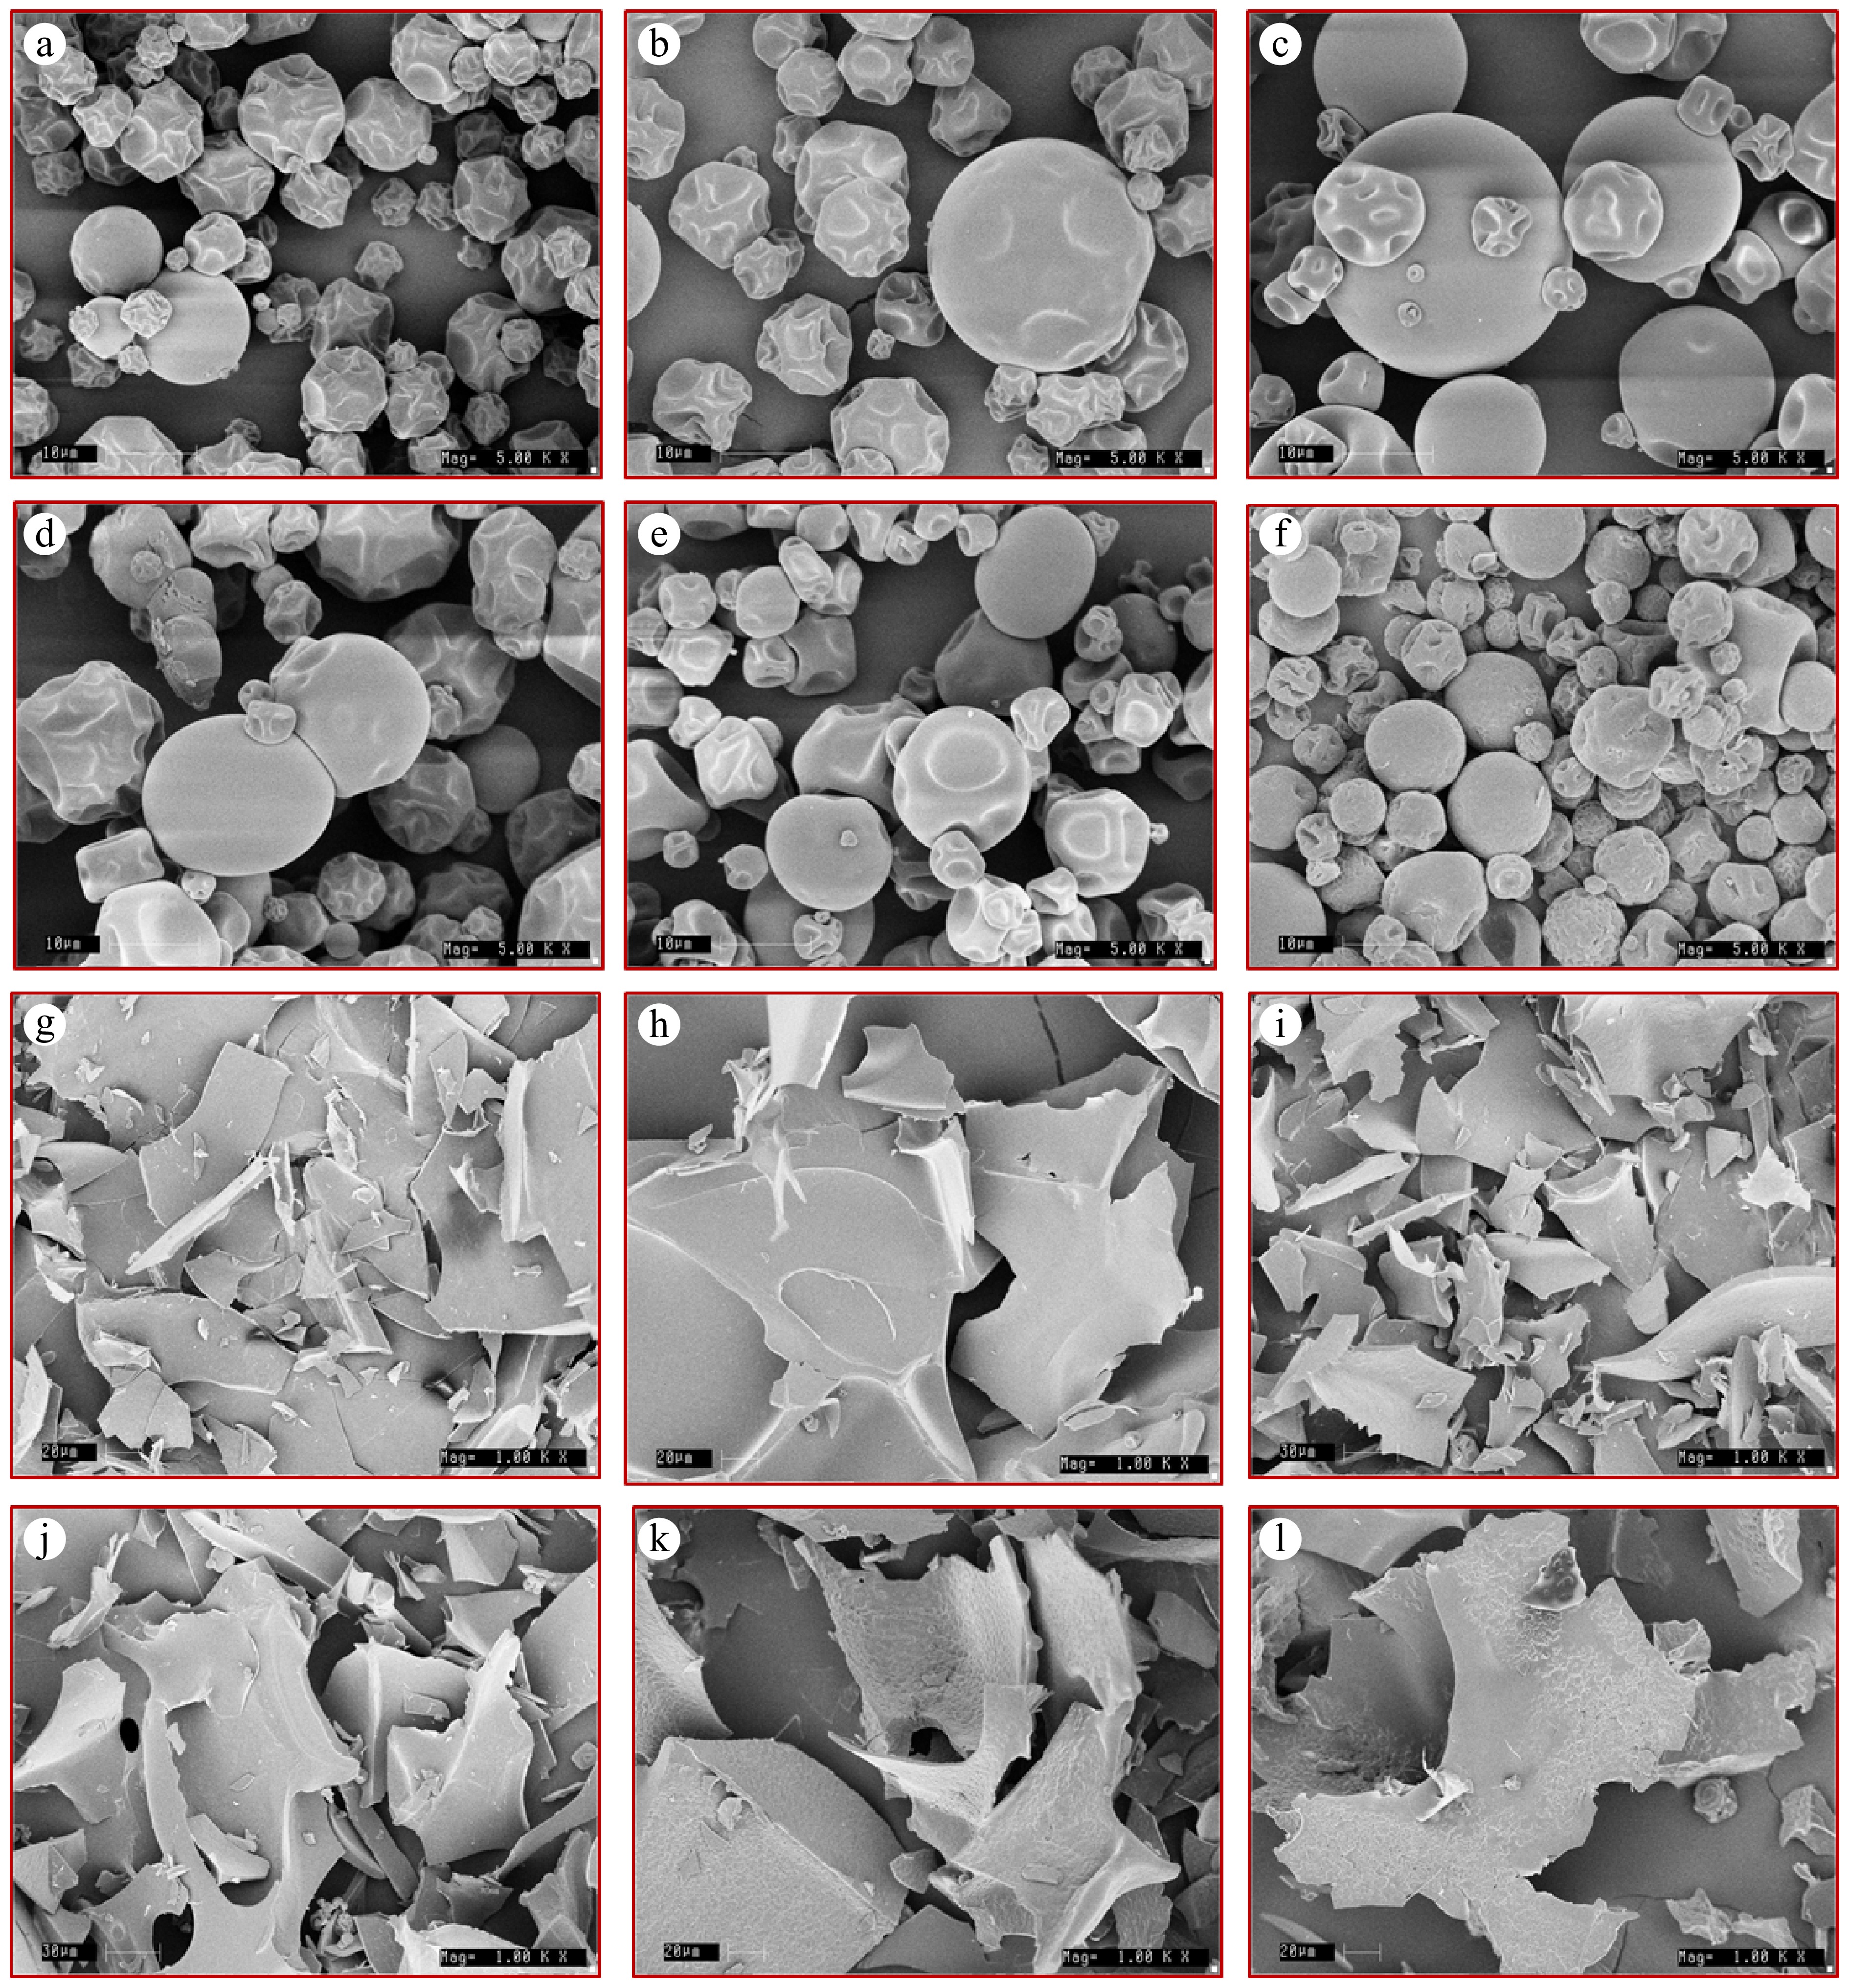
Figure 2.
Scanning electron microscopy images of microencapsulated powder prepared from aqueous extracts of D. hamiltonii tubers. Spray-dried samples at 5,000× magnification: (a) maltodextrin (MDX), (b) gum acacia (AC), (c) sodium caseinate (SC), (d) maltodextrin + gum acacia (MA), (e) maltodextrin + sodium caseinate (MS), (f) gum acacia + sodium caseinate (AS). Freeze-dried samples at 1,000× magnification (g–l): (g) maltodextrin (MDX), (h) gum acacia (AC), (i) sodium caseinate (SC), (j) maltodextrin + gum acacia (MA), (k) maltodextrin + sodium caseinate (MS), (l) gum acacia + sodium caseinate (AS).
-
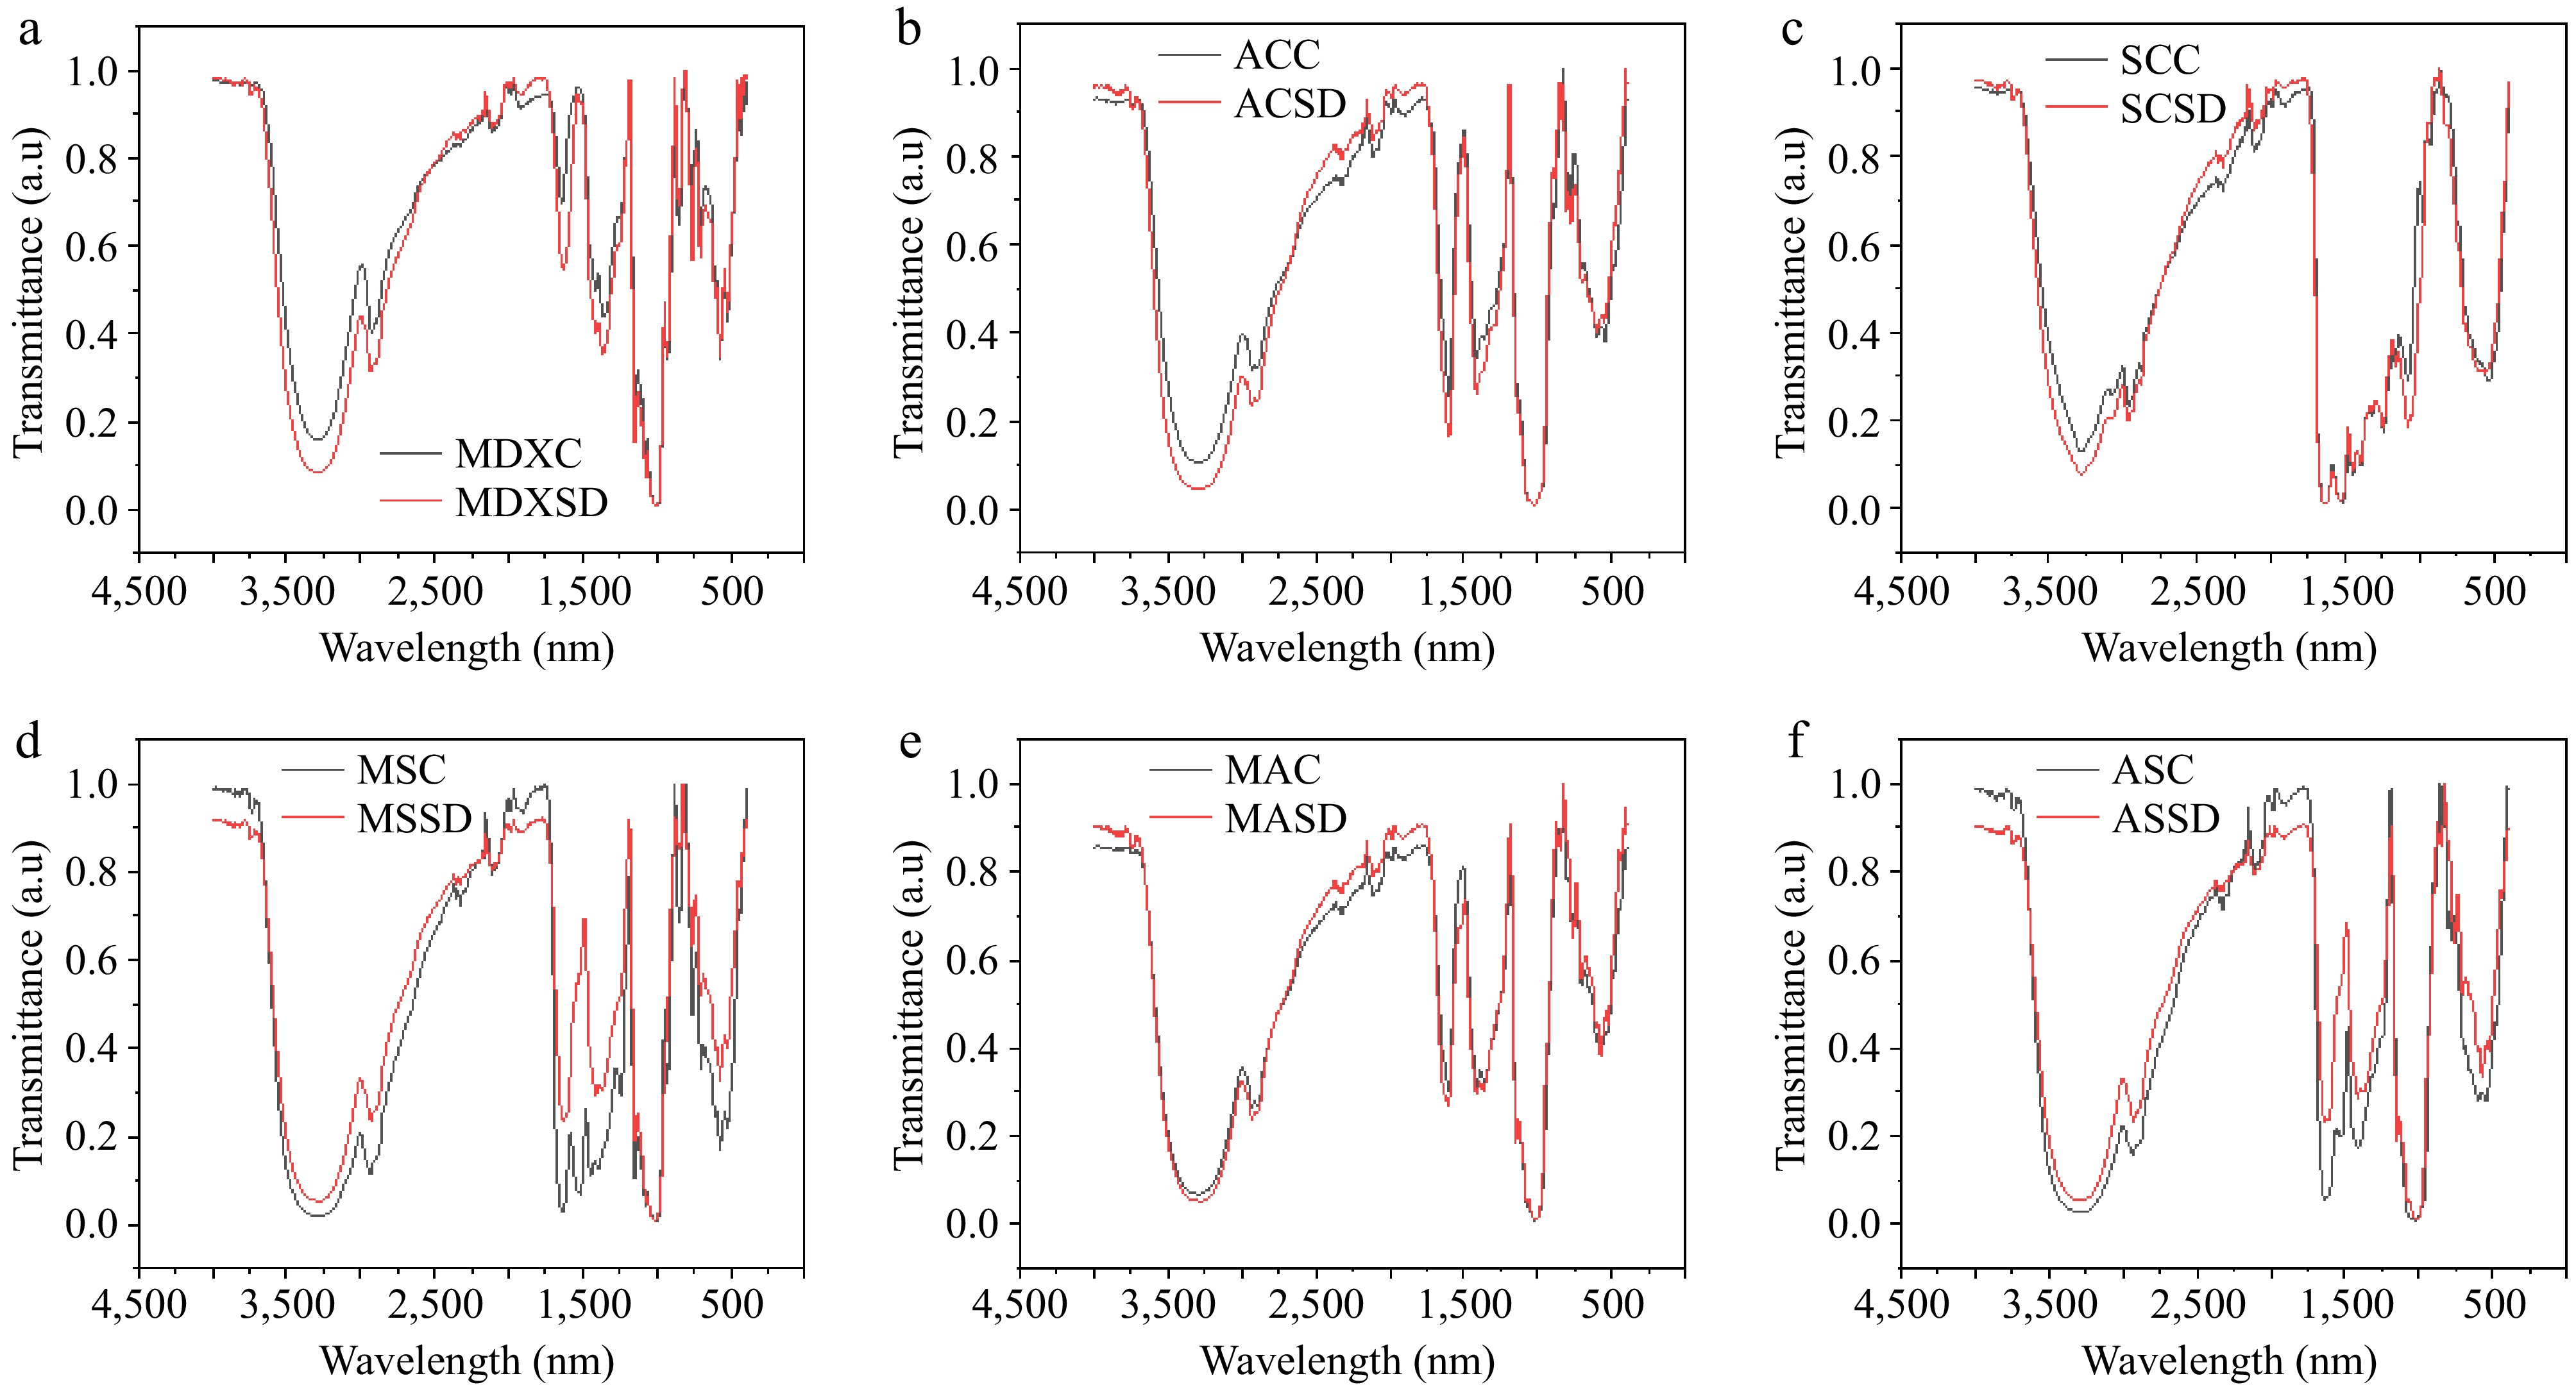
Figure 3.
FTIR analysis of spray-dried microcapsules. (a) MDXC, maltodextrin carrier material alone; MDXSD, maltodextrin, spray-dried; (b) ACC, gum acacia carrier material alone, ACSD, gum acacia, spray-dried; (c) SCC, sodium caseinate carrier material alone; SCSD, sodium caseinate, spray-dried; (d) MSC, maltodextrin + sodium caseinate carrier material alone; MSSD, maltodextrin + sodium caseinate, spray-dried; (e) MAC, maltodextrin + gum acacia carrier material alone; MASD, maltodextrin + gum acacia, spray-dried; (f) ASC, gum acacia + sodium caseinate carrier material alone; ASSD, gum acacia + sodium caseinate, spray-dried.
-
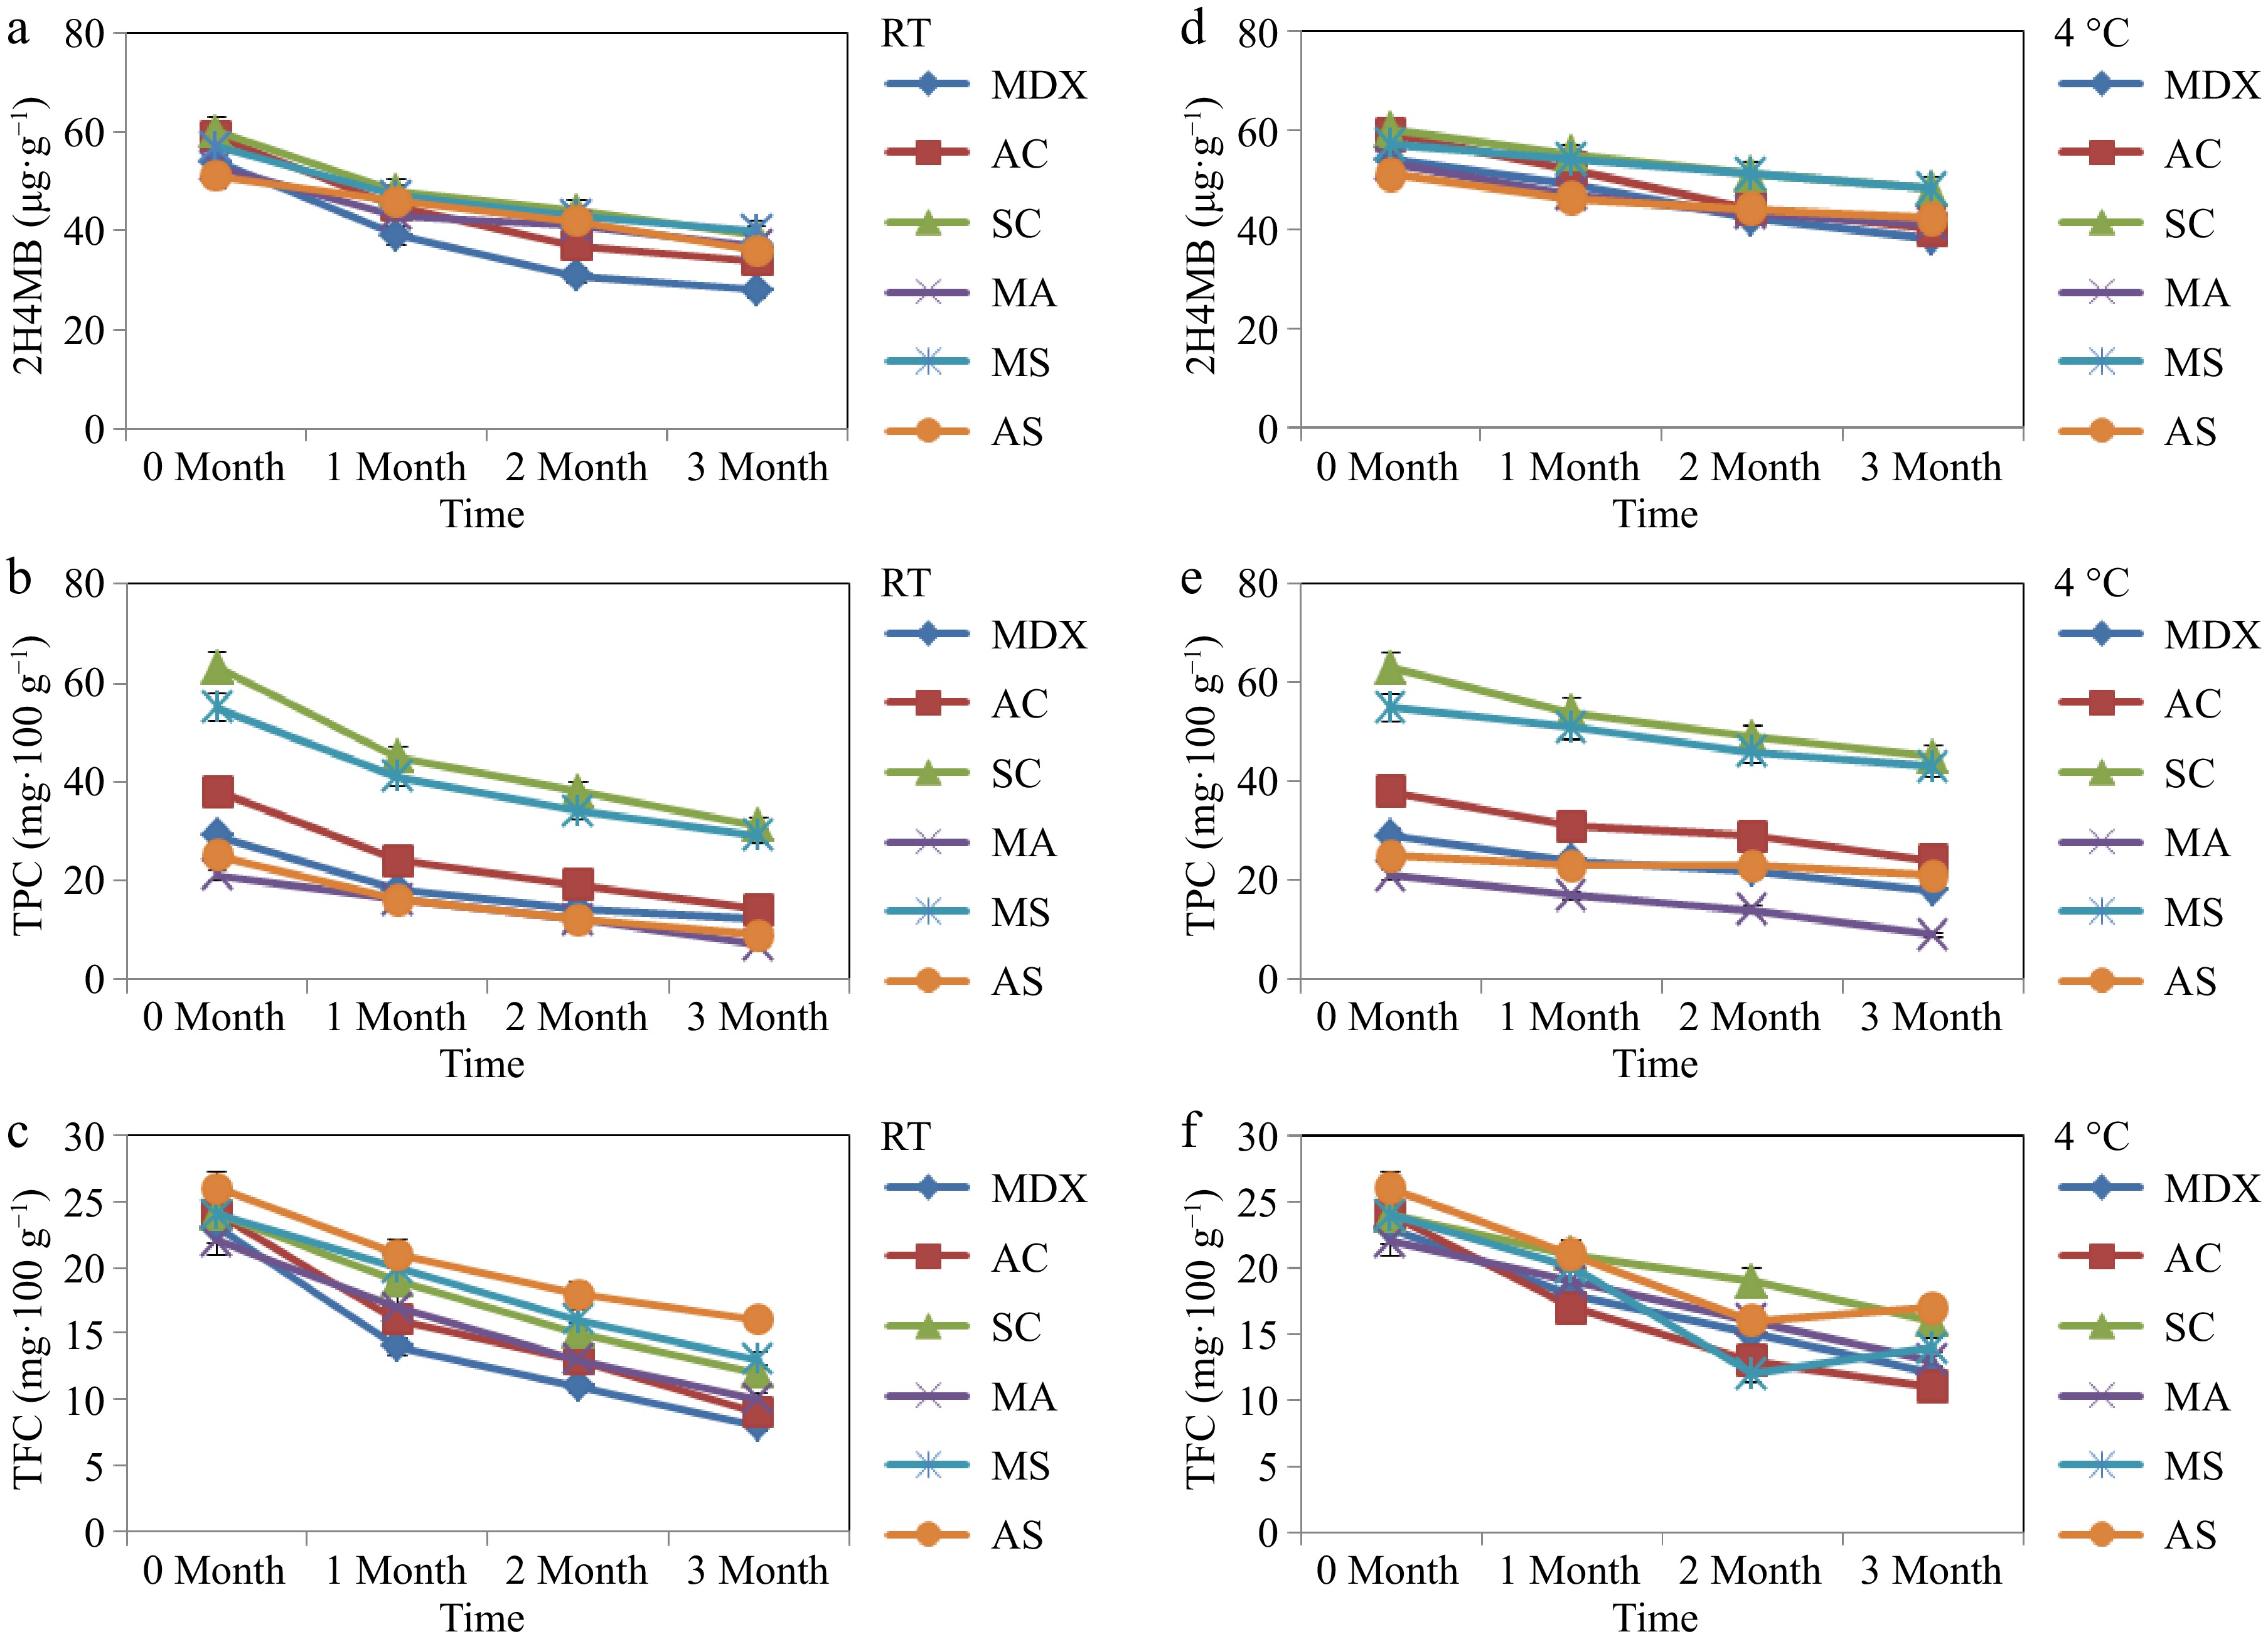
Figure 4.
Storage stability analysis of spray-dried powder. (a) 2H4MB content in spray-dried samples stored at 27 ± 2 °C or room temperature (RT). (b) Total phenolic content (TPC) in spray-dried samples stored at 27 ± 2 °C RT. (c) Total flavonoid content (TFC) in spray-dried samples stored at 27 ± 2 °C RT. (d) The 2H4MB content in spray-dried samples stored at 4 ± 2 °C (refrigerated conditions). (e) TPC in spray-dried samples stored at 4 ± 2 °C refrigerated conditions. (f) TFC in spray-dried samples stored under refrigerated (4 ± 2 °C) conditions.
-
Sample
No.Physicochemical
propertyAqueous extract of
D. hamiltonii tuber1 pH 4.8 ± 0.5 2 Total solid content (Brix) 3.2 ± 0.2 3 2H4MB 5.3 ± 0.1 mg·100 mL−1 4 Phenolics 27.4 ± 0.5 mg·100 mL−1 5 Flavonoids 13.7 ± 0.2 mg·100 mL−1 Values are the mean ± SE of three replicate analyses. Table 1.
Physicochemical properties of D. hamiltonii aqueous extract used for spray-drying and freeze-drying.
-
Spray-drying Carrier material MDX AC SC MA MS AS Carrier material ratio 1:0 1:0 1:0 1:1 1:1 1:1 Yield % (w/w) 60 ± 2d 43 ± 4bc 40 ± 2bc 45 ± 2bc 54 ± 4d 33 ± 2a Moisture % (w/w) 3.3 ± 0.2b 3.5 ± 0.1b 4.2 ± 0.1b 3.7 ± 0.1b 4.3 ± 0.2b 3.4 ± 0.3a Color L* 73.3 ± 0.08c 72.6 ± 0.01c 64.3 ± 0.01a 73.6 ± 0.05cd 74.8 ± 0.2d 67.6 ± 1.1b a* 7.81 ± 0.07c 8.7 ± 0.02e 4.9 ± 0.1a 8.4 ± 0.01d 7.0 ± 0.1b 9.2 ± 0.1f b* 20.8 ± 0.2c 22.6 ± 0.2e 14.9 ± 0.3a 22.2 ± 0.1e 19.7 ± 0.3b 21.5 ± 0.2d 2H4MB content (µg·g−1) 53.9 ± 2b 54.9 ± 6d 60.2 ± 1e 53.6 ± 2c 58.6 ± 2d 50.0 ± 7a Total phenols content
(mg·100 g−1 of gallic acid equivalent)28.6 ± 1.1a 38.4 ± 0.5b 63.3 ± 2.7c 20.8 ± 1.3a 55.4 ± 2.3c 24.8 ± 1.3a Total flavonoid content
(mg·100 g−1 of quercetin equivalent)22.9 ± 0.4ab 23.8 ± 0.5abc 23.8 ± 0.2abc 22.4 ± 0.4a 24.7 ± 0.7bc 25.7 ± 0.7c DPPH (mg·IC50 mL−1) 86.7 ± 1f 49.6 ± 0.6c 37.7 ± 1a 81 ± 0.8e 39 ± 1ab 57.0 ± 1.9d FRAP 36 ± 0.6b 52.4 ± 1cd 88.6 ± 2f 29 ± 5a 81 ± 2e 50.0 ± 0.4c Phospomolybdate assay
(mg·100 g−1 ascorbic acid equivalent)51.6 ± 1b 79.6 ± 2d 131.3 ± 2f 43.2 ± 0.7a 123 ± 0.6e 64.3 ± 2c Total plate count Nil Nil Nil Nil Nil Nil Yeast and mould Nil Nil Nil Nil Nil Nil Coliform Nil Nil Nil Nil Nil Nil Freeze-drying Carrier material ratio 1:0 1:0 1:0 1:1 1:1 1:1 Yield % (w/w) 97 ± 0.5 92 ± 0.2 94 ± 0.4 93 ± 0.5 96 ± 0.2 94 ± 0.2 Moisture % (w/w) 6.8 ± 0.1ab 7.6 ± 0.2c 7.1 ± 0.2ab 6.7 ± 0.1a 6.8 ± 0.2ab 7.1 ± 0.1ab Color L* 56.2 ± 0.09c 55.5 ± 0.06c 53.0 ± 0.01a 53.8 ± 0.01b 53.9 ± 0.1b 57.6 ± 0.05d a* 11.2 ± 0.03c 10.4 ± 0.06b 8.0 ± 0.03a 11.6 ± 0.01c 11.0 ± 0.1c 10.4 ± 0.02b b* 19.6 ± 0.04d 18.7 ± 0.08bc 14.8 ± 0.02a 19.4 ± 0.01cd 18.2 ± 0.30b 19.7 ± 0.02d 2H4MB content (µg·g−1) 62.9 ± 2a 71.4 ± 4b 75.7 ± 5d 68.3 ± 2bc 70.7 ± 2c 73.6 ± 1c Total phenol content
(mg·100 g−1 of gallic acid equivalent)35.2 ± 1.3a 49.5 ± 3.2b 72.2 ± 1.8d 39.0 ± 1.1a 58.5 ± 2.1c 62.5 ± 0.7b Total flavonoid content
(mg·100 g−1 of quercetin equivalent)24.9 ± 0.4a 24.2 ± 0.4a 46.3 ± 0.7b 43.5 ± 1.1b 46.3 ± 0.7b 52.7 ± 1.1c DPPH (mg IC50 mL−1) 93.6 ± 1e 62.2 ± 1d 23.3 ± 0.7ab 106.6 ± 2f 44 ± 1.2c 21.3 ± 0.5a FRAP 51.3 ± 2a 52.8 ± 0.5a 117.5 ± 4c 50.6 ± 0.4a 81.5 ± 1b 143.3 ± 4d Phospomolybdate assay
(mg·100 g−1 ascorbic acid equivalente)63.5 ± 0.3ab 84.5 ± 2c 132.6 ± 1e 59.9 ± 2a 117 ± 0.8d 163.6 ± 1f Total plate count Nil Nil Nil Nil Nil Nil Yeast and mould Nil Nil Nil Nil Nil Nil Coliform Nil Nil Nil Nil Nil Nil MDX, maltodextrin; AC, gum acacia; SC, sodium caseinate; MA, maltodextrin + gum acacia; MS, maltodextrin + sodium caseinate; AS, gum acacia + sodium caseinate; IC50, half-maximal inhibitory concentration. (Lowercase letters a, b, c, d, e, indicate statistical significance of data sets). Table 2.
Physical, biochemical, and microbial characteristics of microencapsulated samples.
-
SI. No. Carrier material Carrier material ratio Encapsulation efficiency % Particle size (µm) Flow properties 2H4MB Phenolics flavonoids CI HR 1 MDX 1:0 67 ± 0.4bc 70 ± 0.1c 72 ± 1.1b 11.1a 31c 1.43c 2 AC 1:0 71 ± 0.2bc 62 ± 1.1b 62 ± 0.2a 15.3c 32c 1.47d 3 SC 1:0 82 ± 1.2d 74 ± 0.2d 78 ± 1.3c 17.6d 36d 1.56e 4 MA 1:1 59 ± 1.4a 52 ± 0.4a 74 ± 0.4b 14.5c 33c 1.49d 5 MS 1:1 74 ± 0.2e 70 ± 1.4c 62 ± 0.4a 11.2a 23a 1.30a 6 AS 1:1 76 ± 0.2e 64 ± 0.1b 61 ± 0.1a 12.3ab 26b 1.35b Mean values are expressed (n = 3). Different lowercase letters in each column represents statistically significant differences at p < 0.05. MDX, maltodextrin; AC, gum acacia; SC, sodium caseinate; MA, maltodextrin + gum acacia; MS, maltodextrin + sodium caseinate; AS, gum acacia + sodium caseinate. Table 3.
Characteristics of spray-dried powder prepared with different carrier materials.
Figures
(4)
Tables
(3)