-
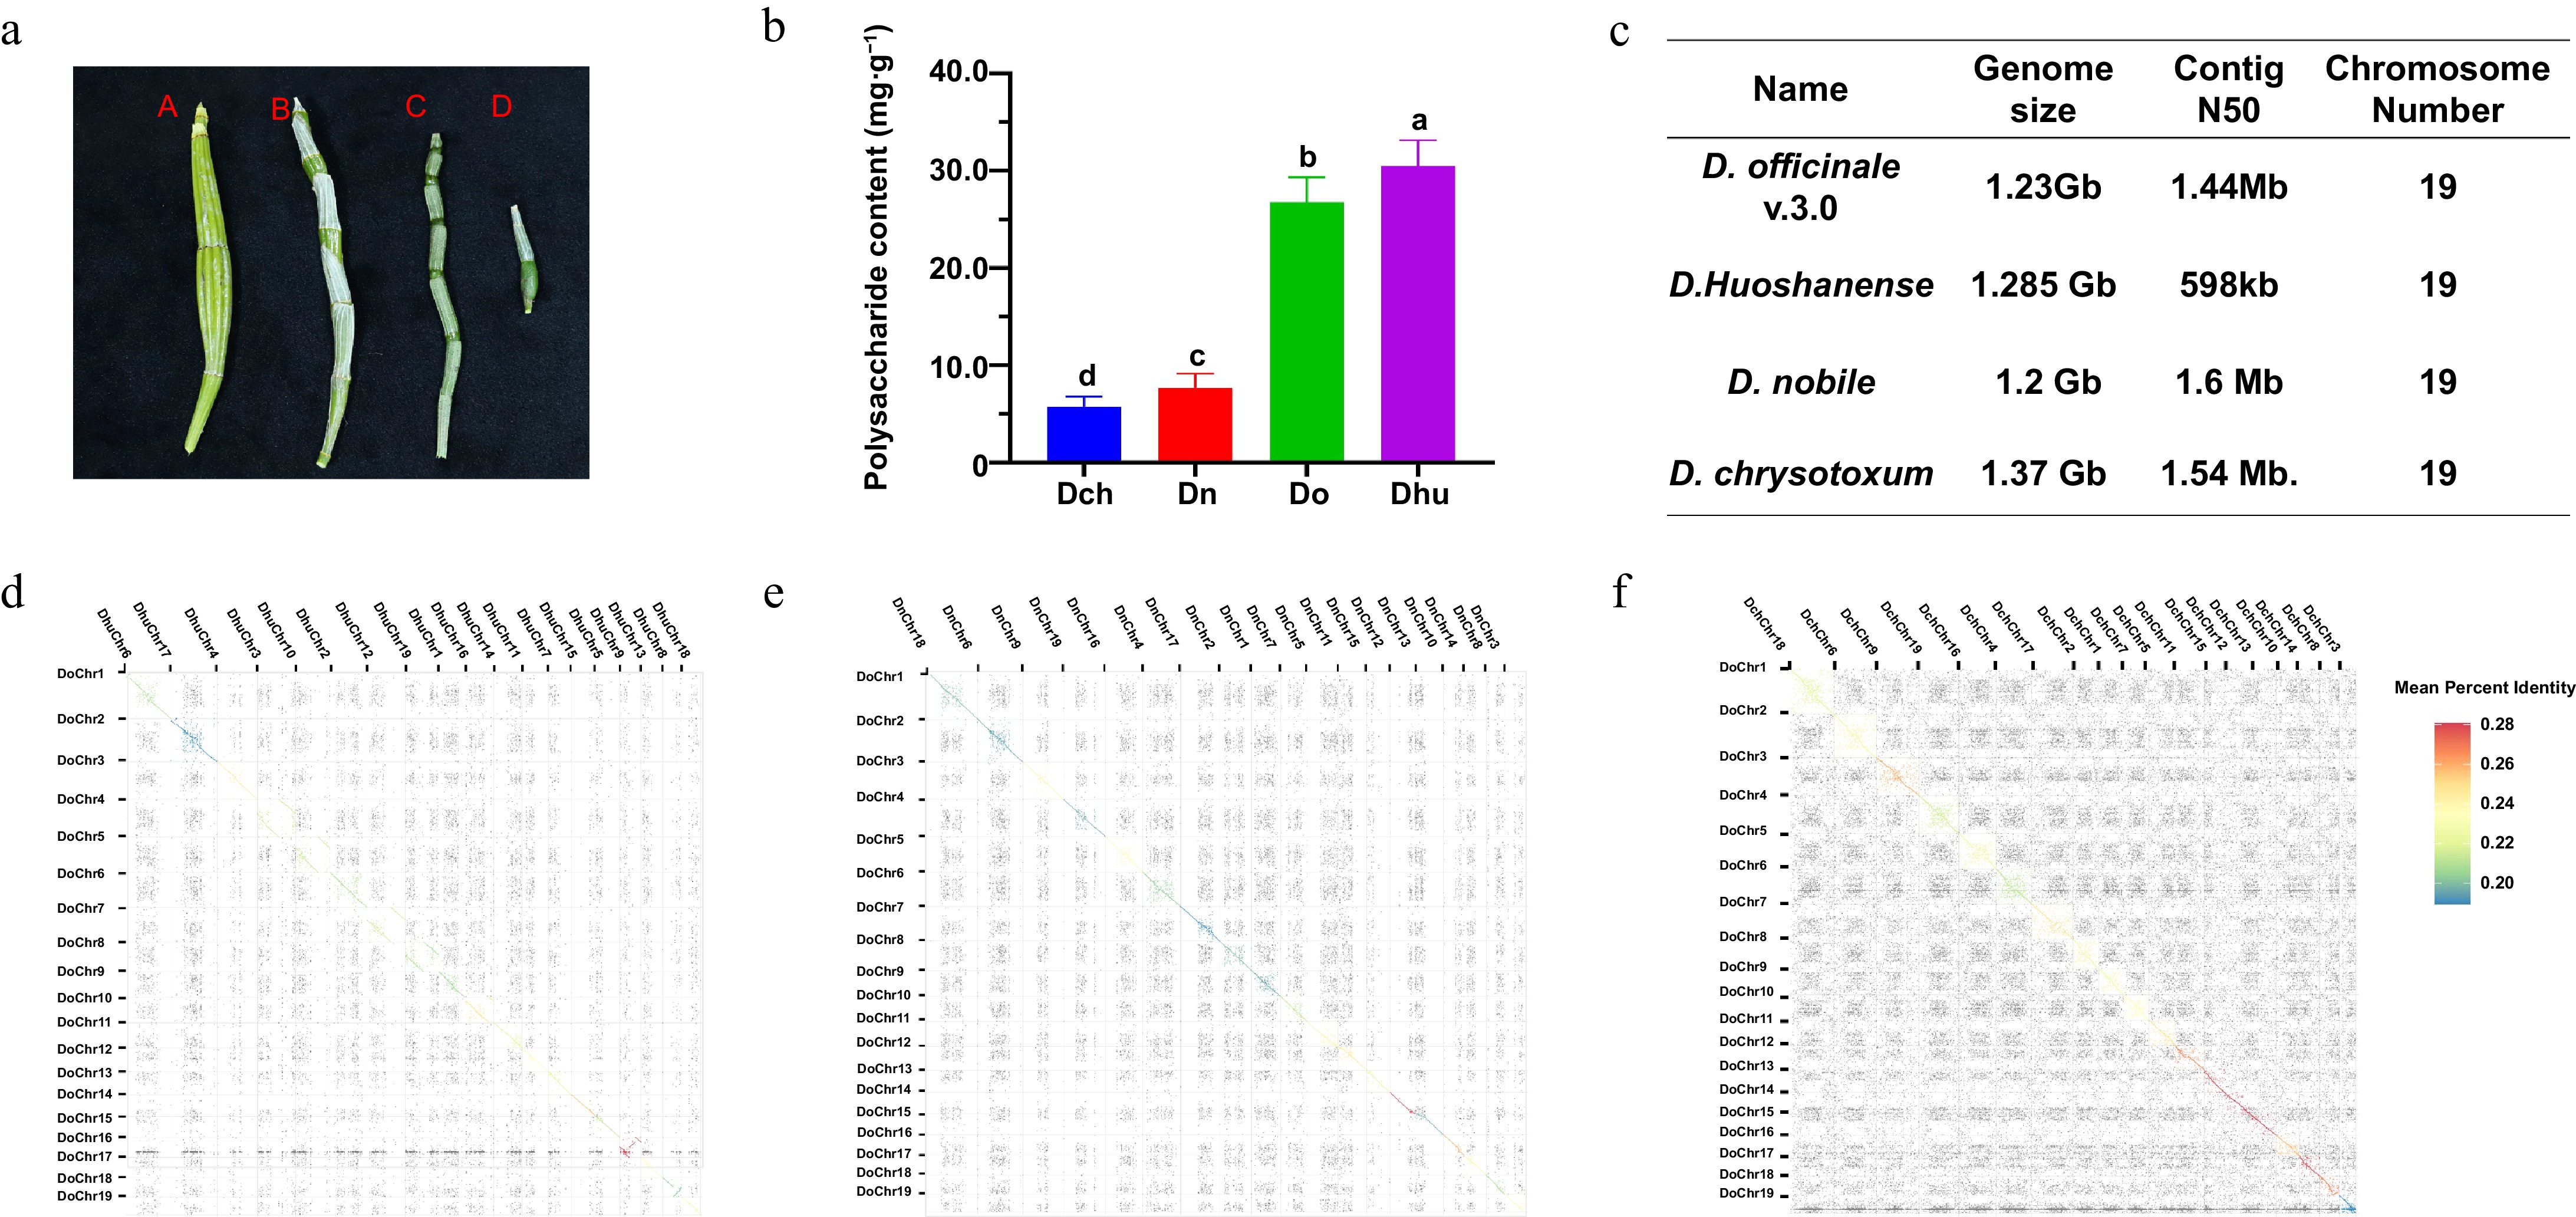
Figure 1.
Characterization of four Dendrobium species. (a) Phenotypes of stems of the four Dendrobium species (A D. chrysotoxum [Dch], B D. nobile [Dn], C D. officinale [Do], D D. huoshanense [Dhu]. Scale bar is 1 cm). (b) Polysaccharide contents of the four Dendrobium species. Different letters indicate significant differences among groups, as determined by one-way ANOVA with Tukey's multiple-comparisons test (p < 0.05). (c) Summary of sequencing data for the four Dendrobium genome assemblies. (d) Syntenic relationship of D. officinale and D. huoshanense. (e) Syntenic relationship of D. officinale and D. nobile. (f) Syntenic relationship of D. officinale and D. chrysotoxum.
-
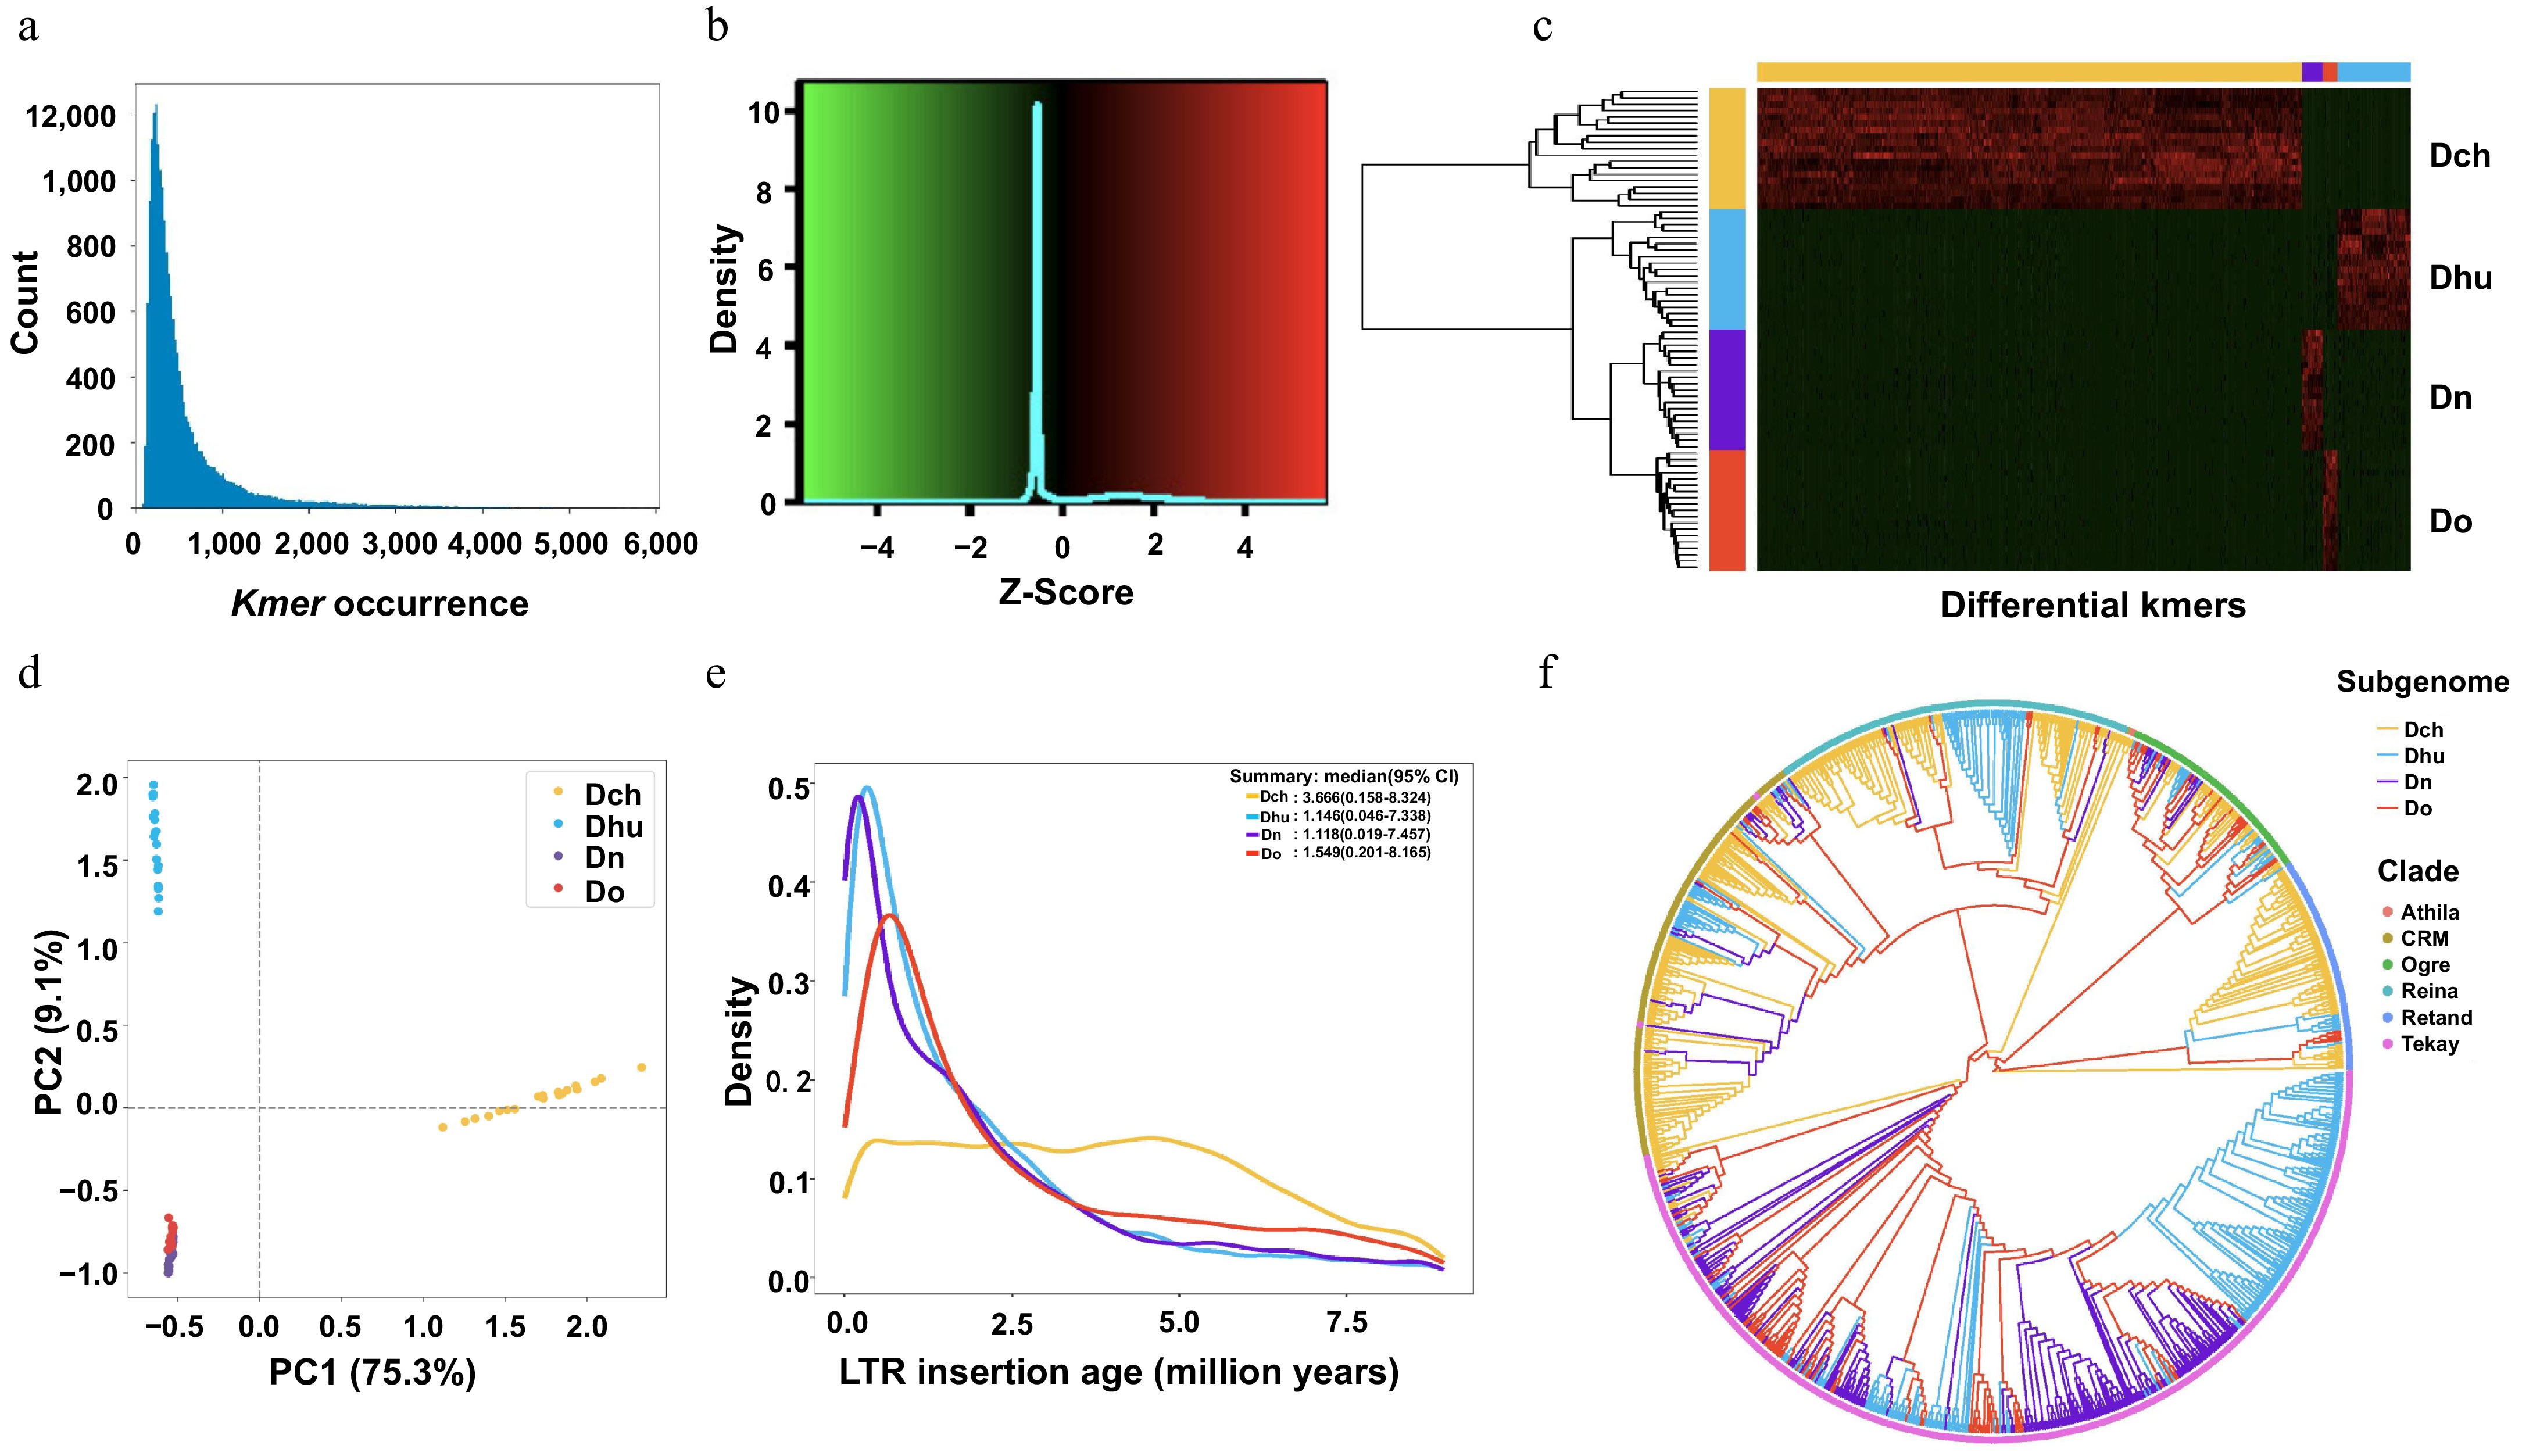
Figure 2.
Genome phasing of four Dendrobium species (Dch, Dn, Do, and Dhu) using SubPhaser. (a) Distribution frequency of different 15-mers in homologous chromosomes of the four species. (b) Heatmap showing the Z-scale relative abundance of kmers. (c) Unsupervised hierarchical clustering heatmap; horizontal color bar at the top indicates kmer specificity to the genome, and vertical color bar on the left indicates chromosomes. (d) Principal component analysis of different 15-mers. (e) Genome-specific long terminal repeat (LTR) retrotransposon (LTR-RT) insertion times (95% confidence interval). (f) Phylogenetic tree of 1,000 Gypsy LTR-RTs from random data resampling.
-
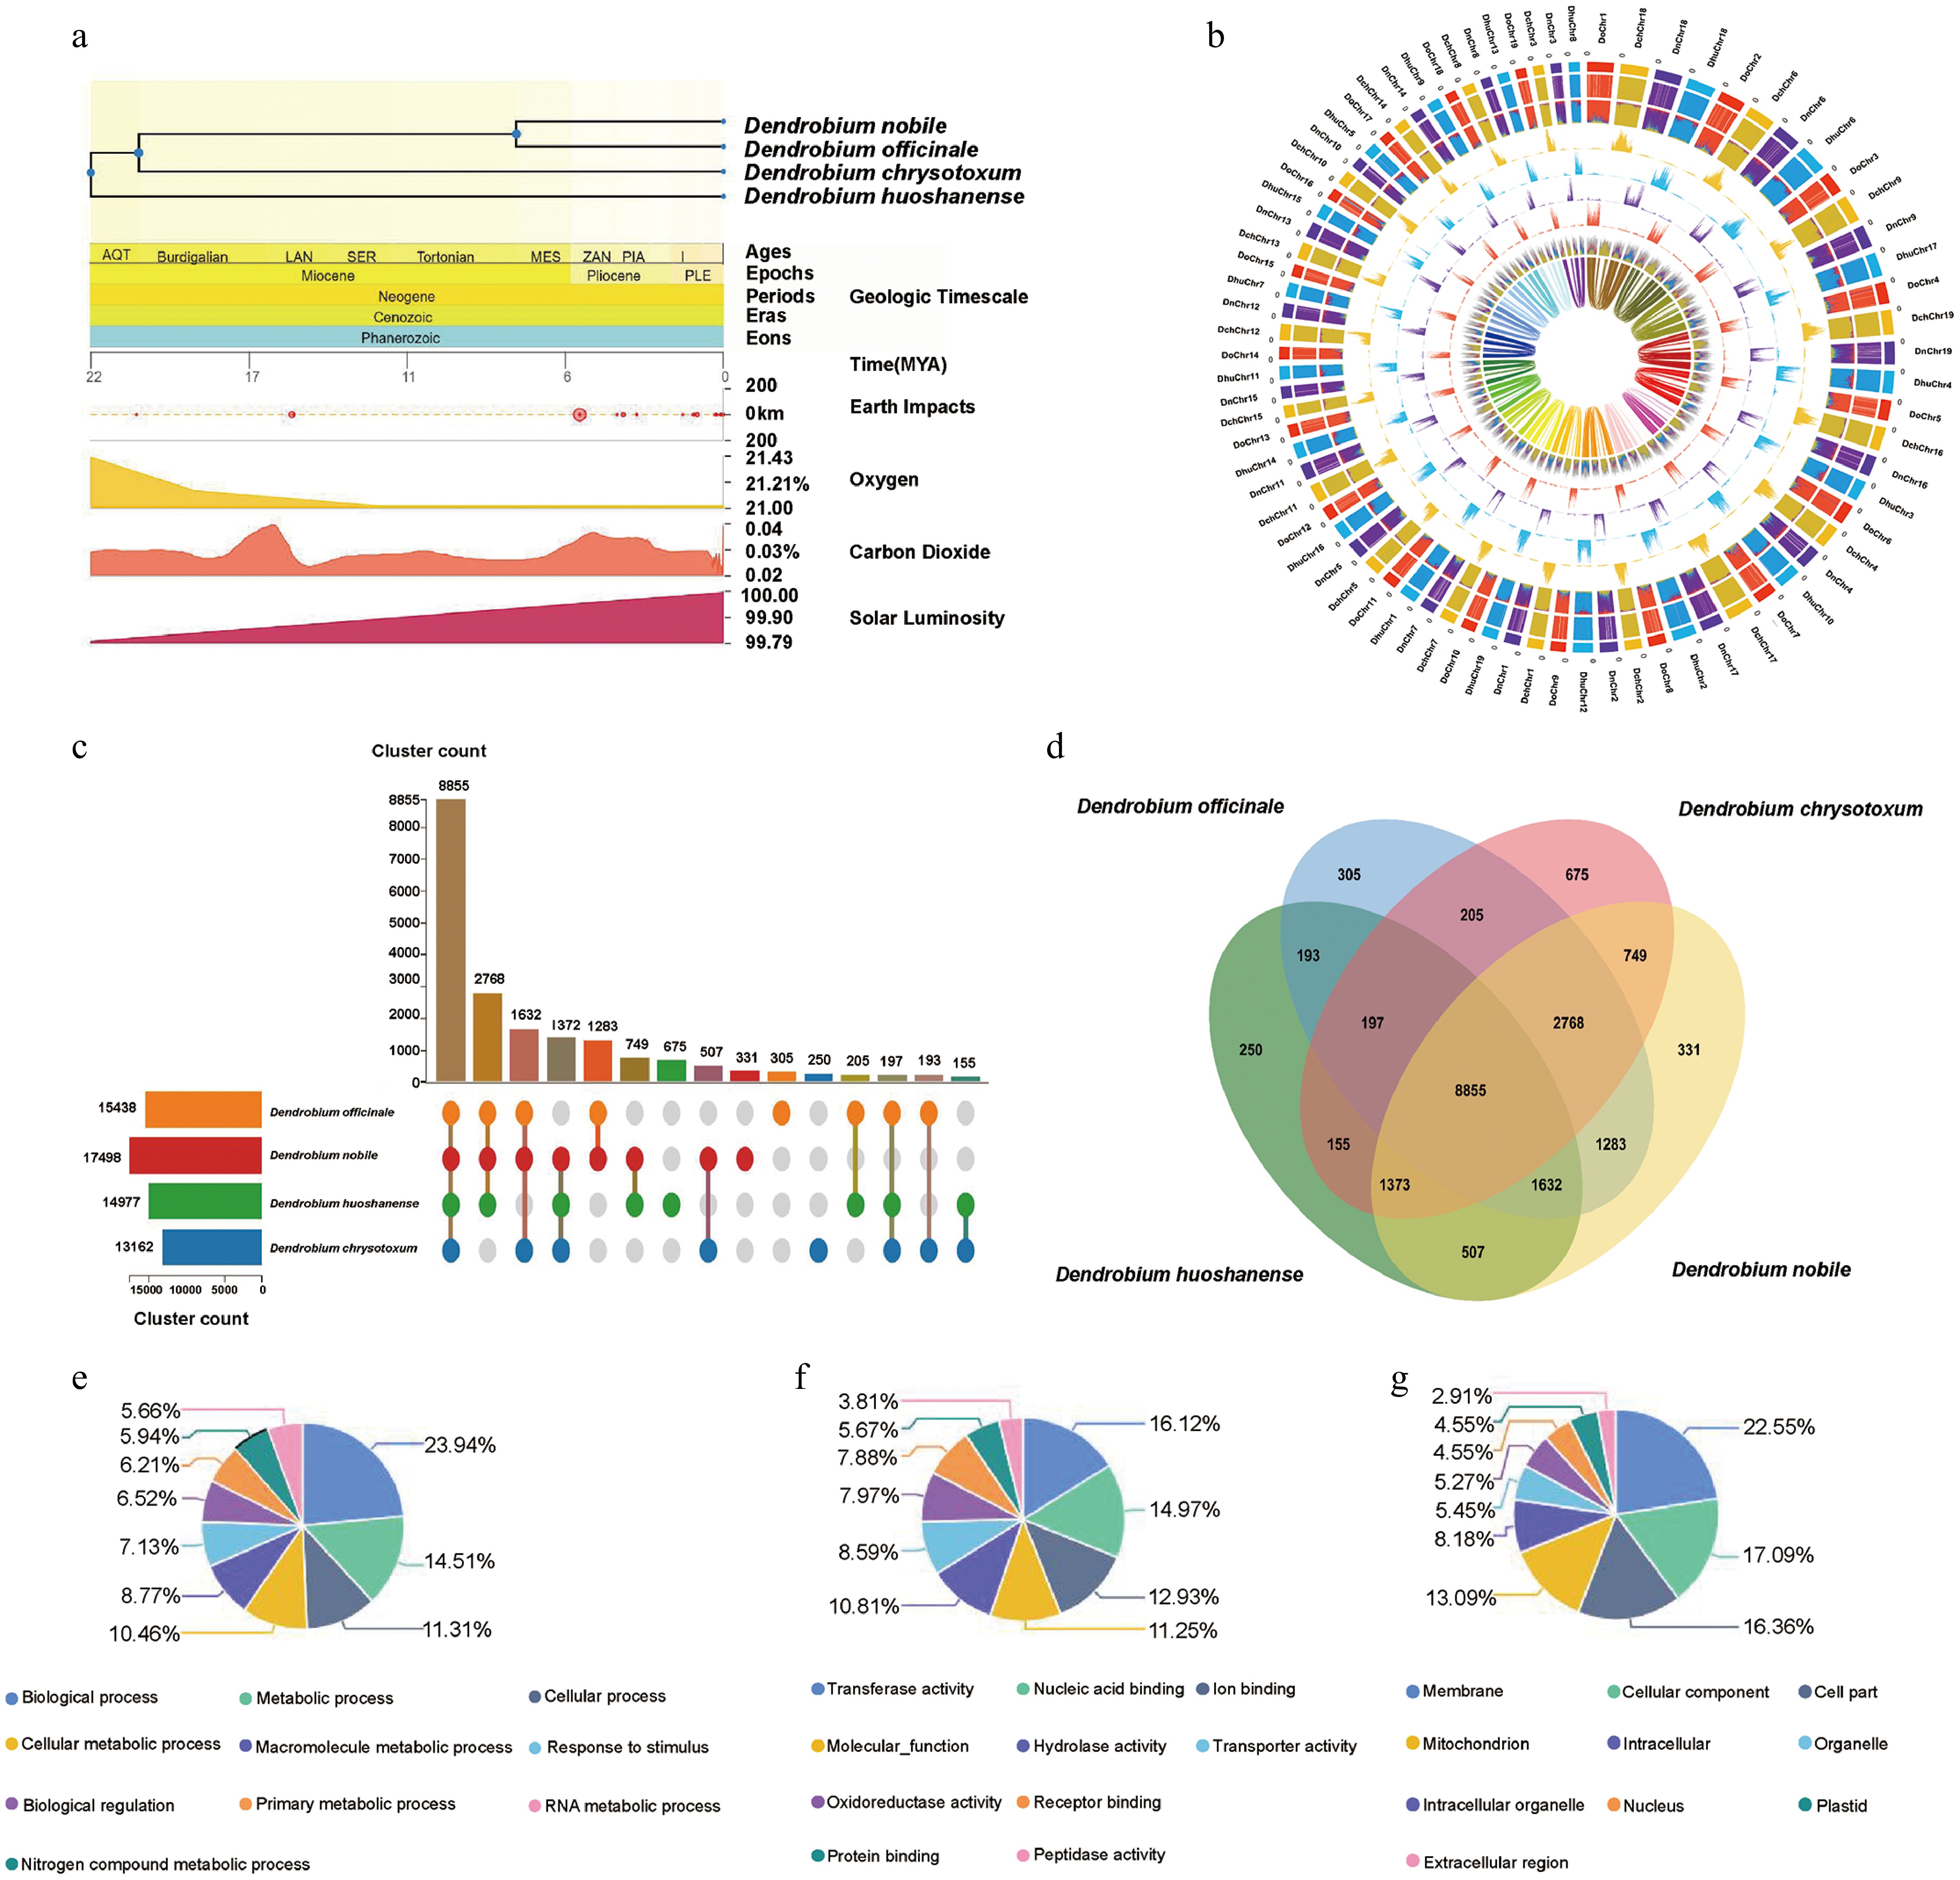
Figure 3.
Genomic comparisons and evolutionary divergence among four Dendrobium species. (a) Speciation of the four Dendrobium species and the timing of geo-environmental change events. (b) Chromosome characterization of the four Dendrobium species. From the inner to outer circles (1–8): (1) genome types assigned based on the K-means algorithm; (2) enriched genome-specific kmers; (3) genome-specific kmers normalized against each other; (3–6) absolute values of the pooled counts of each genome-specific kmer; and (8) the density of long terminal repeat (LTR) retrotransposons (LTR-RTs); a color consistent with the genome class indicates that LTR-RTs are significantly enriched in these genome-specific kmers, and gray indicates non-specific LTR-RTs. (c) The number of orthologous clusters in each species. (d) Venn diagram of intersecting direct homologous gene clusters. (e) GO enrichment analysis of biological processes. (f) GO enrichment analysis of molecular functions. (g) GO enrichment analysis of cellular components.
-
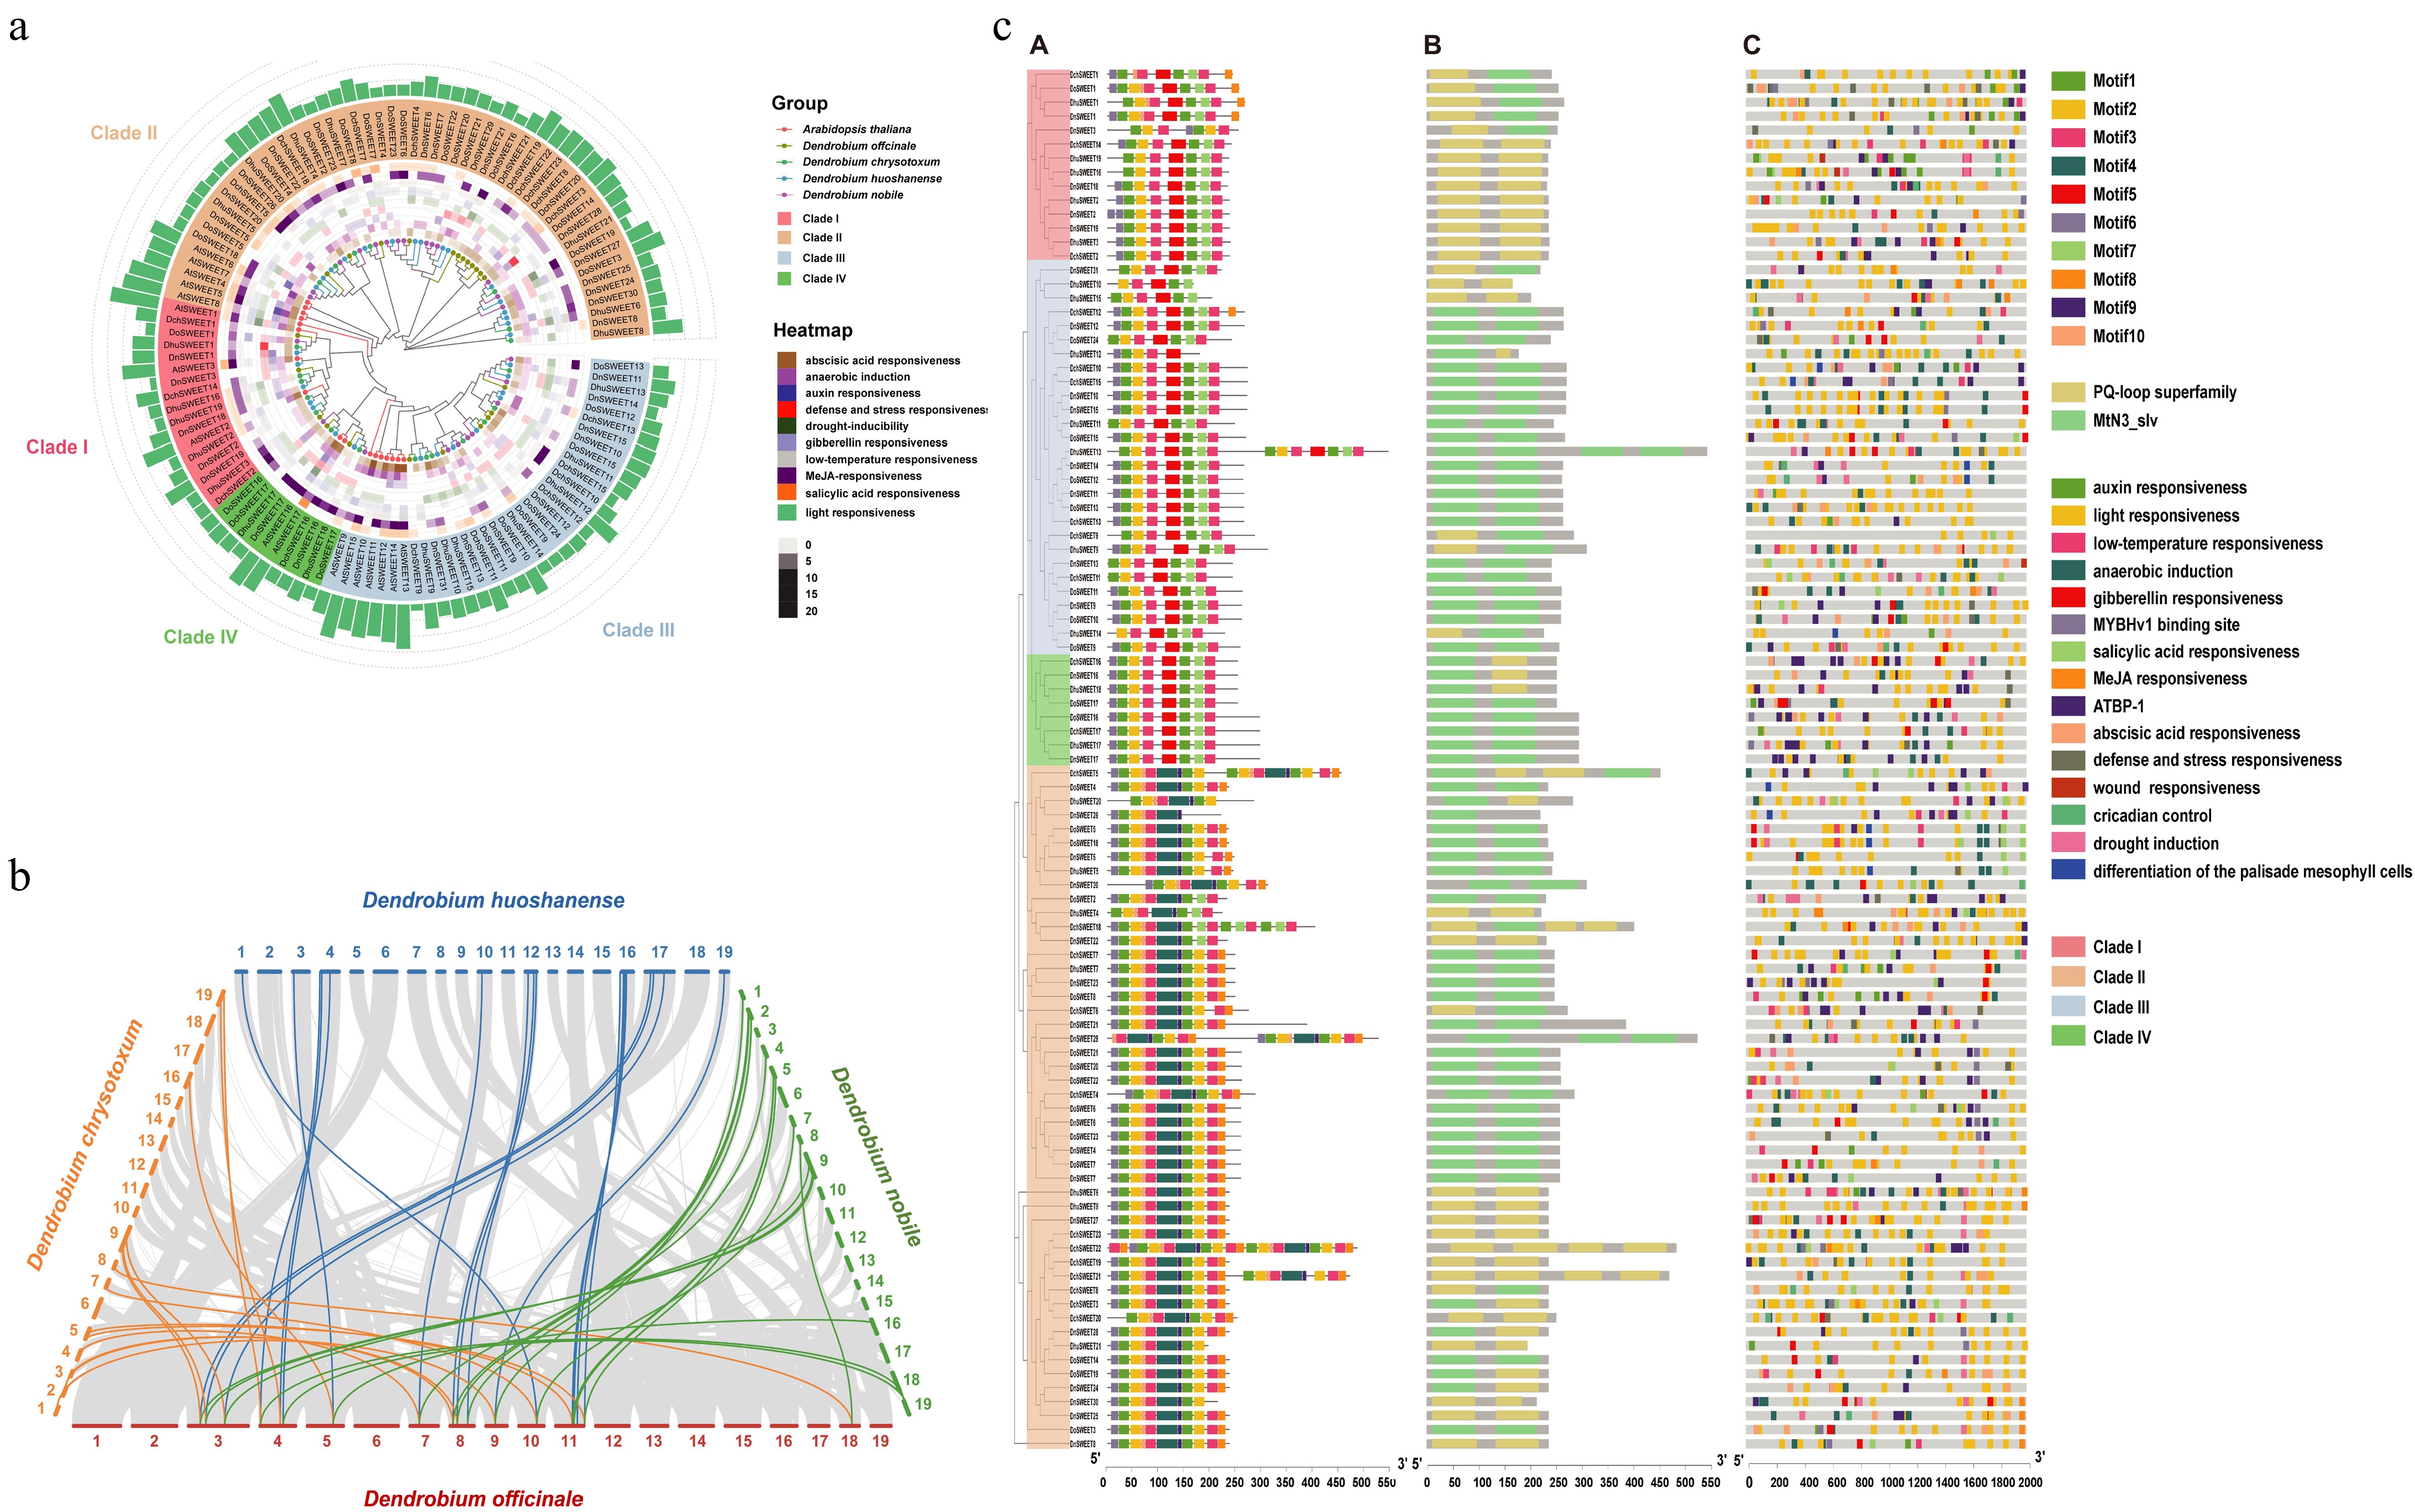
Figure 4.
Genome-wide identification and functional analysis of the SWEET gene family in Dendrobium. (a) Phylogenetic relationships of SWEET proteins in Arabidopsis thaliana (At), D. officinale (Do), D. chrysotoxum (Dch), D. huoshanense (Dhu), and D. nobile (Dn). The trees were constructed based on protein sequence alignment using the maximum likelihood method. The four clades and different cis-elements in the heatmap are marked with different colors. (b) Syntenic relationships of D. officinale, D. chrysotoxum, D. huoshanense, and D. nobile SWEET are genes shown on the chromosome maps. (c) Analysis of conserved motifs and conserved domains in SWEETs. ([A] Conserved motifs and gene exon-intron structures in the SWEETs. [B] Conserved domains in SWEET proteins identified by a search using NCBI (
www.ncbi.nlm.nih.gov/Structure/cdd/wrpsb.cgi ). [C] Predicted cis-acting elements in the upstream regions of SWEET genes). -
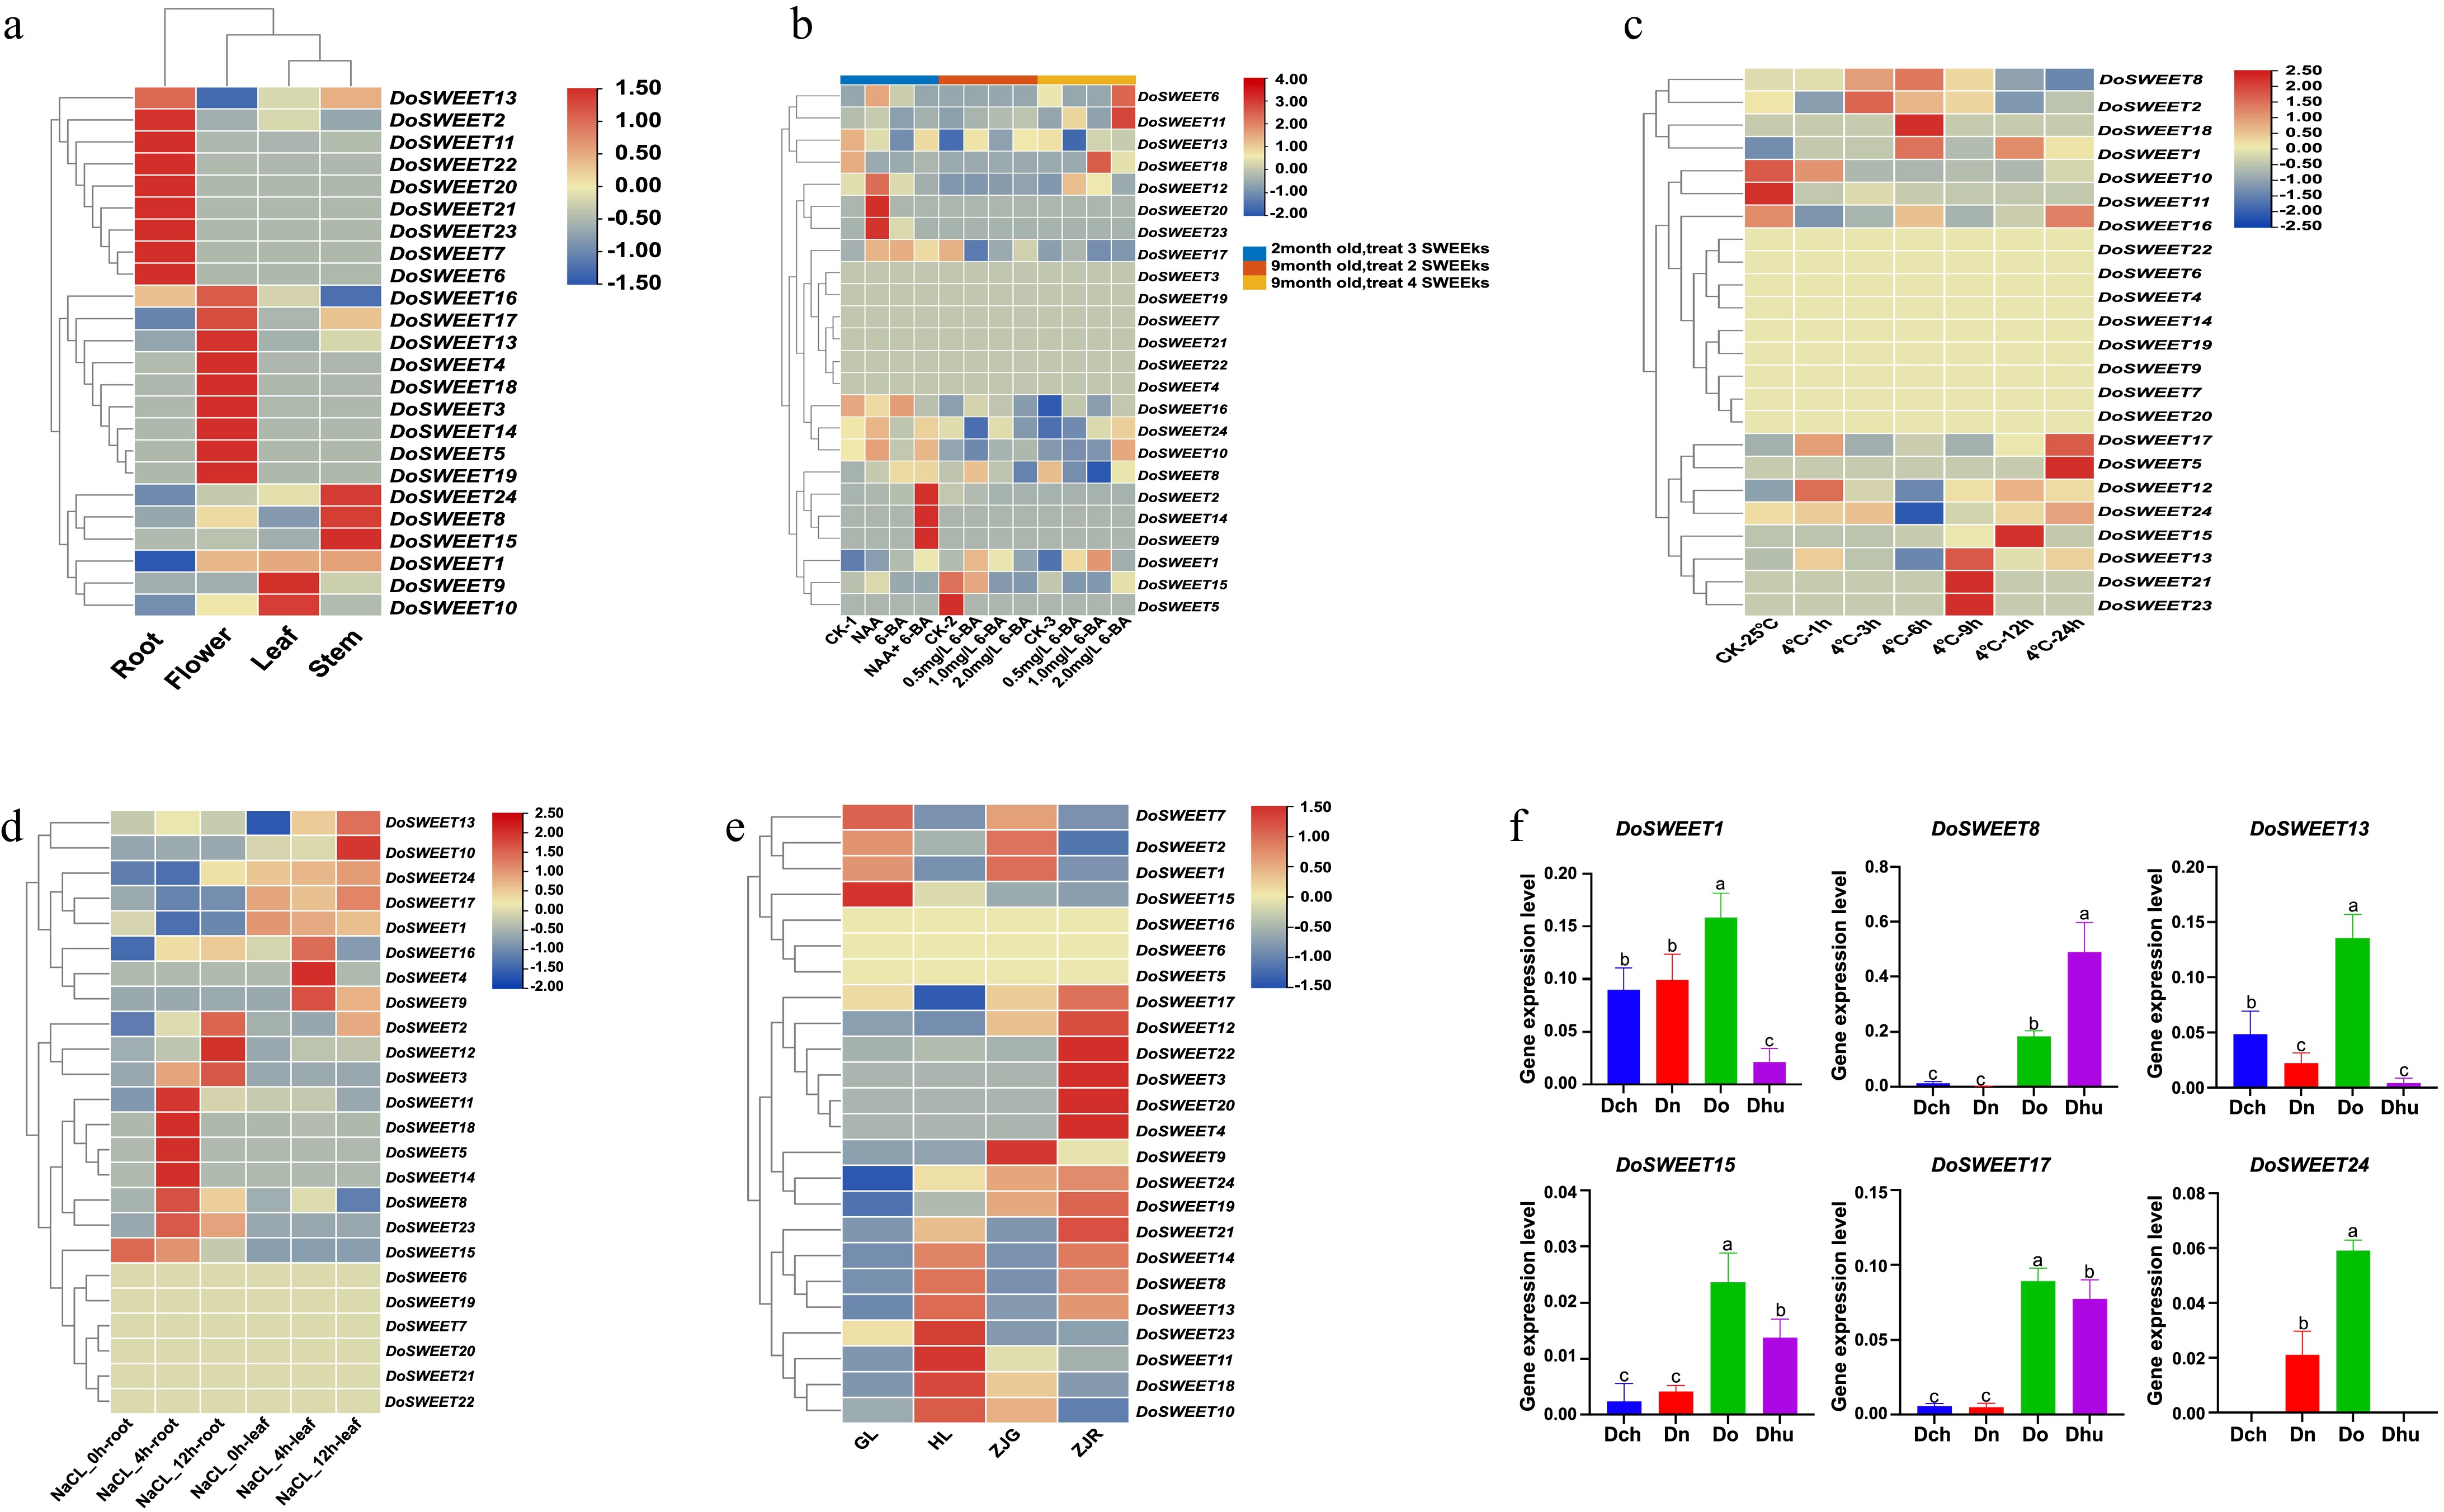
Figure 5.
Expression patterns of SWEET genes in D. officinale. (a) Heatmap of the differential expression of SWEET genes in four D. officinale organs. (b)–(d) Heatmaps of the differential expression of DoSWEET genes in response to different (b) phytohormones, (c) Cold, (d) salt, and (e) differences in light conditions and ecotype. ZJG and ZJR indicate ecotypes with green stems and red stems, respectively, from Zhejiang Province, China, that were maintained under normal growth light. GL and HL indicate normal growth light and high-light conditions, respectively, applied to the YNG ecotype. (a)–(e) The expression levels of SWEET genes are represented by log2-transformed transcripts per million (TPM) values acquired from RNA-seq data. (f) Expression analysis of SWEET genes in the four Dendrobium species (Do, Dhu, Dn, and Dch), as determined by RT-qPCR. The data are representative of three independent experiments. The error bars indicate SD, and different lowercase letters indicate significant differences in expression levels at the 95% confidence level.
-
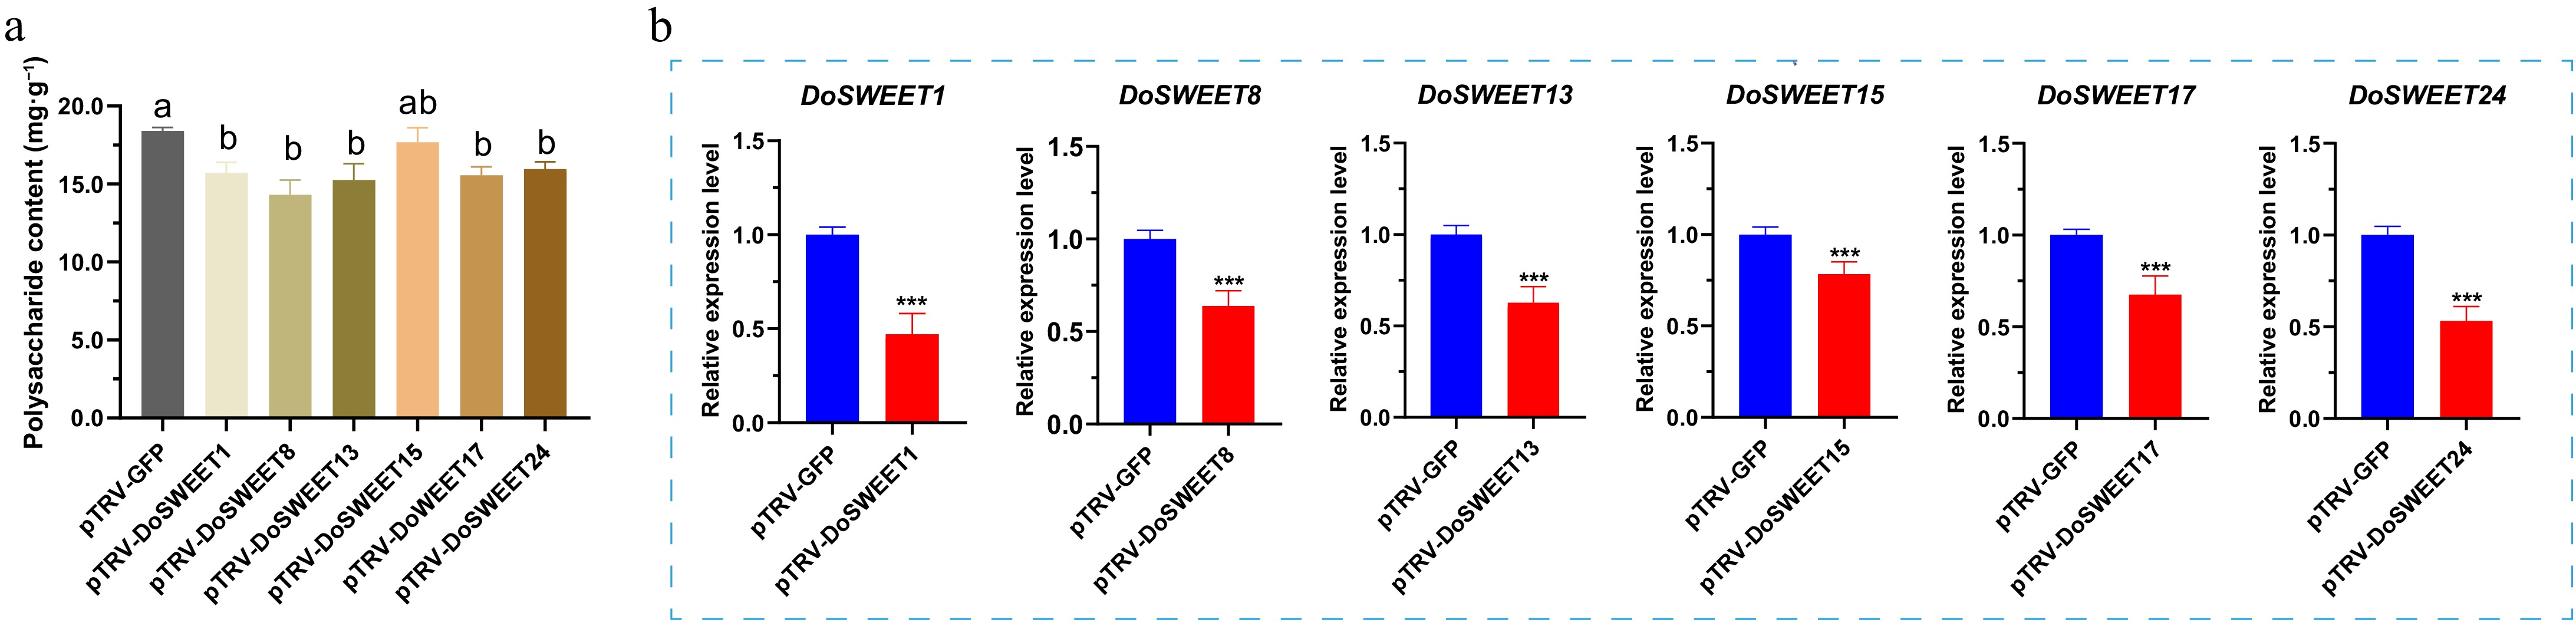
Figure 6.
The SWEET gene family plays a critical role in polysaccharide accumulation in D. officinale. (a) Total polysaccharide contents in D. officinale after virus-induced gene silencing (VIGS). Different lowercase letters indicate significant differences at the 95% confidence level. (b) Expression patterns of DoSWEET1, 8, 13, 15, 17, and 24 in D. officinale stems after VIGS. Error bars indicate the standard deviation of three biologically independent repeats. Student's t-test: *** p < 0.001.
Figures
(6)
Tables
(0)