-
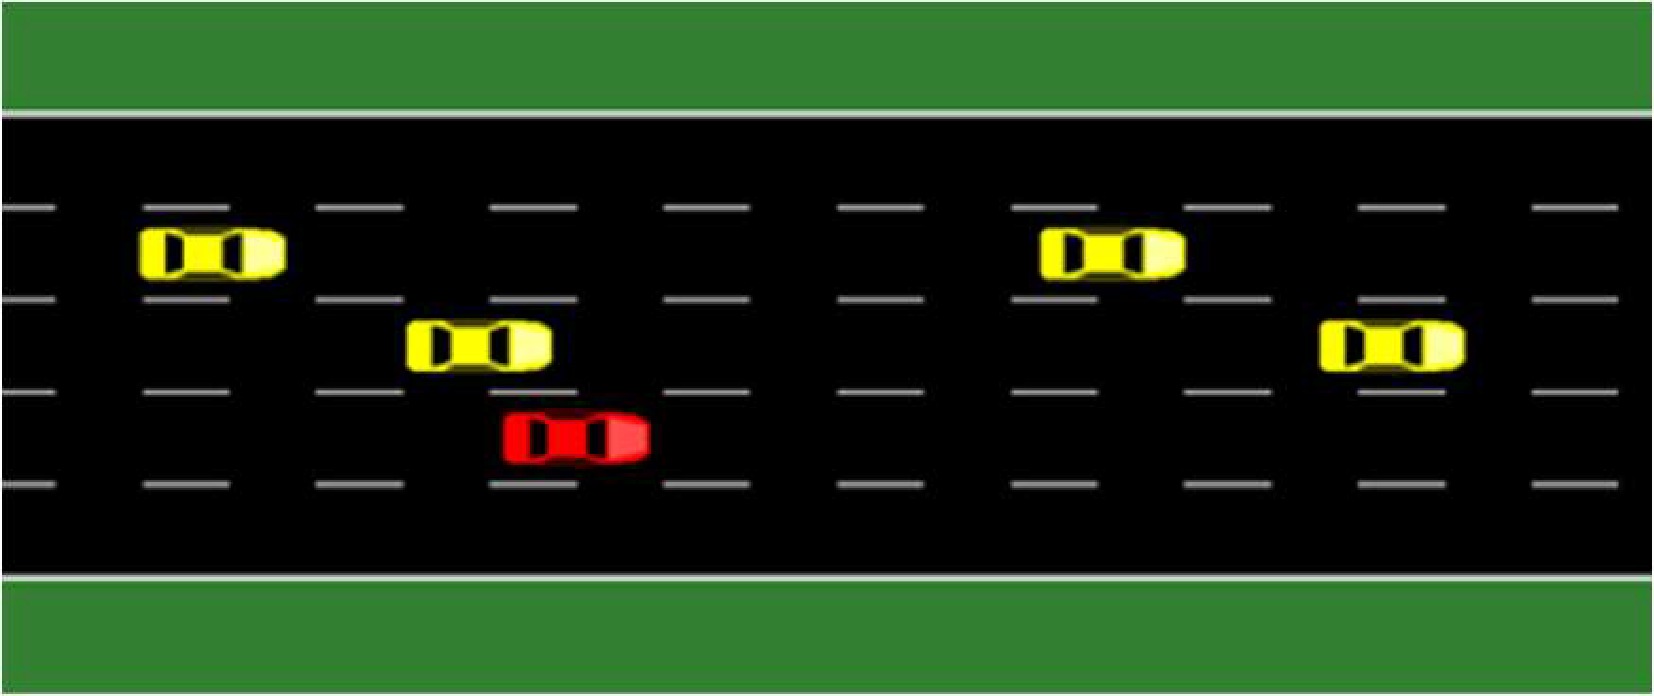
Figure 1.
Highway dense traffic scenario instance on SUMO simulation.
-
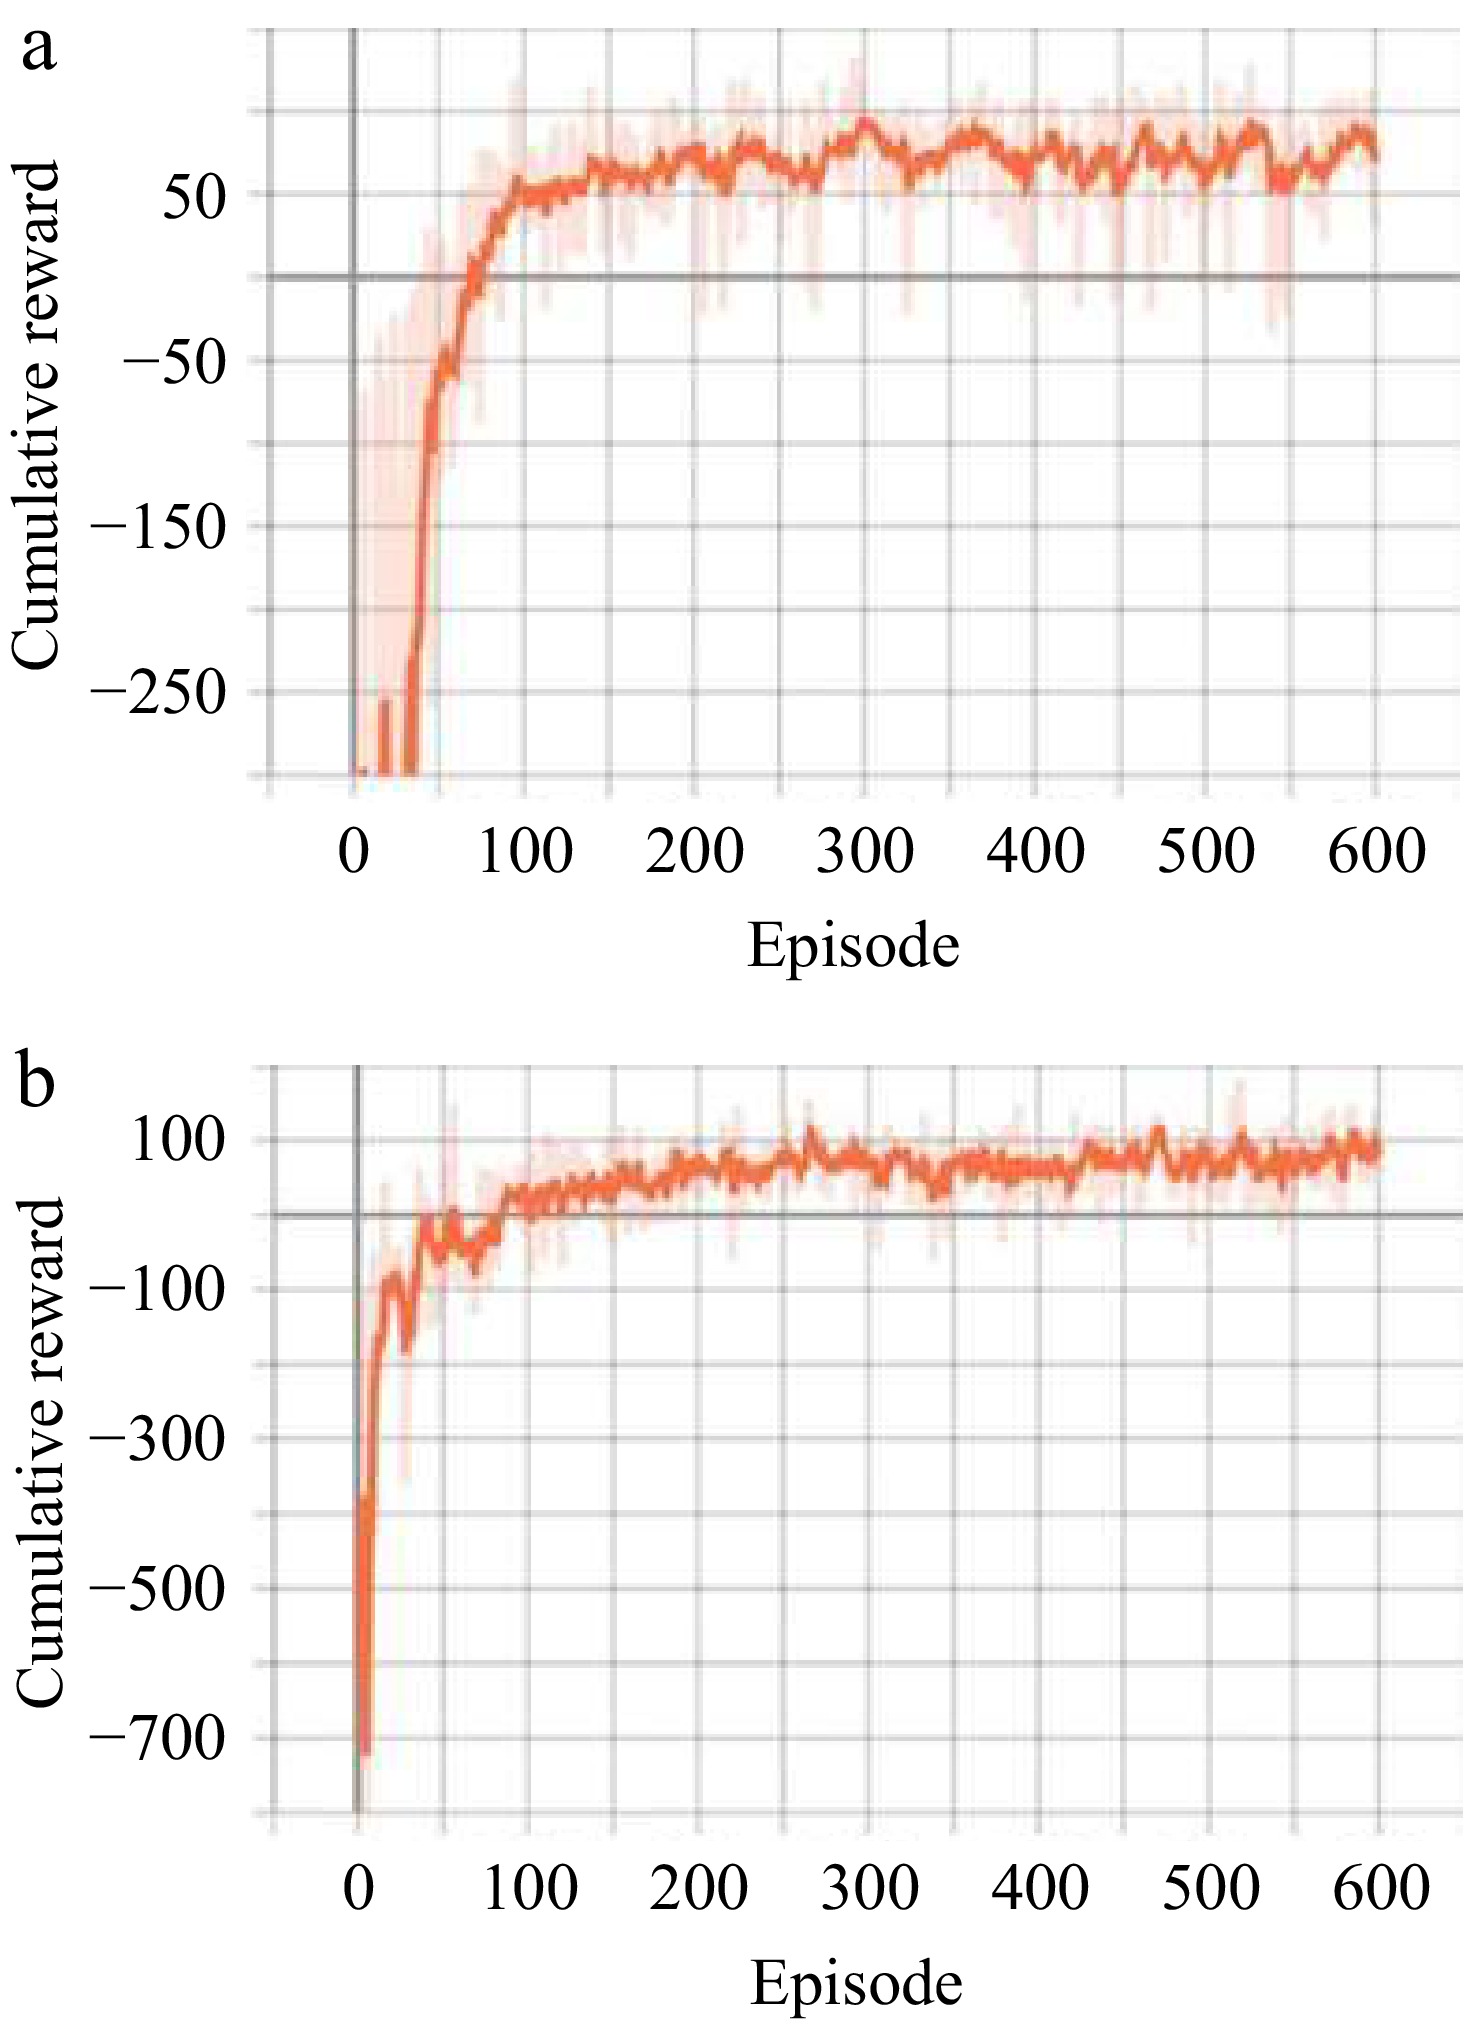
Figure 2.
Cumulative reward values. (a) Without safe reward function. (b) Safe reward function integrated.
-
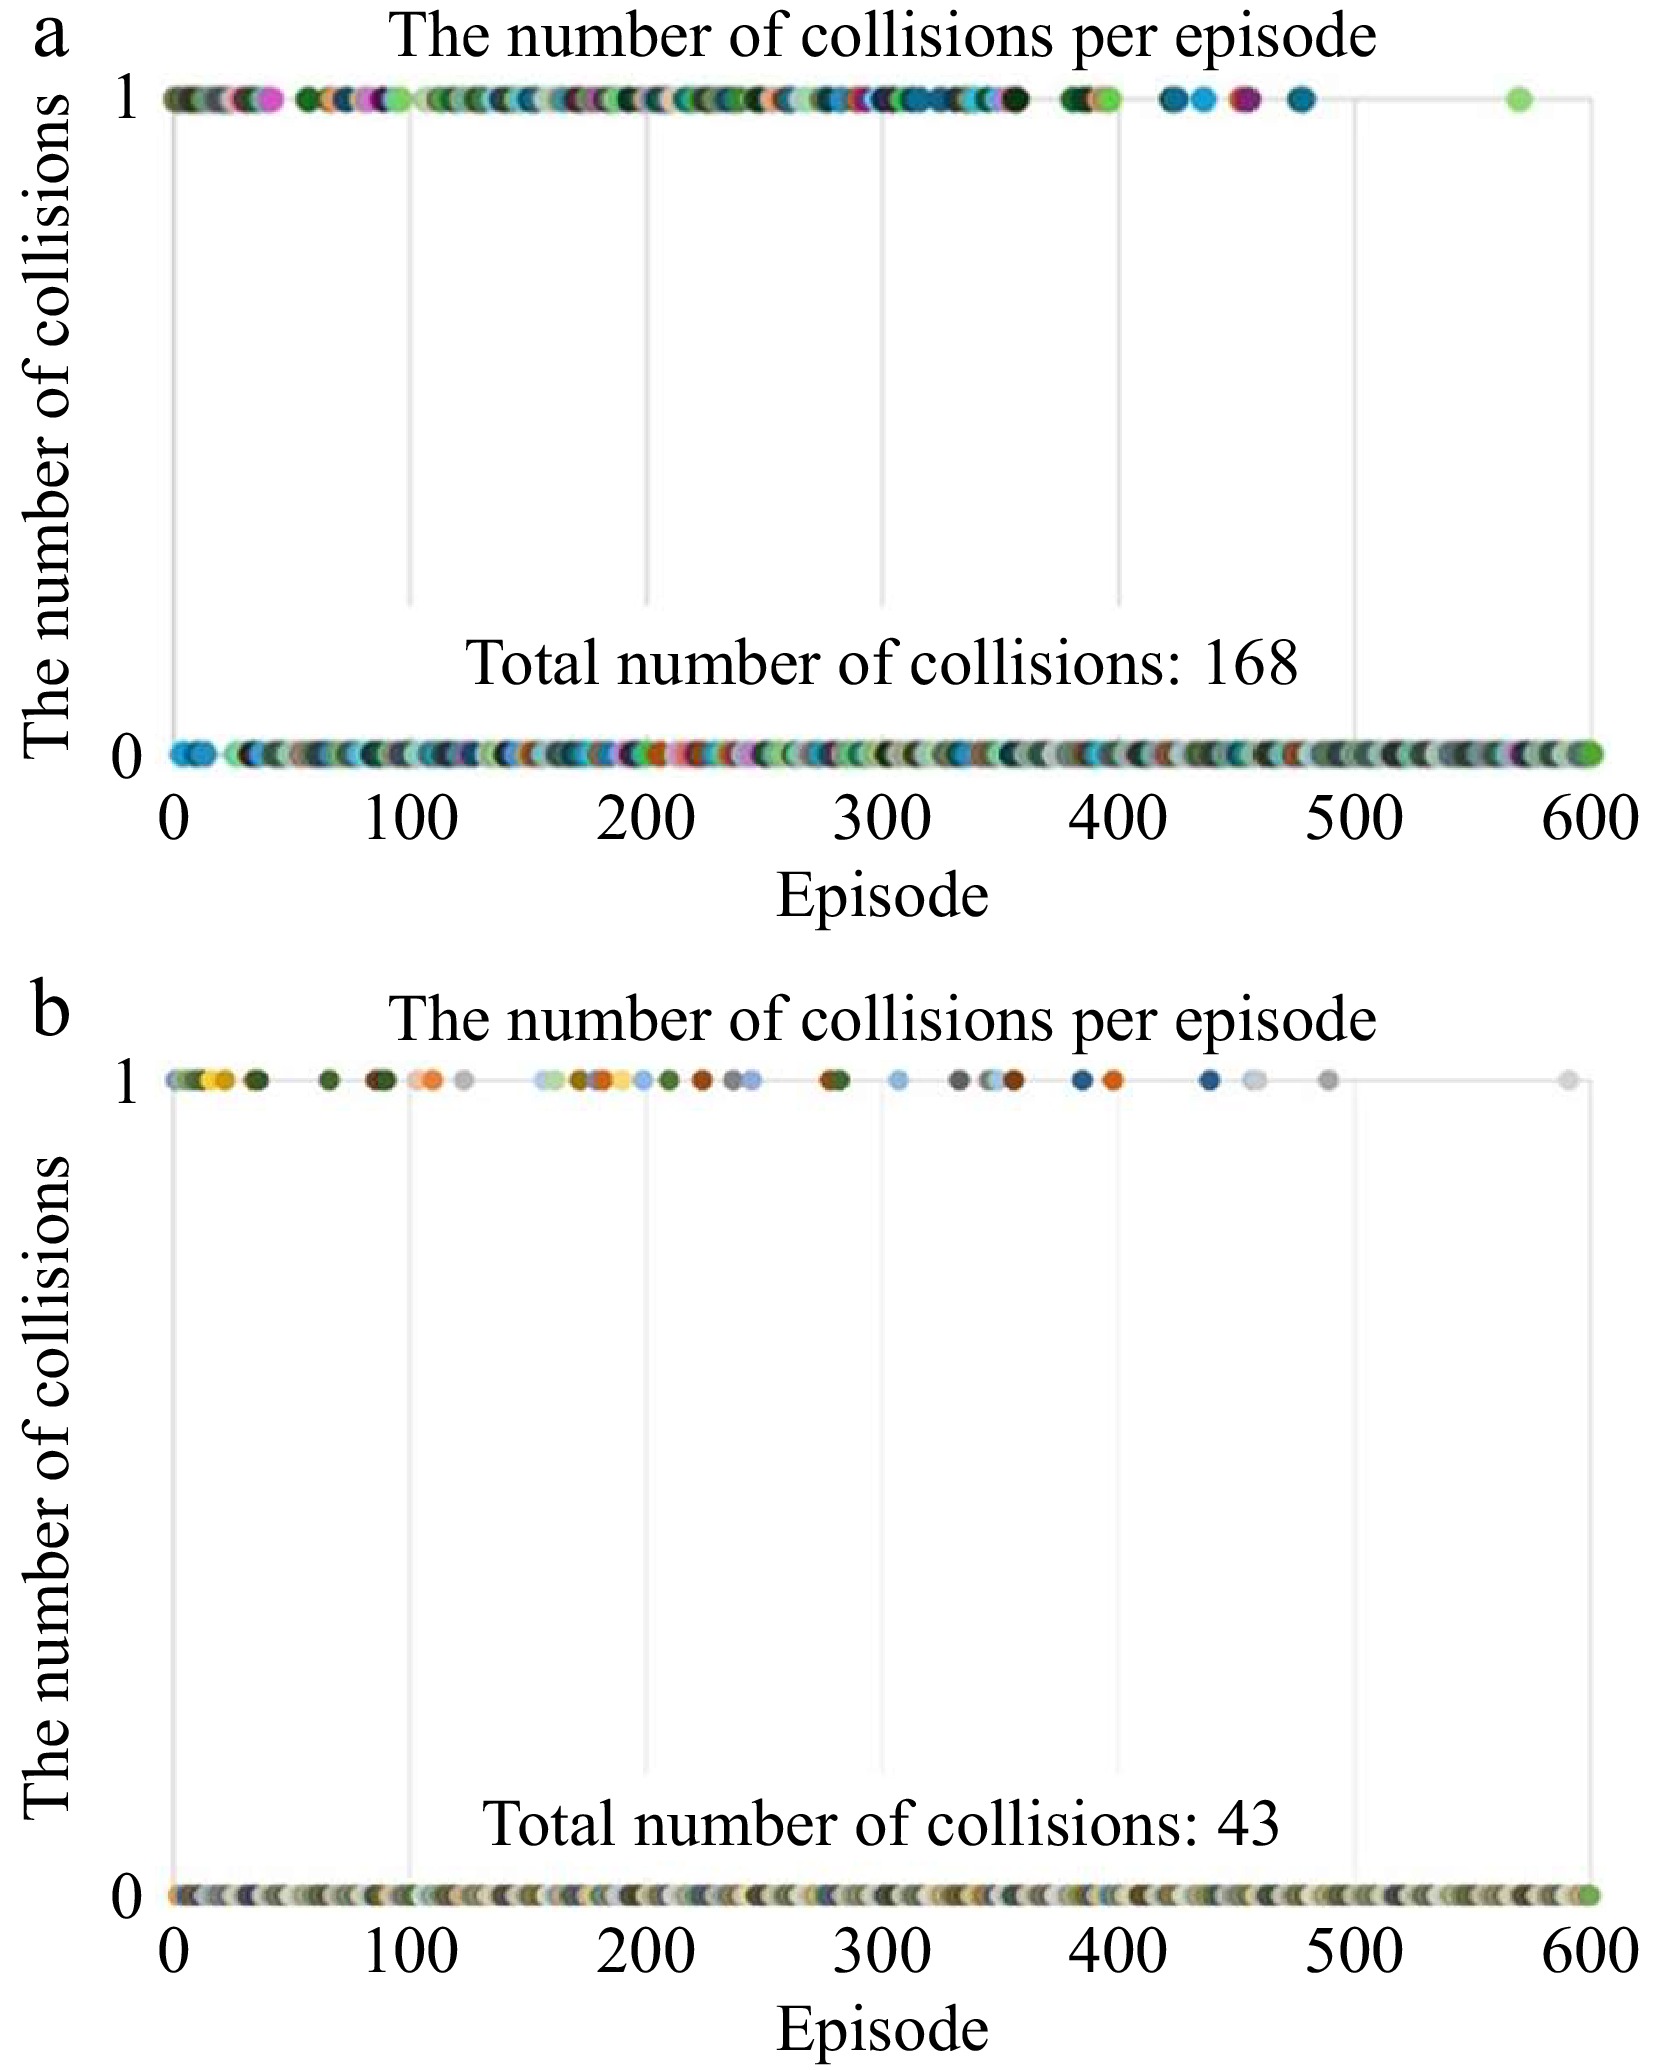
Figure 3.
Number of collisions per episode and cumulative collisions for 600 episodes. (a) Without safe reward function. (b) Safe reward function integrated.
-
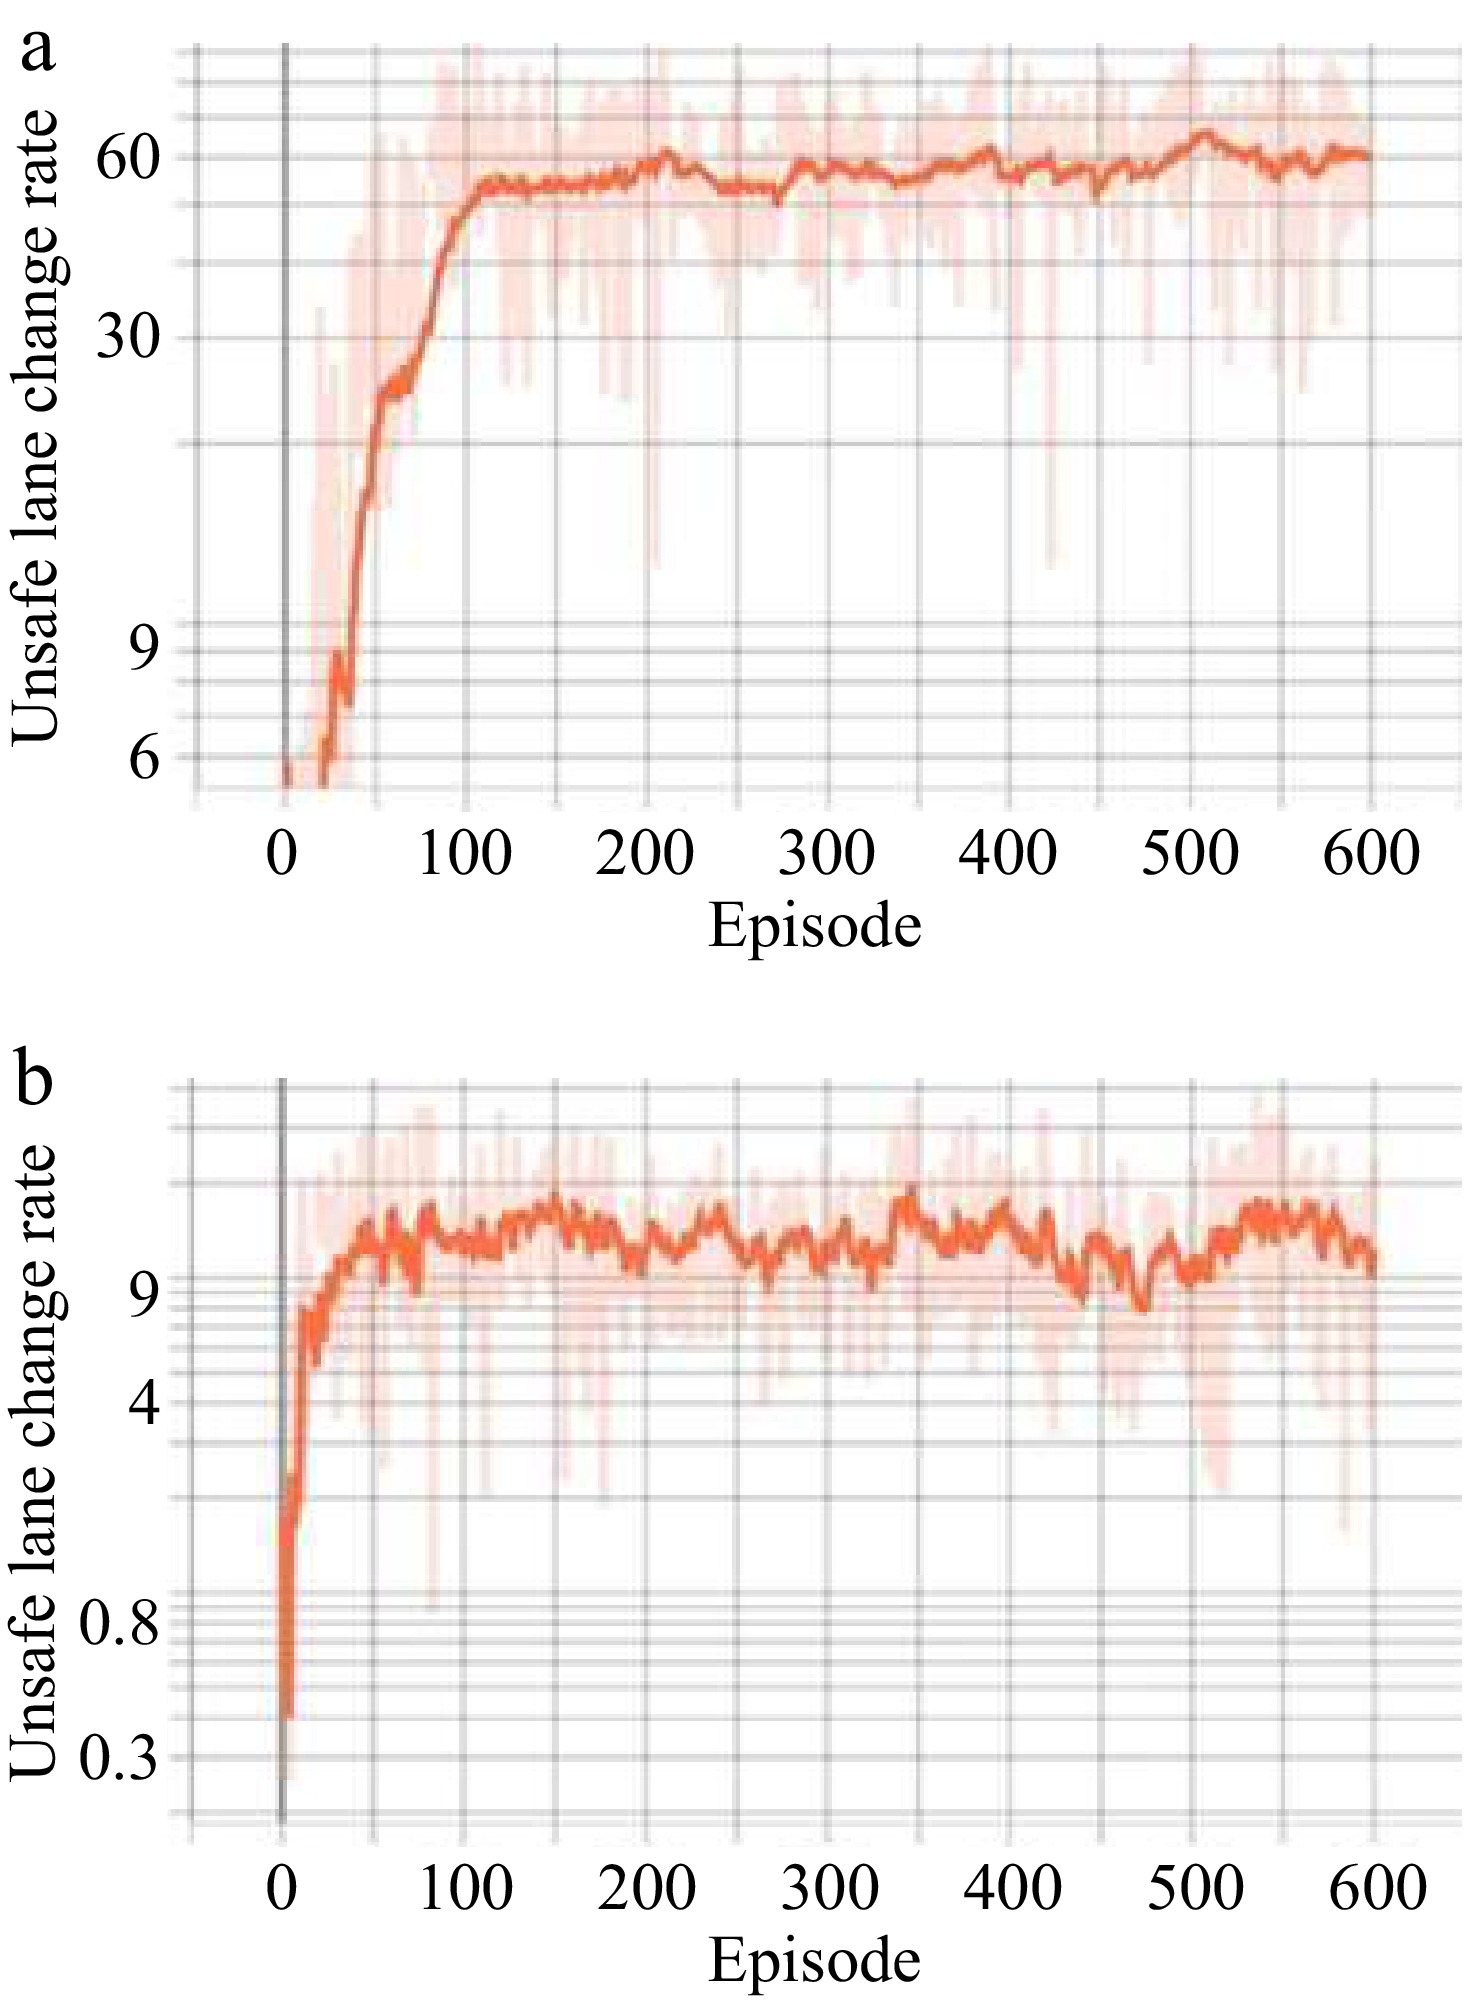
Figure 4.
Unsafe lane change rate per episode. (a) Without safe reward function. (b) Safe reward function integrated
-
Approaches Ave. LC duration (s)↓ Unsafe LC rate ↓ #LC collision ↓ LC2013 8.3 37.89% 115 LCD 3.4 12.91% 41 BRL-RPF 6.7 9.8% 40 Our model 2.7 9.4% 43 Bold values indicate the best performance in each column. Table 1.
Model performance comparison.
Figures
(4)
Tables
(1)