-
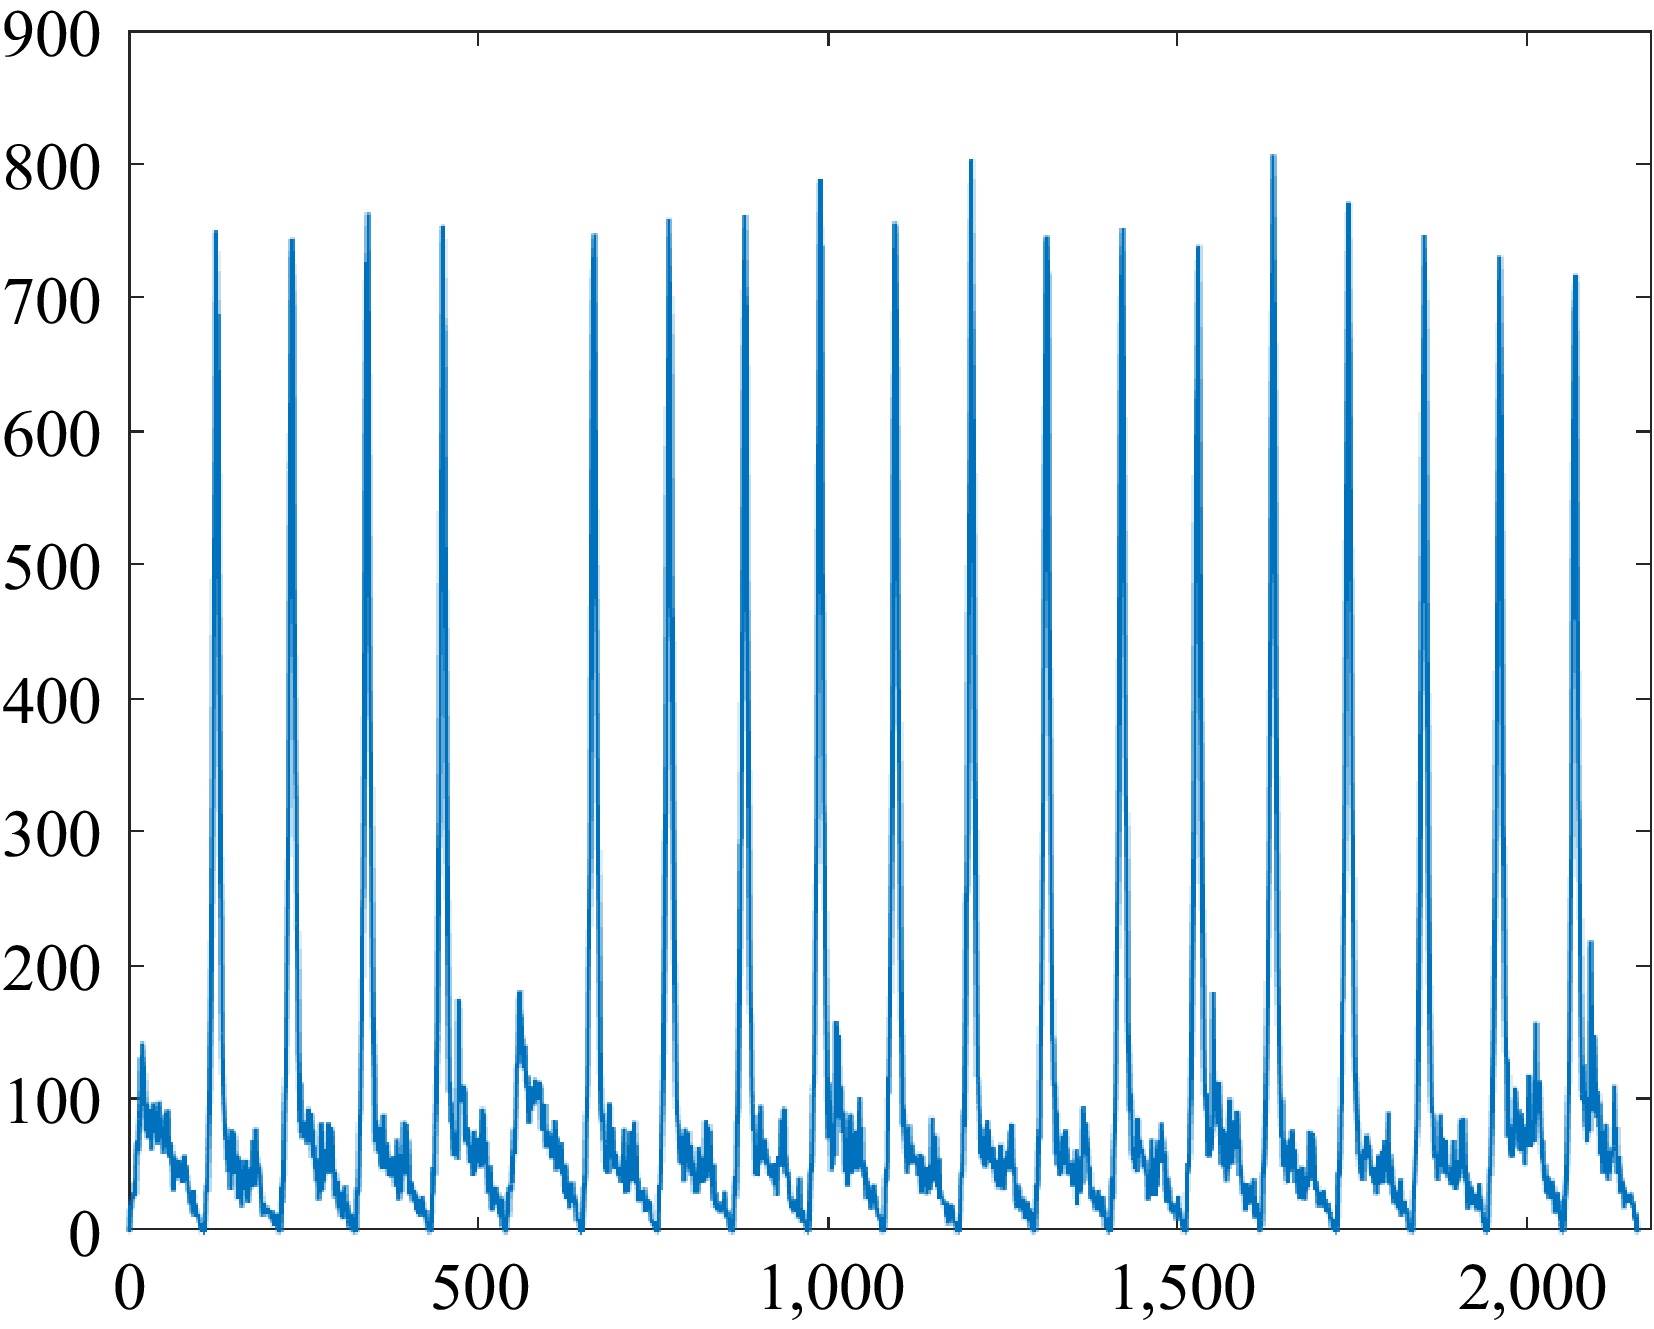
Figure 1.
Inbound passenger flow variation.
-
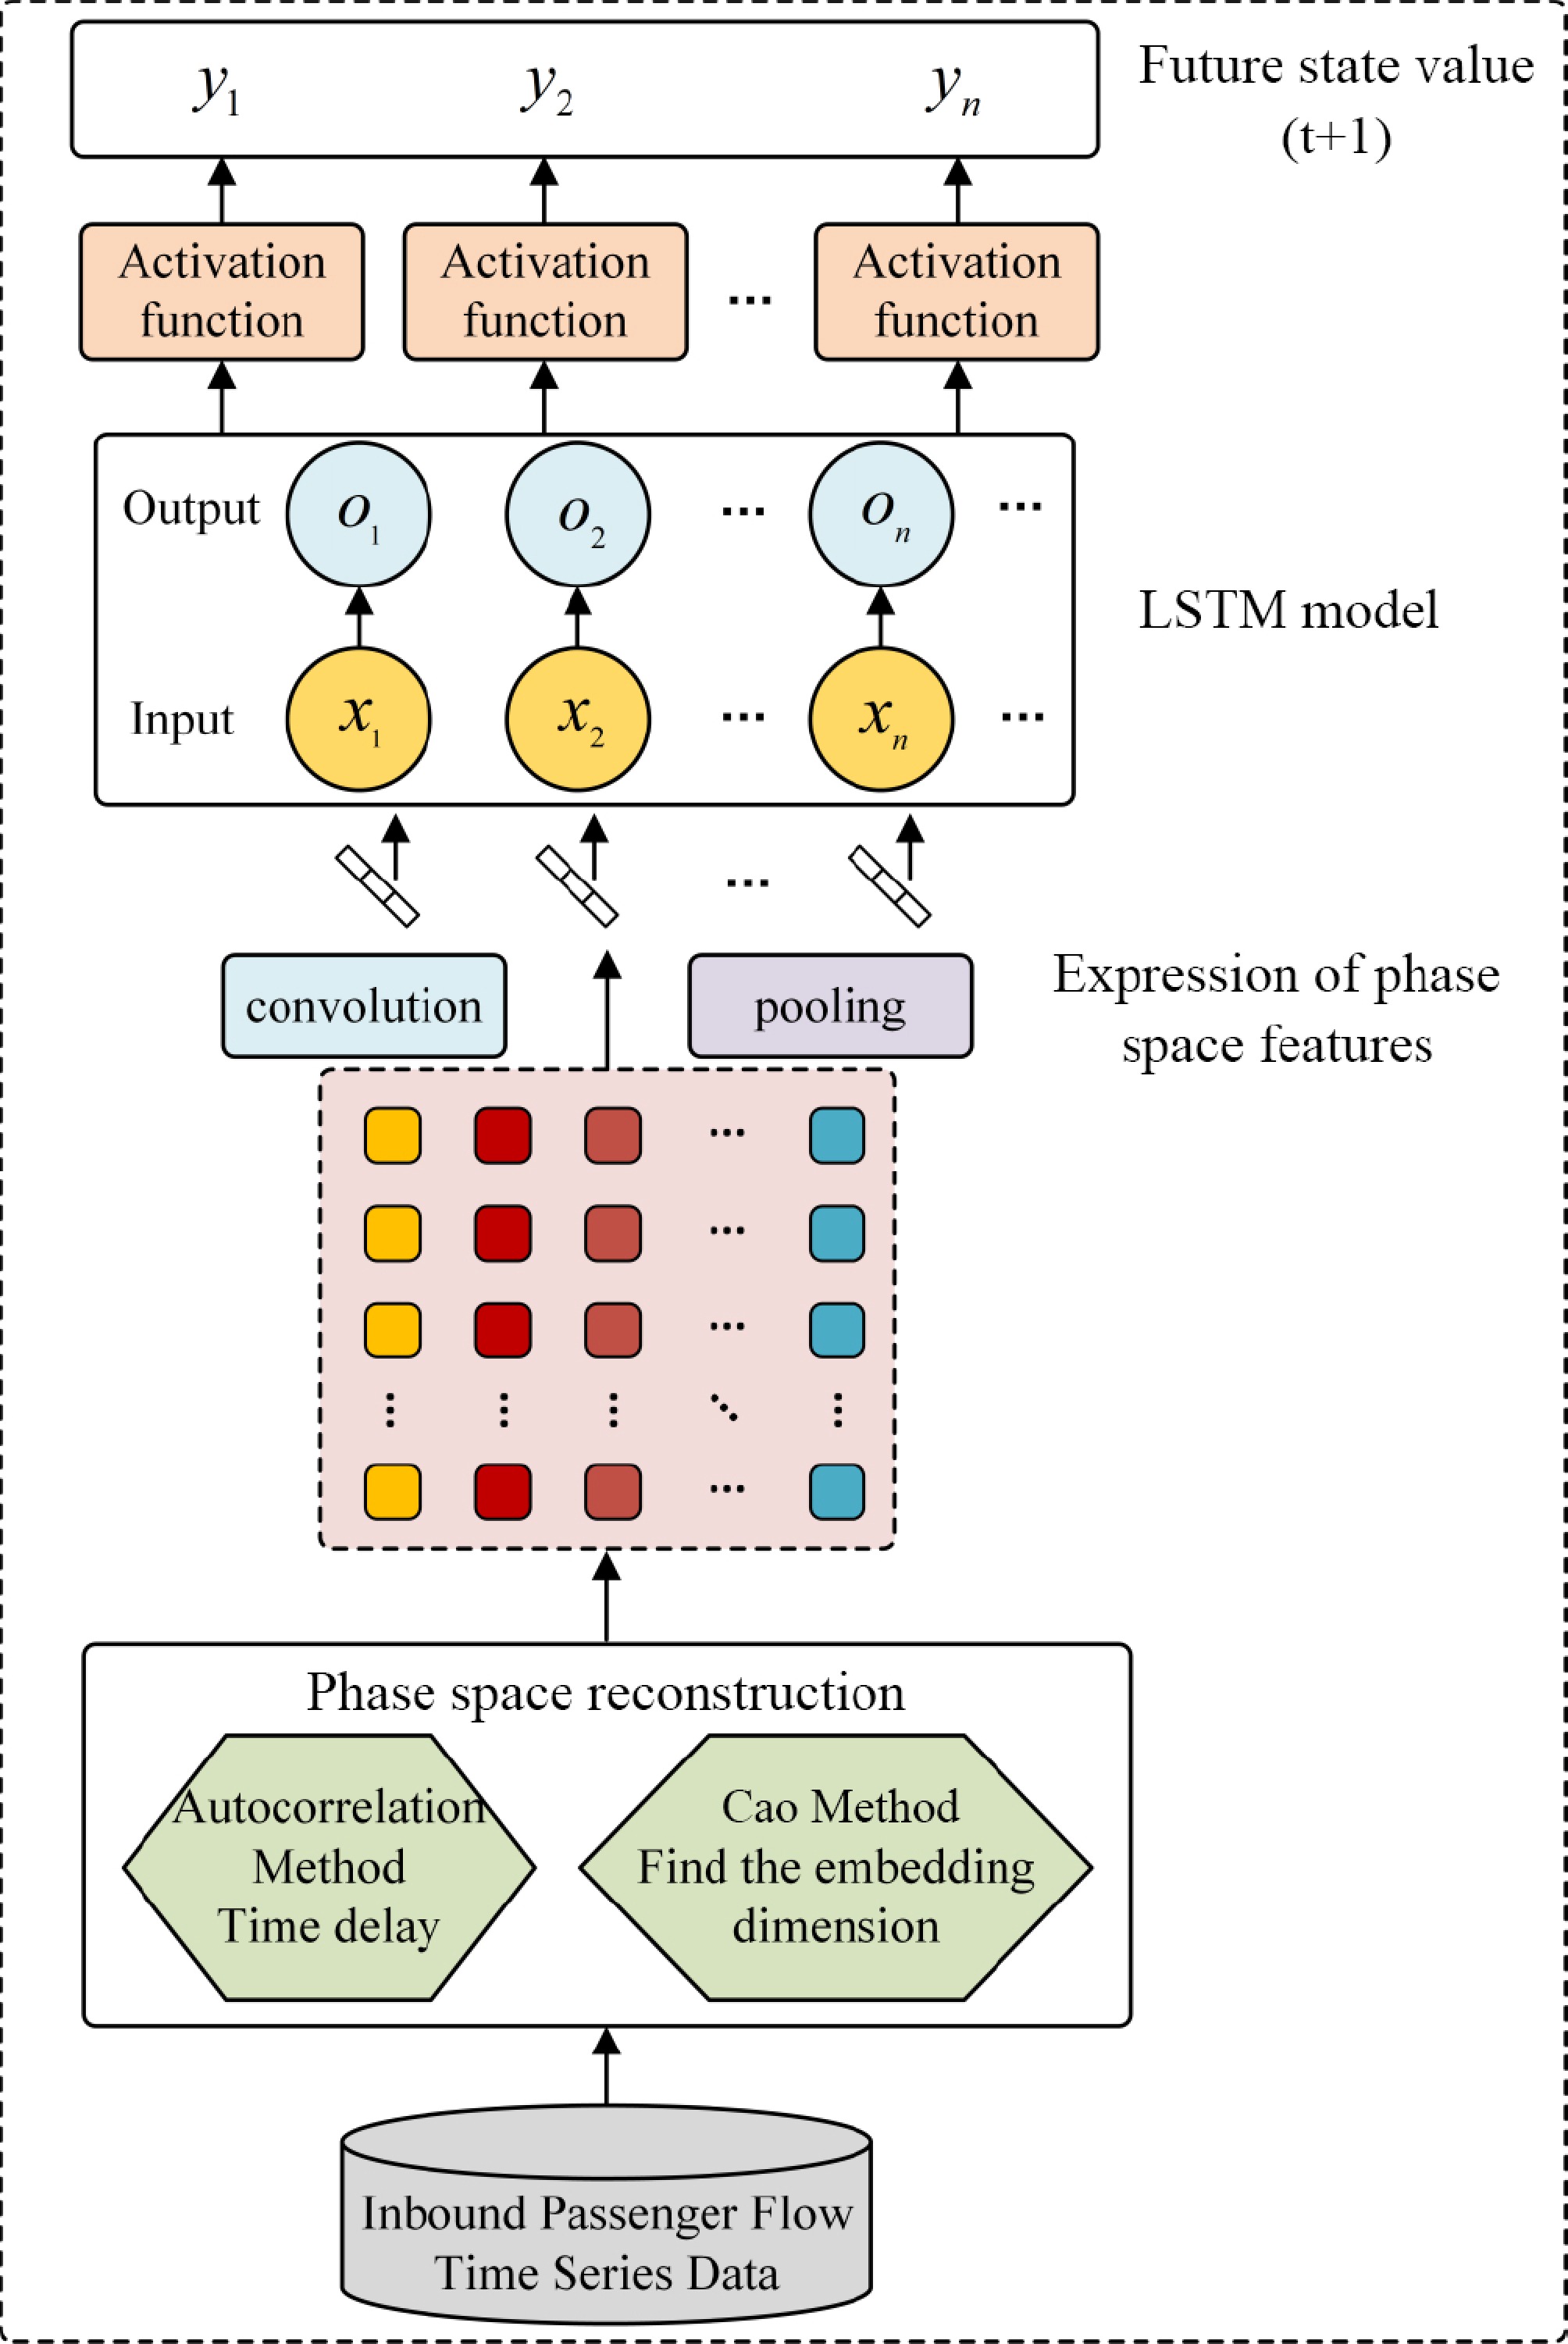
Figure 2.
Structure of the PSR-CNN-LSTM model.
-
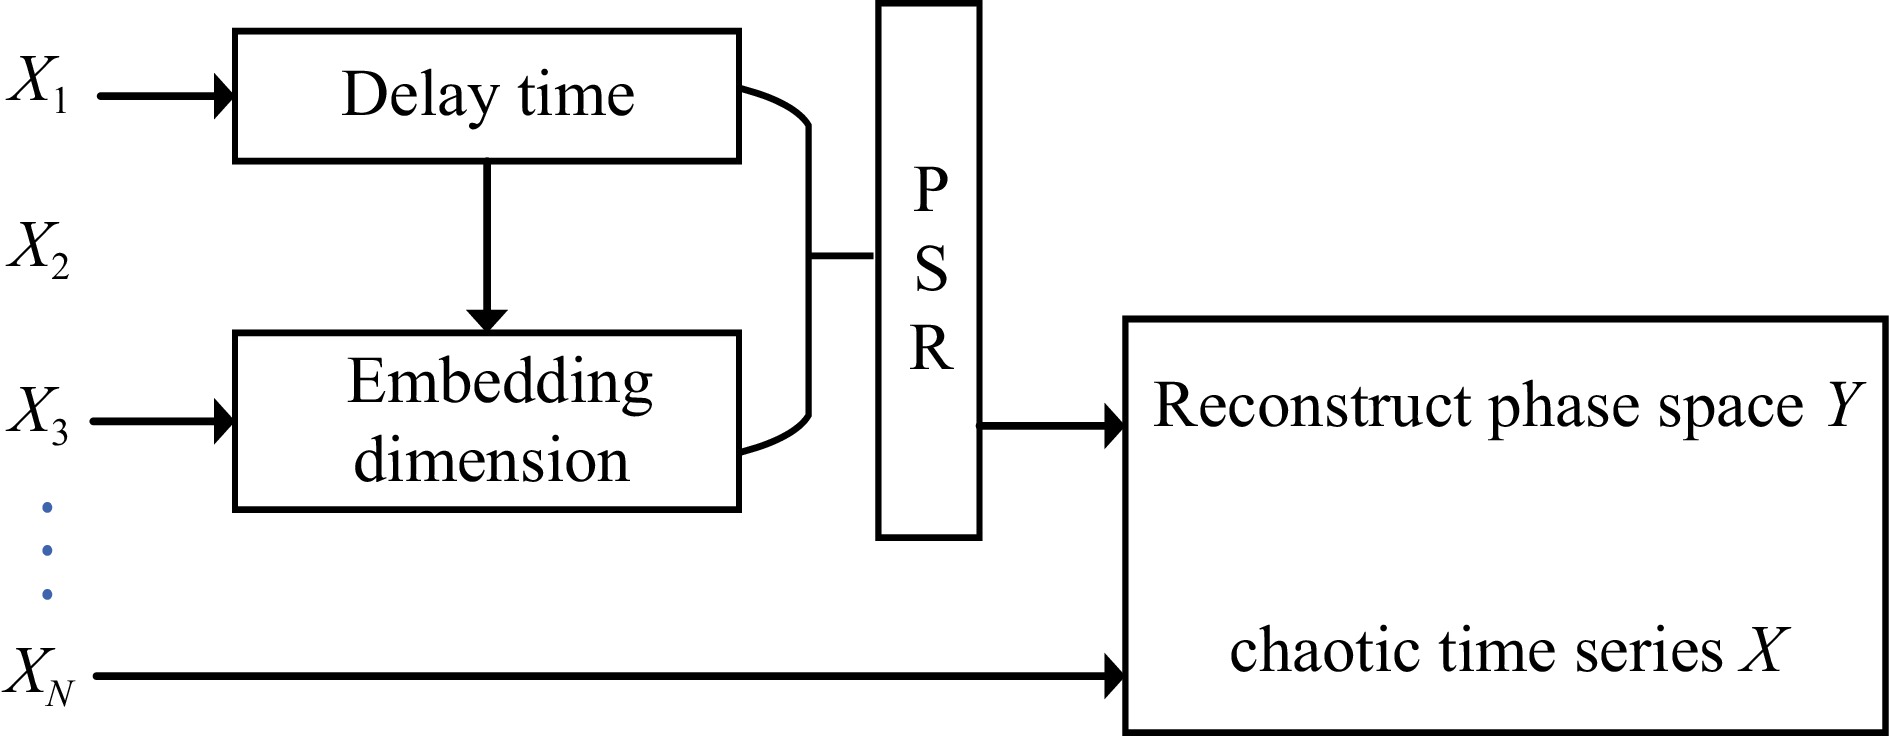
Figure 3.
The process of phase space reconstruction.
-
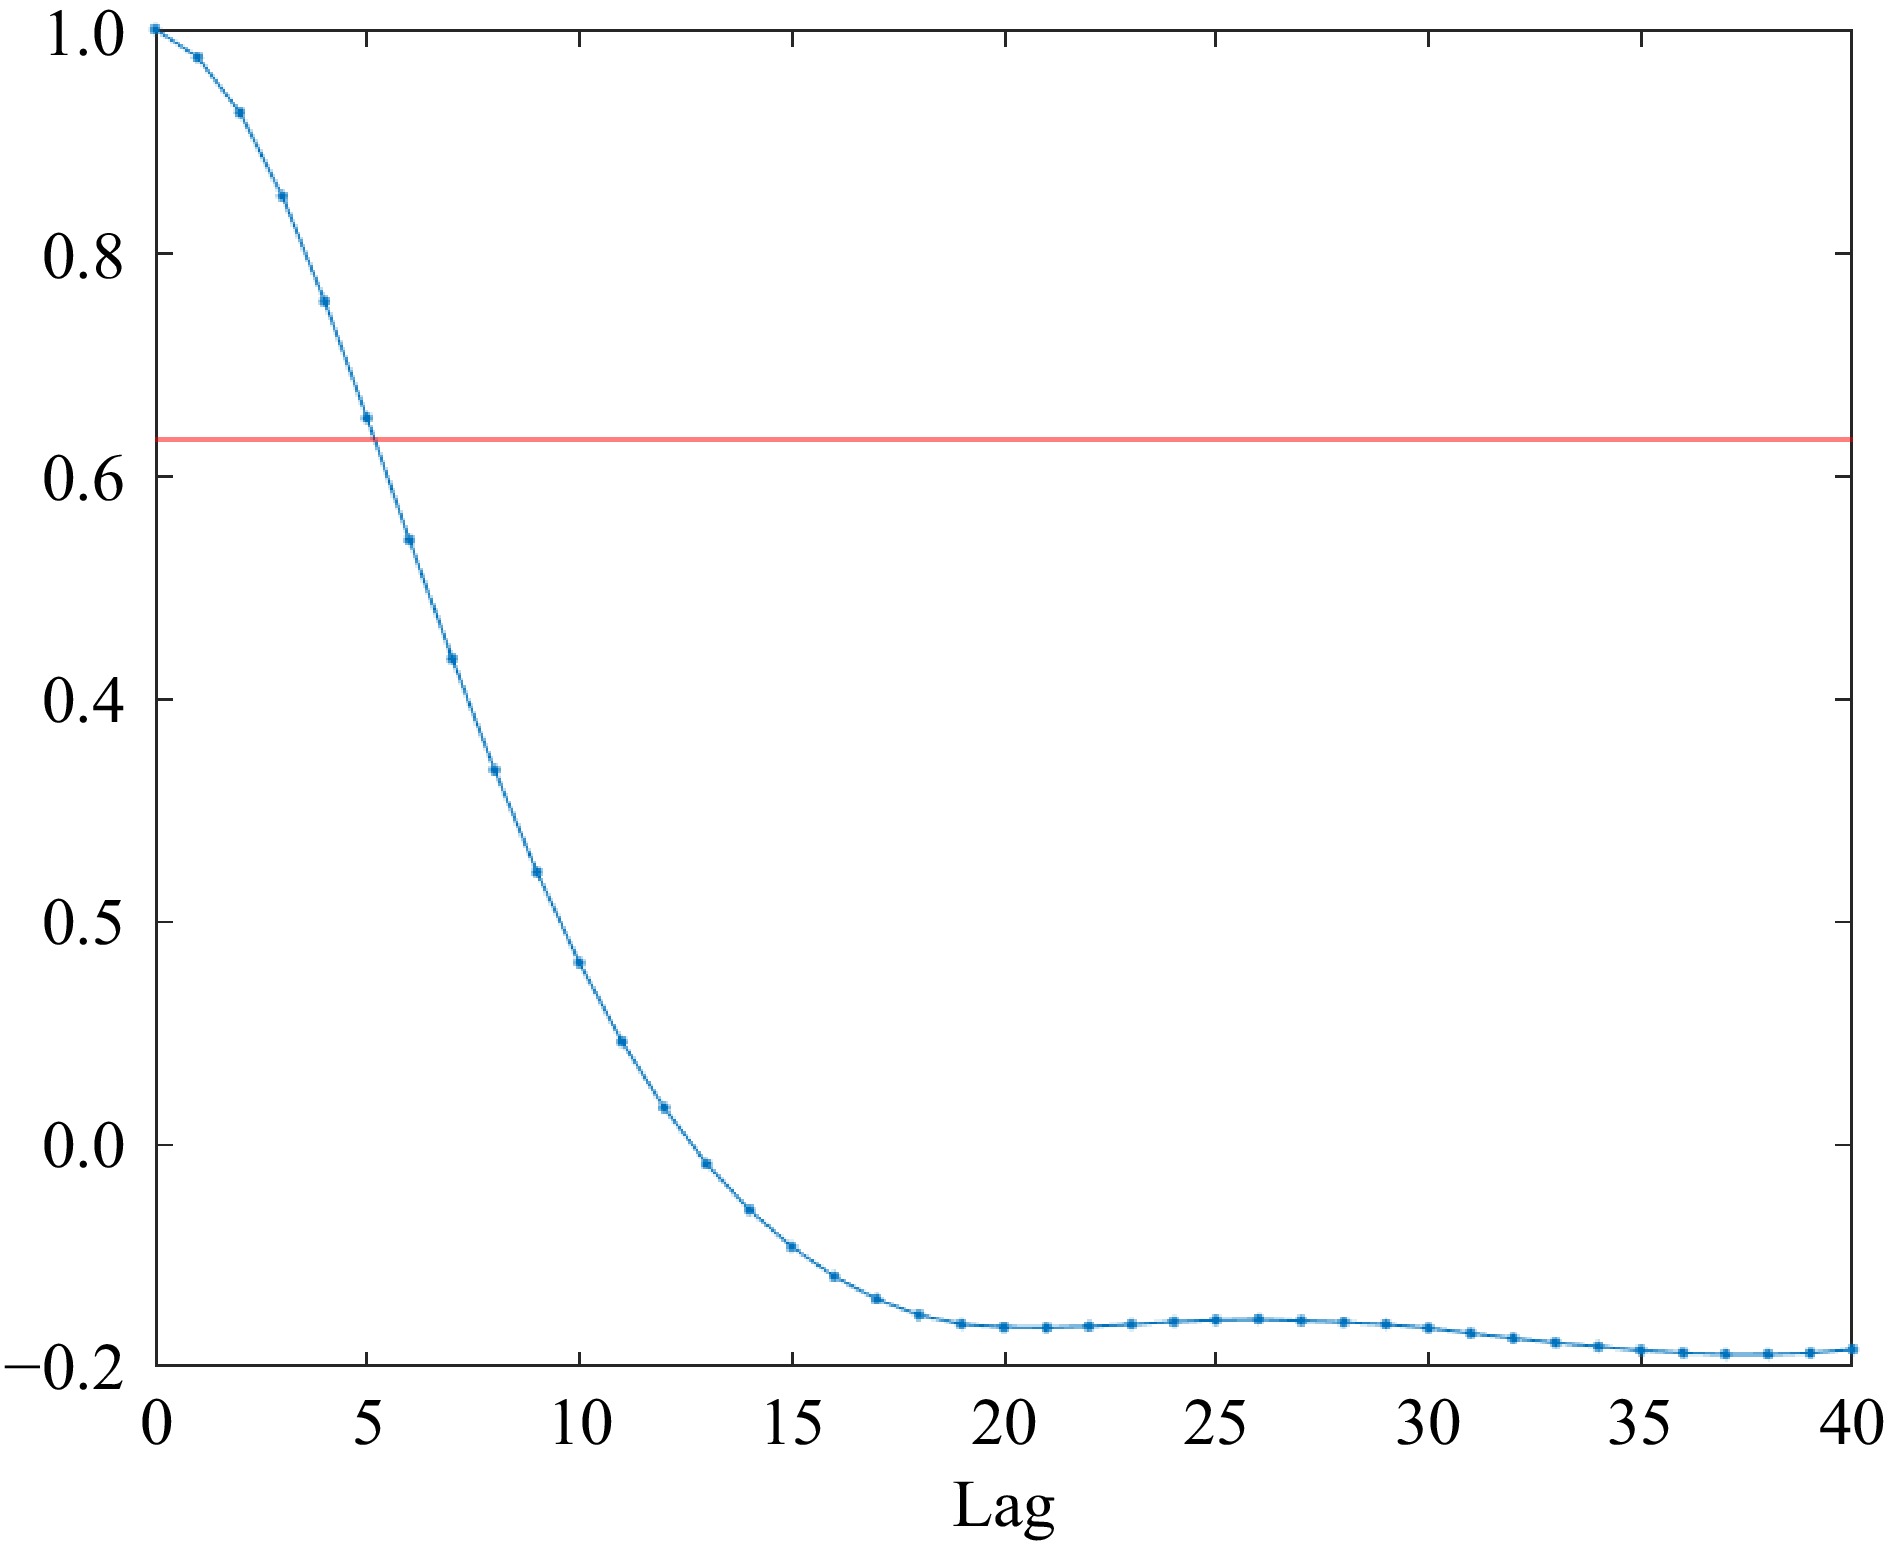
Figure 4.
Autocorrelation coefficient.
-
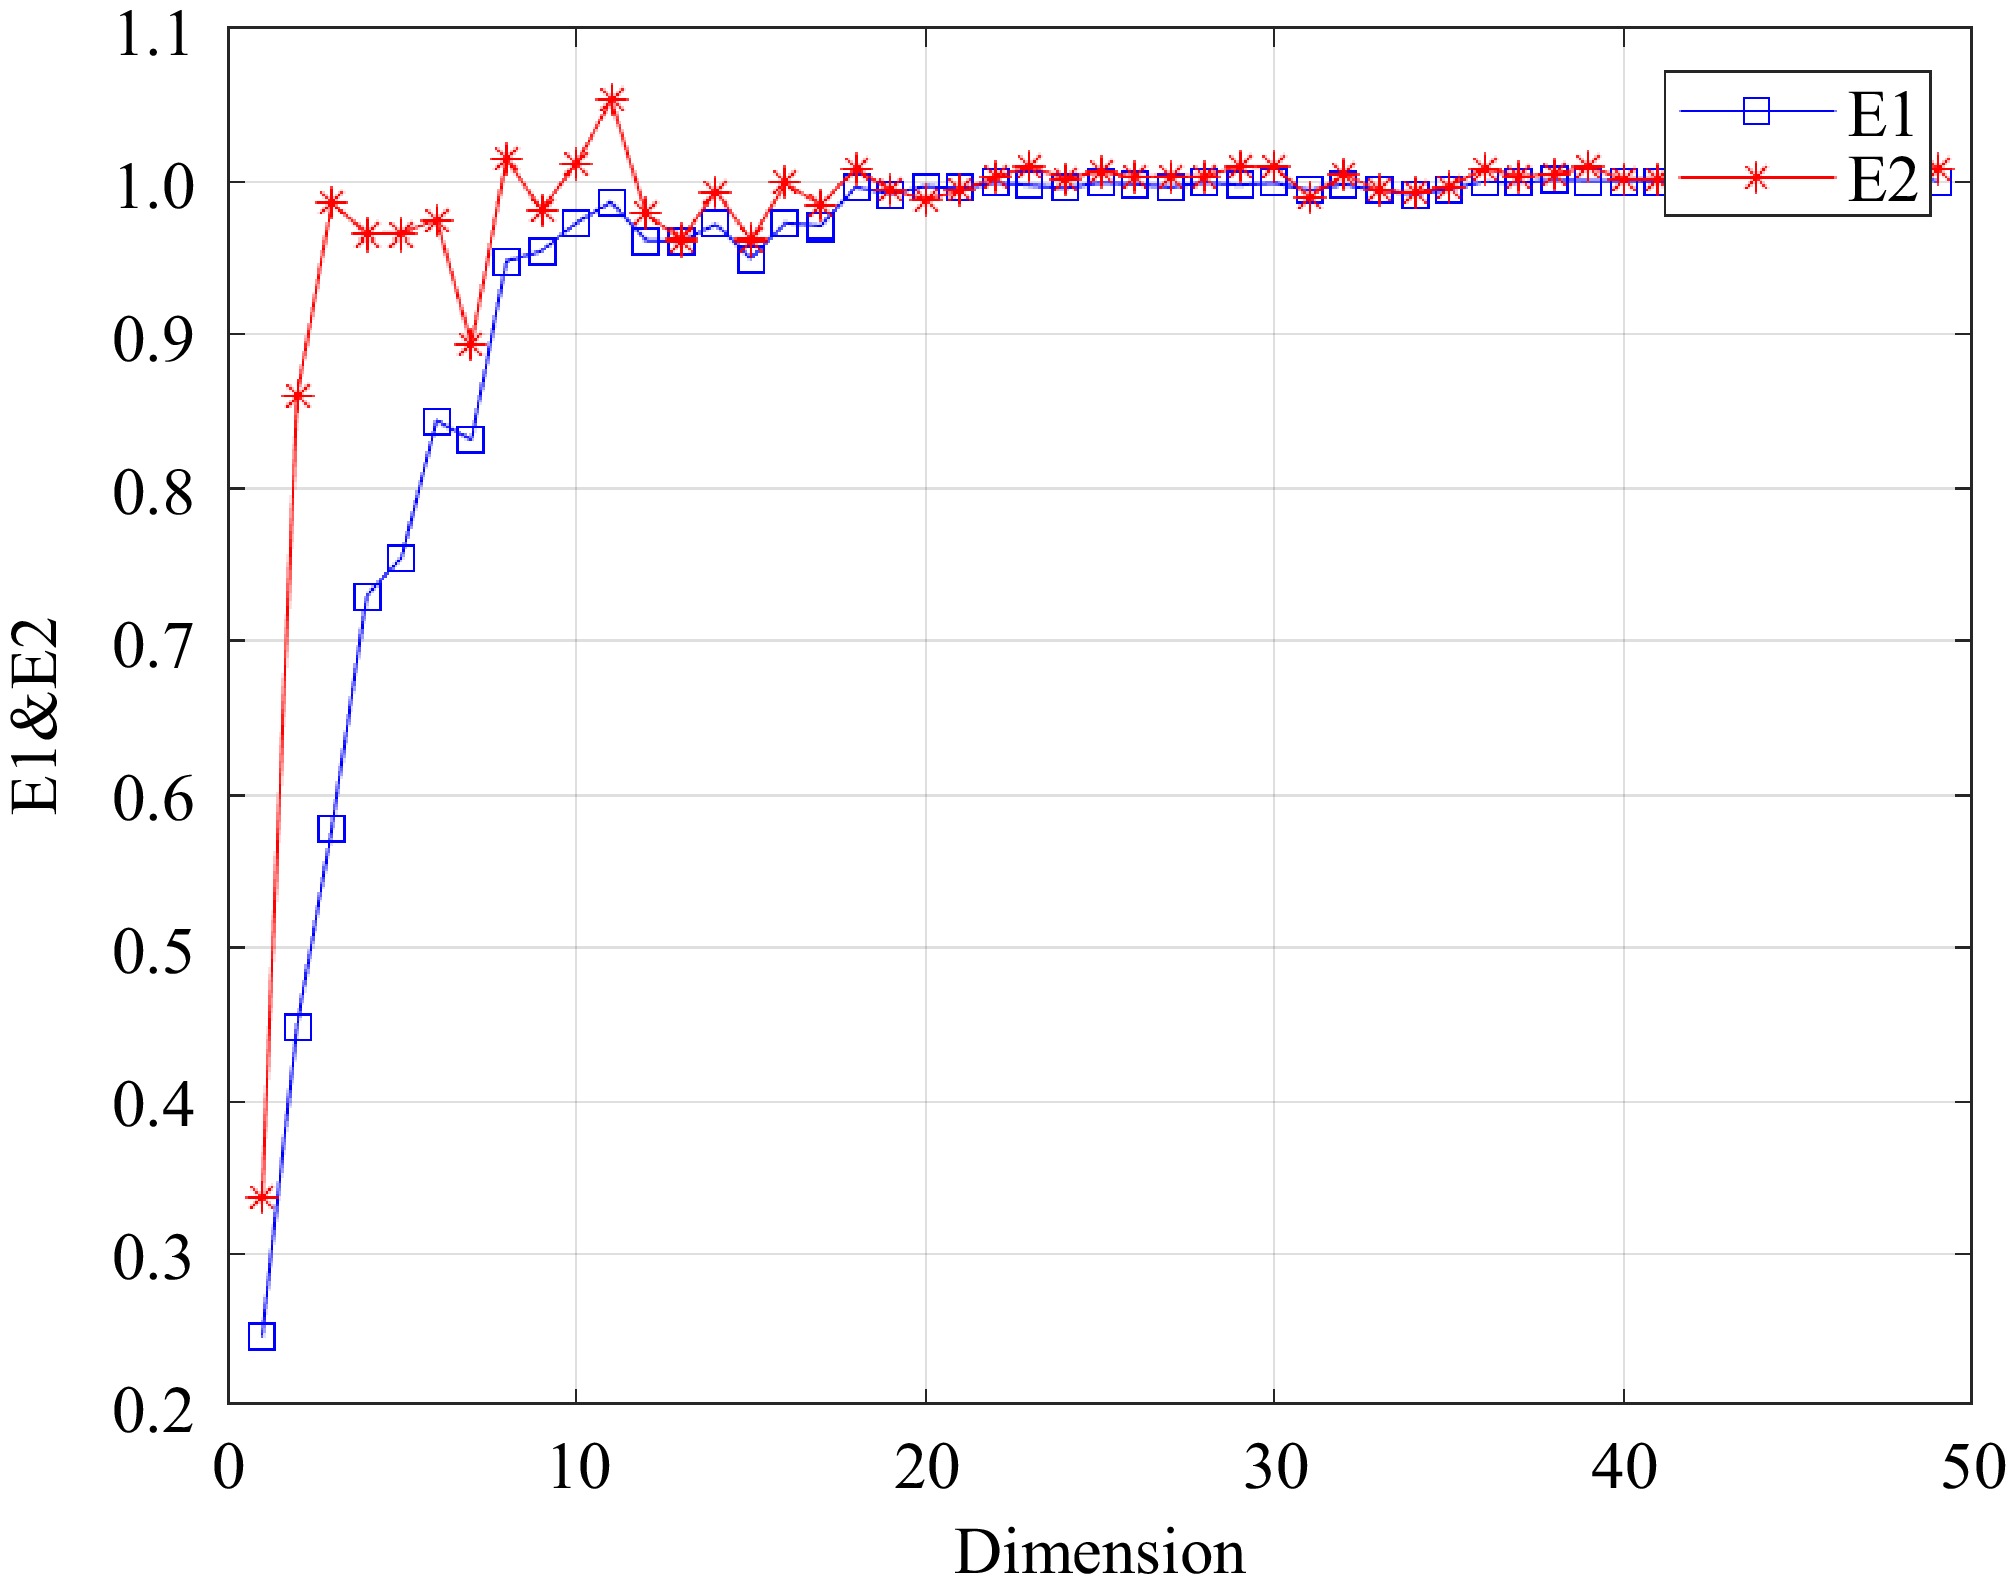
Figure 5.
Embedding dimension.
-
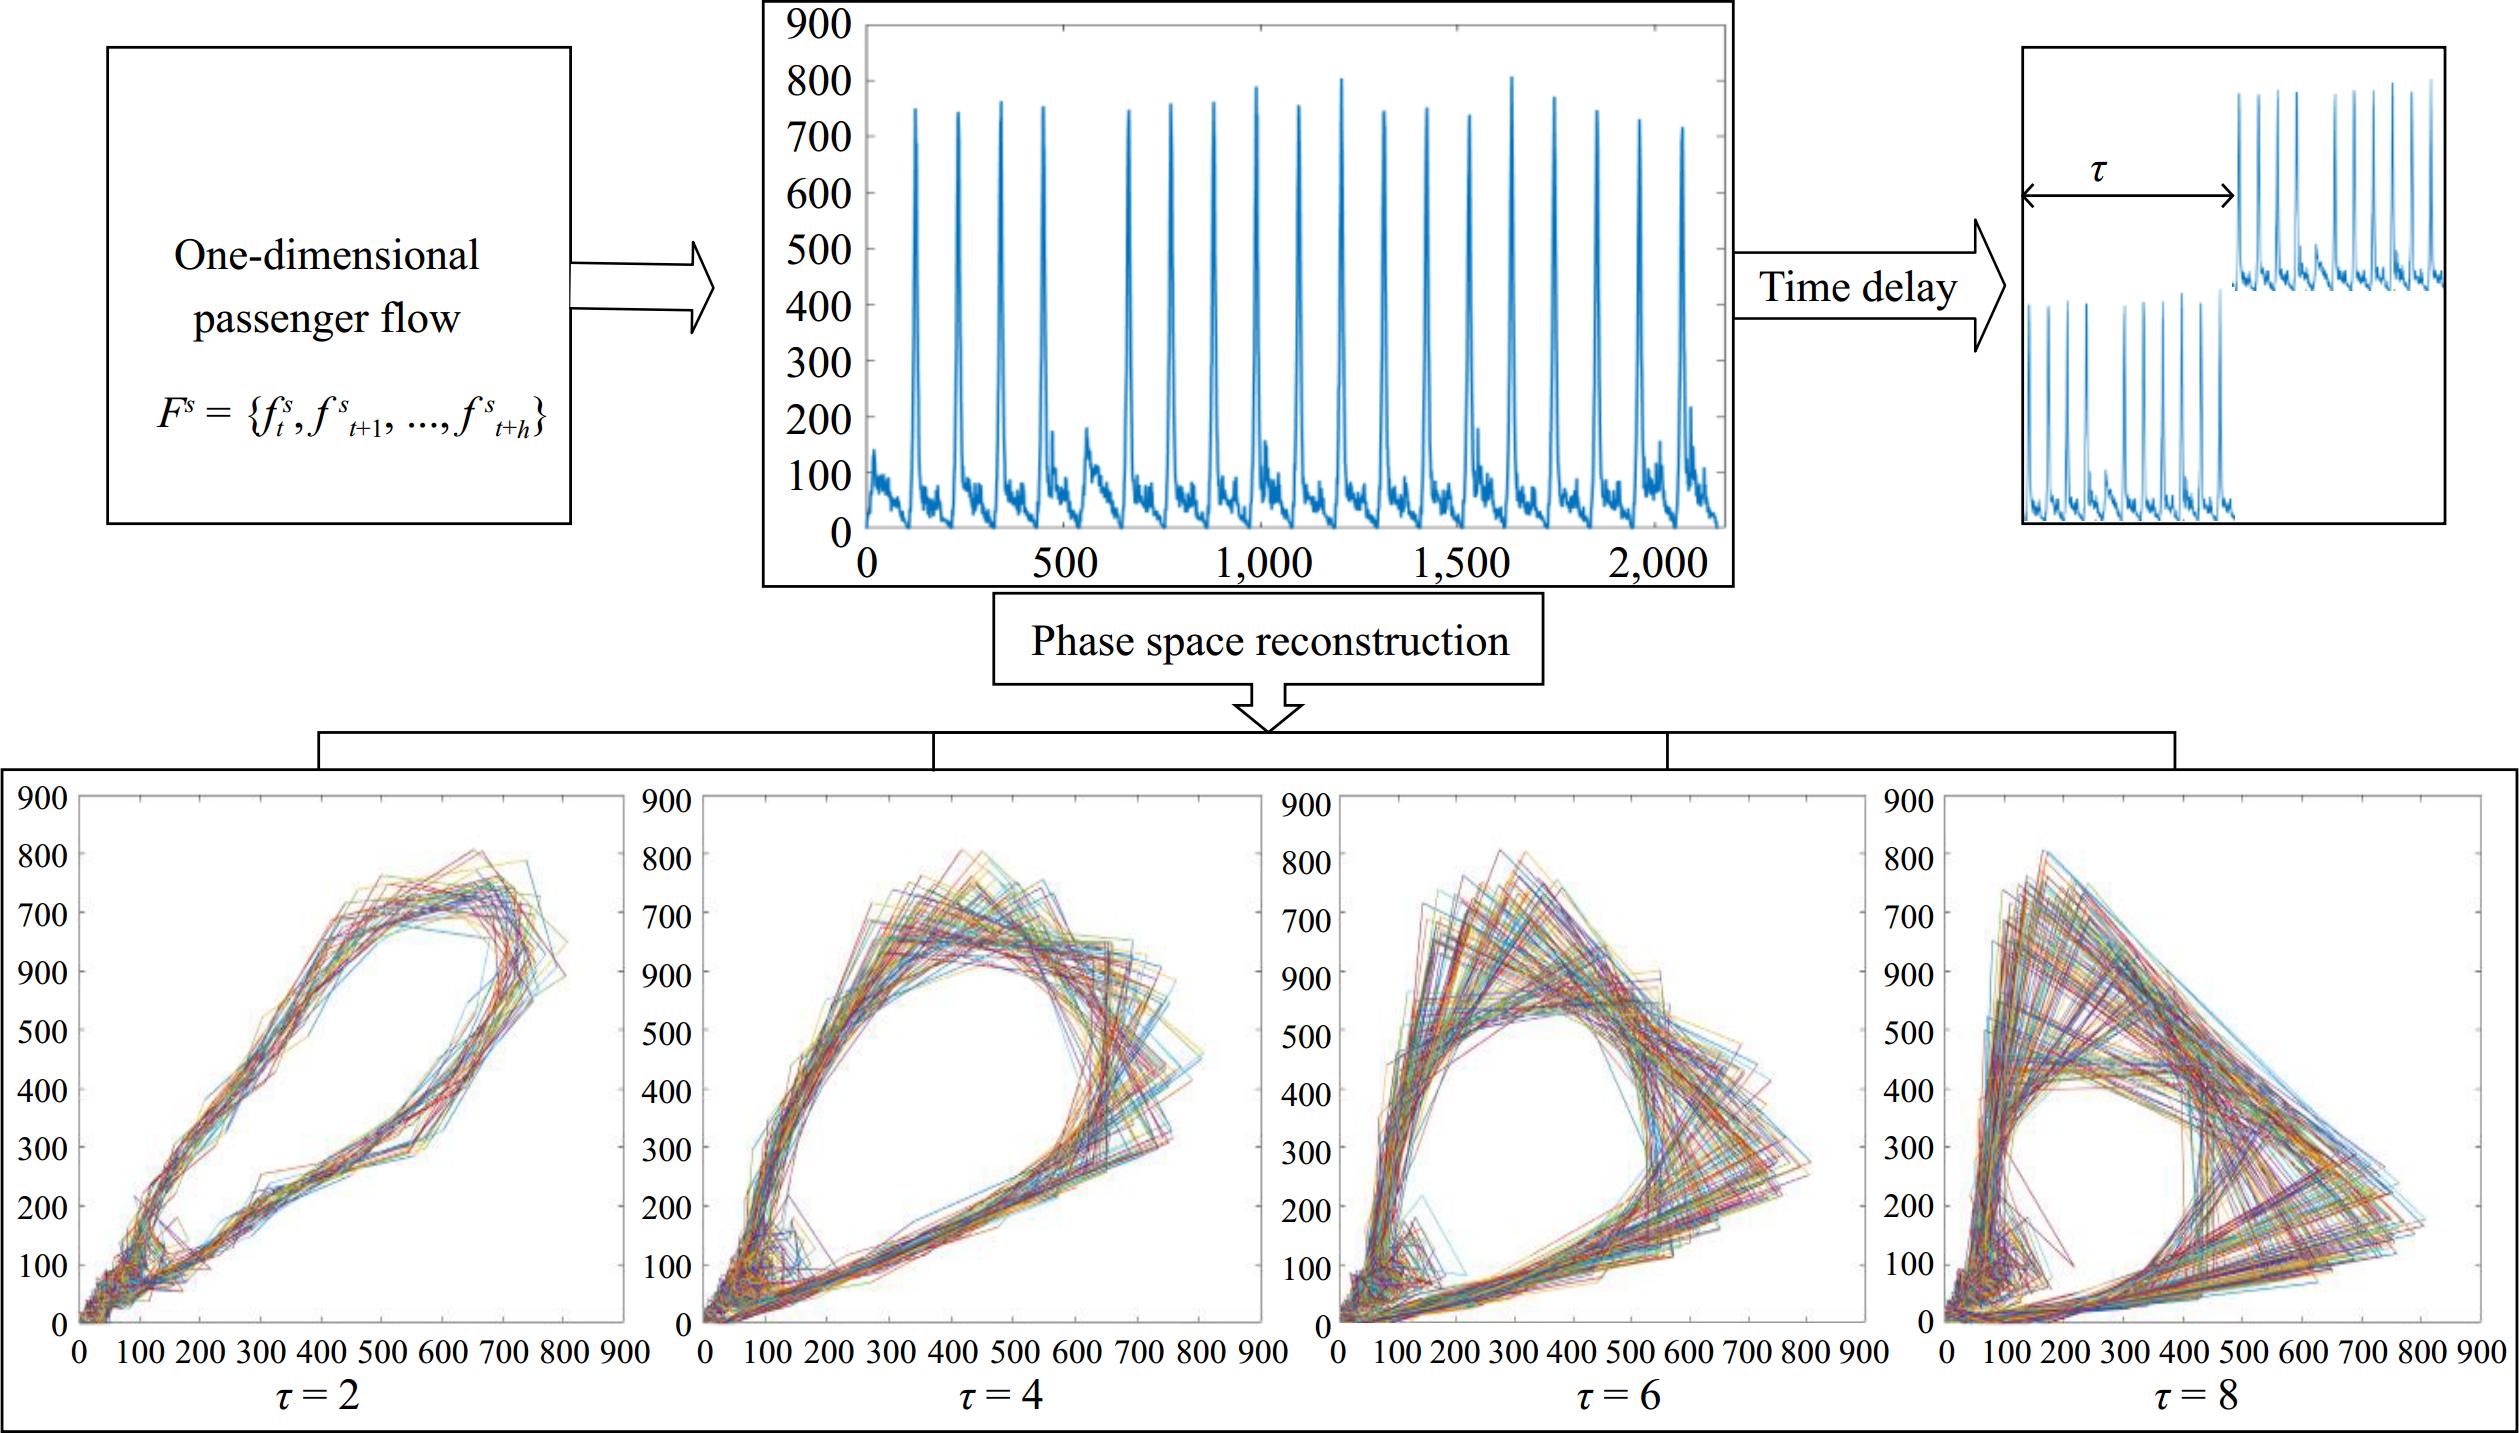
Figure 6.
Phase space at different delay times.
-
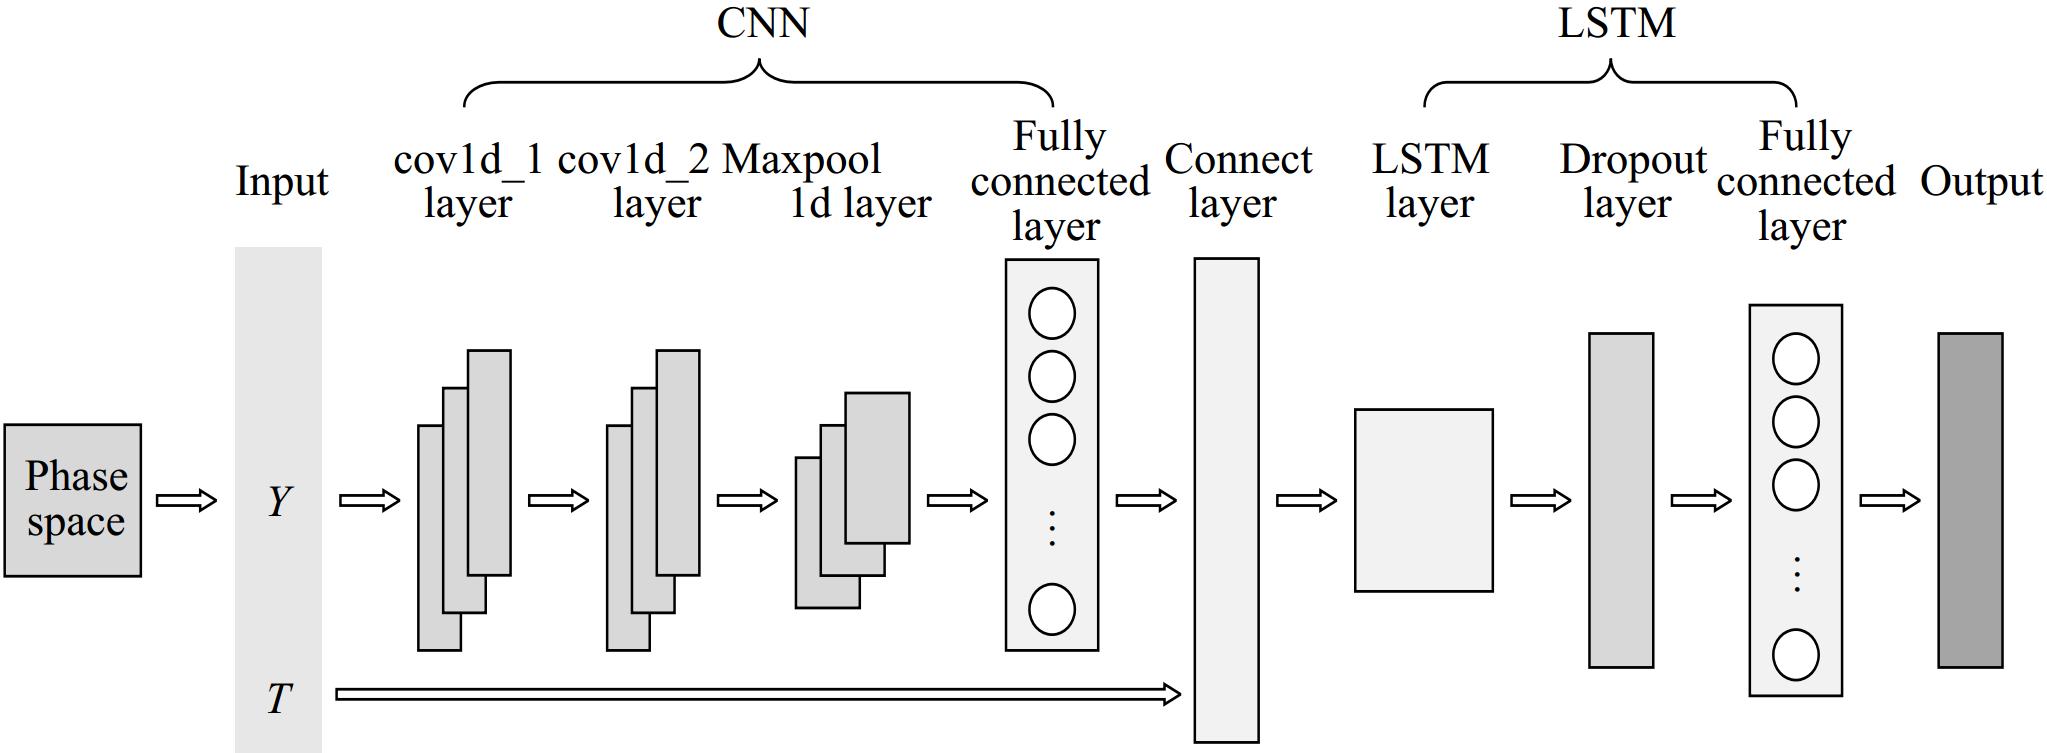
Figure 7.
CNN-LSTM structure.
-
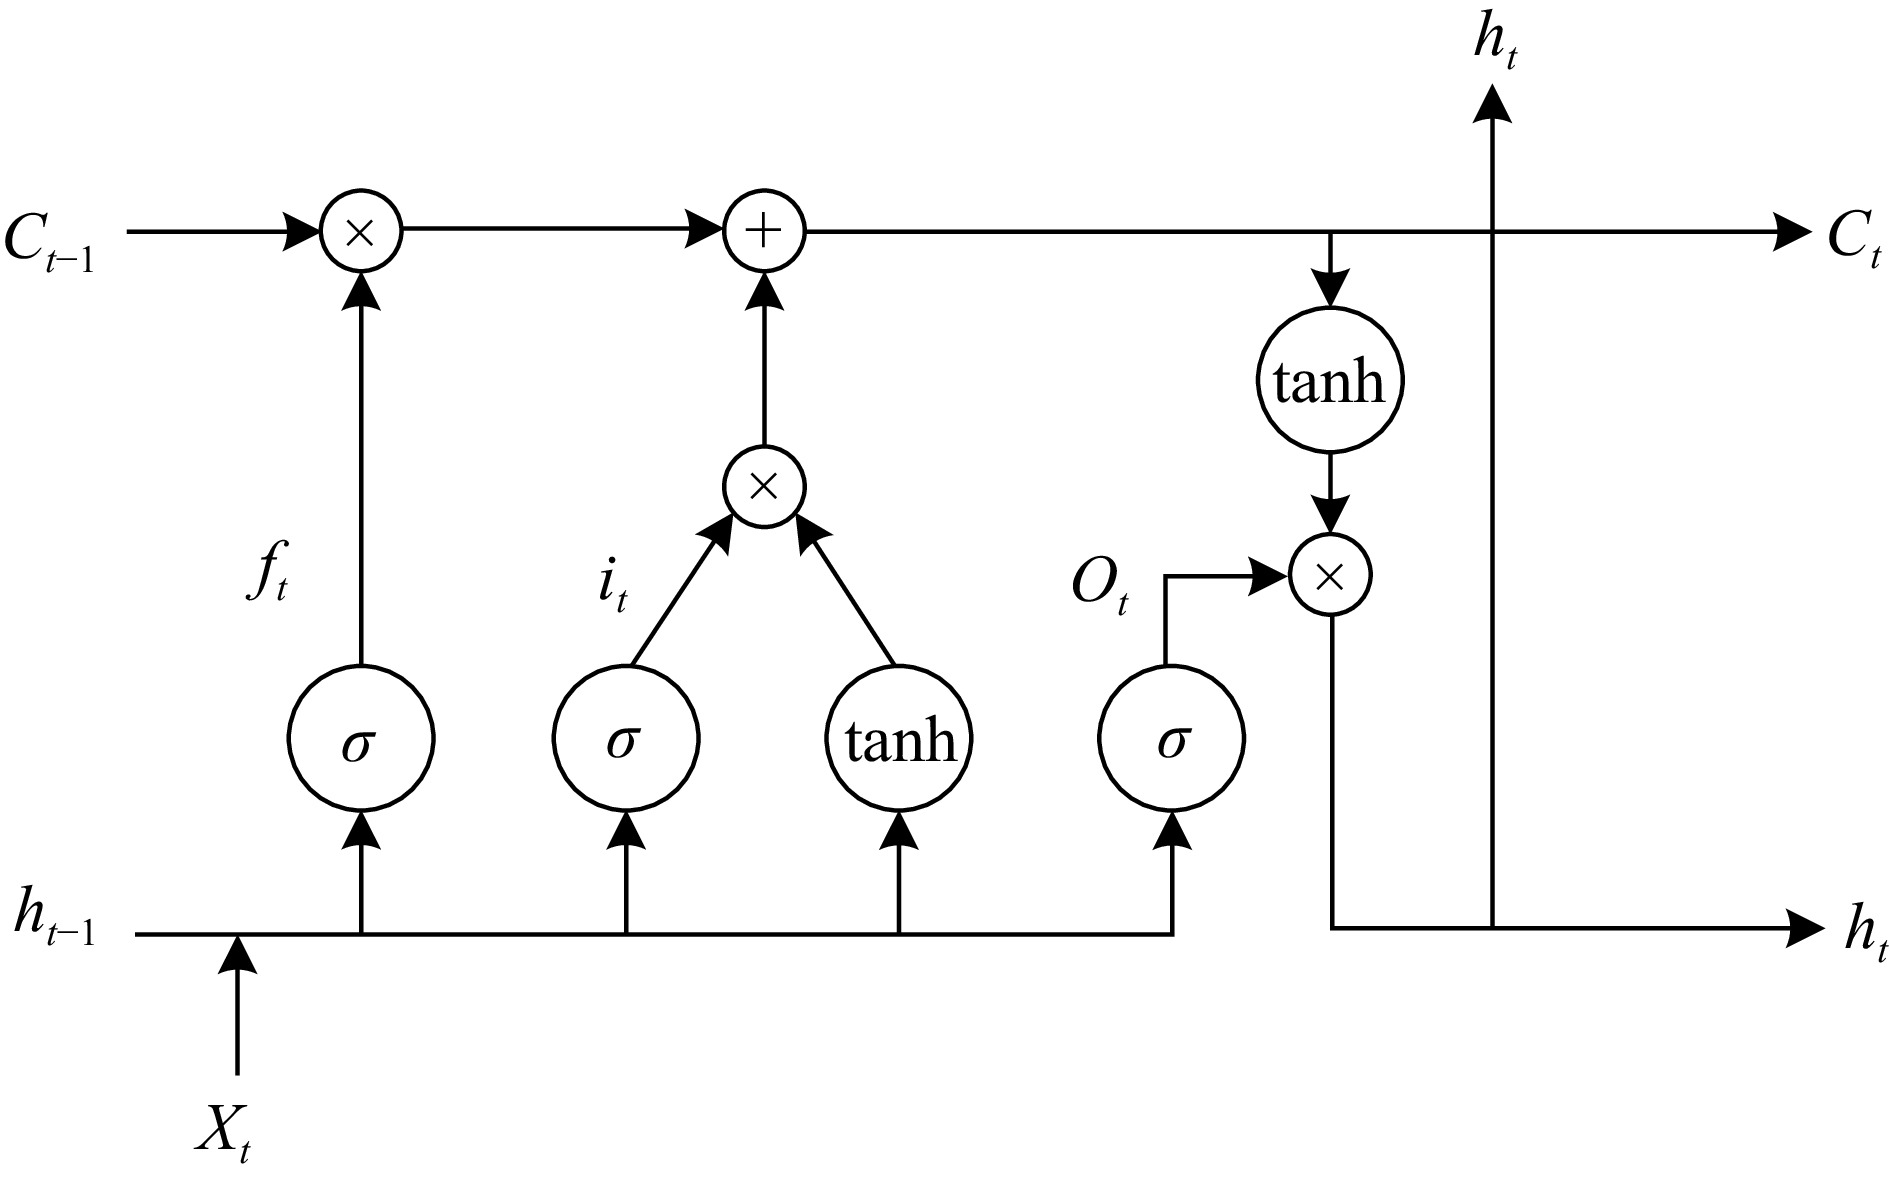
Figure 8.
LSTM internal structure diagram.
-
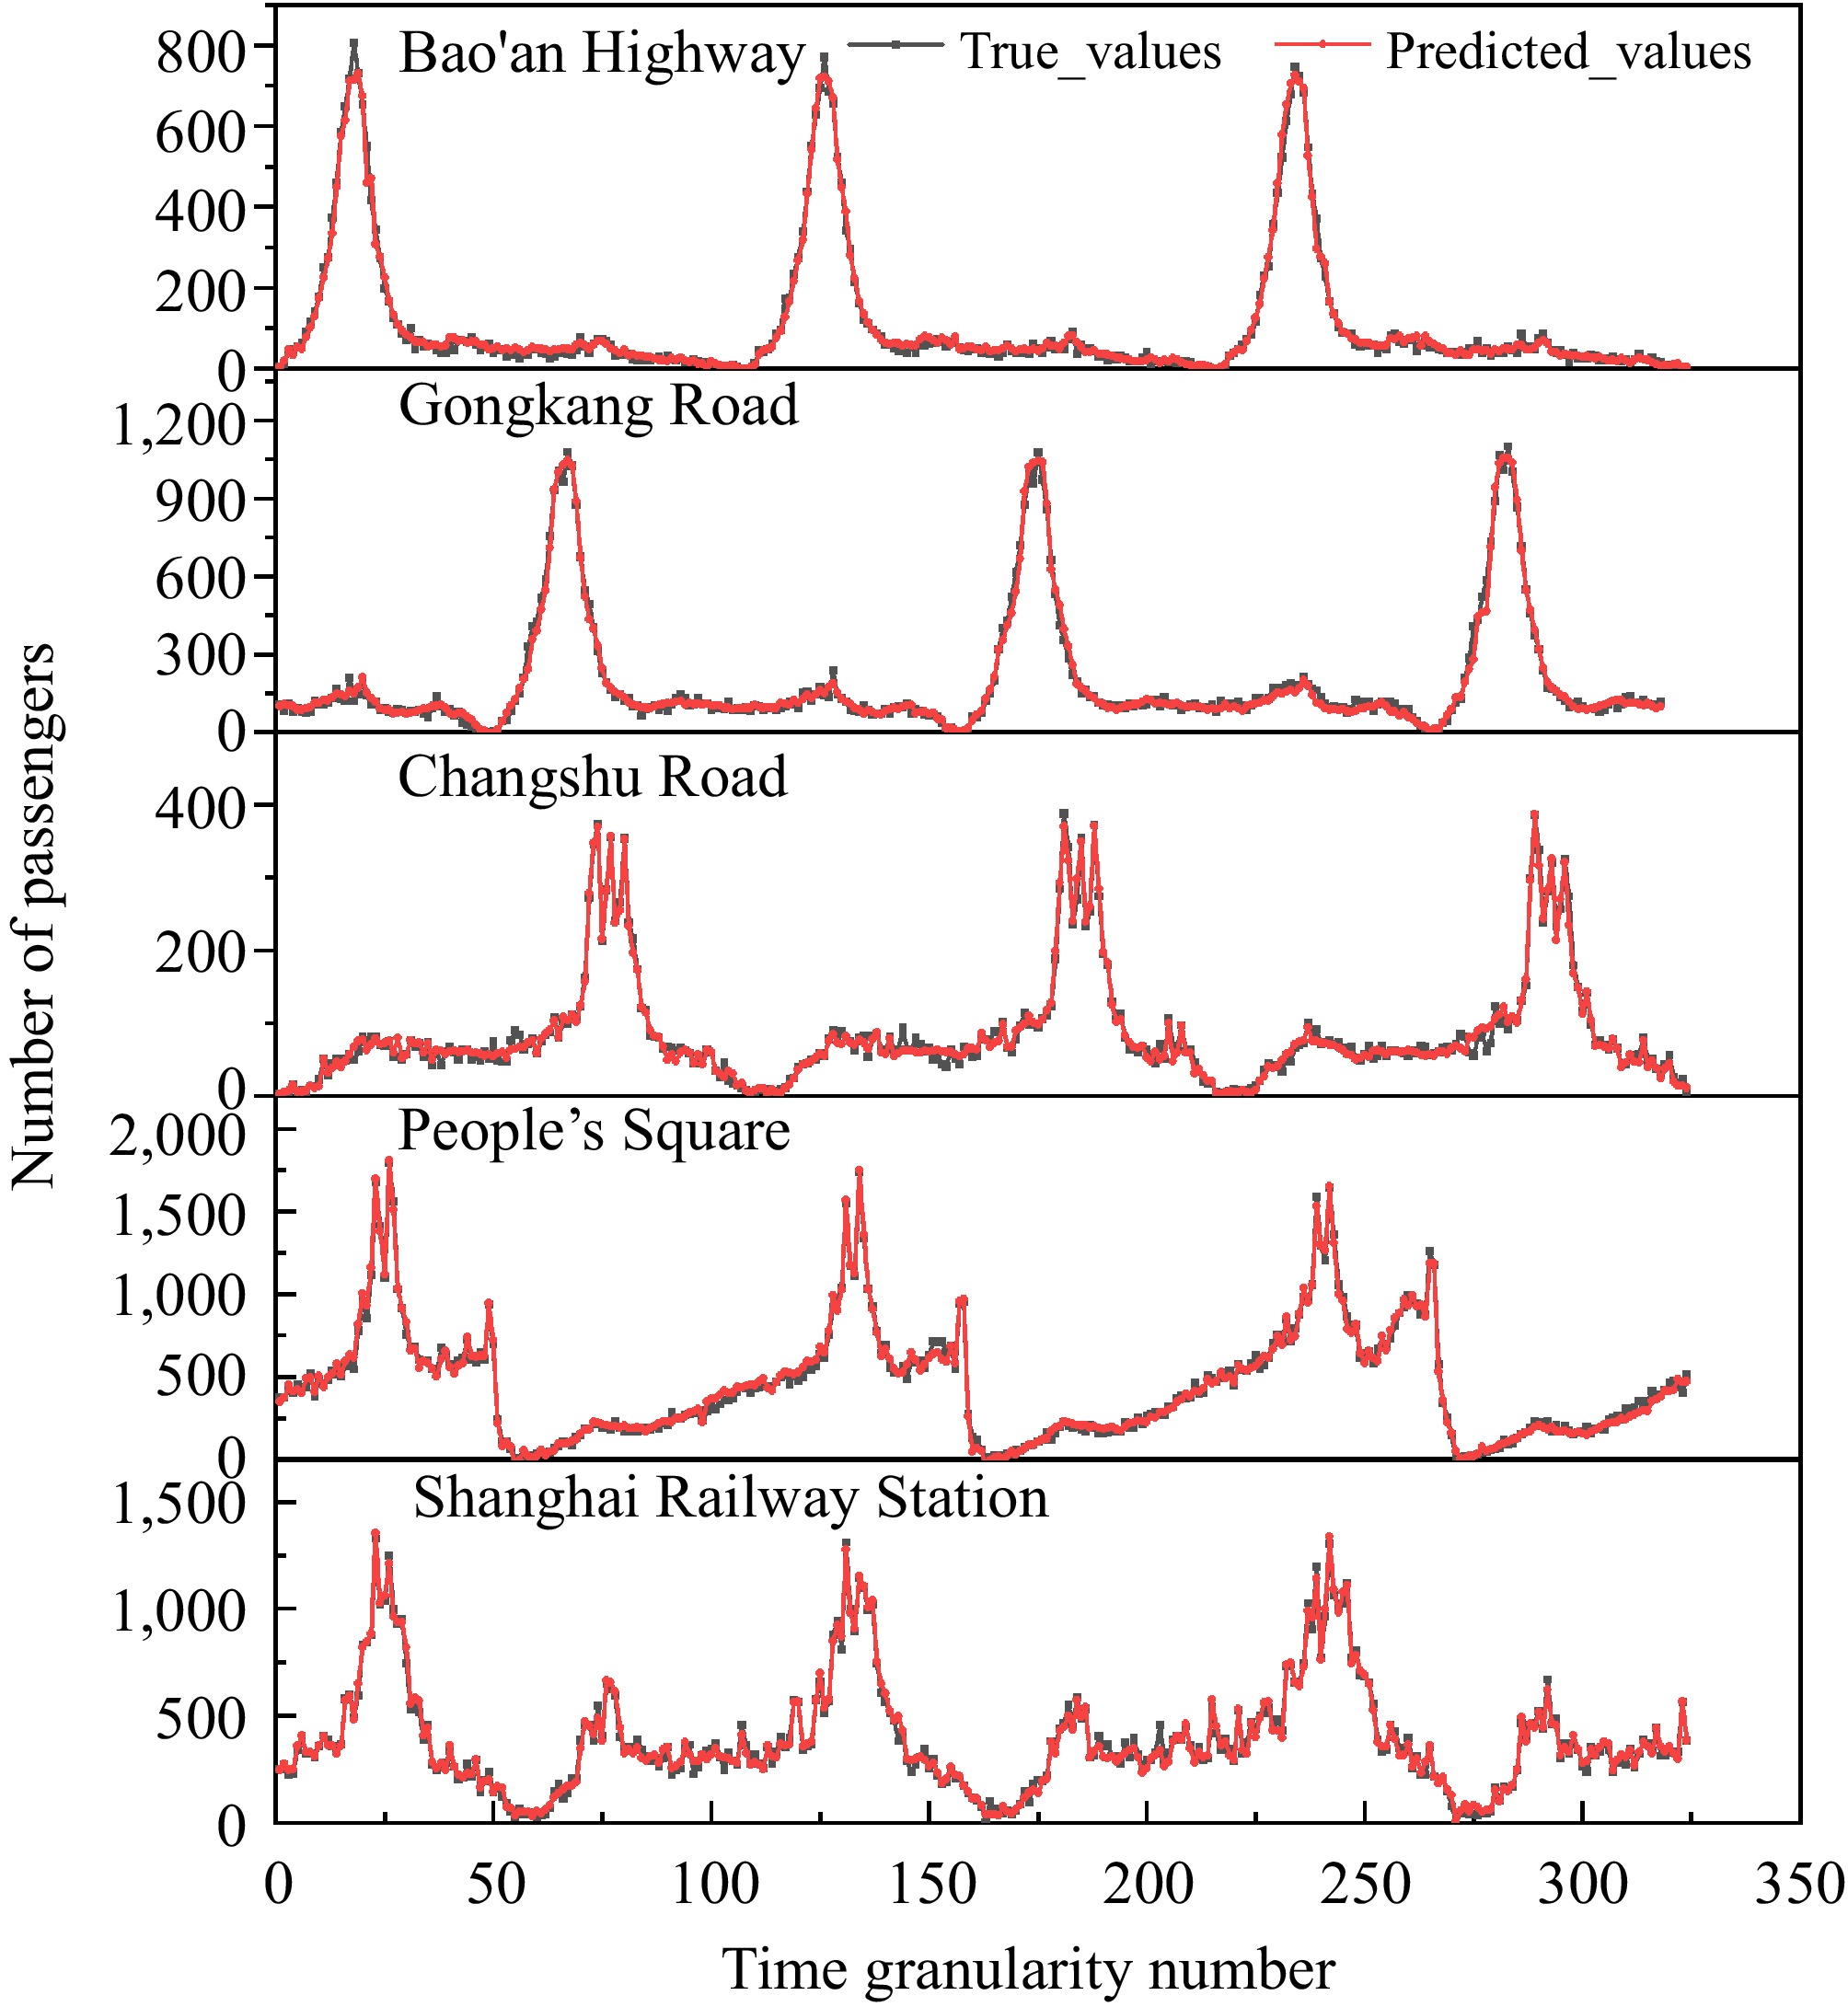
Figure 9.
Prediction of passenger flow for typical stations of the Shanghai metro.
-
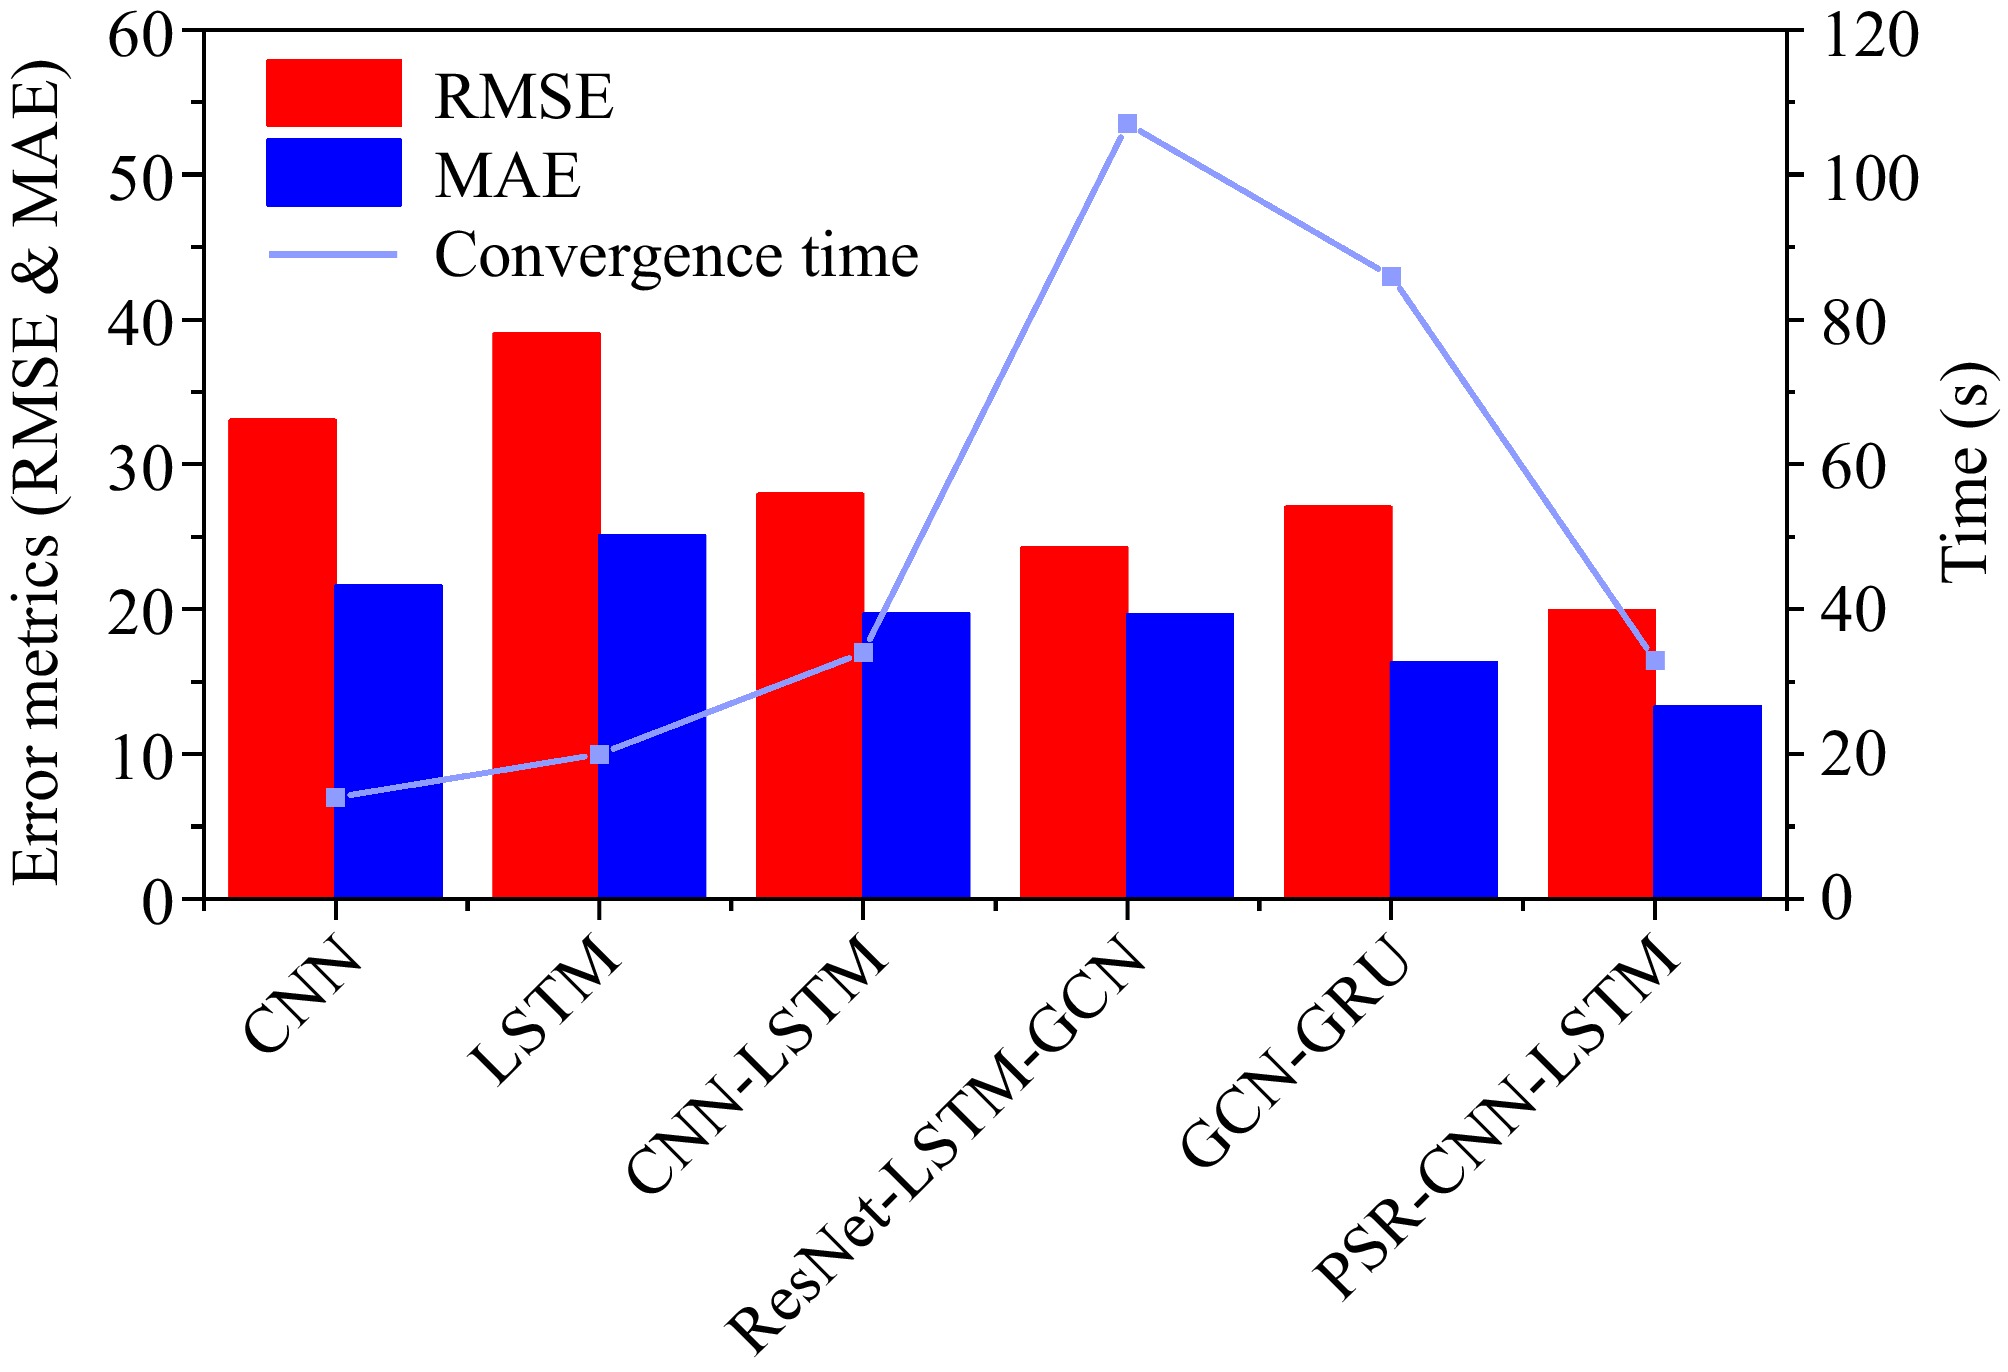
Figure 10.
Comparison of error metrics and convergence time for models.
-
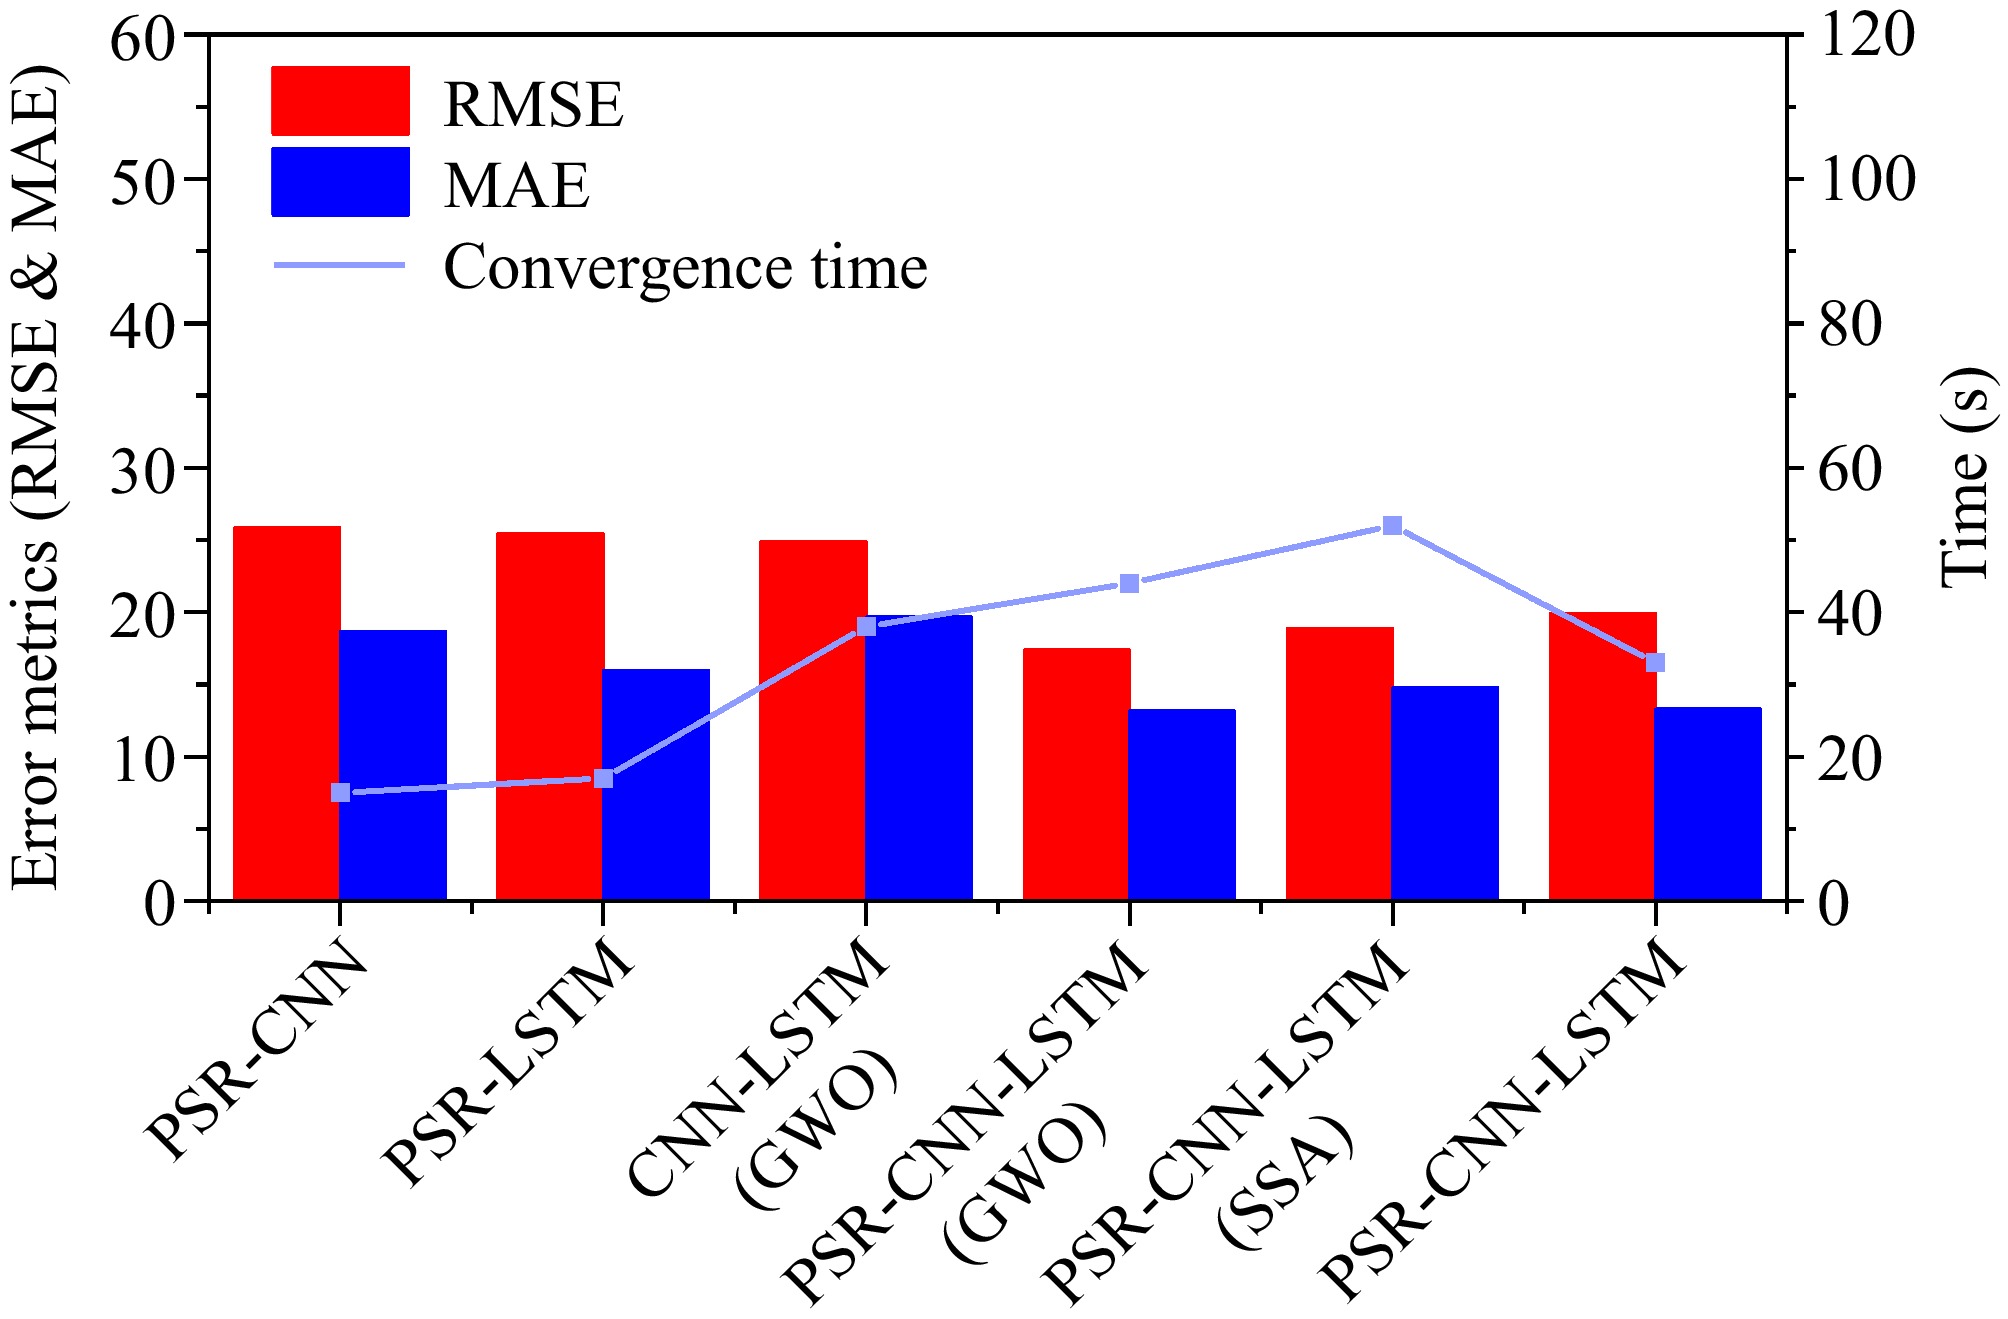
Figure 11.
Error metrics and convergence time comparison.
-
Card no Date Time Line and station Mode Cost (CNY) Type 2201252167 04-01-15 19:20:33 Line 7 Changzhong Road Subway 4.0 Full fare 2702155929 04-01-15 12:52:38 Songjiang Bus 43 Bus 1.0 Full fare 2201252167 04-01-15 08:55:44 Line 1 Baoshan Highway Subway 3.0 Full fare … … … … … … … 602141128 04-01-15 09:07:57 Songjiang Bus 43 Bus 0 Discount Table 1.
AFC raw data format.
-
Line Subway station Date Period serial number Station entry person 1 Baoan Road 04-01-15 37 164 1 Baoan Road 04-01-15 38 397 1 … … … … 1 Baoan Road 04-01-15 55 1,316 Table 2.
Station entry data by 10-min time period.
-
Line Station Number MLES 1 Bao'an Highway 1 0.025 1 Caobao Road 2 0.026 1 Changshu Road 3 0.035 1 Fujin Road 4 0.022 1 Gongfu Xincun 5 0.031 1 Gongkang Road 6 0.030 1 Shanghai Railway Station 7 0.040 Table 3.
Maximum Lyapunov values of the passenger flow time series.
-
Parameter Value Learning rate 0.00283 Convolutional kernels 35 Hidden neurons 25 Dropout rate 0.2 Kernel size 6 × 6 Pooling size 4 × 4 Table 4.
Model parameters.
-
Time granularity RMSE R2 MAE 10 min 19.93 0.99 13.31 20 min 24.06 0.98 17.91 30 min 44.09 0.98 28.69 Table 5.
Comparison of prediction results for different time granularities.
-
Model RMSE R2 MAE Convergence
time (s)Parameters CNN 33.07 0.96 21.61 14 1669 LSTM 39.03 0.94 25.12 20 5520 CNN-LSTM 27.96 0.97 19.69 34 13084 ResNet-LSTM-GCN 24.29 0.97 19.63 107 77660 GCN-GRU 27.07 0.97 16.32 86 17921 PSR-CNN-LSTM 19.93 0.99 13.31 33 12384 Table 6.
Evaluation of different models.
-
Model RMSE R2 MAE Convergence
time (s)Parameters PSR-CNN 25.90 0.97 18.68 15 7664 PSR-LSTM 25.47 0.97 15.99 17 6991 CNN-LSTM (GWO) 24.90 0.97 19.67 38 15049 PSR-CNN-LSTM GWO) 17.41 0.99 13.16 44 14248 PSR-CNN-LSTM (SSA) 18.87 0.99 14.79 52 43916 PSR-CNN-LSTM 19.93 0.99 13.31 33 12384 Table 7.
Ablation study results.
Figures
(11)
Tables
(7)