-
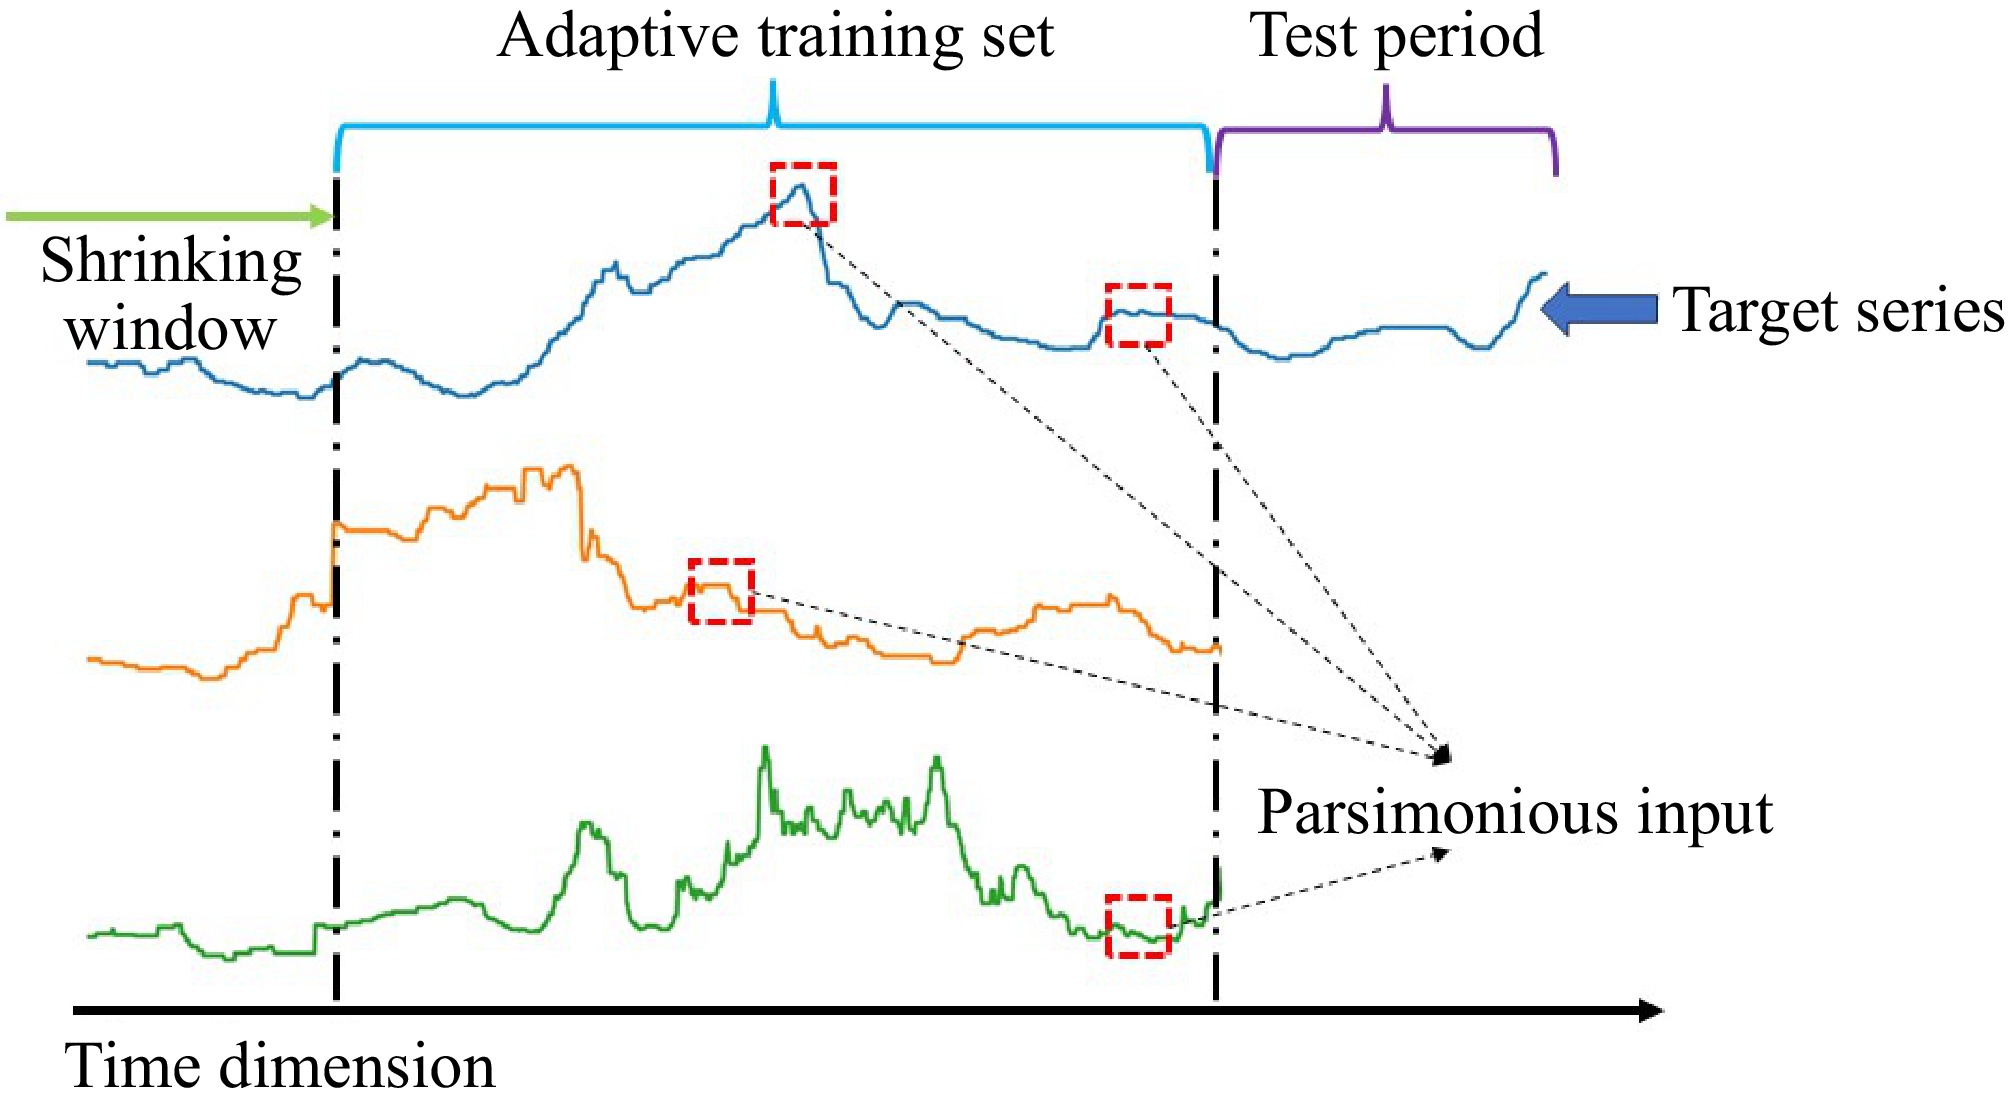
Figure 1.
Partitioning scheme of SVRIMSE.
-
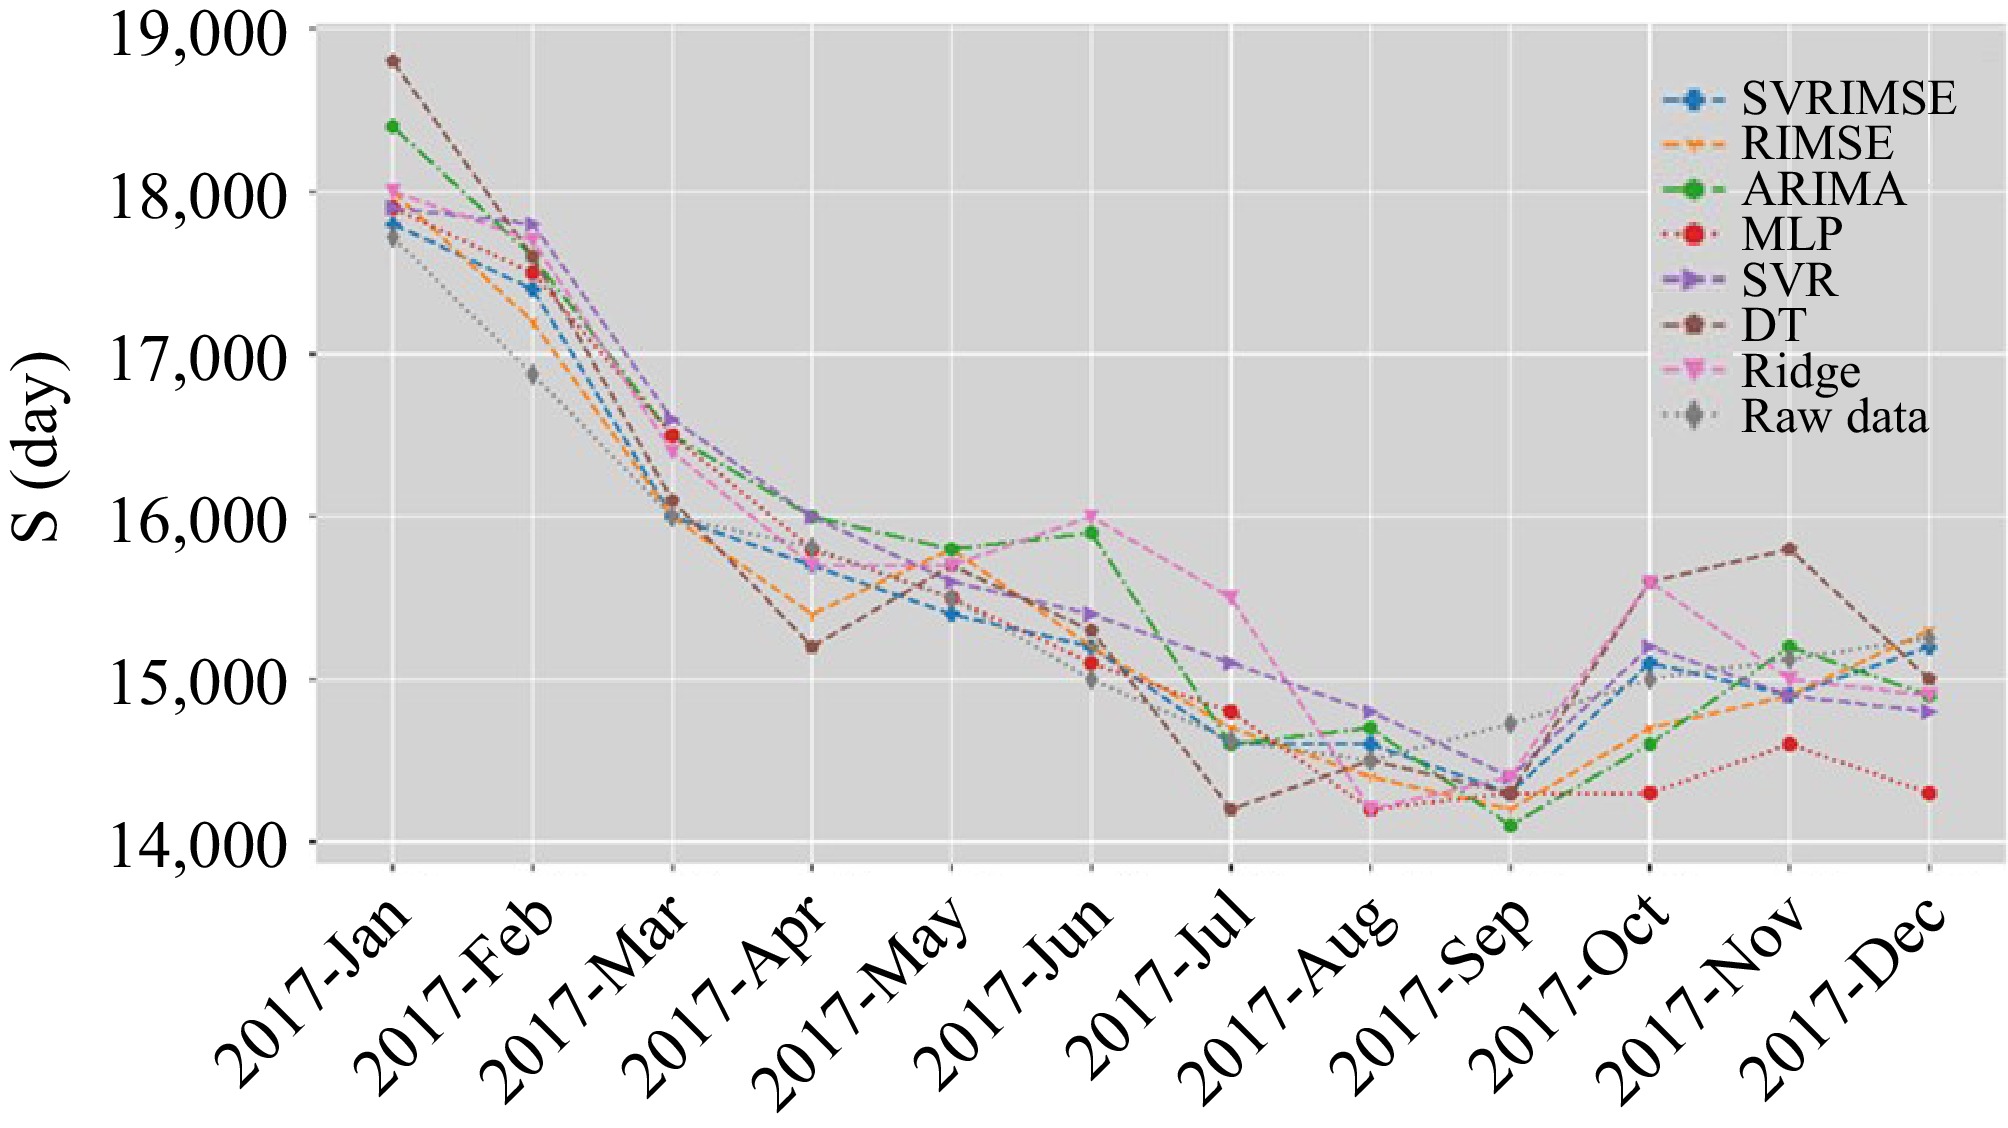
Figure 2.
Comparison of forecasts on Aframax time charter rates.
-
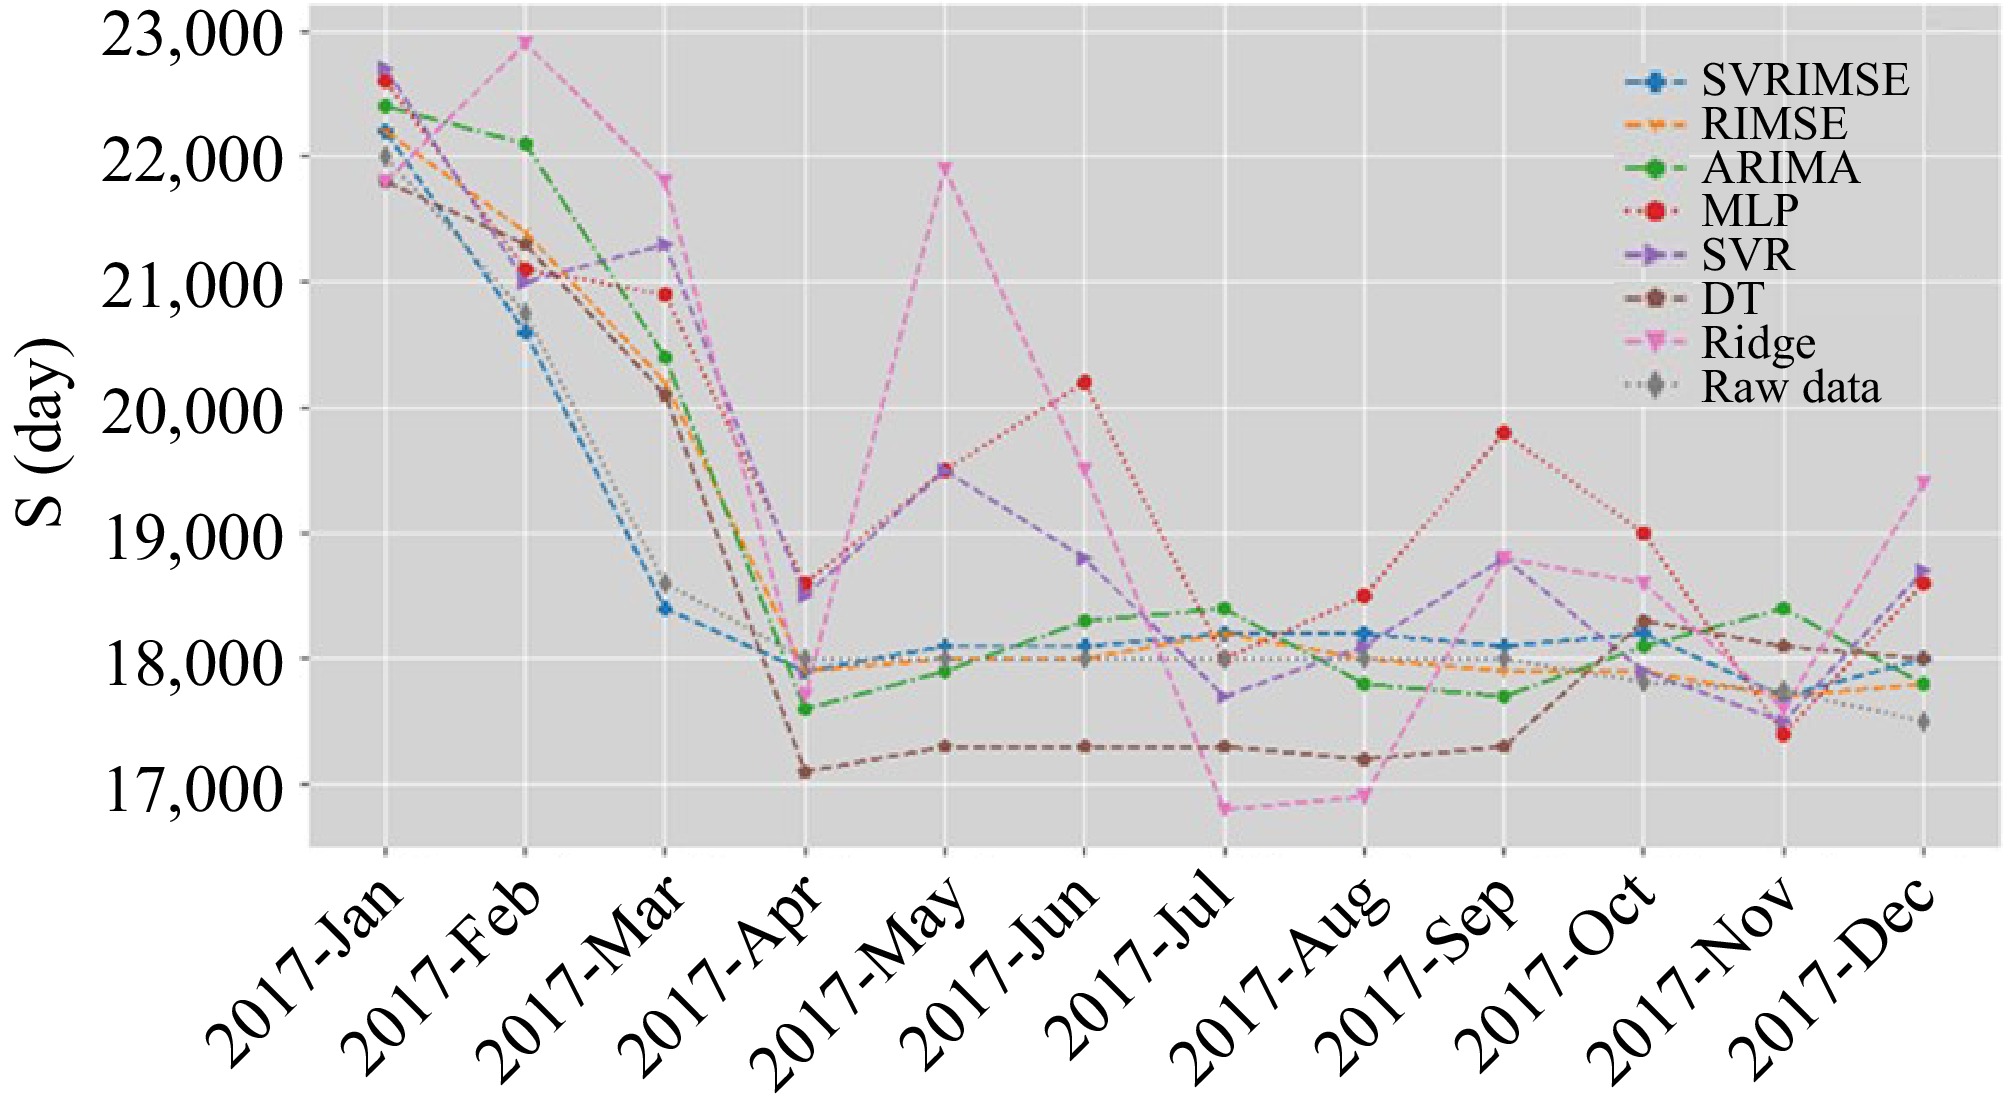
Figure 3.
Comparison of forecasts on Suezmax time charter rates.
-
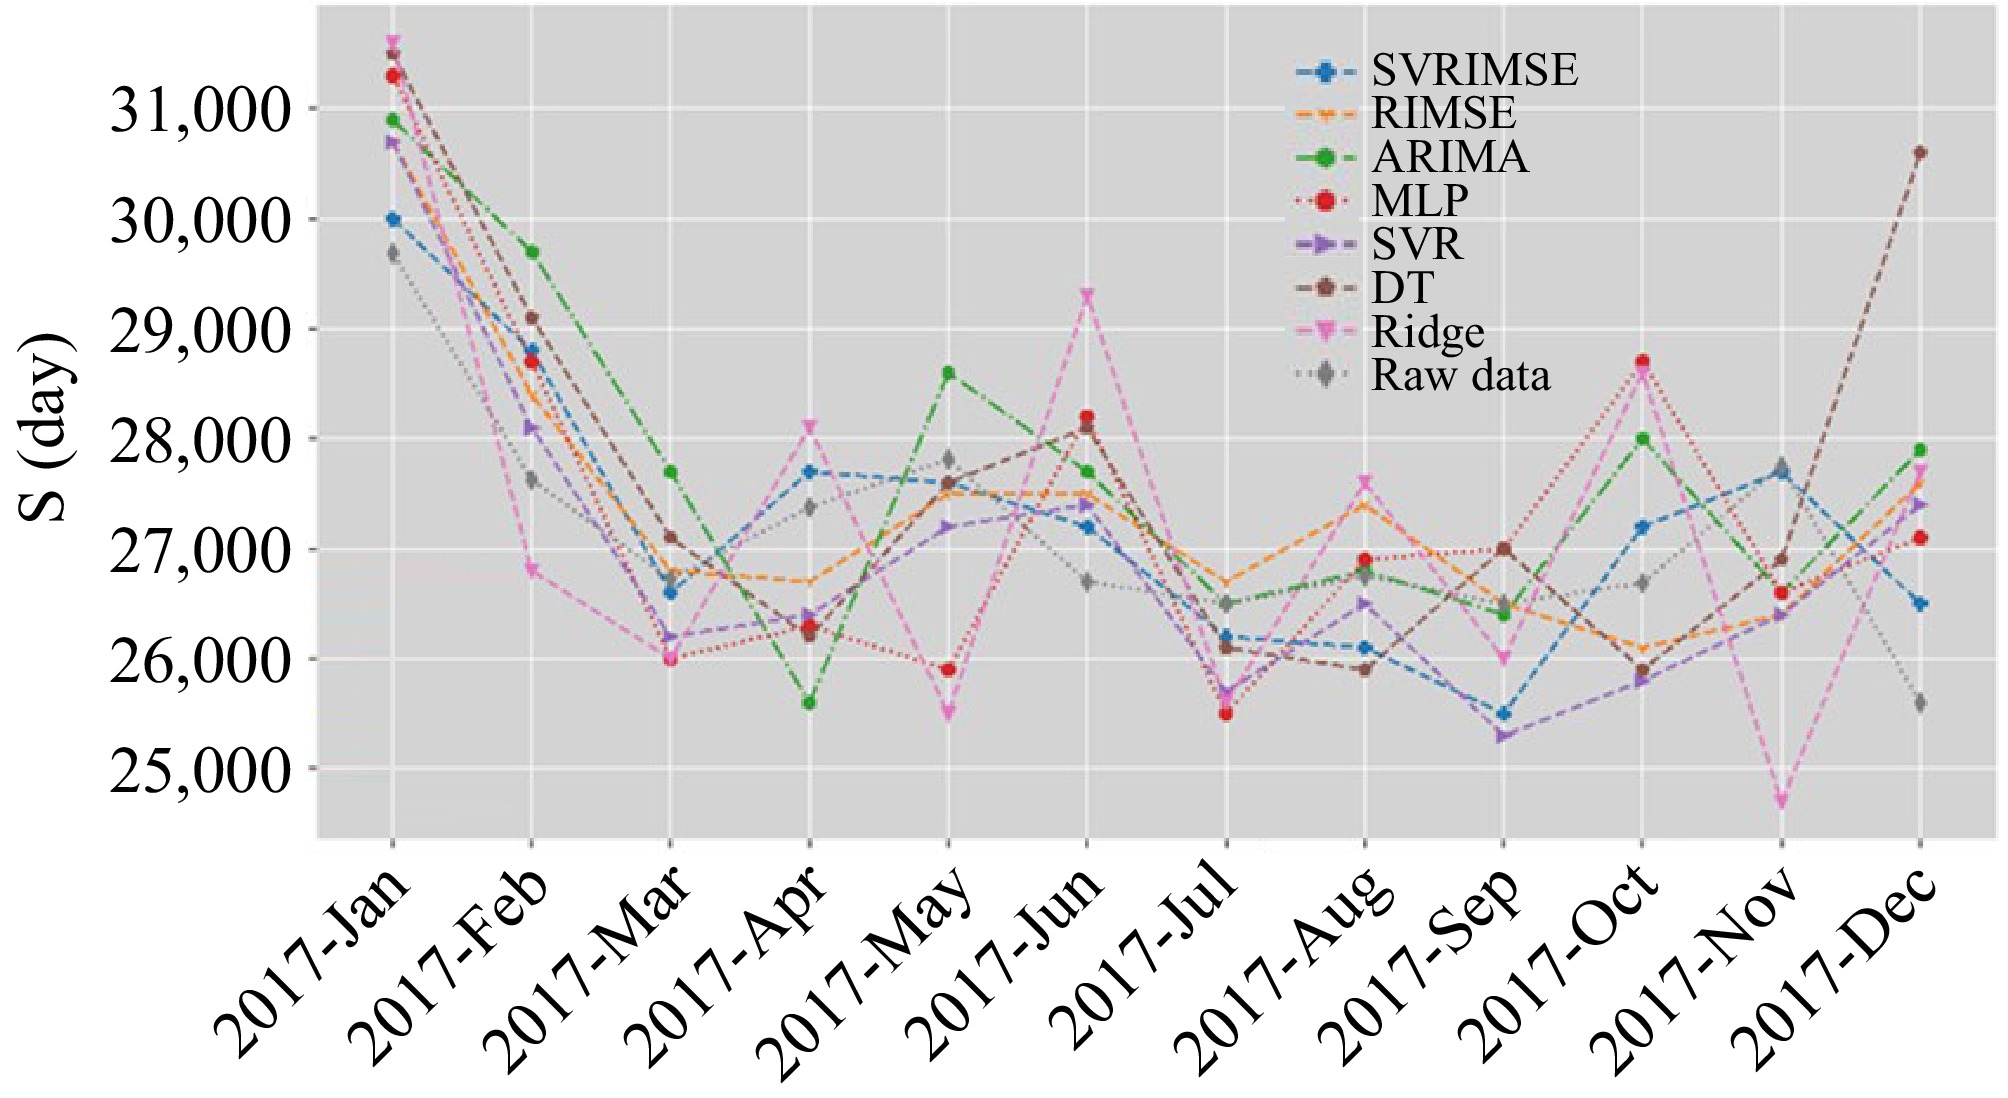
Figure 4.
Comparison of forecasts on VLCC time charter rates.
-
Ship type Deadweight tonnage (DWT) (MT) Key features Aframax 80,000−120,000 Short to medium-haul oil trades in regions with port limitations Suezmax 120,000−200,000 Largest ships able to transit the Suez Canal fully laden VLCC 180,000−320,000 Larger vessels with better economies of scale for long-haul routes Table 1.
Three types of tankers analyzed in this study.
-
Naïve ARIMA SVR MLP DT Ridge RIMSE SVRIMSE RMSE 433.321 491.109 425.050 470.196 536.133 534.771 276.776 223.468 MAPE 0.023 0.026 0.023 0.024 0.028 0.029 0.015 0.010 MASE 0.363 0.424 0.373 0.383 0.460 0.460 0.238 0.166 Table 2.
Comparative results of Aframax time charter rates.
-
Naïve ARIMA SVR MLP DT Ridge RIMSE SVRIMSE RMSE 758.099 728.449 1050.105 1273.288 742.331 1825.631 514.996 228.246 MAPE 0.022 0.029 0.042 0.057 0.037 0.078 0.014 0.010 MASE 0.266 0.345 0.489 0.665 0.431 0.915 0.175 0.122 Table 3.
Comparative results of Suezmax time charter rates.
-
Naïve ARIMA SVR MLP DT Ridge RIMSE SVRIMSE RMSE 1129.470 1284.526 977.207 1302.169 1744.310 1764.768 886.920 601.970 MAPE 0.033 0.039 0.033 0.044 0.046 0.057 0.026 0.018 MASE 0.326 0.387 0.319 0.430 0.443 0.558 0.257 0.180 Table 4.
Comparative results of VLCC time charter rates.
-
Aframax Suezmax VLCC Time charter rate * * * Newbuilding prices * * Secondhand prices Fleet development (Number) * * * Fleet development (Million DWT) * Scrap value * * * Orderbook (Number) * Orderbook (CGT) Orderbook (DWT) * Fleet growth Table 5.
Selected variables for SVR.
Figures
(4)
Tables
(5)