-
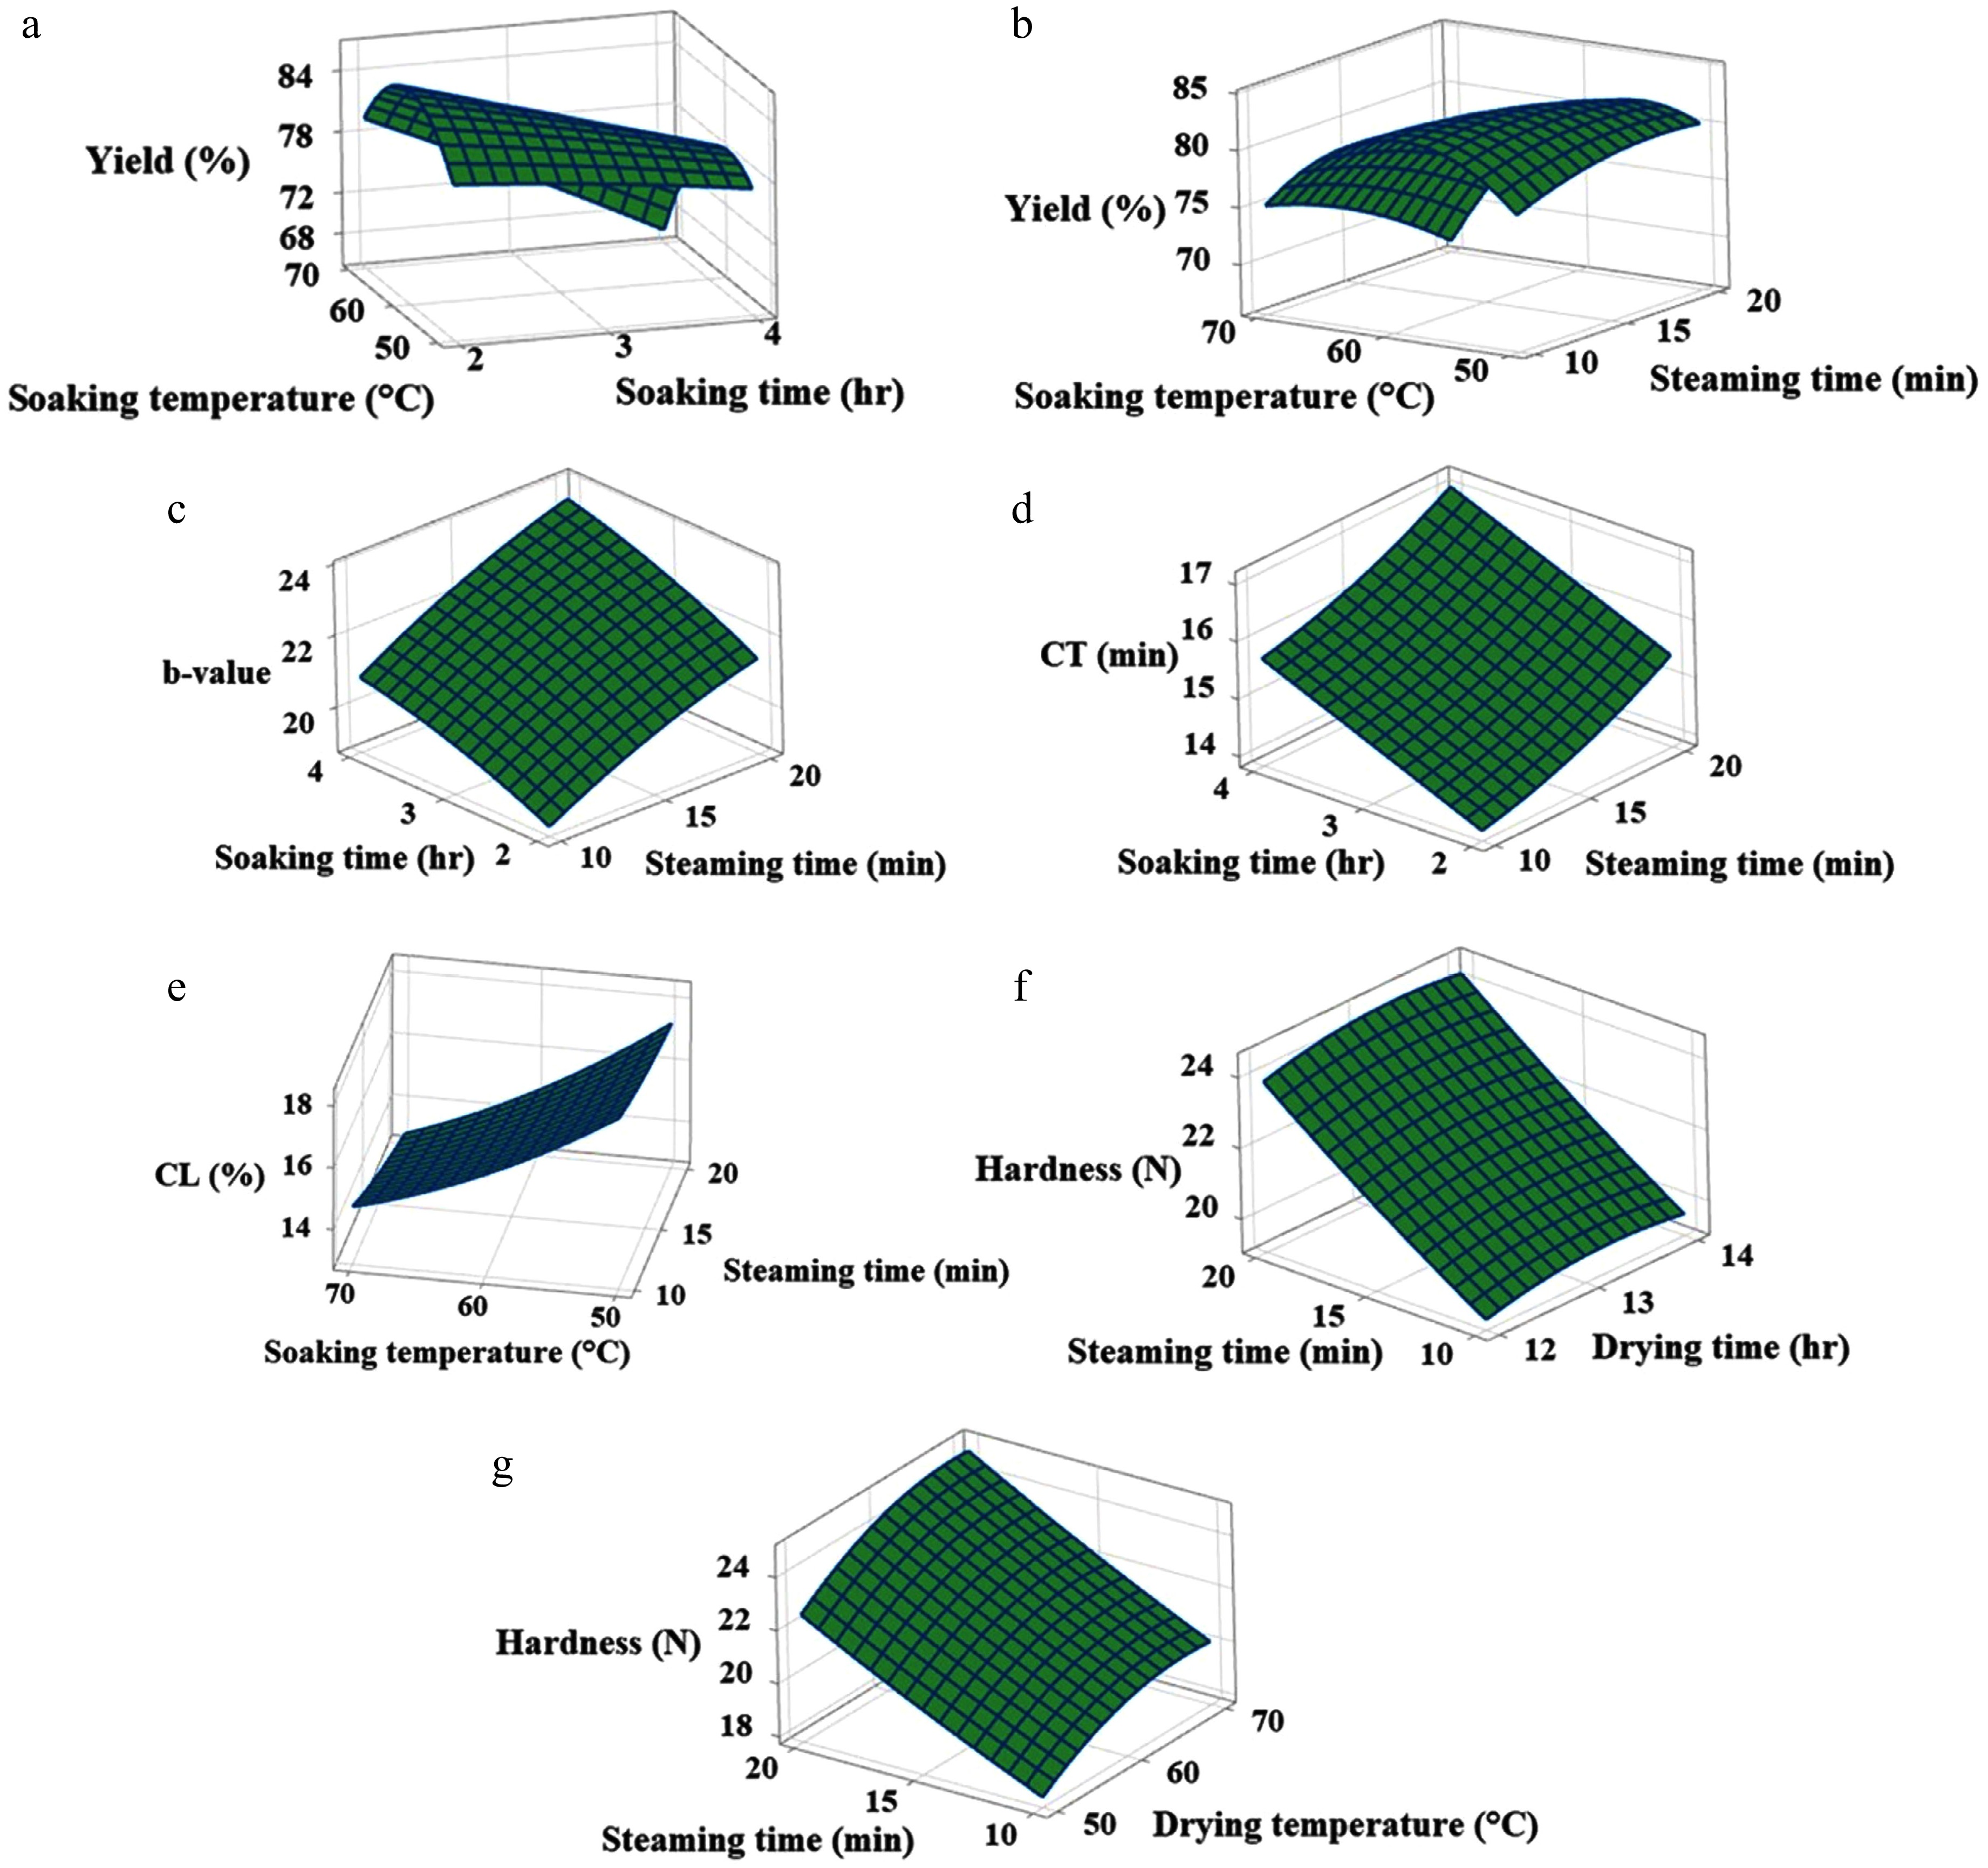
Figure 1.
Response surface graphs displaying the effect of (a) soaking time and temperature on yield, (b) soaking temperature and steaming time on yield, (c) soaking time and steaming time on b-value, (d) soaking time and steaming time on cooking time, (e) soaking temperature and steaming time on cooking loss, and (f), (g) steaming time, drying time, and drying temperature on hardness.
-
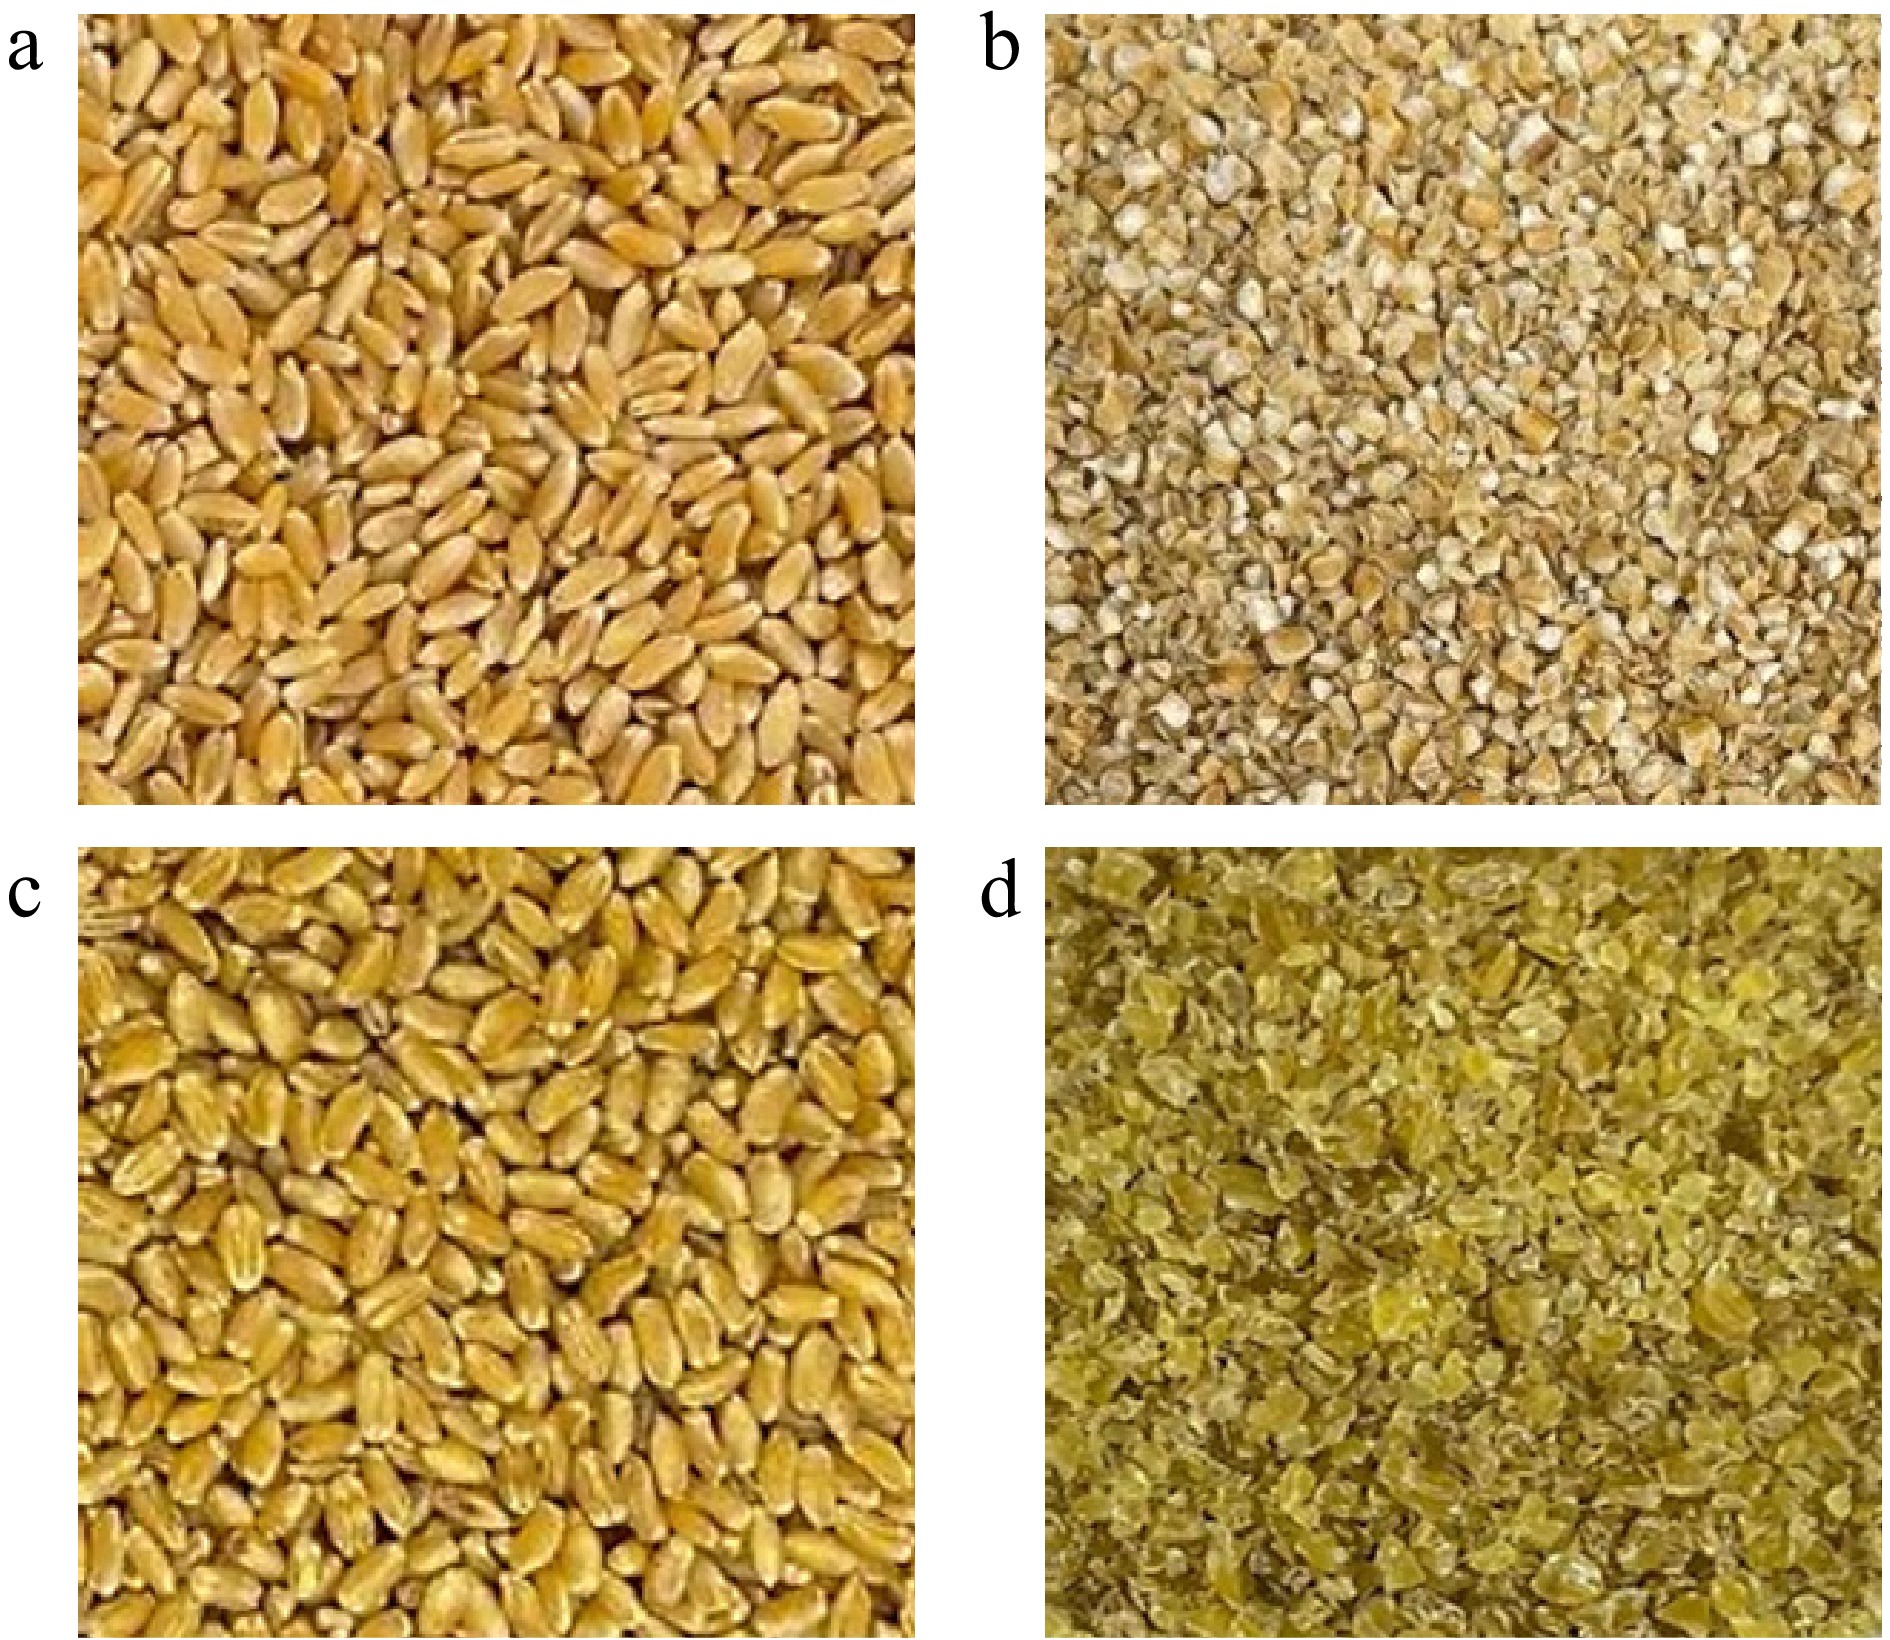
Figure 2.
(a) Raw, (b) cracked raw, (c) parboiled, and (d) bulgur wheat.
-
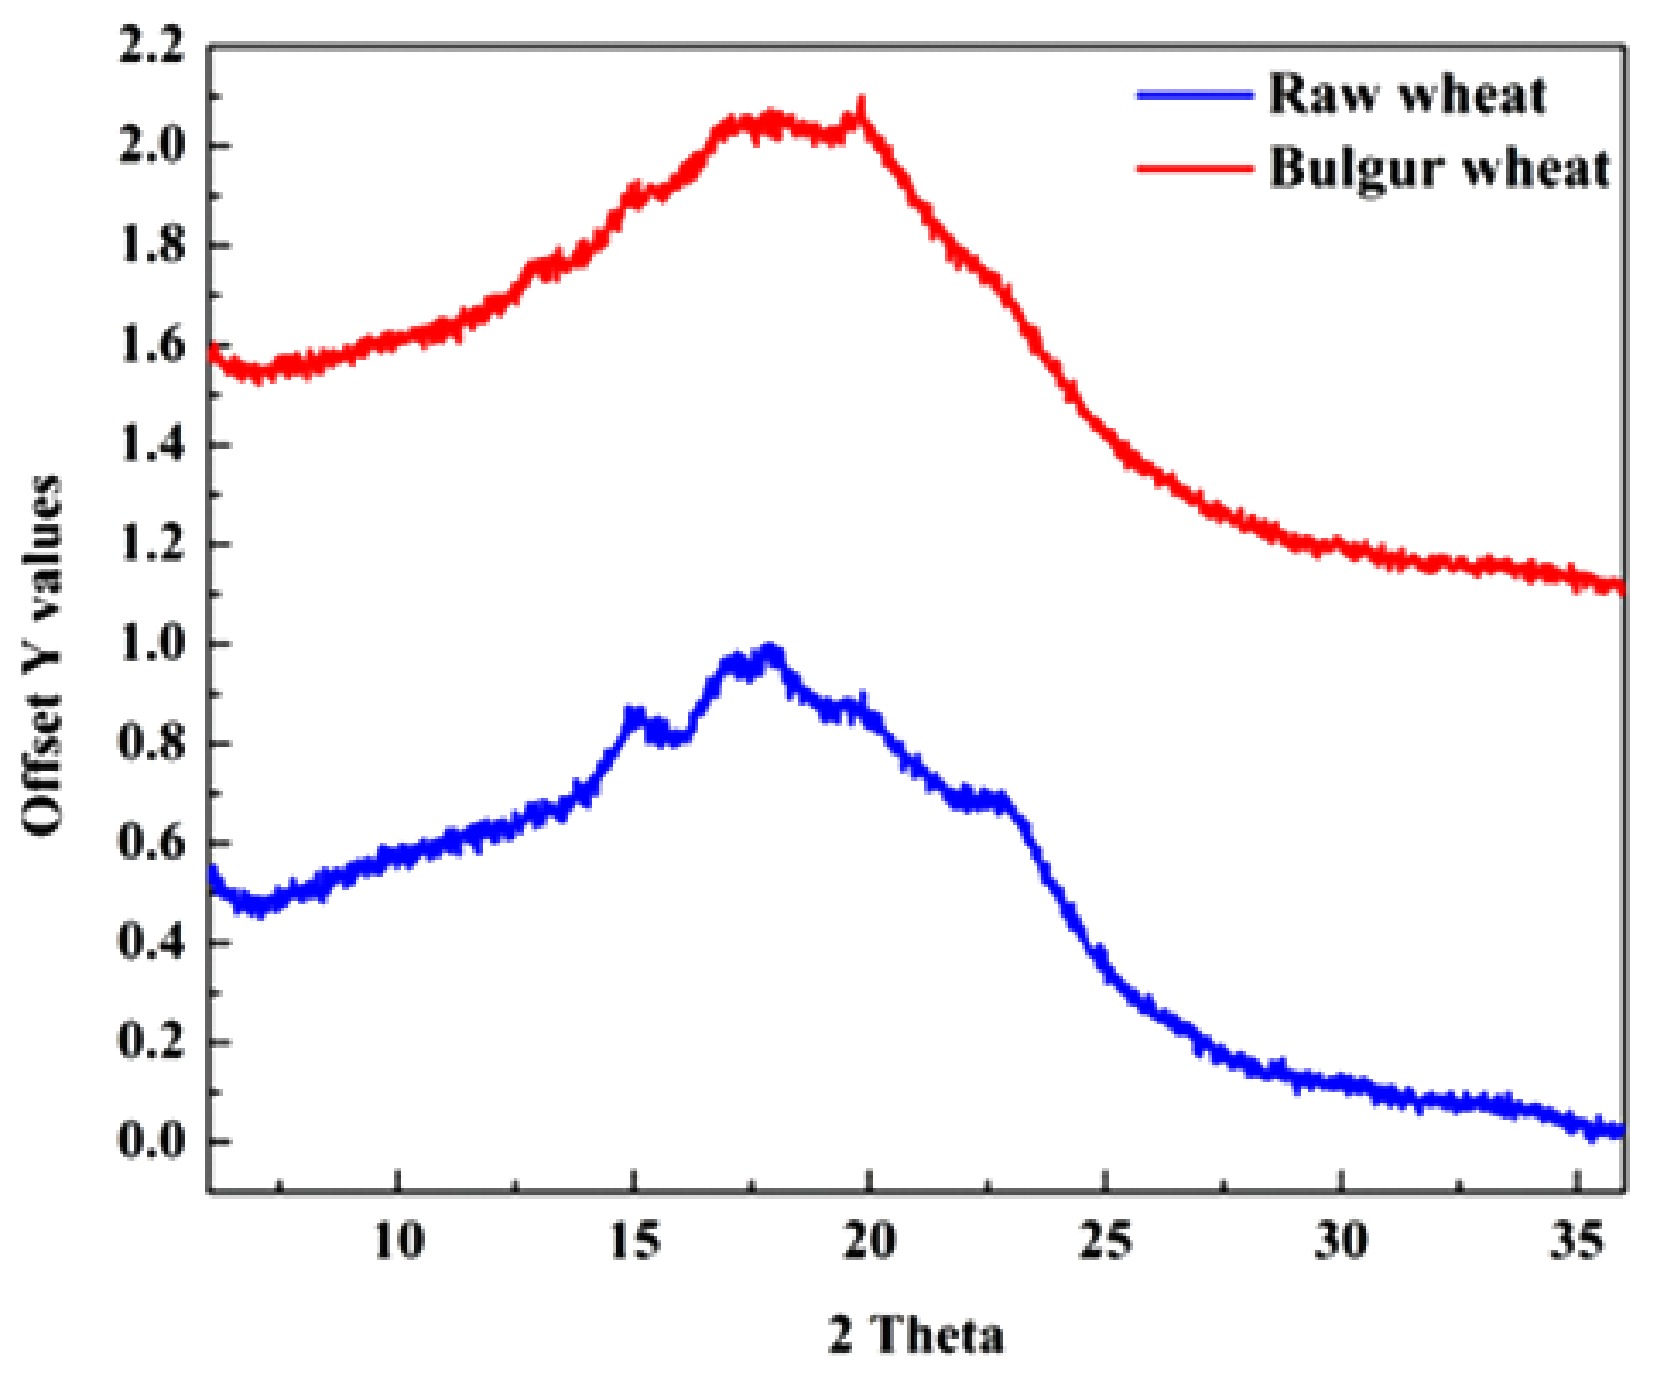
Figure 3.
X-ray diffraction plot of raw and bulgur wheat.
-
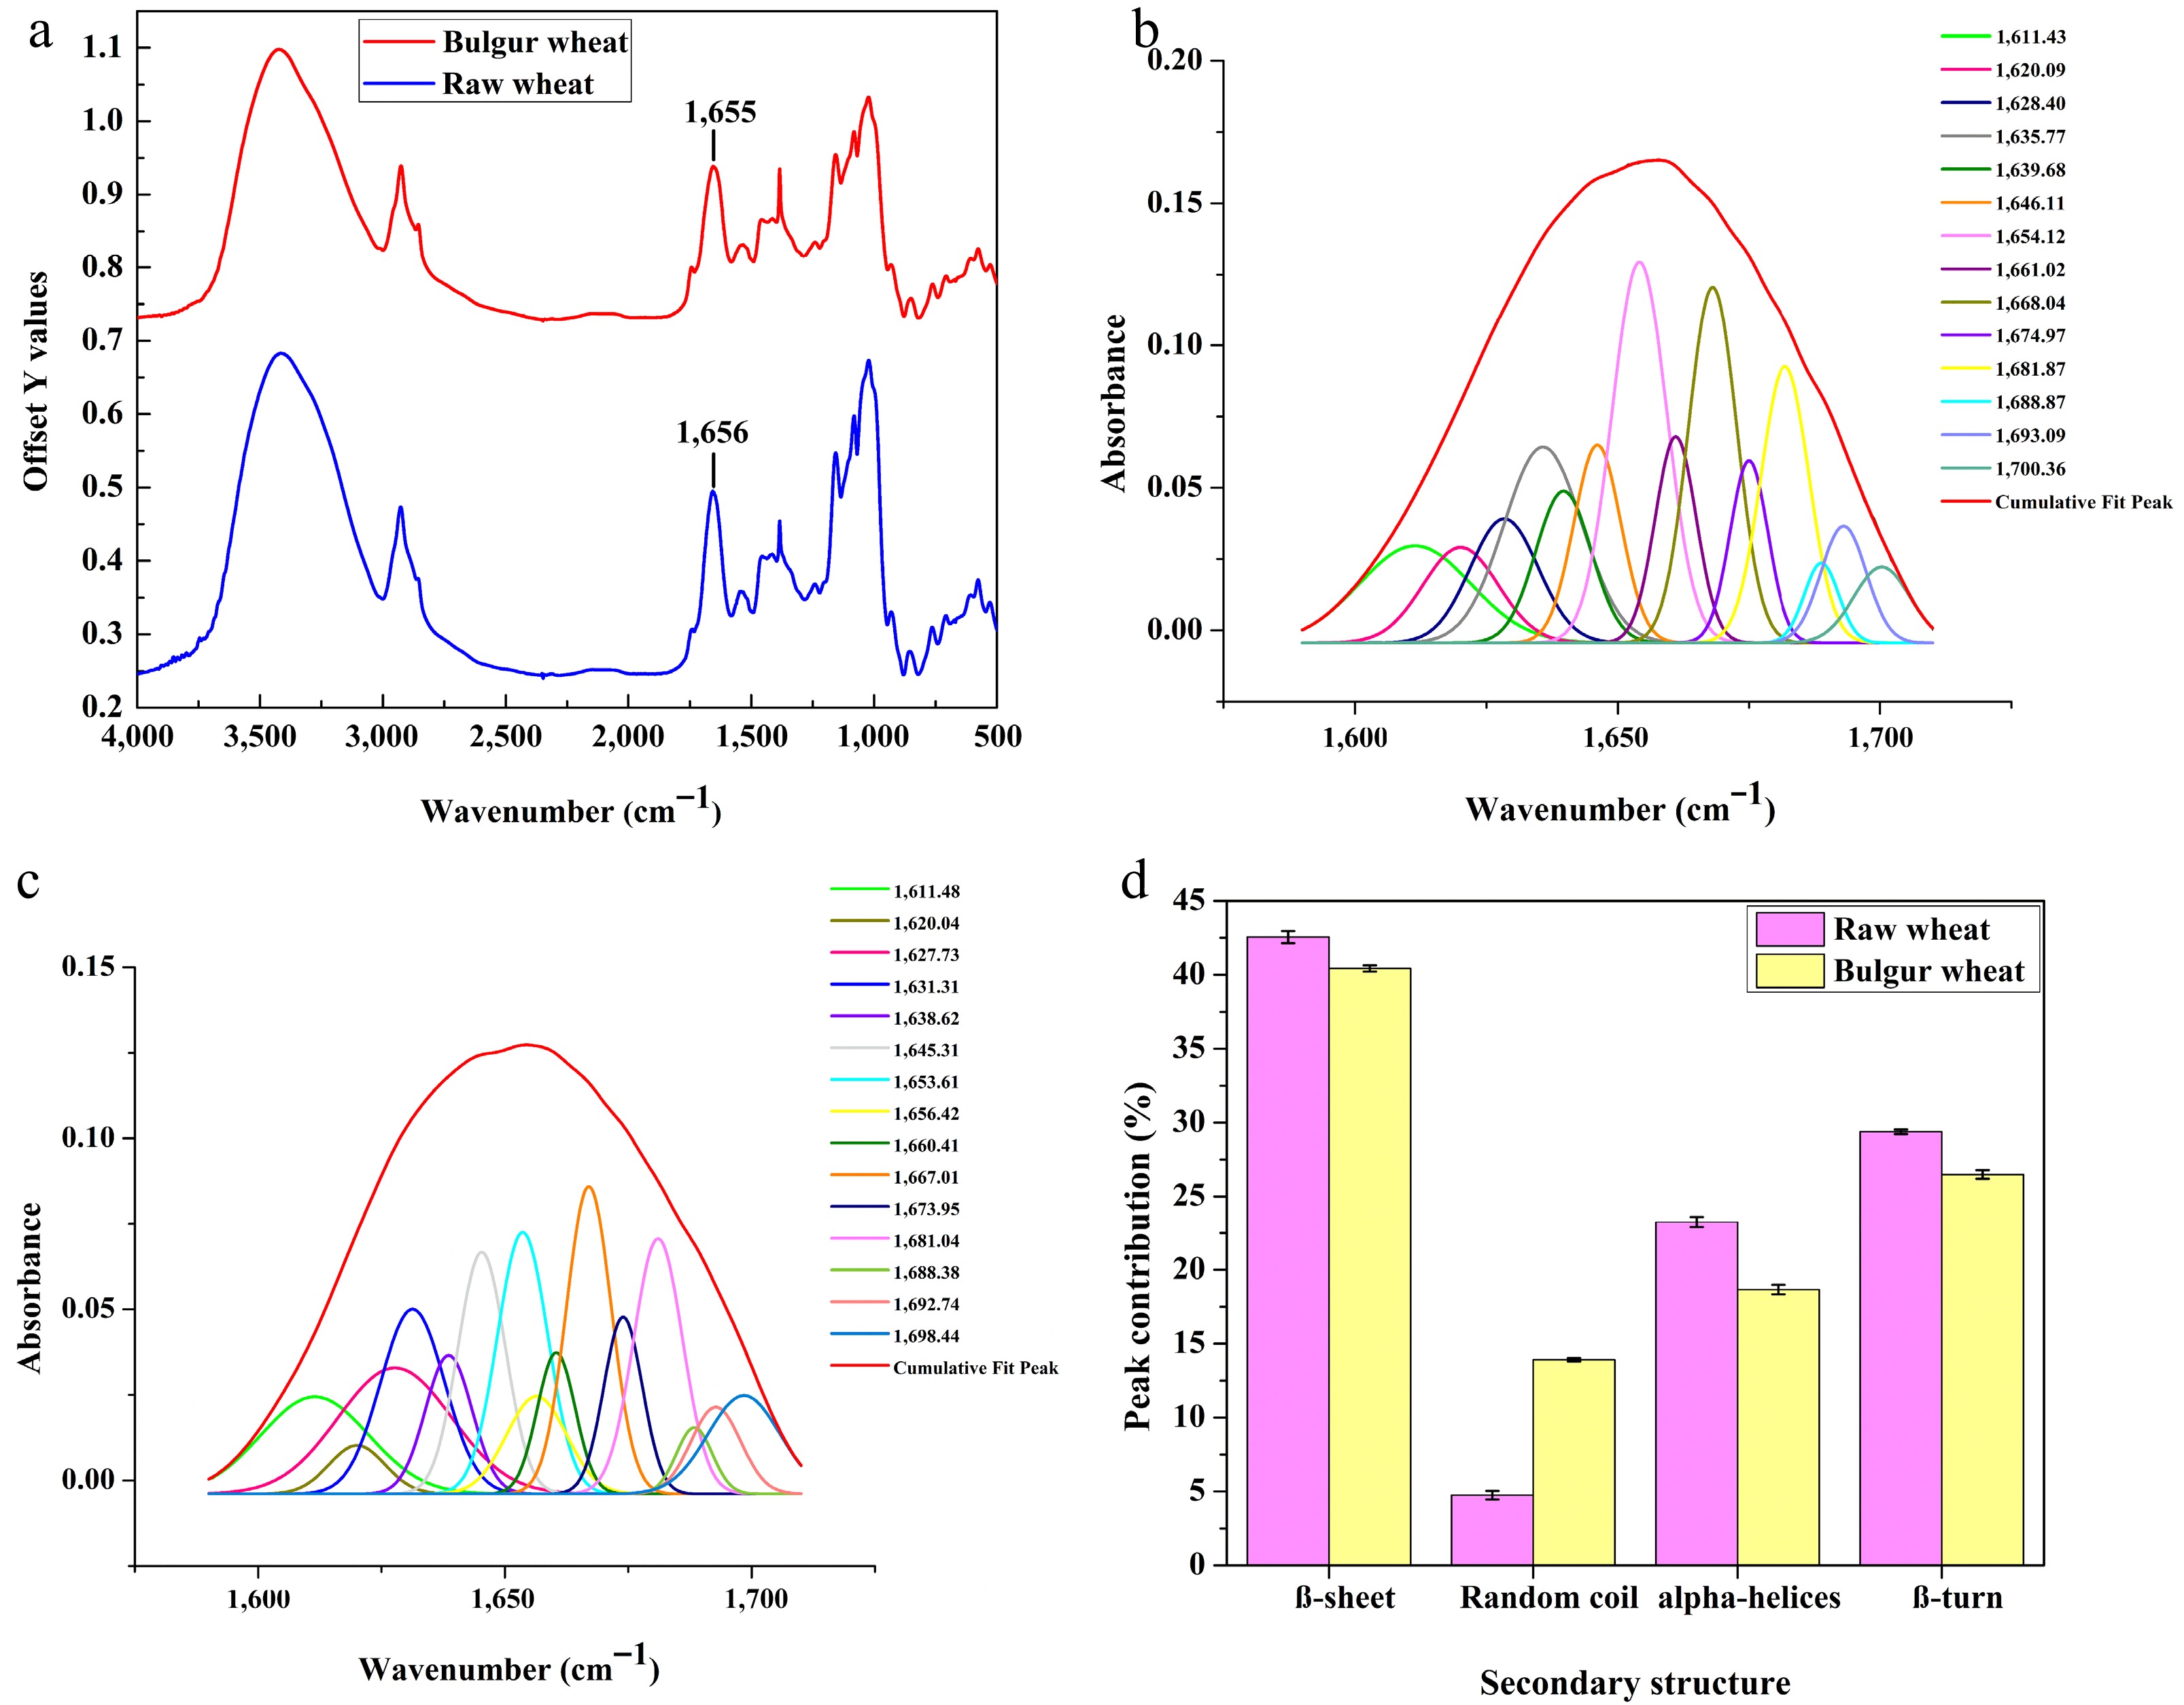
Figure 4.
(a) FTIR spectra of raw and bulgur wheat. (b) Conformational peak in the Amide I region of raw wheat. (c) Conformational peak in the Amide I region of bulgur wheat. (d) Secondary structure peak contribution of raw and bulgur wheat (in %).
-
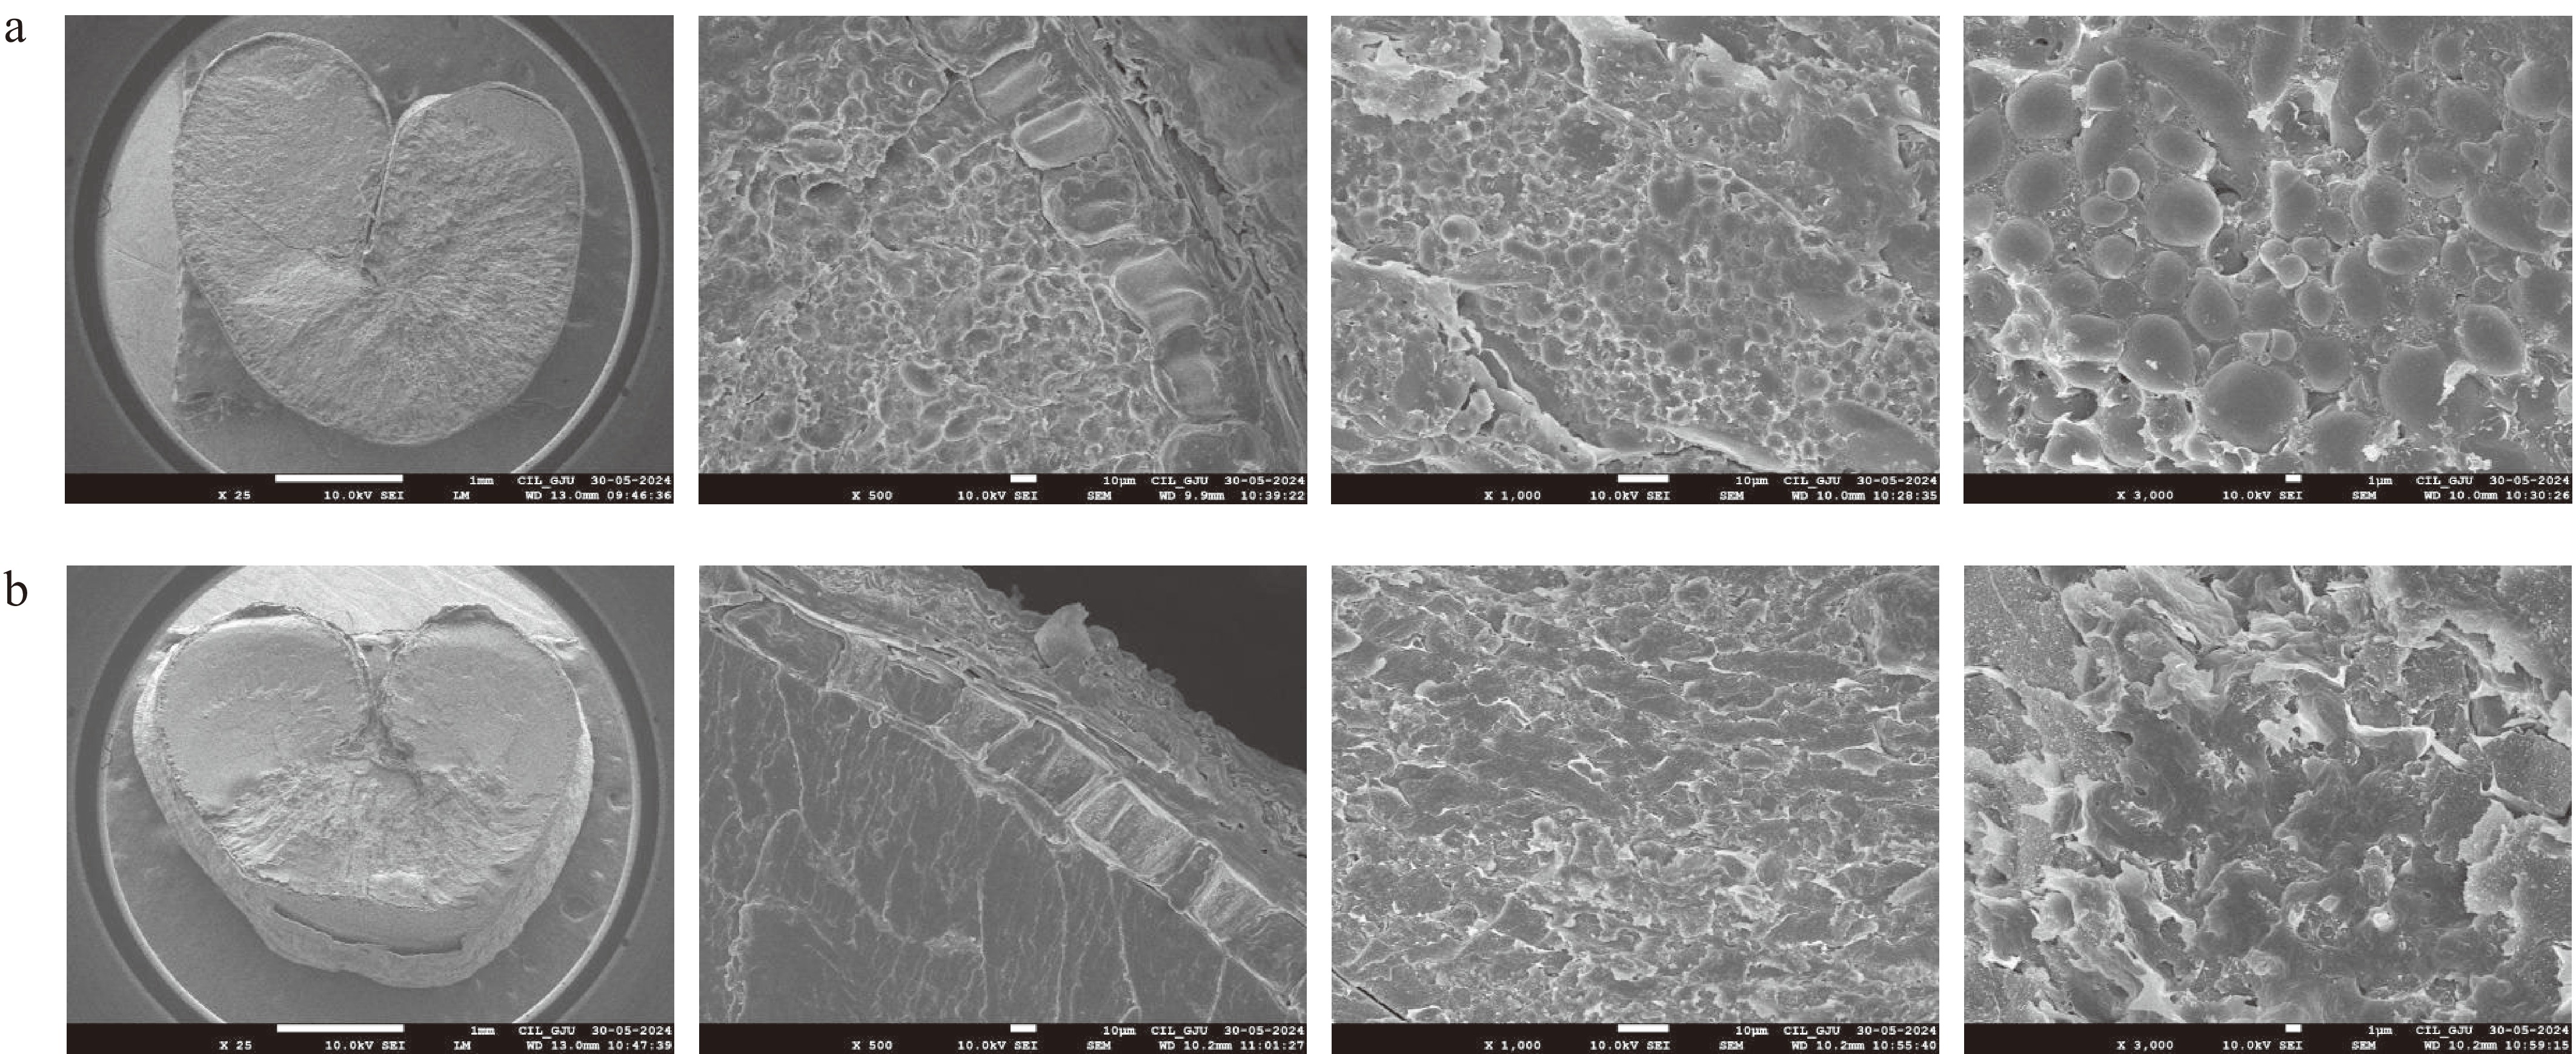
Figure 5.
Scanning electron microscopy images of (a) raw and (b) bulgur wheat.
-
Run A B C D E YLD b* CT CL HRD 1 60 3 15 60 13 80.94 21.60 15.46 15.23 21.41 2 60 2 15 50 13 85.43 19.53 14.29 16.98 11.17 3 60 3 15 60 13 82.93 21.20 15.31 15.45 21.43 4 60 3 15 60 13 82.84 21.60 15.13 15.25 23.02 5 70 3 15 60 12 72.62 23.81 17.21 13.76 30.31 6 50 3 15 60 14 80.29 19.85 14.55 17.69 14.53 7 70 3 15 70 13 70.15 24.28 17.35 13.64 32.25 8 60 3 15 70 12 79.68 21.89 15.53 15.18 21.61 9 60 2 20 60 13 83.27 21.85 15.35 16.17 18.76 10 60 2 10 60 13 84.65 19.19 14.00 17.42 15.52 11 60 4 15 50 13 76.78 21.75 16.14 14.81 24.49 12 60 3 20 60 12 77.68 22.26 16.18 14.85 23.59 13 50 4 15 60 13 78.16 19.78 15.21 16.90 16.72 14 60 4 20 60 13 74.73 23.59 17.35 14.30 28.52 15 60 3 10 70 13 80.38 20.32 15.05 15.94 20.15 16 60 3 10 60 14 80.57 20.21 14.56 16.02 19.60 17 50 3 15 70 13 79.42 20.32 15.13 17.57 14.86 18 70 3 20 60 13 66.00 25.10 18.00 12.90 36.53 19 60 3 15 50 12 79.67 20.87 15.26 15.50 20.33 20 60 3 20 50 13 78.53 22.04 16.14 14.89 22.95 21 70 3 15 60 14 71.49 24.01 17.30 13.71 31.16 22 60 3 10 60 12 83.57 19.91 14.48 16.24 19.34 23 60 3 20 70 13 79.37 22.83 16.41 14.79 24.54 24 60 3 15 60 13 80.94 21.60 15.46 15.23 23.02 25 70 2 15 60 13 78.01 22.49 16.52 14.95 24.27 26 70 3 15 50 13 71.11 23.17 17.18 13.84 29.21 27 60 3 15 60 13 82.93 22.12 15.41 15.30 21.43 28 60 3 20 60 14 80.49 22.53 16.27 14.82 23.92 29 50 3 15 50 13 78.25 18.95 14.29 18.01 14.59 30 60 4 10 60 13 78.84 20.62 16.05 14.87 23.04 31 60 3 15 70 14 79.92 21.91 16.05 15.04 22.18 32 60 4 15 60 14 77.79 22.98 16.24 14.71 25.46 33 60 3 15 50 14 80.41 20.96 15.31 15.48 20.63 34 60 4 15 70 13 76.88 23.22 16.40 14.62 26.30 35 60 2 15 60 14 87.46 20.02 14.59 16.74 17.03 36 50 3 15 60 12 79.49 19.44 14.33 17.83 14.68 37 60 3 15 60 13 81.95 21.60 15.46 15.23 21.41 38 60 2 15 60 12 85.31 19.89 14.43 16.83 16.49 39 70 4 15 60 13 64.70 24.86 17.45 13.17 36.10 40 50 3 20 60 13 79.53 20.57 15.25 17.40 15.18 41 50 2 15 60 13 80.87 19.16 13.56 18.84 14.25 42 60 3 10 50 13 82.26 19.56 14.58 16.41 18.88 43 60 2 15 70 13 84.13 20.69 15.00 16.59 17.37 44 50 3 10 60 13 77.93 18.78 14.06 18.32 13.97 45 60 4 15 60 12 76.89 21.86 16.20 14.75 25.39 46 70 3 10 60 13 75.50 21.83 17.09 14.52 27.07 A, soaking temperature (°C); B, soaking time (h); C, steaming time (min); D, drying temperature (°C); E, drying time (h); YLD, yield (%); b*, b-value (yellowness/blueness); CT, cooking time (min); CL, cooking loss (%); HRD, hardness (N). Table 1.
Experimental runs and corresponding responses.
-
Source of variation DF SS MS F-value Significant
model termsY1 Model 20 987.01 49.350 87.84*** Linear 5 555.24 111.048 197.65*** A***, B***, C*** Square 5 357.72 71.543 127.34*** A2 ***, C2 ***, D2 *** Interactions 10 74.05 7.405 13.18*** AB***, AC***, CE** Lack-of-fit 20 9.41 0.470 0.51 ns Pure error 5 4.64 0.928 Total 45 1001.05 Goodness-of-fit R2 = 0.986,
Adj. R2 = 0.974Y2 Model 20 116.769 5.8384 73.41*** Linear 5 113.453 22.6906 285.29*** A***, B***, C***, D***, E* Square 5 1.680 0.3360 4.22** A2*, B2*, C2* Interactions 10 1.636 0.1636 2.06 ns AB**, AC* Lack-of-fit 20 1.560 0.0780 0.91 ns Pure error 5 0.428 0.0856 Total 45 118.757 Goodness-of-fit R2 = 0.983,
Adj. R2 = 0.969Y3 Model 20 51.9195 2.5960 59.93*** Linear 5 49.1806 9.8361 227.08*** A***, B***, C***, D*** Square 5 2.3532 0.4706 10.87*** A2***, C2* Interactions 10 0.3858 0.0386 0.89 ns Lack-of-fit 20 0.9958 0.0498 2.86 ns Pure error 5 0.0871 0.0174 Total 45 53.0024 Goodness-of-fit R2 = 0.979,
Adj. R2 = 0.963Y4 Model 20 89.6167 4.4808 280.52*** Linear 5 87.2936 17.4587 1092.9*** A***, B***, C***, D*** Square 5 2.0048 0.4010 25.10*** A2***, B2***, C2* Interactions 10 0.3184 0.0318 1.99 ns AC*, BC* Lack-of-fit 20 0.3616 0.0181 2.40 ns Pure error 5 0.0377 0.0075 Total 45 90.0161 Goodness-of-fit R2 = 0.995,
Adj. R2 = 0.992Y5 Model 20 1525.73 76.29 79.61*** Linear 5 1443.87 288.77 301.37*** A***, B***, C***, D*** Square 5 34.61 6.92 7.22*** A2**, B2*, D2* Interactions 10 47.26 4.73 4.93*** AB***, AC***, BD* Lack-of-fit 20 20.54 1.03 1.50 ns Pure error 5 3.41 0.68 Total 45 1549.69 Goodness-of-fit R2 = 0.984,
Adj. R2 = 0.972Y1, yield; Y2, b-value; Y3, cooking time; Y4, cooking loss; Y5, hardness; DF, degrees of freedom; SS, sum of squares; MS, mean square; Adj., adjusted. * Significant at p < 0.05; **significant at p < 0.01; *** significant at p < 0.001; ns = not significant. A, soaking temperature (°C); B, soaking time (h); C, steaming time (min); D, drying temperature (°C); E, drying time (h). Table 2.
ANOVA for response variables.
-
Nutritional parameter Raw wheat Bulgur wheat p-value Proximate analysis (%) Moisture 10.25 ± 0.06 10.05 ± 0.03 0.150 Carbohydrate 72.69 ± 0.17 74.46 ± 0.72 0.670 Protein 13.54 ± 0.21 12.96 ± 0.42 0.253 Fat 1.78 ± 0.07 0.97 ± 0.21 0.025 Ash 1.74 ± 0.06 1.56 ± 0.08 0.025 Water-soluble vitamins (mg/100 g) Thiamine 0.16 ± 0.03 0.07 ± 0.01 0.037 Riboflavin 1.80 ± 0.06 1.61 ± 0.04 0.079 Niacin 17.67 ± 0.03 2.08 ± 0.02 0.000 Pyridoxine 0.13 ± 0.01 0.05 ± 0.02 0.002 Pantothenic acid 0.67 ± 0.03 0.17 ± 0.01 0.001 Minerals (mg/100 g) Calcium 68.58 ± 0.79 62.10 ± 1.56 0.031 Magnesium 181.71 ± 3.20 171.69 ± 3.80 0.129 Potassium 718.98 ± 19.66 644.61 ± 15.38 0.001 Phosphorus 508.96 ± 3.19 499.91 ± 1.60 0.082 Iron 5.65 ± 0.38 5.15 ± 0.16 0.247 Sodium 8.15 ± 1.04 2.30 ± 0.96 0.017 Manganese 4.55 ± 0.13 3.89 ± 0.21 0.006 Zinc 5.78 ± 0.13 4.63 ± 0.11 0.012 *p < 0.05 indicates a significant difference between samples. Table 3.
Nutritional composition of raw and bulgur wheat.
Figures
(5)
Tables
(3)