


-
Nowadays, there is a growing demand for nutritious food due to increasing health awareness. Globally, the human population suffers from hunger, obesity, and malnutrition. Whole wheat, cracked grains, and processed grains can overcome these global health issues. Bulgur wheat is considered a whole wheat product and a functional food, as it is a good source of bioactive compounds, minerals, and dietary fibre and has a low glycaemic index. Because of this, there has been an increase in its consumption in the USA, Canada, European, and Arab countries[1,2]. It is known as the first processed food and is a part of traditional cuisine in Middle Eastern countries[3]. It is a parboiled, semi-ready-to-eat product which is prepared by cleaning, cooking, drying, partially debranning, and cracking[1,2,4−6]. It can be coarse (3.5–2.0 mm) or fine (2.0–0.5 mm), while grain with a size of < 0.5 mm is considered to be bulgur flour[4,7,8]. It is mainly produced from hard wheat (Triticum durum), which imparts a desirable yellow colour and has higher protein quantity compared with other types of wheat. A high 1,000-kernel weight, generally found in durum wheat varieties, has also been positively correlated with the yield of bulgur wheat[9]. The World Food Programme (WFP) utilises bulgur wheat in famine-hit regions due to its nutritional value, long shelf life, economical production, resistance to mites, and ability to withstand improper storage conditions[1,5,10,11]. It is a healthier alternative compared with bread and pasta in terms of B vitamins, calcium, iron, and protein. In the bulgur-making process (bulguration), the germ and aleurone layer are not entirely separated from the kernel, which facilitates the retention of nutrients[4].
Cooking and drying are the crucial steps in determining bulgur wheat's quality. The purpose of cooking is to gelatinise the starch completely. Soaking the wheat grains before steaming is essential for uniform hydration of the starch granules for gelatinisation[12,13]. It is crucial to prevent overcooking, as there is a risk of deformation or disruption of wheat grains with the starch oozing from the crease. Drying decreases the moisture content, which increases the keeping quality. It is crucial to control the drying conditions, as it may affect the appearance due to heat[11,14]. Traditionally, cooking is done in boiling water, then the grains are hand-rubbed for debranning and dried openly in the sun to make bulgur wheat in rural parts of Turkey. Sun drying could result in contamination, and weather dependency often leads to a nonuniform drying rate, which negatively affects quality[15−17]. Industries use boiling or steaming for cooking, and employ stone, disc, or hammer mills for debranning and milling[4,7,17]. According to Stone et al.[12], industries often use pressure steaming (autoclaving) for cooking, and drying is carried out either with hot air towers or in the sun. Consequently, there is no specific framework for making bulgur wheat.
Several studies have evaluated the effect of different cooking methods, such as traditional (boiling), autoclaving, and steam cooking, as well as drying methods, such as hot air ovens, microwave ovens, and infrared, on the quality of bulgur wheat[2,3,7,12,18−23]. Only a few optimisation studies have been conducted to optimise the processing conditions. Moreover, the primary focus has been on cooking time rather than optimising sequentially dependent processing steps, which are essential for efficient parboiling. The optimised cooking time for the traditional method was reported to be 40 min[11] or 43 min[24], or 90 min for steam cookers and 15 min for autoclaves[7]. Previous studies have been predominantly conducted on wheat cultivated in regions of traditional bulgur-eating populations, which also lead the export market. Additionally, the potential of wheat grown in nontraditional bulgur-producing regions remains largely unexplored, despite the increasing global demand. Several countries import bulgur wheat, despite being large producers of wheat, especially durum[12]. Furthermore, there is uncertainty about whether the processing conditions recommended in previous studies are technically suitable for producing bulgur from wheat grown in other regions. The present study aimed to optimise the crucial stages involved in parboiling (soaking, cooking, and drying) to maximise yield and b-value, and minimise cooking time, cooking loss, and hardness, using wheat cultivated in South Asia. Subsequently, the effect of optimised processing conditions on structural changes and the nutritional composition of bulgur wheat was analysed.
-
HI 8663 (Triticum durum), commonly known as 'Poshan', was used in this study, which was procured from the ICAR (Indian Agricultural Research Institute, Regional Station, Indore, India). The variety was selected on the basis of preliminary studies in which 19 South Asian wheat varieties (T. durum and Triticum aestivum) were evaluated for bulgur-making quality. The procured variety was manually cleaned to remove foreign matter and impurities, packed in air-tight polyethylene bags, and stored at 4 ± 1 °C in the laboratory's deep freezer.
All the reagents, such as sodium sulphate, copper sulphate, sulfuric acid, hydrochloric acid, sodium hydroxide, phenolphthalein indicator, methyl red indicator, petroleum ether, lactic acid, sodium dodecyl sulphate, methanol (high-performance liquid chromatography [HPLC] grade), acetic acid, HPLC-grade water, trichloroacetic acid, hexane-1 sulfonic acid sodium salt, triethyl amine, sodium dihydrogen phosphate, acetonitrile, ortho-phosphoric acid, concentrated nitric acid, hydrogen peroxide, and potassium bromide, were of analytical grade and were obtained from HiMedia (Mumbai, India), Thomas Baker (Mumbai, India), Loba Chemie (Mumbai, India), and Thermo Fisher Scientific (Banglore, India). The standards, such as thiamine, riboflavin, niacin, pantothenic acid, pyridoxine, calcium, magnesium, potassium, phosphorus, iron, sodium, manganese, and zinc, were obtained from Merck.
Experimental design
-
Response surface methodology (RSM) is a popular statistical and mathematical technique used in optimisation studies involving multiple variables that affect responses. The Box–Behnken Design (BBD) is one of the experimental design tools of RSM, often used in food processing. It is a three-level factorial design, suitable for studies addressing 3 to 7 variables, but can be extended to up to 21 variables[25]. In the current study, the BBD, under the framework of RSM, was used to design the experimental runs for optimising the processing variables. The five independent (processing) variables, namely soaking temperature (50, 60, 70 °C), soaking time (2, 3, 4 h), steaming time (10, 15, 20 min), drying temperature (50, 60, 70 °C), and drying time (12, 13, 14 h), were studied at three levels. The selected variables have been reported to determine the efficiency of the parboiling process, which affects the yield, cooking, and textural properties of the product[26−28]. The levels of each independent variable were selected on the basis of previous literature[3,4,19,29−31] and preliminary feasibility studies. The BBD was implemented using MINITAB 19 statistical software, resulting in a total of 46 runs with 6 centre points. The responses or dependent variables studied were yield, b-value (yellowness), cooking time, cooking loss, and hardness, which were categorised according to industrial and consumer preferences. The responses were correlated with independent variables by quadratic or linear models, facilitating the optimisation of variables. The quadratic regression model incorporating a linear model is as follows[32]:
$ Y={\beta }_{0}+\sum _{i=1}^{k}{\beta }_{i}{X}_{i}+\sum _{i=1}^{k}{\beta }_{ii}{X}_{i}^{2}+\sum _{i=1}^{k}\sum _{j=i+1}^{k}{\beta }_{ij}{X}_{i}{X}_{j}+\varepsilon $ (1) where, Y is the response variable (yield, colour, cooking time, cooking loss, and hardness); Xi and Xj are the dependent variables; k represents the independent variables; β0, βi, βii, and βij are the intercepts (regression coefficients and constants), and ε is the error term of the experiments.
Bulgur preparation
-
The weight of the grains (10.25% moisture content) per run was 100 g, and the ratio of grain to water was kept at 1:2 (w/w). The ratio was selected on the basis of preliminary studies and previous literature[30]. Distilled water was used for soaking and preheated to the required temperature in a water bath before soaking the grains. The wheat grains were then surface-dried and steamed in an autoclave at 121 °C (15 psi). Drying was carried out in a hot air oven. After drying, the grains were mixed for 10 min with 2% additional water to facilitate partial debranning and then milled in the laboratory's hammer mill. The by-products, such as flour, were removed with a 0.5-mm sieve, and the bran was aspirated[4].
Response analysis
Yield of bulgur
-
Yield was measured according to Kahyaoglu et al.[21] with slight modifications. The cracked material over 0.50 mm[3] obtained by sieving through 2.81-mm mesh[8] constituted the weight of bulgur wheat. The percent yield was expressed as:
$ \text{Yield}\; (\text{%})=\left(\dfrac{\text{BW}}{\text{PW}}\right)\times 100 $ (2) where, BW and PW are the weight of bulgur wheat originally obtained and the weight of parboiled wheat, respectively.
Colour (yellowness) of bulgur
-
Yellowness or b-value was determined according to Sfayhi Terras et al.[33] with slight modification. Colour was analysed for bulgur flour to maintain homogeneity in the assessment. A chromameter (CR 400, Konica Minolta, INC., Japan) measures colour in terms of L* (0; black, 100; white), a* (−a*; greenness, +a*; redness), and b* (−b*; blueness, +b*; yellowness). Only the b-value was used in the study.
Cooking time
-
Cooking time was determined according to Singh et al.[34] with slight modifications. Bulgur wheat (2 g) was cooked in 40 mL of boiling water. To govern cooking time, cooked samples were removed at different intervals and pressed between glass slides until a white core was no longer visible.
Cooking loss of cooked bulgur
-
Cooking loss was measured according to Singh et al.[34] with slight modifications. Bulgur wheat samples (2 g) were cooked in 40 mL of boiling water for a predetermined cooking time. The cooking water was transferred through a sieve into a preweighed aluminium dish. An additional 10 mL of distilled water was poured through a sieve into the dish to remove adhered solids in it. The dish was kept at 110 °C in a hot air oven until the weight of the dish remained constant for three consecutive sampling times.
$ \text{Cooking loss}\;\left(\text{%}\right)=\left(\dfrac{\text{Increase in weight of aluminium dish}}{\text{Weight of bulgur sample}}\right)\times 100 $ (3) Hardness of cooked bulgur
-
Hardness was determined using a Texture Analyser (Stable Micro Systems TA-XT 2i, Godalming, United Kingdom) as per the method described by Yilmaz et al.[3] with slight modifications. Optimally cooked samples were surface-dried and cooled, then 1 g of the sample was placed carefully in the centre of the platform, while avoiding overlap. The calibration of the instrument was carried out with a 5-kg load cell, and the return distance was set to 30 mm with a contact force of 5 g. The P/25 aluminium cylindrical probe, with pretest, test, and post-test speeds of 2.0, 1.0, and 1.0 mm/s, respectively, and with 75% compression strain, was applied in two-cycle compression mode.
Proximate analysis
Carbohydrate content
-
The carbohydrate percentage for raw and bulgur wheat was determined by the difference method[35].
$ \text{Carbohydrate} \;({\text{%}}) =\{ 100 - [{\mathrm{Protein}} ({\text{%}}) + {\mathrm{Fat}} ({\text{%}}) + {\mathrm{Ash}} ({\text{%}})]\} $ (4) Protein content
-
In a Kjeldahl flask, 1 g of flour, 8 g of sodium sulphate, and 500 mg of copper sulphate were weighed. Concentrated sulfuric acid (25 mL) was added to the flask, and glass beads were used to avoid the clumping of chemicals during digestion. The mixture was digested until it turned pale green or colourless. The mixture was allowed to cool, and then 200 mL of distilled water and a few drops of phenolphthalein indicator were added. The flask was attached to a condenser, and the other end of the condenser was dipped in a conical flask containing 0.1 N hydrochloric acid and a few drops of methyl red indicator were added. In the distillation process, 50% sodium hydroxide was added slowly in the Kjeldahl flask to neutralise the mixture and further make it an alkaline solution. The aim was to collect all the ammonia at the other side of the flask containing standard acid. The distillate and blank were titrated with 0.1 N sodium hydroxide. The percent nitrogen was multiplied by the conversion factor 5.7 for calculating protein (%).
$ \mathrm{P}\mathrm{r}\mathrm{o}\mathrm{t}\mathrm{e}\mathrm{i}\mathrm{n}\;\left(\text{%}\right)=\dfrac{\left(\mathrm{b}-\mathrm{s}\right)\mathrm{\ \times\ }\mathrm{N}\mathrm{\ \times\ }1.4}{\mathrm{w}} $ (5) where, b is the amount of sodium hydroxide (in mL) required to titrate the blank, s is the amount of sodium (in mL) required to titrate the sample, N is the normality of sodium hydroxide used in the titration, and w is the weight of the sample (g)[36].
Fat content
-
Fat (%) was determined using the Soxhlet method, using a round-bottom flask, a Soxhlet extractor, and a condenser[36]. Flour (5 g) was placed in a thimble for extraction, which was then covered with cotton to prevent sample spillage. The thimble was placed in the Soxhlet extractor, and 90 mL of petroleum ether was heated for 5 to 6 h in a preweighed round-bottom flask for extraction.
$ \text{Fat}\;(\text{%})=\dfrac{\mathrm{Weight}\; \mathrm{of}\; \mathrm{fat}\; \mathrm{extracted}\, \left(\mathrm{g}\right)}{\mathrm{Weight\; }\mathrm{of}\; \mathrm{sample}\left(\mathrm{g}\right)}\ \times\ 100 $ (6) Ash content
-
Raw and bulgur wheat flour (5 g) were weighed in a preweighed crucible. The flour was charred on a hot plate in a fume hood until the emission of smoke stopped. The sample was then kept in a muffle furnace at 550 °C for 5 to 6 h until a whitish grey ash was obtained. The crucible was then kept in a desiccator to cool and was weighed upon cooling[36].
$ \mathrm{Ash}\;\left(\text{%}\right)=\dfrac{\mathrm{Weight}\; \mathrm{of}\; \mathrm{ash}\left(\mathrm{g}\right)}{\mathrm{Weight}\; \mathrm{of}\; \mathrm{sample}\left(\mathrm{g}\right)}\ \times\ 100 $ (7) Water-soluble vitamins analysis
-
Water-soluble vitamins were quantified according to Aslam et al.[37] and Romera et al.[38] using HPLC-UV (high-performance liquid chromatography with ultraviolet detection) (Shimadzu Prominence-i LC-2030C 3D) with modifications. Samples for thiamine (B1), riboflavin (B2), niacin (B3), and pyridoxine (B6) were prepared in a 50-mL volumetric flask, in which 5 g flour was sonicated for 30 min after the addition of 20 mL of methanol (20% v/v) and 2 mL of acetic acid (2 M). After sonication, the volume was made up to 50 mL with 20% methanol. Samples for pantothenic acid (B5) were prepared by stirring 12 g of flour in 100 mL of water (HPLC grade) for 10 min. To 5 mL of the aliquot, 1 mL of acetic acid (10%) and 1.5 mL of sodium acetate (1 M) were added, and the mixture was centrifuged for 10 min at 4,000 rpm. The extracted solutions were filtered through a 0.45-micron filter.
Mobile Phase A for vitamin B1, B2, B3, and B6 consisted of 2 g trichloroacetic acid, 1.1 g hexane-1-sulfonic acid sodium salt, and 2 mL triethylamine in 1 L HPLC-grade water. The pH was adjusted to 2.75 with glacial acetic acid. Mobile Phase B was 100% methanol. The mobile Phase A for vitamin B5 consisted of 0.325 M sodium dihydrogen phosphate and acetonitrile (97:3), with a pH of 2.5 adjusted by orthophosphoric acid. The elution was carried out using the following gradient program: 0% B at 0.01 min, 0%−20% B over 11 min, 20%−50% B for 9 min, 50%−40% B in 1 min, 40%−0% B in 9 min. A C18 column (250 mm × 4.6 mm, 5.0 µm) was used with an injection volume of 20 µL and a flow rate of 1.0 mL/min. The wavelengths and runtimes for vitamin B1, B2, B3, and B6 were 275 nm and 30 min, respectively, and for vitamin B5 were 197 nm and 15 min, respectively. The results were expressed as mg/100 g by calculating the integrated areas of the sample and corresponding standards.
Minerals analysis
-
Minerals were quantified using ICP-MS (inductively coupled plasma mass spectrometry) (7800, Agilent Technologies, USA) according to Alhagri & Albeshry[39] with modifications. Flour (0.5 g) was weighed and transferred to a microwave digester vial. Concentrated nitric acid (5 mL) and hydrogen peroxide (1 mL) were added to the vial and allowed to stand for 15 min before being placed in the microwave digestion bomb. After digestion, the material was transferred to a 25-mL volumetric flask upon cooling, and the volume was made up with Milli-Q water. The samples were analysed under the following conditions: radio frequency power, 1,500 W; sampling depth, 8.0 mm; nebuliser gas, 1.03 L/min; auxiliary gas, 0.9 L/min; plasma gas, 15 L/min; helium gas, 4.3 mL/min; nebuliser pump, 0.1 rps; spray chamber temperature, 2 °C; wash bank, 4% nitric acid. The results were expressed as mg/100 g.
X-ray diffraction analysis
-
The change in the crystalline diffraction pattern of starches in raw and bulgur wheat was determined using an X-ray diffractometer (SmartLab 3kW, Rigaku, Japan) according to the method described in Chen et al.[40]. The diffraction pattern was plotted, and the area under the peak was determined using OriginPro software (version 8.5). The percent degree of crystallinity was calculated as follows:
$ {\text{Degree of crystallinity}}\; ({\text{%}})=\left(\dfrac{\mathrm{Total}\; \mathrm{area}\; \mathrm{of}\; \mathrm{peaks}}{\mathrm{Total}\; \mathrm{area}\; \mathrm{of}\; \mathrm{curve}}\right)\ \times\ 100 $ (8) FTIR analysis
-
FTIR (Spectrum Two, PerkinElmer, USA) was utilised according to the method described by Khuntia et al.[23] to study the protein's secondary structure. Raw and bulgur wheat were ground, and a 1 mg sample was weighed and thoroughly mixed with potassium bromide. The samples were analysed using a wavenumber range of 400 to 4,000 cm–1. The graph of absorbance versus wavenumber was plotted using OriginPro software (version 8.5), which analysed the peaks of the secondary structure in the Amide I region.
Surface morphology
-
Surface morphology was studied using scanning electron microscopy (SEM) (7610F Plus/JEOL, Japan) by the method described in Hendek Ertop[41]. The grains were cut across the crease from the middle and from the end to adhere them to an aluminium platform covered with double-sided adhesive tape. The samples were coated with gold and then analysed by SEM at magnifications of ×25, ×500, ×1,000, and ×3,000.
Statistical analysis
-
The significance of regression models depicting the interactions between the independent variables and responses in the optimisation was studied by analysis of variance (ANOVA) (at p < 0.05, p < 0.01, and p < 0.001 in the case of highly significant differences) in MINITAB 19. A paired t-test was used to examine whether bulguration caused statistical differences in the nutritional and structural profiles of raw and bulgur wheat. The statistical analysis was performed in SPSS (IBM software, version 21).
-
Yield is an important quality criterion for bulgur wheat production. A higher yield benefits both the producer and the consumer by making the production process sustainable and economical[7]. Soaking wheat grains at 50 °C for a shorter time resulted in ungelatinised wheat grains; therefore, a longer soaking time was required to hydrate the grains to a level sufficient for complete gelatinisation of the starch. The extent to which starch gelatinises depends on hydration during soaking and heating during steaming[42]. The wheat grains soaked at 70 °C opened up at the crease even at lower soaking times and were fully dispersed at higher soaking times. The response surface graph (Fig. 1a) indicates that soaking at 70 °C resulted in a sharp decrease in yield with increasing soaking time. The grain opening at the crease exposes the starch, which tends to stick to form a clump with other deformed grains. These disintegrated clumped grains cannot be further dried, as this would disrupt the continuous processing line in industries and result in low yield[14,24]. It was observed that a combination of higher soaking temperature and longer steaming time resulted in a lower yield (Fig. 1b), which could be attributed to the overcooking of the wheat grains. The yield increased with increasing steaming time, particularly when soaked at 50 °C, which could be attributed to increased gelatinisation over time. The wheat grains soaked at 60 °C for 3 h showed disintegration when steamed for 15 min or longer, and the grains opened up along the crease. The processing condition of soaking at 60 °C for 3 h and steaming for 15–17 min[2,18,43] has been generally used to produce bulgur wheat in prior studies. A higher yield was observed for soaking at 60 °C, and when the soaking time was kept below 3 h. This soaking condition maintained the integrity of grains for longer steaming times.
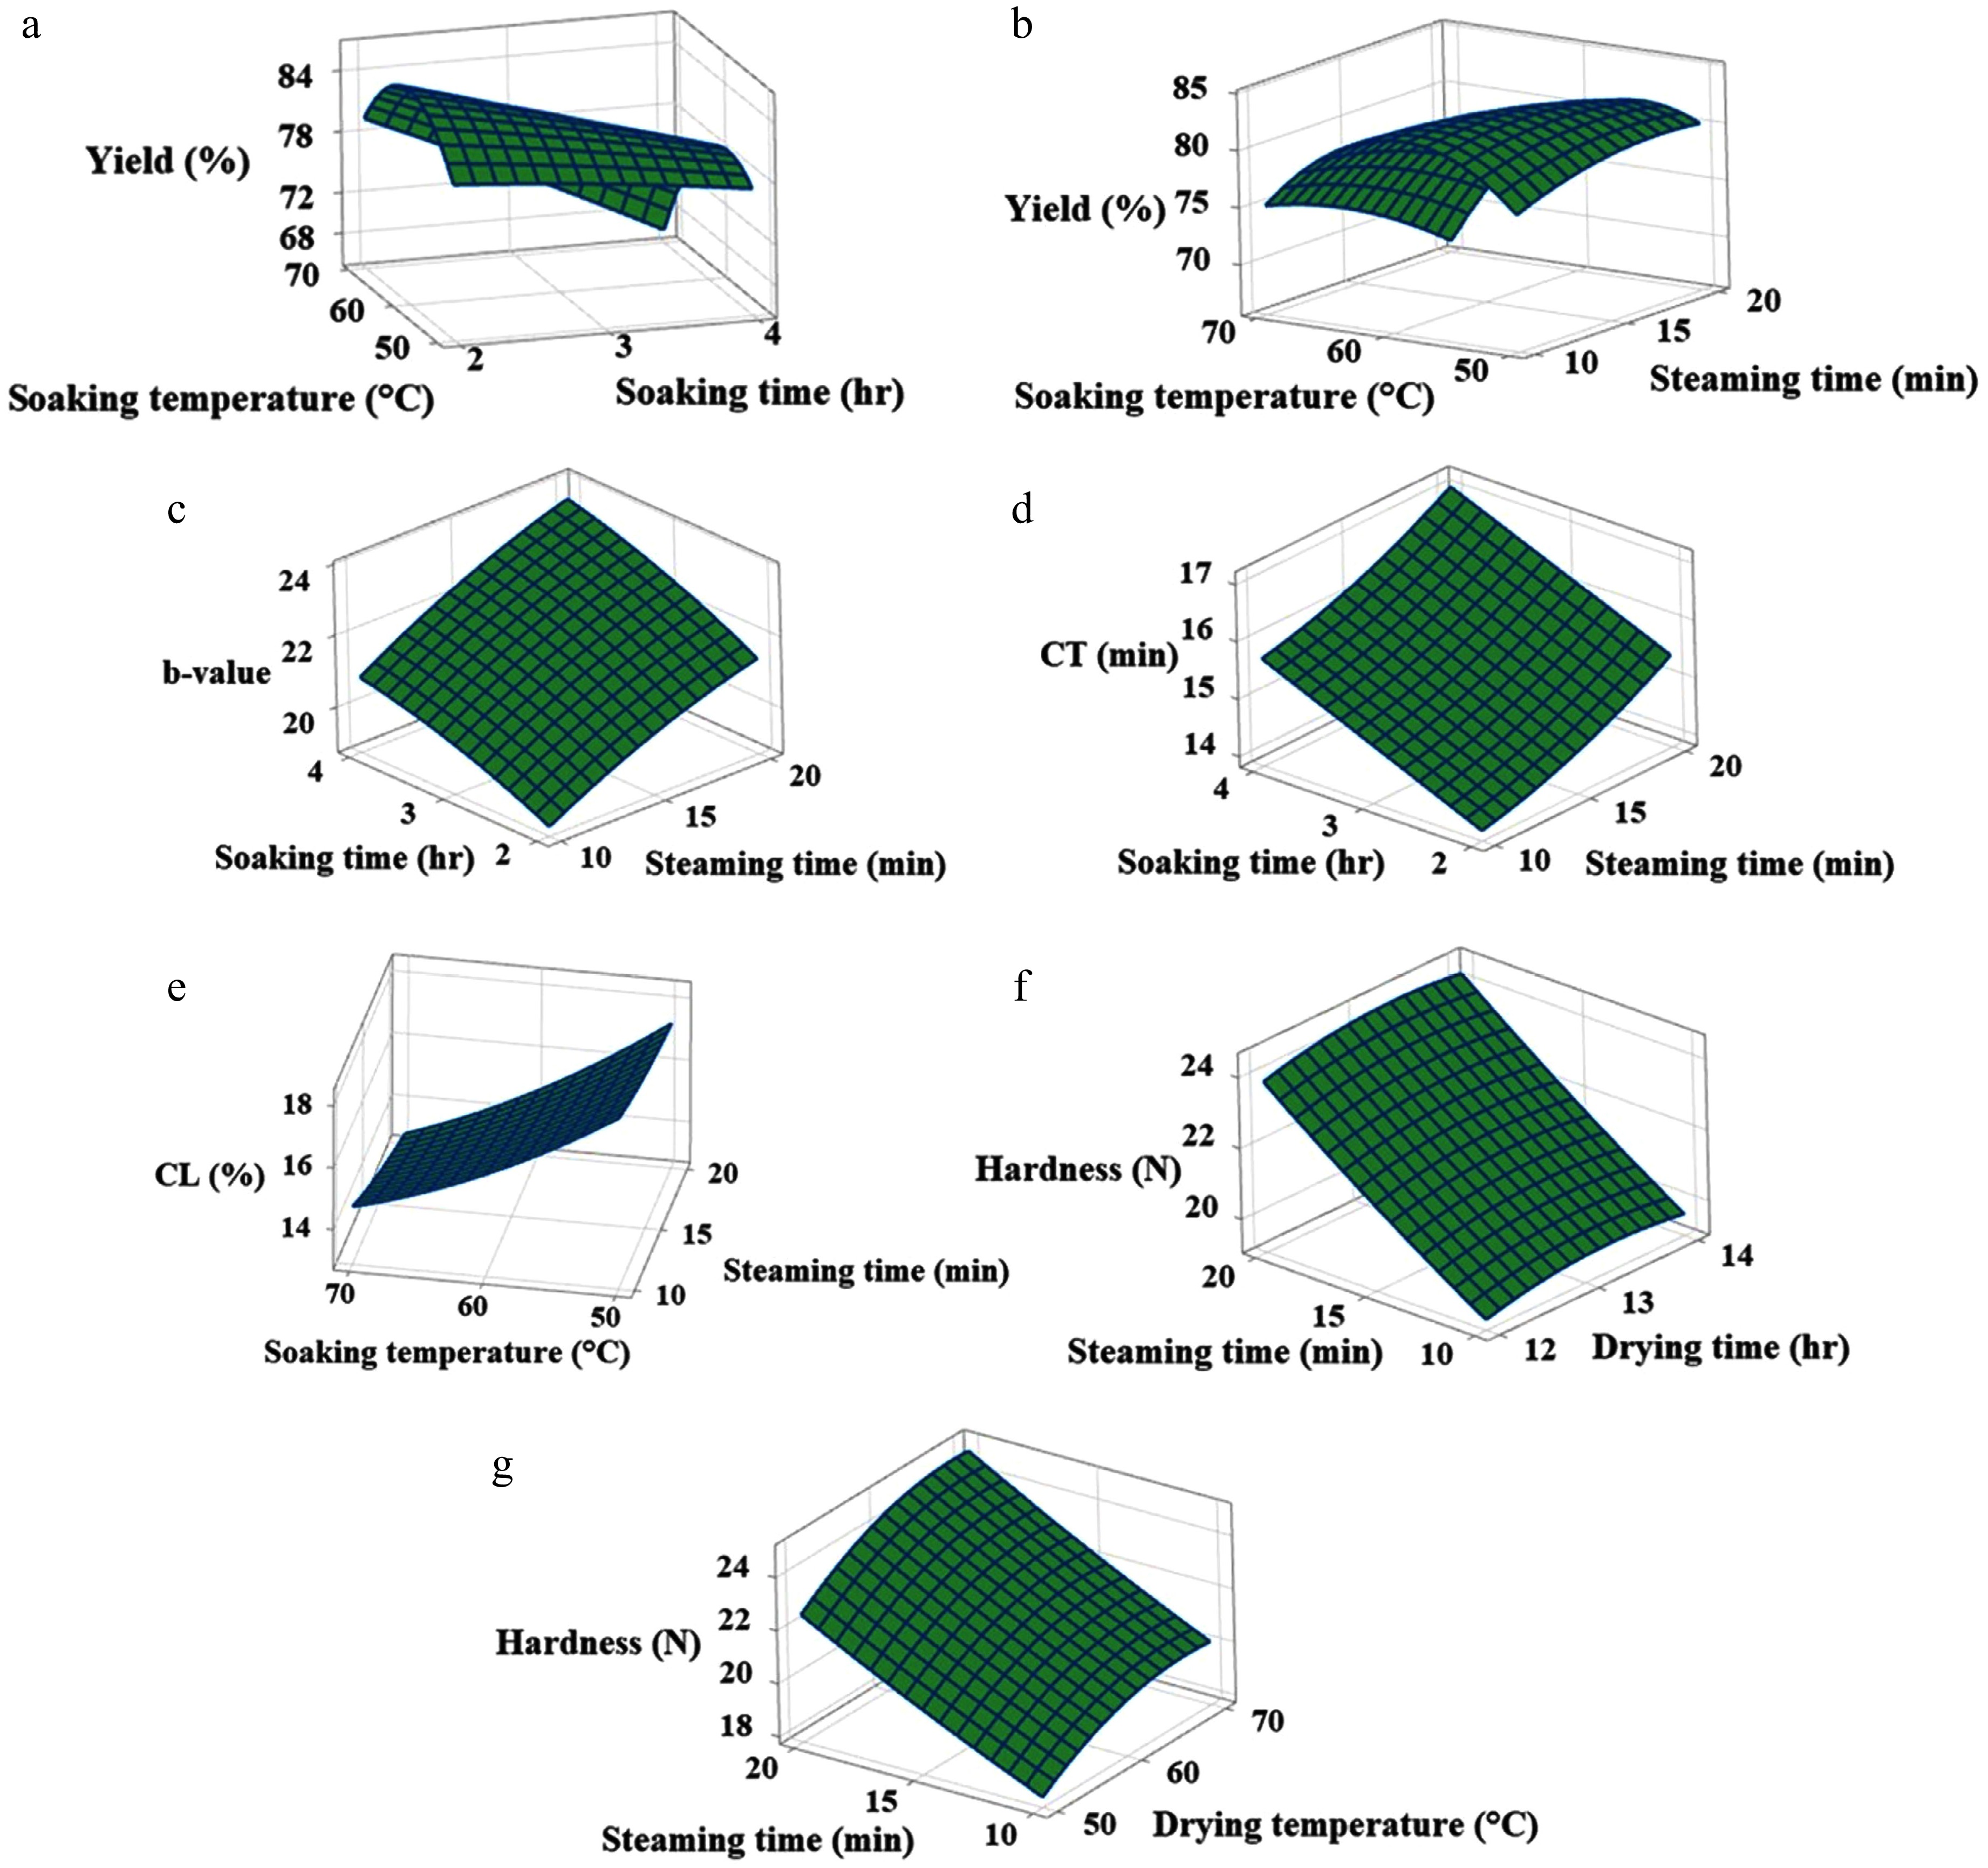
Figure 1.
Response surface graphs displaying the effect of (a) soaking time and temperature on yield, (b) soaking temperature and steaming time on yield, (c) soaking time and steaming time on b-value, (d) soaking time and steaming time on cooking time, (e) soaking temperature and steaming time on cooking loss, and (f), (g) steaming time, drying time, and drying temperature on hardness.
Amber colour is a desirable quality of bulgur wheat, desired by traditional consumers. Durum wheat contains carotenoids, which are responsible for its yellow colour[19]. It can be observed from Fig. 1c that the b-value increases with each advance in the processing conditions, specifically between the soaking time and steaming time. Several previous studies have reported increased yellowness in durum bulgur[3,4,8,41,44]. This can be observed in Fig. 2b, d, where the difference in the yellowness of cracked raw and bulgur wheat can be perceived. An extended period of soaking and steaming enables the pigments present in wheat and rice bran to infiltrate into the endosperm, which increases the b-value[7,13,26,45].
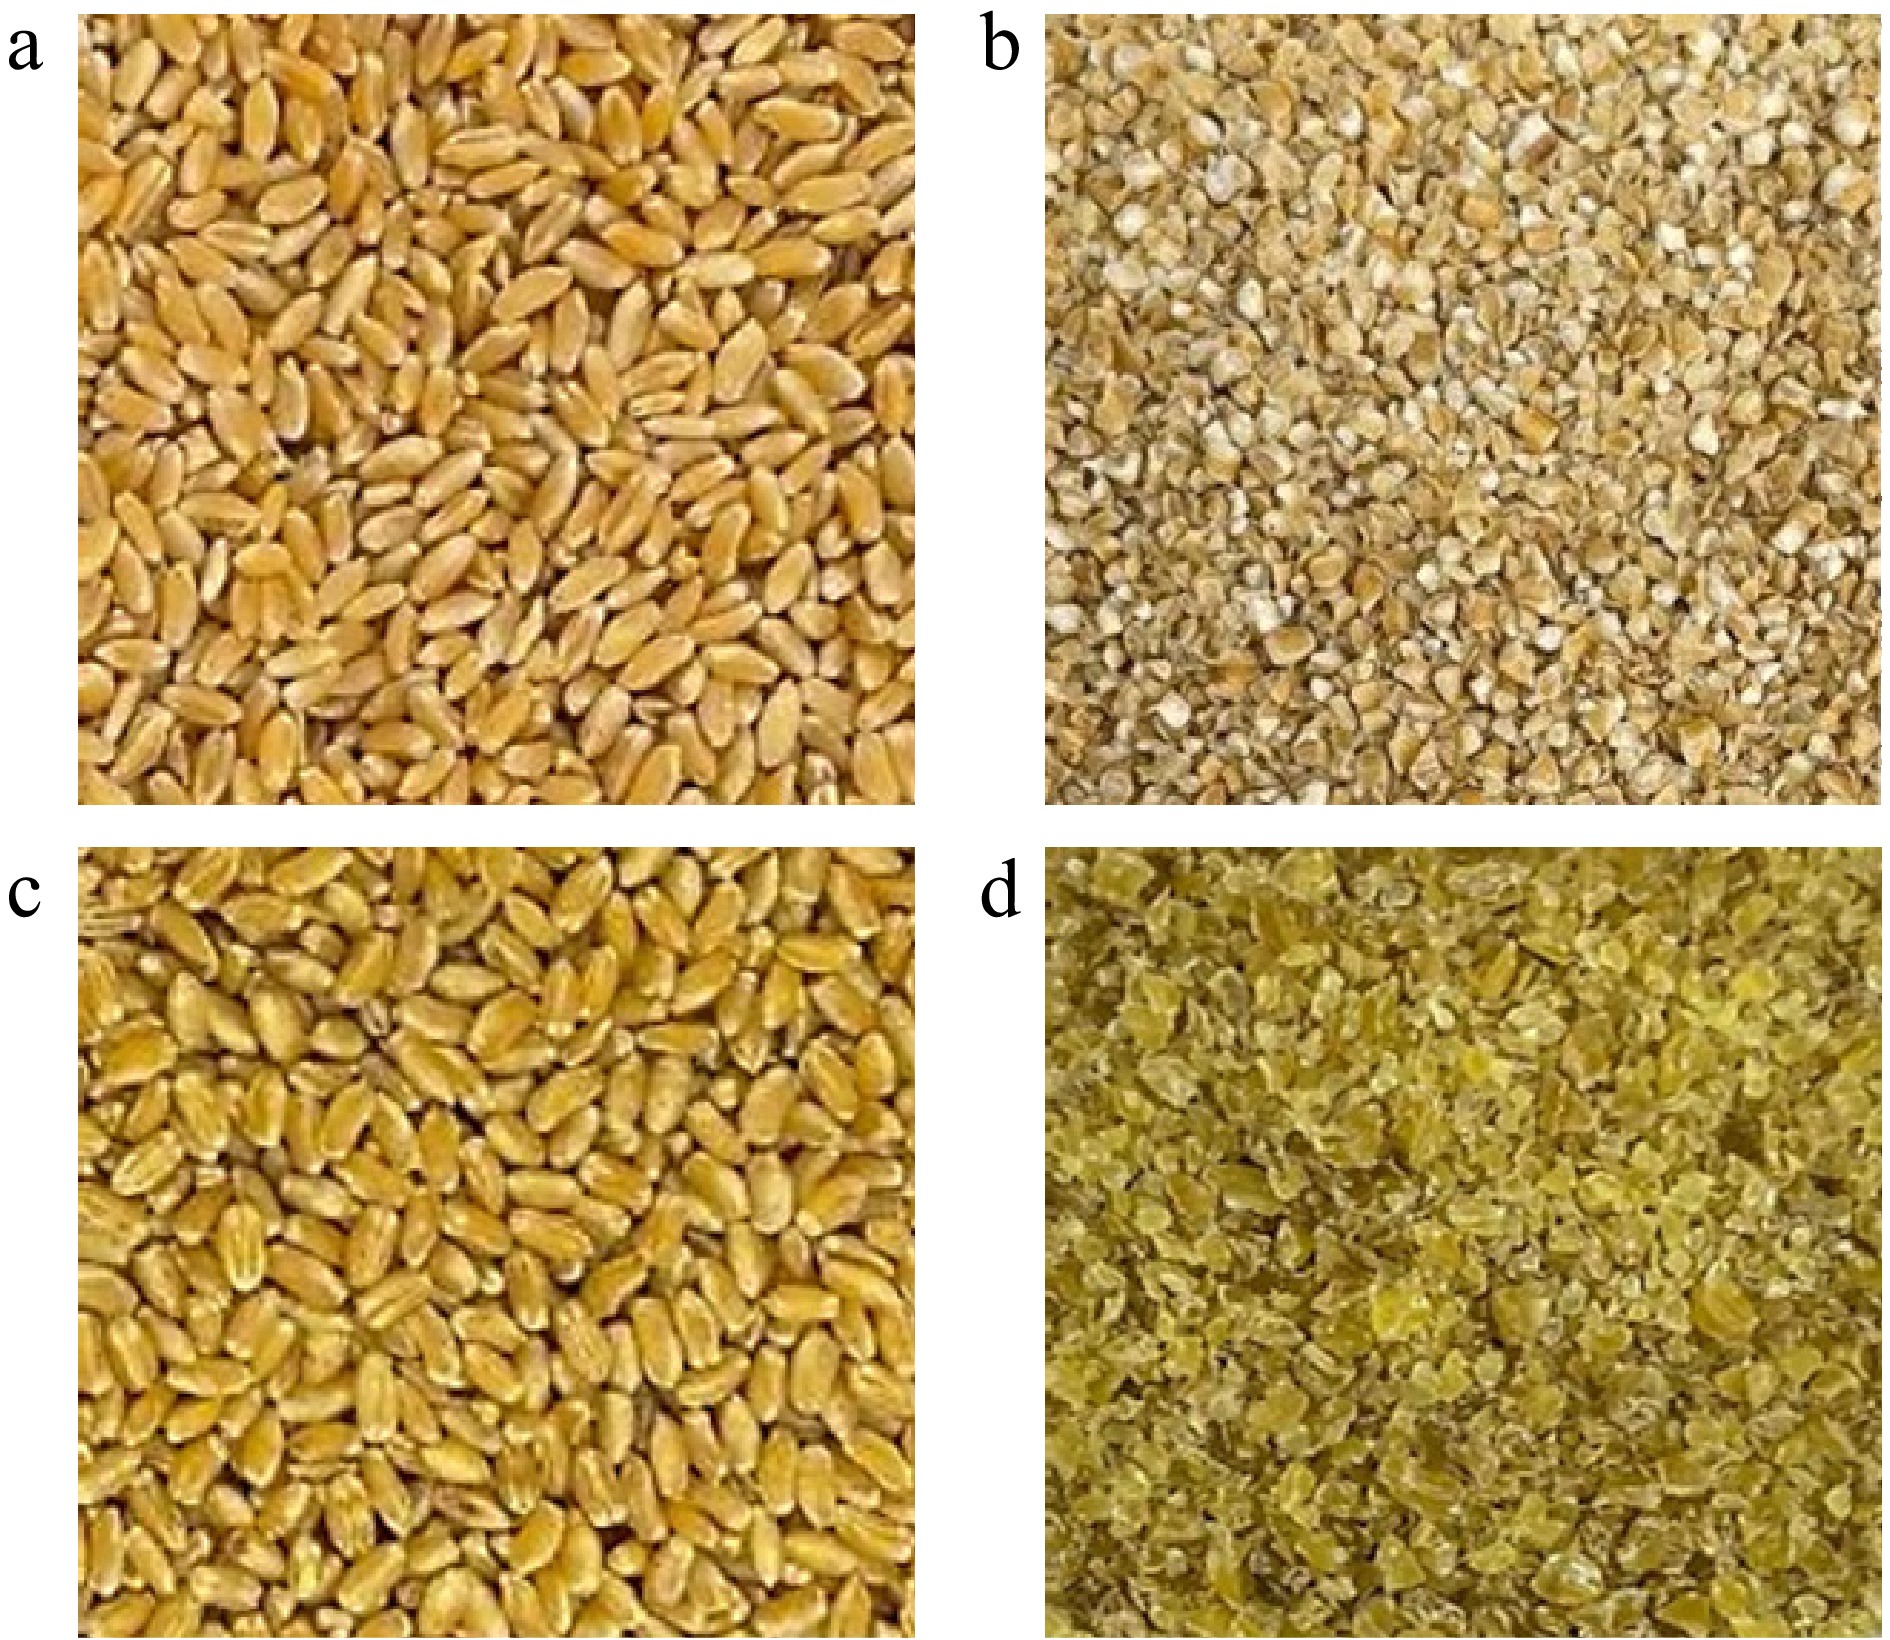
Figure 2.
(a) Raw, (b) cracked raw, (c) parboiled, and (d) bulgur wheat.
Cooking time and cooking loss are the main cooking quality criteria for bulgur wheat. Low cooking time and cooking loss are desirable properties of bulgur wheat. Cooking time was observed to increase with longer soaking times and steaming times (Fig. 1d). In contrast, cooking loss decreased with the greater soaking temperatures and steaming times (Fig. 1e). The increase in soaking temperature, soaking time, and steaming time increases the degree of gelatinisation, which hardens the grain[46]. This hinders water from penetrating into the grain due to cohesion in the endosperm cells, which slows down the hydration rate of starch and, consequently, increases the cooking time[45]. A decrease in the cooking loss of parboiled wheat and other cereals has been reported, attributed to starch gelatinisation, which imparts a compact structure and thereby reduces cooking loss[13,44,45,47]. Fig. 1f, g shows that hardness increases with the severity of steaming and drying conditions. Chavan et al.[45] observed that the hardness of cooked parboiled rice was greater than that of cooked unparboiled rice. Yousaf et al.[26] reported a linear relationship between the hardness of parboiled rice and soaking conditions. The increase in hardness is associated with starch gelatinisation, followed by retrogradation in parboiled cereals[13].
Numerical optimisation of processing variables
-
The data of the response variables corresponding to experimental runs, which were subjected to numerical optimisation, are presented in Table 1. The yield and b-value were selected to be at the higher end, while cooking time and cooking loss were kept at the lower end. The hardness of bulgur wheat is preferably neither too high nor too low, so it was kept between 12 and 20 N.
Table 1. Experimental runs and corresponding responses.
Run A B C D E YLD b* CT CL HRD 1 60 3 15 60 13 80.94 21.60 15.46 15.23 21.41 2 60 2 15 50 13 85.43 19.53 14.29 16.98 11.17 3 60 3 15 60 13 82.93 21.20 15.31 15.45 21.43 4 60 3 15 60 13 82.84 21.60 15.13 15.25 23.02 5 70 3 15 60 12 72.62 23.81 17.21 13.76 30.31 6 50 3 15 60 14 80.29 19.85 14.55 17.69 14.53 7 70 3 15 70 13 70.15 24.28 17.35 13.64 32.25 8 60 3 15 70 12 79.68 21.89 15.53 15.18 21.61 9 60 2 20 60 13 83.27 21.85 15.35 16.17 18.76 10 60 2 10 60 13 84.65 19.19 14.00 17.42 15.52 11 60 4 15 50 13 76.78 21.75 16.14 14.81 24.49 12 60 3 20 60 12 77.68 22.26 16.18 14.85 23.59 13 50 4 15 60 13 78.16 19.78 15.21 16.90 16.72 14 60 4 20 60 13 74.73 23.59 17.35 14.30 28.52 15 60 3 10 70 13 80.38 20.32 15.05 15.94 20.15 16 60 3 10 60 14 80.57 20.21 14.56 16.02 19.60 17 50 3 15 70 13 79.42 20.32 15.13 17.57 14.86 18 70 3 20 60 13 66.00 25.10 18.00 12.90 36.53 19 60 3 15 50 12 79.67 20.87 15.26 15.50 20.33 20 60 3 20 50 13 78.53 22.04 16.14 14.89 22.95 21 70 3 15 60 14 71.49 24.01 17.30 13.71 31.16 22 60 3 10 60 12 83.57 19.91 14.48 16.24 19.34 23 60 3 20 70 13 79.37 22.83 16.41 14.79 24.54 24 60 3 15 60 13 80.94 21.60 15.46 15.23 23.02 25 70 2 15 60 13 78.01 22.49 16.52 14.95 24.27 26 70 3 15 50 13 71.11 23.17 17.18 13.84 29.21 27 60 3 15 60 13 82.93 22.12 15.41 15.30 21.43 28 60 3 20 60 14 80.49 22.53 16.27 14.82 23.92 29 50 3 15 50 13 78.25 18.95 14.29 18.01 14.59 30 60 4 10 60 13 78.84 20.62 16.05 14.87 23.04 31 60 3 15 70 14 79.92 21.91 16.05 15.04 22.18 32 60 4 15 60 14 77.79 22.98 16.24 14.71 25.46 33 60 3 15 50 14 80.41 20.96 15.31 15.48 20.63 34 60 4 15 70 13 76.88 23.22 16.40 14.62 26.30 35 60 2 15 60 14 87.46 20.02 14.59 16.74 17.03 36 50 3 15 60 12 79.49 19.44 14.33 17.83 14.68 37 60 3 15 60 13 81.95 21.60 15.46 15.23 21.41 38 60 2 15 60 12 85.31 19.89 14.43 16.83 16.49 39 70 4 15 60 13 64.70 24.86 17.45 13.17 36.10 40 50 3 20 60 13 79.53 20.57 15.25 17.40 15.18 41 50 2 15 60 13 80.87 19.16 13.56 18.84 14.25 42 60 3 10 50 13 82.26 19.56 14.58 16.41 18.88 43 60 2 15 70 13 84.13 20.69 15.00 16.59 17.37 44 50 3 10 60 13 77.93 18.78 14.06 18.32 13.97 45 60 4 15 60 12 76.89 21.86 16.20 14.75 25.39 46 70 3 10 60 13 75.50 21.83 17.09 14.52 27.07 A, soaking temperature (°C); B, soaking time (h); C, steaming time (min); D, drying temperature (°C); E, drying time (h); YLD, yield (%); b*, b-value (yellowness/blueness); CT, cooking time (min); CL, cooking loss (%); HRD, hardness (N). The optimal values obtained by RSM for soaking temperature, soaking time, steaming time, drying temperature, and drying time were 59.9 °C, 2 h, 13.4 min, 54.4 °C, and 13.3 h, respectively, with a composite desirability of 0.955. Yield, cooking time, cooking loss, and hardness were significantly affected by steaming time, soaking time, soaking temperature, and drying temperature. In contrast, the b-value was significantly affected by all five processing variables. The quadratic model was found to be significant at p < 0.001, with R2 values of 0.986 for yield, 0.983 for b-value, 0.979 for cooking time, 0.995 for cooking loss, and 0.984 for hardness. The lack of fit was nonsignificant for the response variables, which suggests a model with a good fit (Table 2).
Table 2. ANOVA for response variables.
Source of variation DF SS MS F-value Significant
model termsY1 Model 20 987.01 49.350 87.84*** Linear 5 555.24 111.048 197.65*** A***, B***, C*** Square 5 357.72 71.543 127.34*** A2 ***, C2 ***, D2 *** Interactions 10 74.05 7.405 13.18*** AB***, AC***, CE** Lack-of-fit 20 9.41 0.470 0.51 ns Pure error 5 4.64 0.928 Total 45 1001.05 Goodness-of-fit R2 = 0.986,
Adj. R2 = 0.974Y2 Model 20 116.769 5.8384 73.41*** Linear 5 113.453 22.6906 285.29*** A***, B***, C***, D***, E* Square 5 1.680 0.3360 4.22** A2*, B2*, C2* Interactions 10 1.636 0.1636 2.06 ns AB**, AC* Lack-of-fit 20 1.560 0.0780 0.91 ns Pure error 5 0.428 0.0856 Total 45 118.757 Goodness-of-fit R2 = 0.983,
Adj. R2 = 0.969Y3 Model 20 51.9195 2.5960 59.93*** Linear 5 49.1806 9.8361 227.08*** A***, B***, C***, D*** Square 5 2.3532 0.4706 10.87*** A2***, C2* Interactions 10 0.3858 0.0386 0.89 ns Lack-of-fit 20 0.9958 0.0498 2.86 ns Pure error 5 0.0871 0.0174 Total 45 53.0024 Goodness-of-fit R2 = 0.979,
Adj. R2 = 0.963Y4 Model 20 89.6167 4.4808 280.52*** Linear 5 87.2936 17.4587 1092.9*** A***, B***, C***, D*** Square 5 2.0048 0.4010 25.10*** A2***, B2***, C2* Interactions 10 0.3184 0.0318 1.99 ns AC*, BC* Lack-of-fit 20 0.3616 0.0181 2.40 ns Pure error 5 0.0377 0.0075 Total 45 90.0161 Goodness-of-fit R2 = 0.995,
Adj. R2 = 0.992Y5 Model 20 1525.73 76.29 79.61*** Linear 5 1443.87 288.77 301.37*** A***, B***, C***, D*** Square 5 34.61 6.92 7.22*** A2**, B2*, D2* Interactions 10 47.26 4.73 4.93*** AB***, AC***, BD* Lack-of-fit 20 20.54 1.03 1.50 ns Pure error 5 3.41 0.68 Total 45 1549.69 Goodness-of-fit R2 = 0.984,
Adj. R2 = 0.972Y1, yield; Y2, b-value; Y3, cooking time; Y4, cooking loss; Y5, hardness; DF, degrees of freedom; SS, sum of squares; MS, mean square; Adj., adjusted. * Significant at p < 0.05; **significant at p < 0.01; *** significant at p < 0.001; ns = not significant. A, soaking temperature (°C); B, soaking time (h); C, steaming time (min); D, drying temperature (°C); E, drying time (h). The regression equations for responses in terms of coded factors are as follows:
$\begin{split}\rm Y_1=\;&\rm -316.8 + 9.53A + 17.48B + 0.22C - 0.06A^2- 0.05C^2\,-\\& \rm 0.01D^2- 0.27AB - 0.06AC + 0.29CE \end{split}$ (9) $\begin{split}\rm Y_2 =\;&\rm -7.6 - 0.18A - 4.32B + 0.05C + 0.26D + 3.20E + 0.002A^2 \,-\\&\rm 0.21B^2 - 0.01C^2 + 0.04AB + 0.01AC \end{split}$ (10) $\rm Y_3 = 10 - 0.21A + 3.03B + 0.08C - 0.11D + 0.005A^2 + 0.01C^2 $ (11) $\begin{split}\rm Y_4 = \;& \rm 69.9 -0.69A -4.34B -0.39C -0.14D + 0.004A^2\, +\\&\rm 0.35B^2 + 0.005C^2 -0.004AC + 0.03BC \end{split}$ (12) $\begin{split}\rm Y_5 =\;&\rm 20.9 - 2.83A + 1.38B - 2.66C + 0.75D + 0.01A^2 - 0.76B^2 -\\&\rm 0.01D^2 + 0.23AB + 0.04AC - 0.11BD \end{split}$ (13) where, Y1 is yield, Y2 is b-value, Y3 is cooking time, Y4 is cooking loss, Y5 is hardness, A is soaking temperature (°C), B is soaking time (h), C is steaming time (min), D is drying temperature (°C), and E is drying time (h).
Experimental validation
-
The predicted yield, b-value, cooking time, cooking loss, and hardness under these conditions were 85.90%, 19.70, 14.20 min, 17.00%, and 15.10 N, respectively. The actual values of yield, colour, cooking time, cooking loss, and hardness were 86.72% ± 0.26%, 19.25 ± 0.02, 14.05 ± 0.07 min, 17.25% ± 0.05% and 16.34 ± 0.41 N, respectively, which were comparable with the predicted values. Terras et al.[33] reported 79.9% yield and a b-value of 11.38 when cooking was carried out via the traditional boiling method. Kaplan et al.[7] reported the mean values for the yield of bulgur of 84.80% for autoclave cooking and 87.25% for steam cooking. The mean b-value for autoclave cooking was 17.10, and it was 17.30 for steam cooking[7]. A study conducted by Yilmaz and Koca[3] reported that the optimum cooking time ranged from 13.20 to 16.07 min for bulgur wheat processed using a combination of various cooking methods (boiling, microwaving, and autoclaving) and drying (hot air oven and microwave). Cooking losses of 17.9% and 38.7% have been reported by Cetinar[48] which suggests lower cooking loss in the present study. The hardness of cooked parboiled rice has been reported to range from ~3 to ~37 N[49,50]. A hardness of 1,742.6 g (≈ 17.08 N) has been reported for cooked parboiled rice[51] which is similar to the current findings. The parboiled grains obtained by optimised processing conditions were observed to be intact, comparable with raw wheat, as shown in Fig. 2a, c. The endosperm was fully gelatinised when a cut was made with a surgical blade to monitor the extent of gelatinisation. There was no shrinkage of grains after drying, which generally occurs due to the oozing of starch, which hollows the grain. The overall duration of processing wheat into bulgur was approximately 18 h. This also included the time required for the equipment to reach the desired temperature, depressurisation after steaming, and the transfer of the sample from one stage of operation to another. Bulgur wheat obtained by the optimised processing conditions is shown in Fig. 2d.
Proximate analysis
-
The proximate analysis of moisture, carbohydrate, protein, fat, and ash is presented in Table 3 for raw and bulgur wheat. The moisture content is crucial for maintaining the quality of bulgur wheat and for its further usage in trade. The moisture content in bulgur wheat was not significantly (p > 0.05) lower than that of raw wheat. The general desirable moisture content in bulgur wheat is less than or equal to 10%, which enhances its keeping quality[2,4]. The durum wheat species has been known for its higher protein content[3]. There was no significant (p > 0.05) effect of bulguration on the protein content of bulgur wheat; however,the process of debranning in the industry has been found to significantly decrease the protein content through the peeling of the aleurone layer[4,12]. Köksel & Edney[52] reported contrasting results, where dehulling was found not to significantly decrease the protein content in bulgur made from barley. The processing of wheat into bulgur caused a significant (p < 0.05) reduction in ash and fat content. The loss in the percent of ash in bulgur wheat can be attributed to the loss of bran[8]. Köksel & Edney[52] found that cooking does not significantly decrease ash content; however, dehulling significantly reduces the ash content in bulgur made from barley. The loss of fat could be caused by the redistribution of broken fat globules from the germ and aleurone layer into the cortical layer, which is separated during bran loss. Messia et al.[44] confirmed the presence of a high fat content in by-products obtained from emmer bulgur. There was no significant (p > 0.05) difference in the carbohydrate content of raw and bulgur wheat. The slight increase in percent carbohydrate was caused by losses of moisture, fat, and ash content. The moisture, protein, and ash content in bulgur wheat were according to the standards of WFP (World Food Programme), Turkish Food Codex Communiquè, and the US Department of Agriculture[4,53,54].
Table 3. Nutritional composition of raw and bulgur wheat.
Nutritional parameter Raw wheat Bulgur wheat p-value Proximate analysis (%) Moisture 10.25 ± 0.06 10.05 ± 0.03 0.150 Carbohydrate 72.69 ± 0.17 74.46 ± 0.72 0.670 Protein 13.54 ± 0.21 12.96 ± 0.42 0.253 Fat 1.78 ± 0.07 0.97 ± 0.21 0.025 Ash 1.74 ± 0.06 1.56 ± 0.08 0.025 Water-soluble vitamins (mg/100 g) Thiamine 0.16 ± 0.03 0.07 ± 0.01 0.037 Riboflavin 1.80 ± 0.06 1.61 ± 0.04 0.079 Niacin 17.67 ± 0.03 2.08 ± 0.02 0.000 Pyridoxine 0.13 ± 0.01 0.05 ± 0.02 0.002 Pantothenic acid 0.67 ± 0.03 0.17 ± 0.01 0.001 Minerals (mg/100 g) Calcium 68.58 ± 0.79 62.10 ± 1.56 0.031 Magnesium 181.71 ± 3.20 171.69 ± 3.80 0.129 Potassium 718.98 ± 19.66 644.61 ± 15.38 0.001 Phosphorus 508.96 ± 3.19 499.91 ± 1.60 0.082 Iron 5.65 ± 0.38 5.15 ± 0.16 0.247 Sodium 8.15 ± 1.04 2.30 ± 0.96 0.017 Manganese 4.55 ± 0.13 3.89 ± 0.21 0.006 Zinc 5.78 ± 0.13 4.63 ± 0.11 0.012 *p < 0.05 indicates a significant difference between samples. Water-soluble vitamins
-
The underlying mechanisms involved in producing bulgur wheat prompted the evaluation of water-soluble vitamins. A significant decrease (p < 0.05) was observed in B vitamins, except for riboflavin, when raw wheat was subjected to the process of bulguration (Table 3). Among the B vitamins, riboflavin exhibits relatively higher thermal stability and lower water solubility[55], which could be attributed to its nonsignificant (p > 0.05) reduction in bulgur wheat. The loss of the water-soluble vitamins in the current study was higher than the loss reported by Kadakal et al.[43]. The loss of vitamins could be a result of heat deterioration or leaching of the vitamins, as well as partial debranning. Thiamine has been reported to be destroyed by heat, whereas riboflavin has been found to be highly susceptible to sun-drying instead of oven-drying[56]. Drying at over 60 °C has been observed to increase vitamin losses[43]. The retention of water-soluble vitamins in bulgur greatly depends upon the processing techniques used for its production[19]. Though bulguration causes a reduction in B vitamins, a significant amount is retained due to incomplete removal of the aleurone layer and germ, and the diffusion of vitamins into the grain[31,43]. In the current study, the highest loss was observed for niacin and the lowest for riboflavin. The percent loss of thiamine and riboflavin in bulgur wheat was 56.25% and 10.56%, respectively, which were lower than the losses reported earlier for parboiled rice. The parboiling of rice, executed by various techniques, has been reported to cause a reduction in thiamine of approximately 48.8%–67.5%; for riboflavin, it can range from 31.9% to 49%. The structure of the grain also affects vitamin loss; a loose structure, due to less amylose, has been associated with higher vitamin loss. The complex structure of durum wheat has also been reported to be responsible for higher retention of water-soluble vitamins[19].
Mineral analysis
-
Minerals are essential components that the human body does not naturally synthesise and must be obtained from external sources. Calcium, magnesium, potassium, sodium, and phosphorus constitute five major minerals required in the human body[57]. In the current study, bulguration led to a significant reduction in mineral content, except for magnesium, phosphorus, and iron (Table 3). The percentage loss of calcium, iron, magnesium, potassium, sodium, manganese, phosphorus, and zinc in bulgur wheat was 9.45%, 8.85%, 5.51%, 10.34%, 71.77%, 14.44%, 1.78%, and 20%, respectively. The highest loss was observed for sodium and the lowest for phosphorus in bulgur wheat. The reduction in minerals has also been reported by Singh & Dodda[31] in bulgur made from triticale. Legume-based bulgur, made by pressure cooking and oven drying, has been observed to decrease the levels of calcium, iron, potassium, magnesium, phosphorus, and zinc[58]. A study conducted by Evlice & Özkaya[19] reported a total phosphorus content for various types of durum bulgur ranging from 272.2 to 320.0 mg/100 g. The mean values and ranges of calcium, iron, potassium, magnesium, manganese, and zinc in 12 industrial bulgur wheat samples reported by Ertaş[4] were found to be lower, but those of sodium were higher, compared with the current study. A higher content of minerals compared with industrial bulgur wheat samples could be caused by partial debranning of the parboiled wheat. A higher loss of sodium could be caused by the combined effect of leaching and partial debranning. Minerals such as phosphorus, iron, and zinc are higher in bulgur wheat than rice[12]. Wheat-based products made from refined wheat flour lack trace and macroelements; therefore, bulgur wheat could be a better alternative to fulfill daily micronutrient requirements[41].
X-ray diffraction analysis
-
The X-rays from cathode ray tubes generate a diffraction pattern which is utilised in analyses of the long-range crystalline order of starch and its structural rearrangement due to processing[59]. The X-ray diffraction plots for raw and bulgur wheat are given in Fig. 3. In raw wheat, strong peaks were observed at 2θ = 14.8, 17.2, 17.8, 19.8, and 22.4, which are close to the typical A-type crystalline structure found in cereal starches. The degree of crystallinity for raw wheat was found to be 26.80%, whereas in bulgur wheat, it was 10.20%. The decrease in crystallinity suggests a reduction in the crystalline region and an increase in the amorphous region in bulgur wheat[60]. The degree of crystallinity for gelatinised wheat starch has been reported to range from 5% to 11%, depending on the severity of processing[23,61,62]. These changes induced by bulguration could be due to the meltdown of the crystalline structure at higher temperatures as a consequence of the destruction of hydrogen bonding. The loss of the A-type diffraction pattern in bulgur wheat can be observed in Fig. 3, where diminished peaks can be noted. The appearance of B-type X-ray diffraction patterns at 2θ = 17.1 and V-type X-ray diffraction patterns at 2θ = 13.2 and 19.8 was also observed in bulgur wheat[62,63]. Notably, the sharpening of the peak at 2θ = 19.8 in bulgur wheat suggests the formation of a complex due to the interaction of starch, protein, and fatty acid molecules as a result of processing[64]. The presence of both B-type and V-type patterns suggests the occurrence of retrogradation in the starch of bulgur wheat[65]. The process of parboiling gelatinises and retrogrades the starch molecules, thereby decreasing crystallinity and forming an amylose–lipid complex[66].
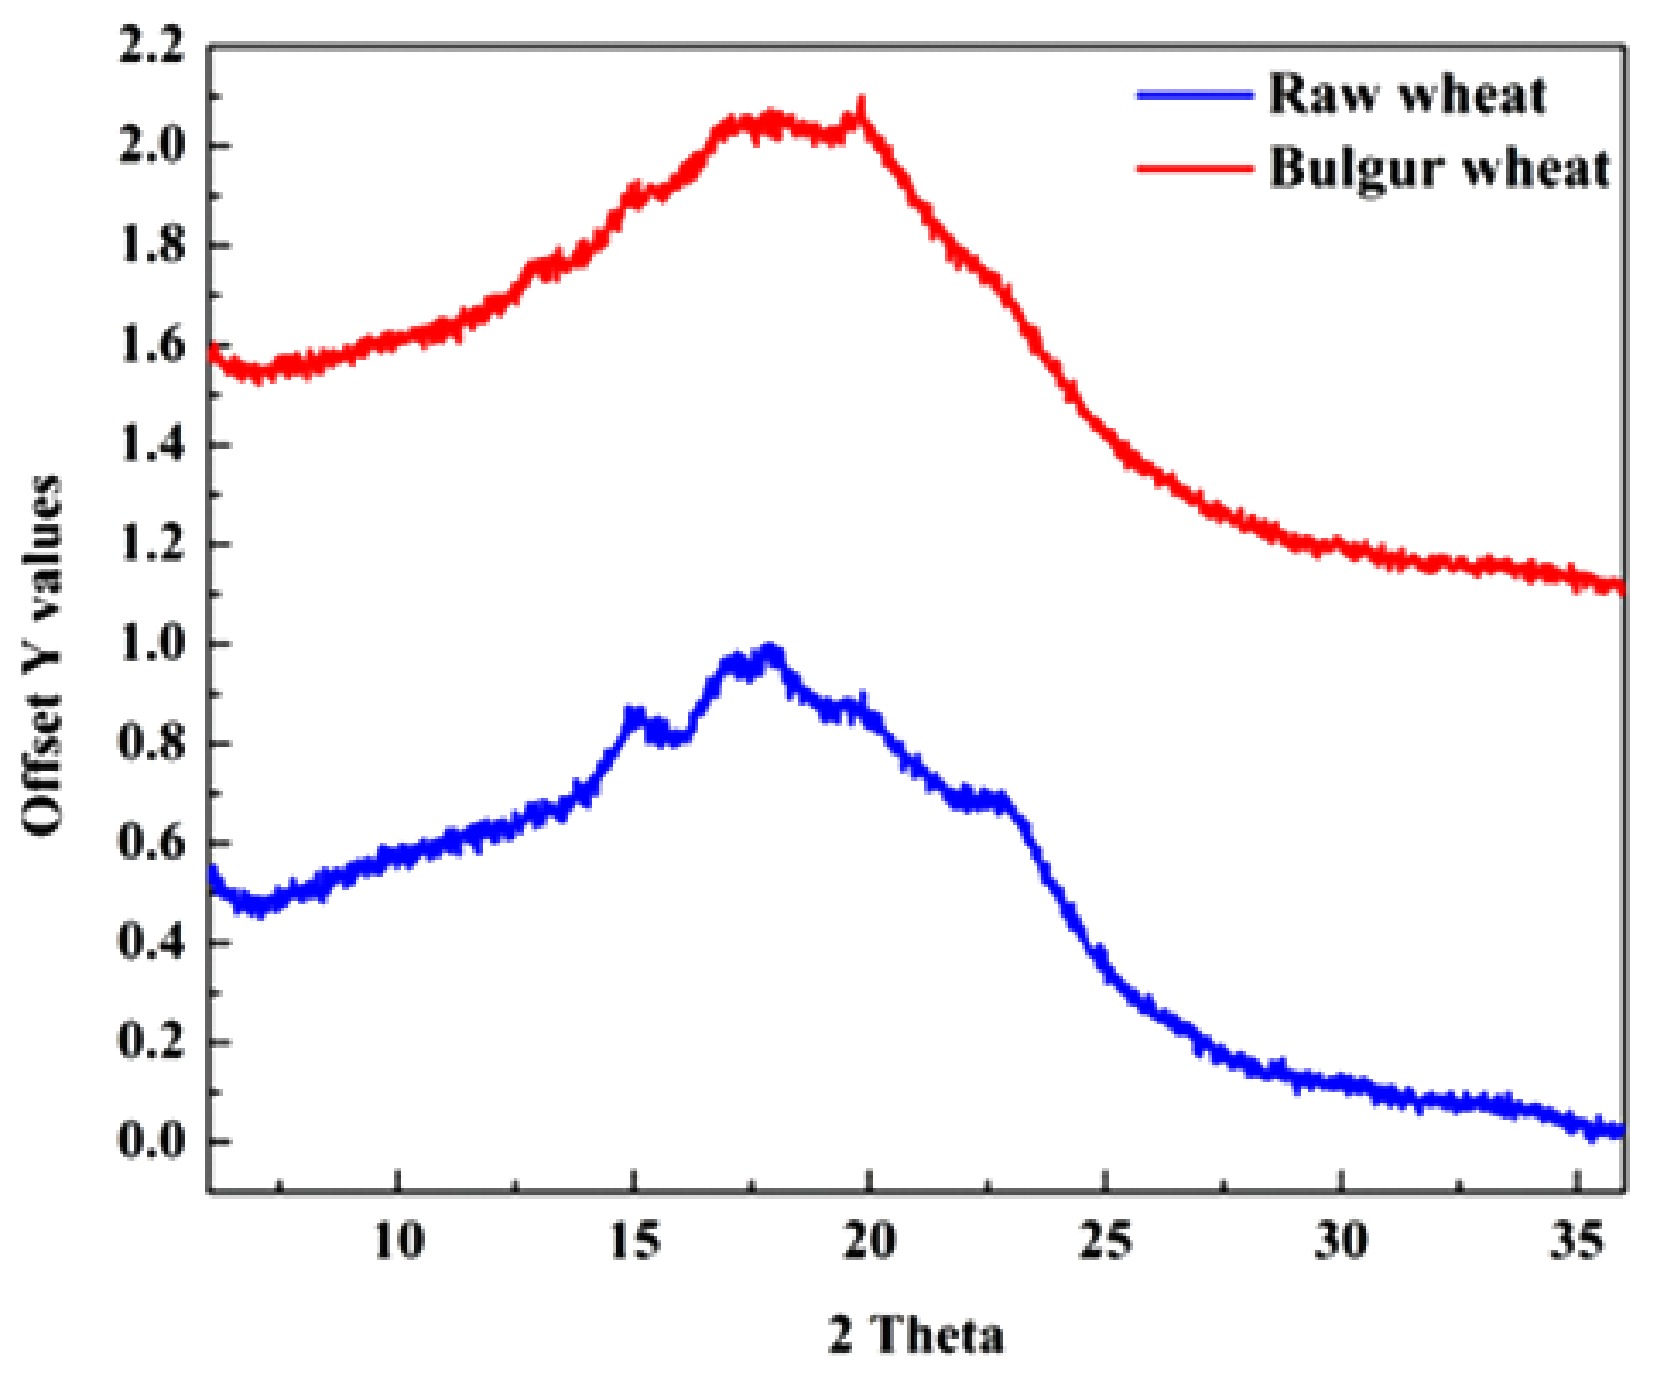
Figure 3.
X-ray diffraction plot of raw and bulgur wheat.
FTIR analysis
-
FTIR (Fourier transform infrared spectroscopy) analysis was conducted for raw and bulgur wheat to understand the effect of bulguration on conformational changes in the proteins. Protein exhibits three typical amide regions, centred at 1,650 cm−1 (the Amide I region), 1,540 cm−1 (the Amide II region), and 1,455 cm−1 (the Amide III region). The major peaks present in proteins, consisting of functional groups and amide bond vibrations, are located in the Amide I and Amide II regions. However, there is an issue of uncertainty in the conformational analysis in the Amide II region due to impurities. Therefore, the Amide I region was considered in the present study to analyse conformational changes in the secondary structure[67].
The FTIR spectra shown in Fig. 4a depict the Amide I region marked at 1,656 cm−1 for raw wheat and 1,655 cm−1 for bulgur wheat. The Amide I region consists of multiple overlapping peaks of secondary protein structures, constituted of β-sheets (1,613−1,615 cm−1 hydrogen bonds, 1,629−1,637 cm−1 antiparallel, and 1,679−1,684 cm−1), random coils (1,637−1,645 cm−1), α-helices (1,645−1,660 cm−1), and β-turns (1,660−1,675 cm−1 and 1,693−1,699 cm−1)[68].
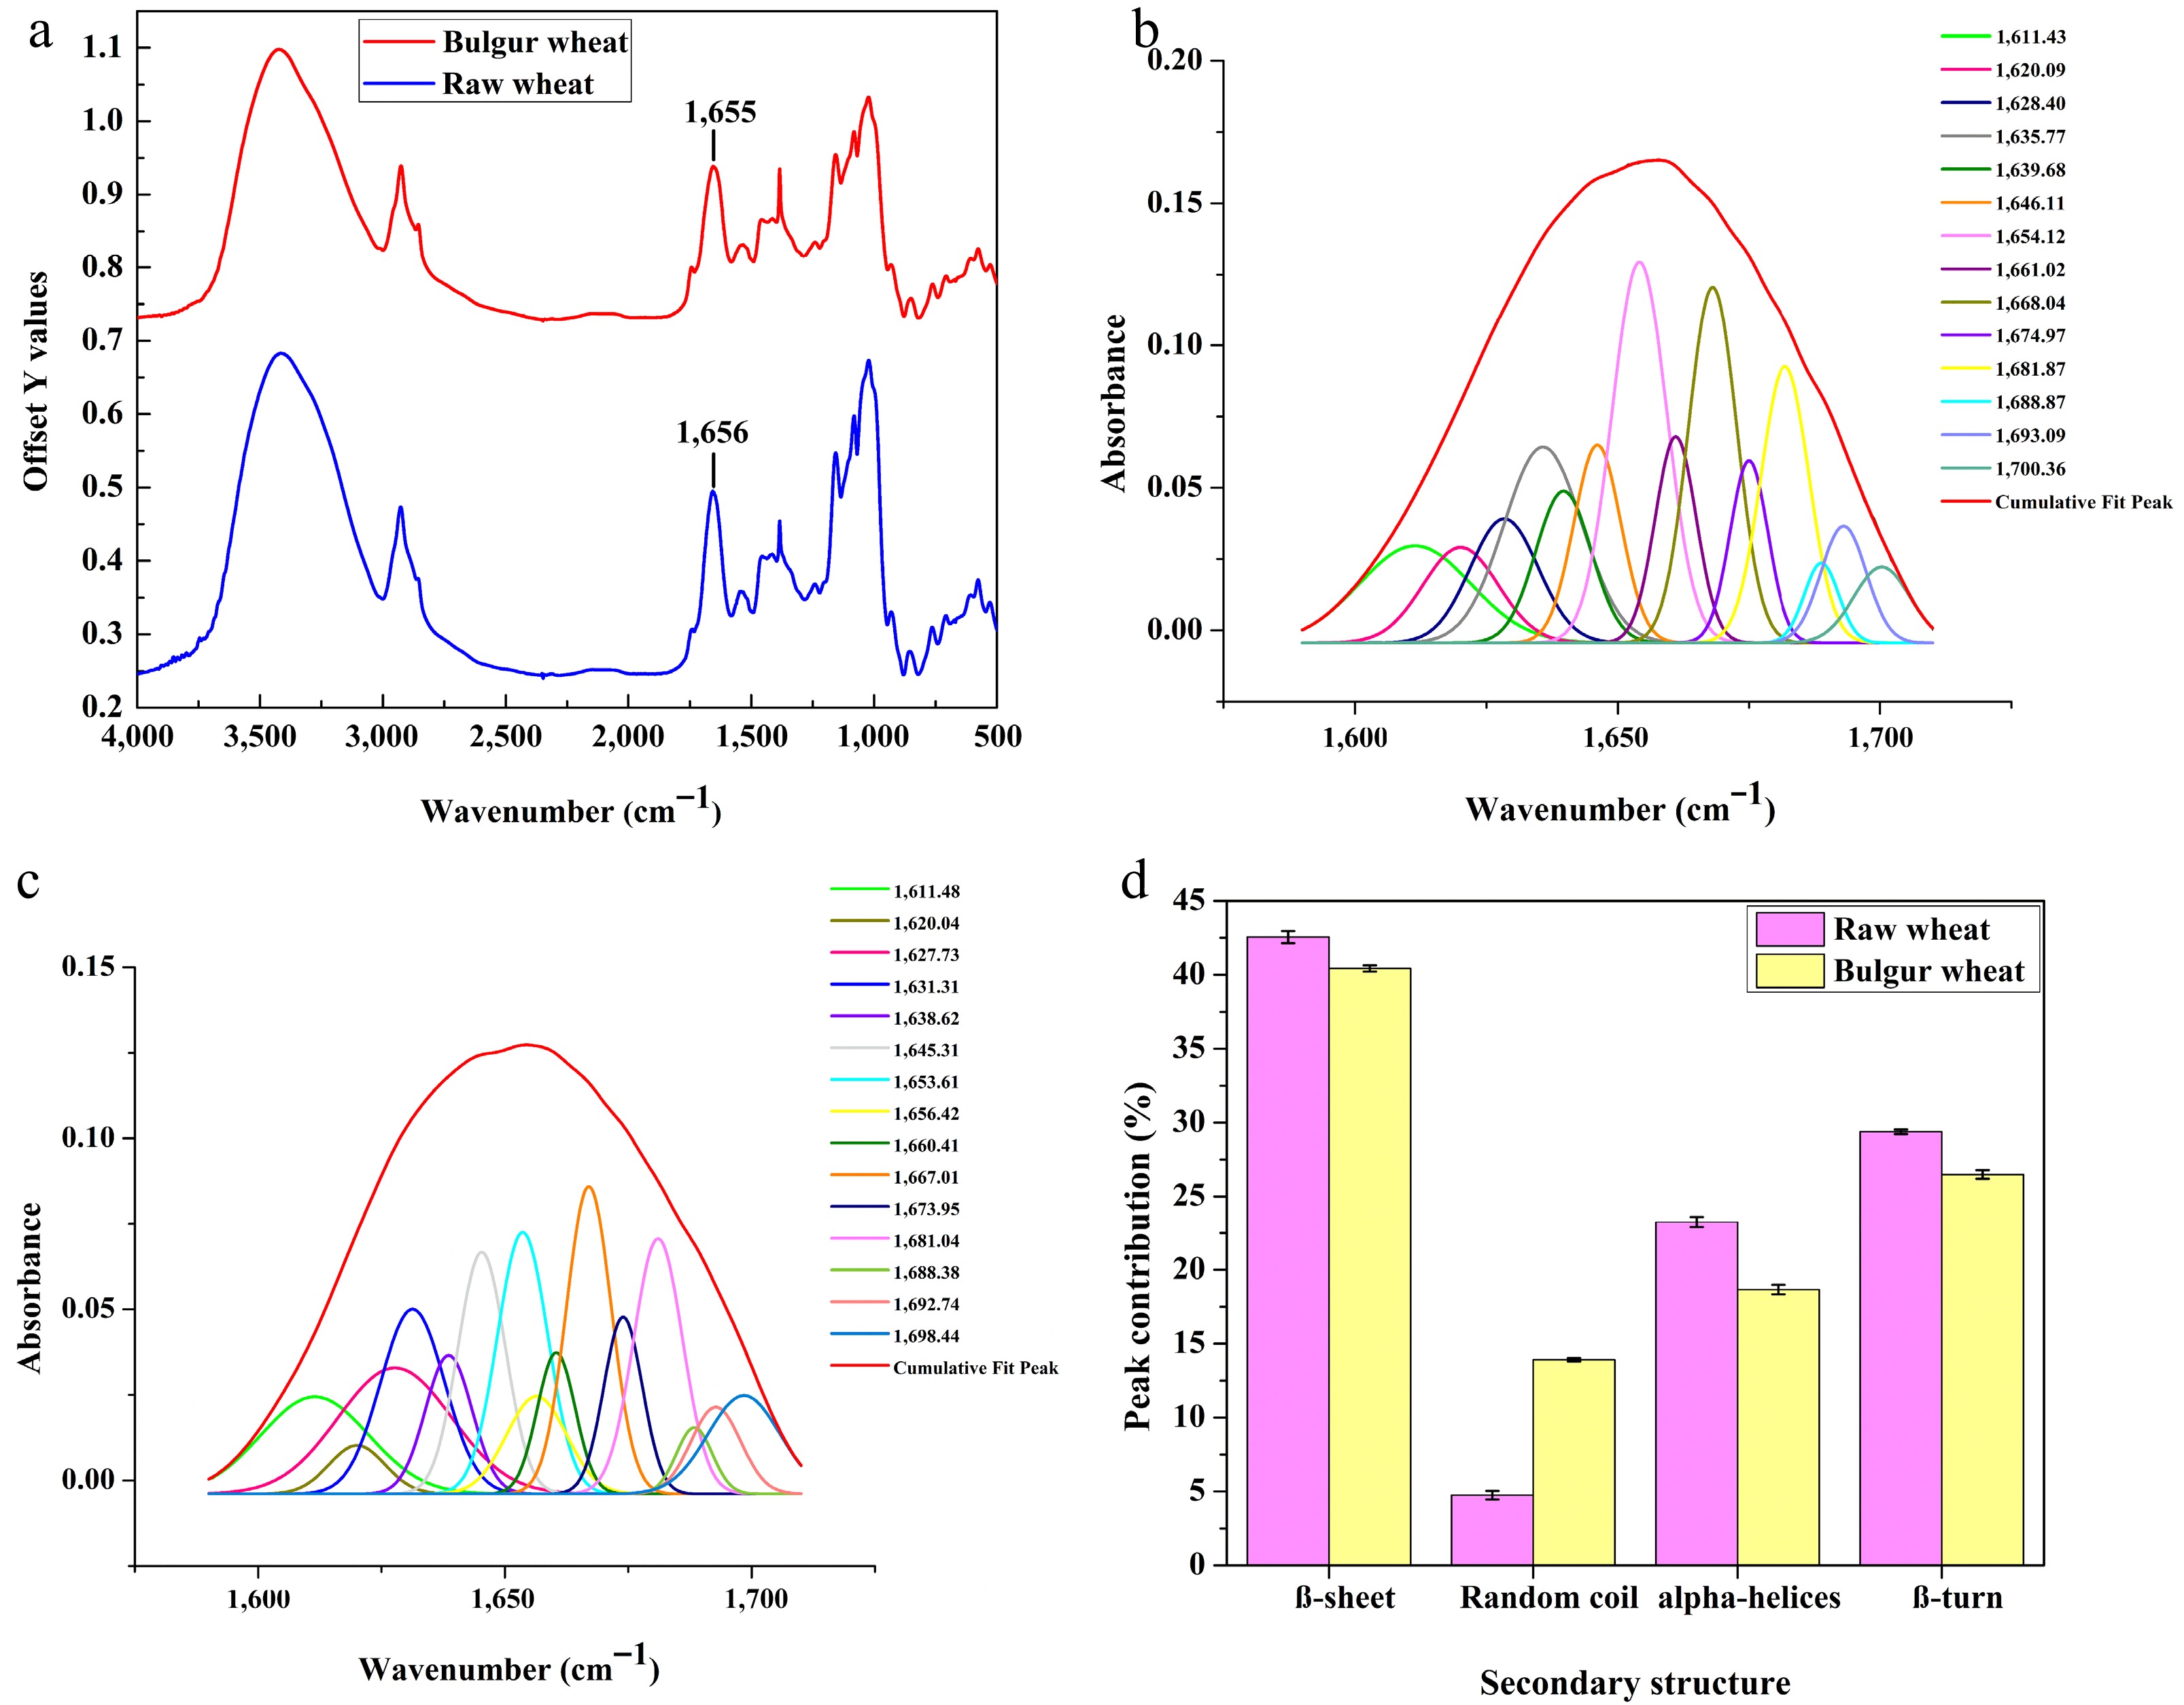
Figure 4.
(a) FTIR spectra of raw and bulgur wheat. (b) Conformational peak in the Amide I region of raw wheat. (c) Conformational peak in the Amide I region of bulgur wheat. (d) Secondary structure peak contribution of raw and bulgur wheat (in %).
The overlapping hidden peaks in the Amide I region were identified using Origin Pro software, and the peaks were fitted with a Gaussian function, as shown in Fig. 4b, c to calculate the peak contributions, as presented in Fig. 4d[23]. It can be observed from Fig. 4b, c that bulguration affects the secondary structure, as the intensity of the peaks was altered. The primary and secondary structures observed in raw wheat were β-sheets and β-turns, followed by α-helices. Kumar et al.[67] also reported β-sheets to be the highest contributor in the secondary structure of wheat flour. The lowest percentage was found for random coils (4.75%) in raw wheat, which was observed to increase significantly (p < 0.5) in bulgur wheat (13.91%), which could be due to the protein unfolding as a result of hydrothermal processing. The decrease in β-sheets, α-helices, and β-turns in bulgur flour was significant (p < 0.5), which is a desirable outcome, as β-conformations have been reported to be negatively correlated with proteins' digestibility. In contrast, unordered structures, such as random coils, have been positively correlated with digestibility[23,69].
Surface morphology
-
SEM images of raw and bulgur wheat are shown in Fig. 5a, b. The width can be observed to increase in bulgur wheat as the crease is stretched. The bran and crease have a protective effect on length rather than width during the hot soaking of grains, in which starch swells through absorbing water, thus resulting in increased width[14]. The starch granules and protein matrix can be observed distinctly in raw wheat, but these separate structures cannot be observed for bulgur wheat; instead, a fused and compact structure is perceived. When wheat grain is processed hydrothermally, the water diffuses into the grain; the starch granules swell, flatten, twist, and gelatinise upon absorbing the water; and the protein undergoes denaturation. These changes form a complex between starch and protein, due to which, the boundary or structure of starch is not visible in bulgur wheat[41].
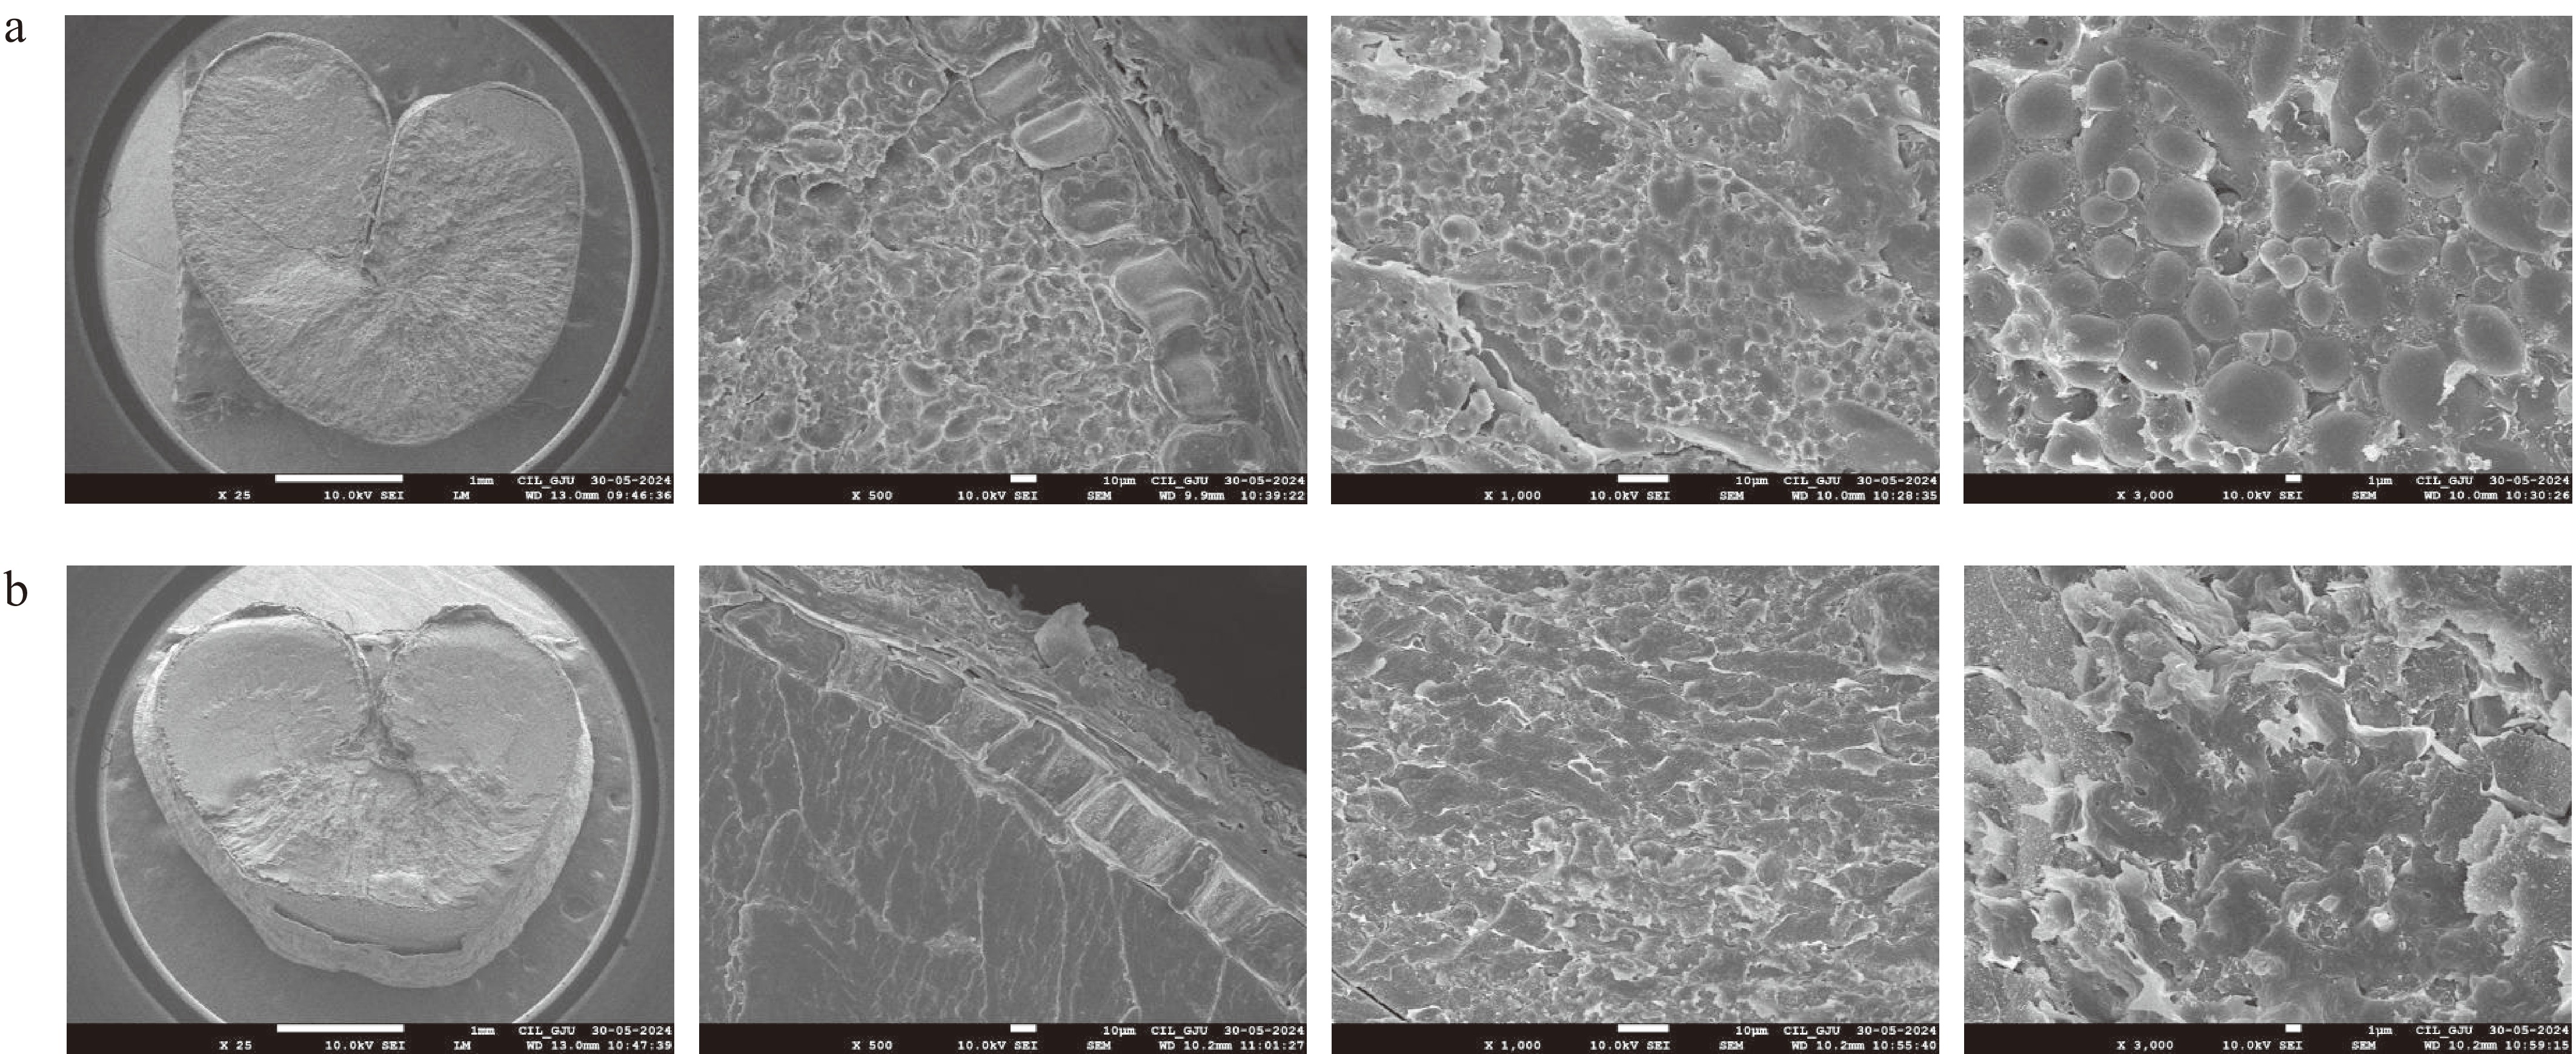
Figure 5.
Scanning electron microscopy images of (a) raw and (b) bulgur wheat.
-
The processing conditions during the preparation of bulgur wheat showed a prominent effect on its quality. Soaking temperature and time were found to be crucial for the hydration of the grain, which is necessary for proper starch gelatinisation. It was observed that higher soaking temperatures and times, along with prolonged steaming, resulted in disintegrated grains and a low yield. Lower soaking temperatures and times resulted in ungelatinised starch at the core of the grains. Drying conditions affect the hardness and colour of the grain. The processing conditions reported previously in the literature are primarily based on wheat cultivated in the region of the Middle East, a conventional bulgur wheat region. The bulgur wheat prepared under optimised processing conditions resulted in properly gelatinised endosperm. The grains obtained after soaking and steaming showed no deformation or oozing of starch, and there was no shrinkage after drying. Overall, bulgur wheat exhibited acceptable yield, colour, cooking time, cooking loss, and hardness. These characteristics together demonstrate the efficiency of optimised conditions to make bulgur wheat.
The processing of wheat into bulgur affects the minerals, water-soluble vitamin composition, and structural properties. Some micronutrients, such as riboflavin, magnesium, phosphorus, and iron, were reduced, but with no significant difference. Future studies may focus on the retention of water-soluble vitamins by utilising novel techniques. The gelatinisation of starch resulted in a decrease in the degree of crystallinity in bulgur wheat, characterised by the occurrence of B-type and V-type diffraction patterns, and the loss of the A-type diffraction pattern. The percentage of secondary protein structures, including β-sheets, α-helices, and β-turns, decreased, while unordered structures, such as random coils, increased, facilitating protein digestion.
-
The authors confirm their contributions to the paper as follows: study conception and design: Tomar D, Khatkar BS; data collection, analysis, and interpretation of results: Tomar D; writing—original draft preparation: Tomar D; writing—review and editing: Tomar D, Malik M, Kumar A, Khatkar BS; supervision: Khatkar BS; resources: Malik M, Kumar A. All authors reviewed the results and approved the final version of the manuscript.
-
The data that support the findings of this study are available on request from the corresponding author.
-
Authors are grateful to the ICAR (Indian Agricultural Research Institute), Regional Station, Indore, India, for providing the wheat variety.
-
The authors declare that they have no conflict of interest.
- Copyright: © 2025 by the author(s). Published by Maximum Academic Press on behalf of Nanjing Agricultural University. This article is an open access article distributed under Creative Commons Attribution License (CC BY 4.0), visit https://creativecommons.org/licenses/by/4.0/.
-
About this article
Cite this article
Tomar D, Malik M, Kumar A, Khatkar BS. 2025. Optimisation of processing conditions and characterisation of structural and nutritional changes in bulgur wheat. Food Materials Research 5: e016 doi: 10.48130/fmr-0025-0015 

Optimisation of processing conditions and characterisation of structural and nutritional changes in bulgur wheat
- Received: 19 May 2025
- Revised: 12 July 2025
- Accepted: 13 August 2025
- Published online: 29 September 2025
Abstract: Bulgur wheat is a nutritious, affordable, and staple food suitable for all socioeconomic groups. However, there are no standardised processing conditions for its production. Therefore, this study was conducted to optimise the processing conditions to produce bulgur wheat by incorporating independent variables (soaking temperature, soaking time, steaming time, drying temperature, and drying time) and responses (yield, colour, cooking time, cooking loss, and hardness) which were not collectively considered in previous studies. The optimised processing conditions for soaking temperature, soaking time, steaming time, drying temperature, and drying time were 59.9 °C, 2 h, 13.4 min, 54.4 °C, and 13.3 h, respectively. The characterisation of nutritional composition revealed that the loss of protein was nonsignificant (p > 0.05) while the loss of fat was significant (p < 0.05). Although there were losses of water-soluble vitamins and minerals, substantial levels of these micronutrients were retained in bulgur wheat. The percent degree of crystallinity decreased with the loss of the A-type diffraction pattern in bulgur wheat. The conformational peaks in the Amide I region of bulgur wheat demonstrated a decrease in β-conformations and α-helices, and an increase in unordered structure. The study emphasises the understanding of the interrelation between processing conditions and characteristics of bulgur wheat. The desirable quality characteristics of bulgur wheat observed in the current study support the operational efficiency of the optimised processing conditions.
-
Key words:
- Optimisation /
- Bulgur wheat /
- Durum bulgur /
- Nutrition /
- Structural characterisation