-
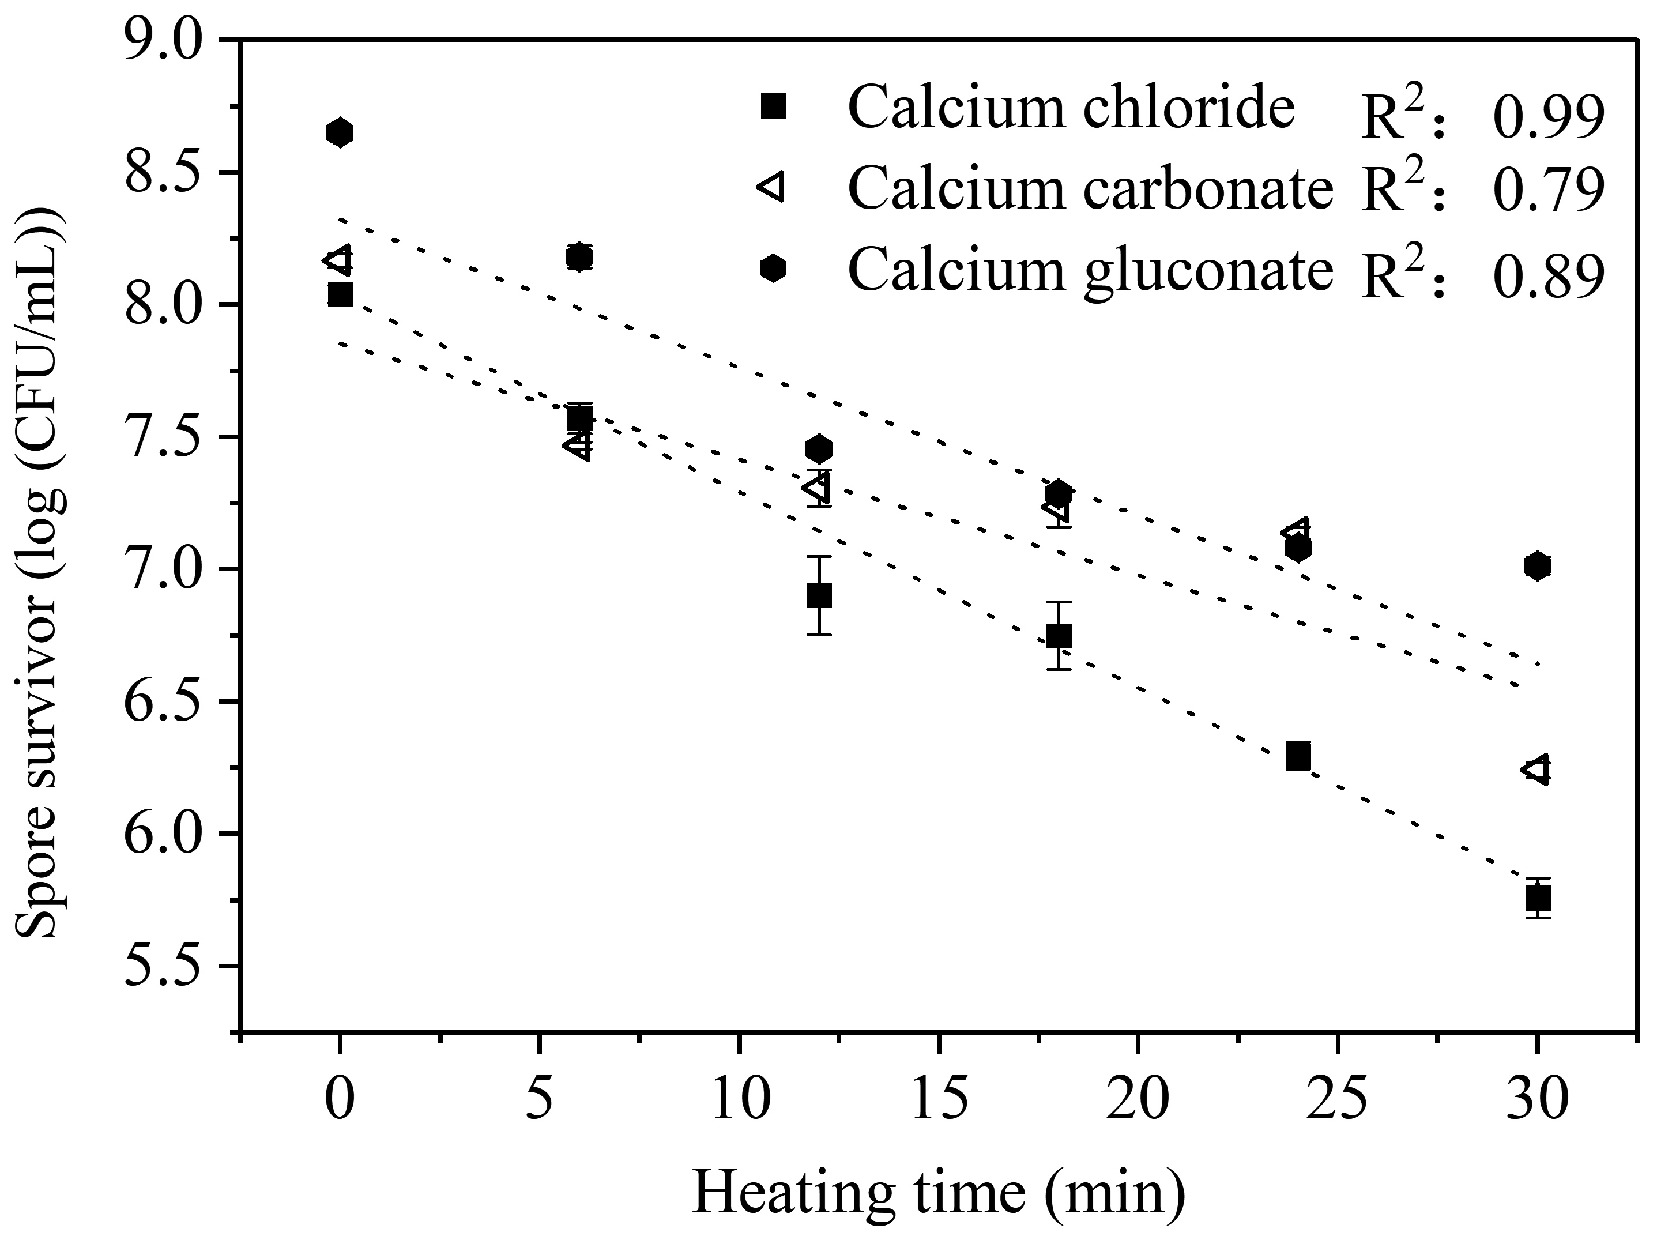
Figure 1.
Survival curves of C. sporogenes spores produced in sporulation media with different calcium salts at 90 °C.
-
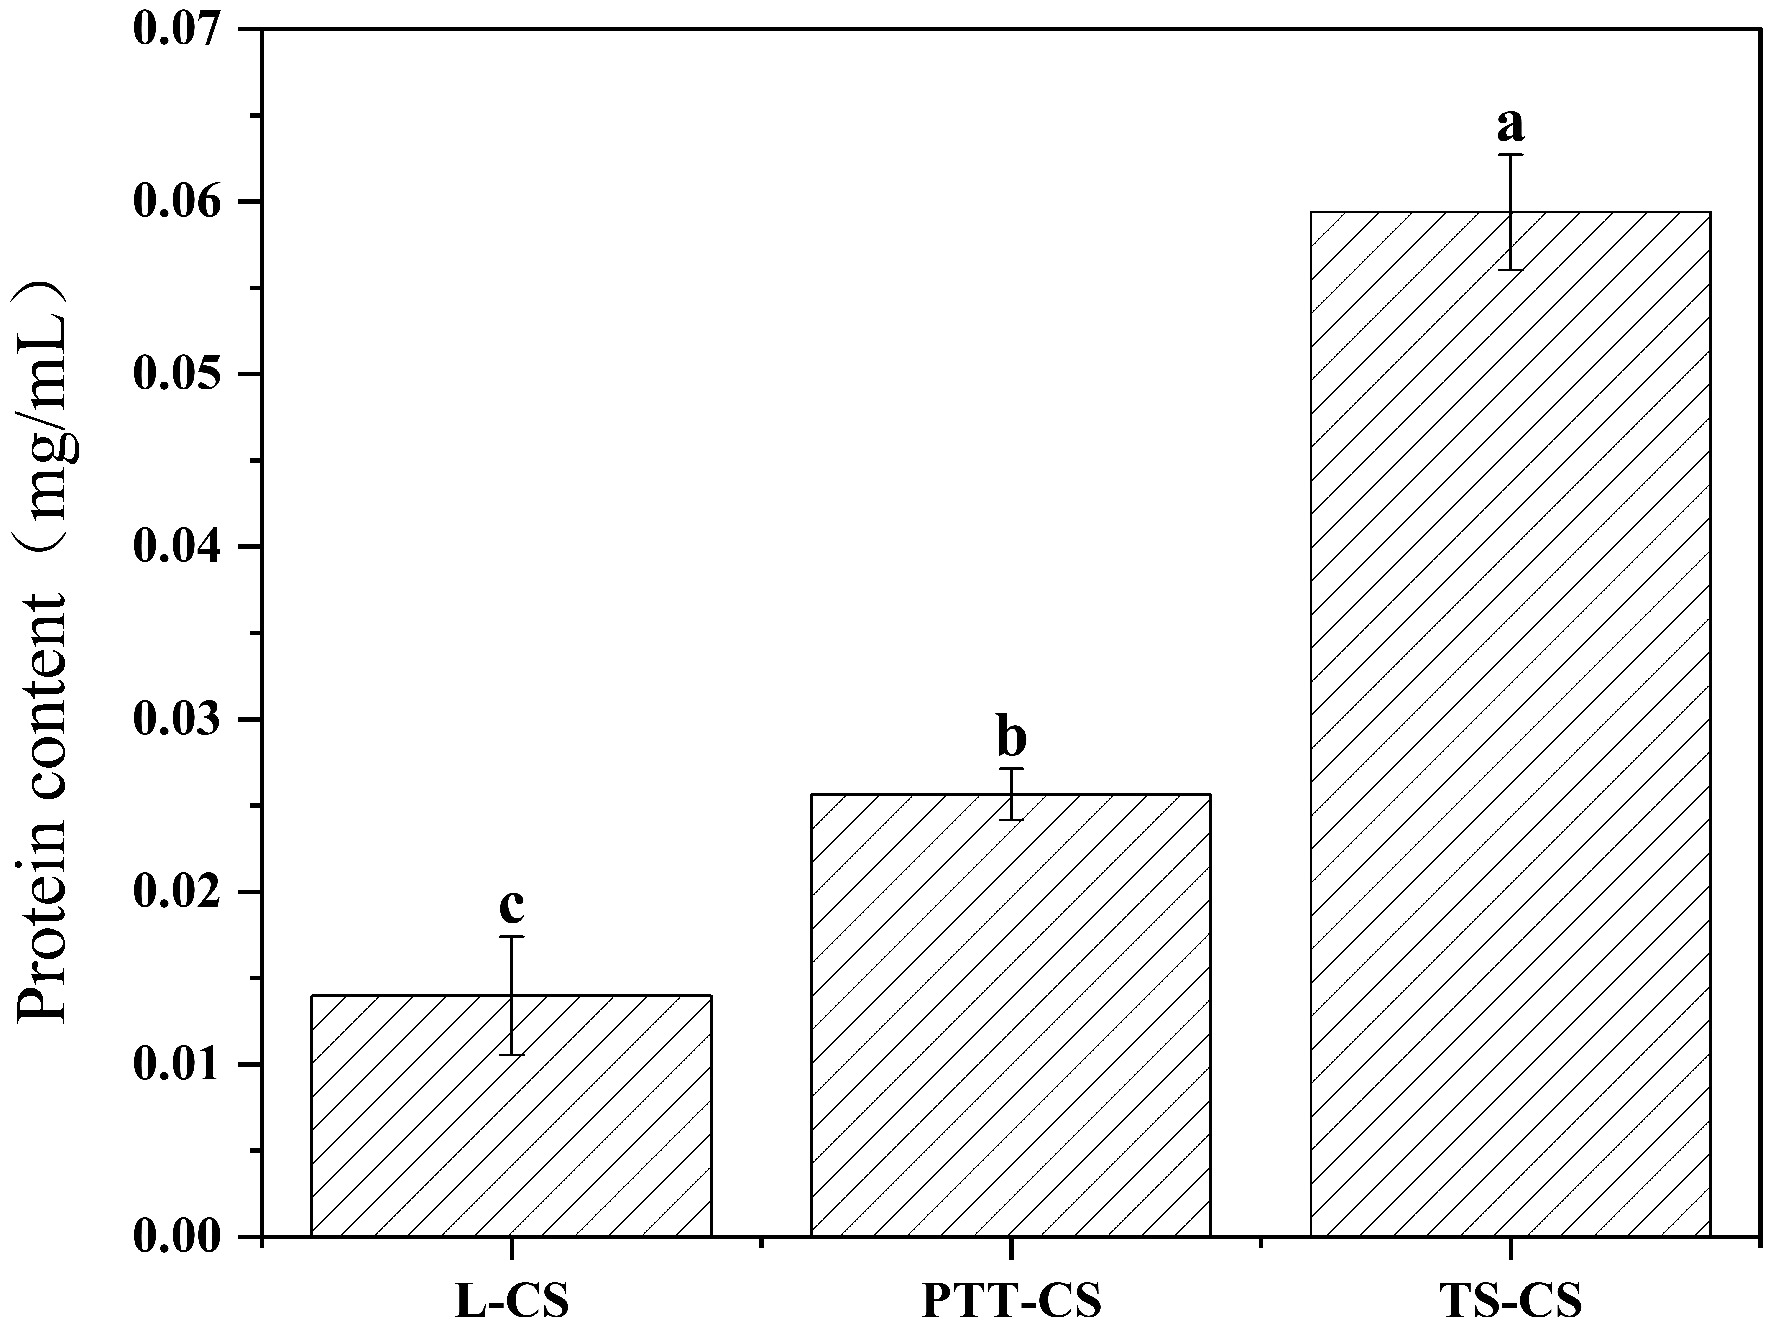
Figure 2.
The protein content of C. sporogenes spores produced in sporulation media with different calcium salts. L-CS: spores produced in calcium chloride medium; PTT-CS: spores produced in calcium gluconate medium; TS-CS: spores produced in calcium carbonate medium. Different letters indicate the significant differences in the protein content among different spores under (p < 0.05).
-
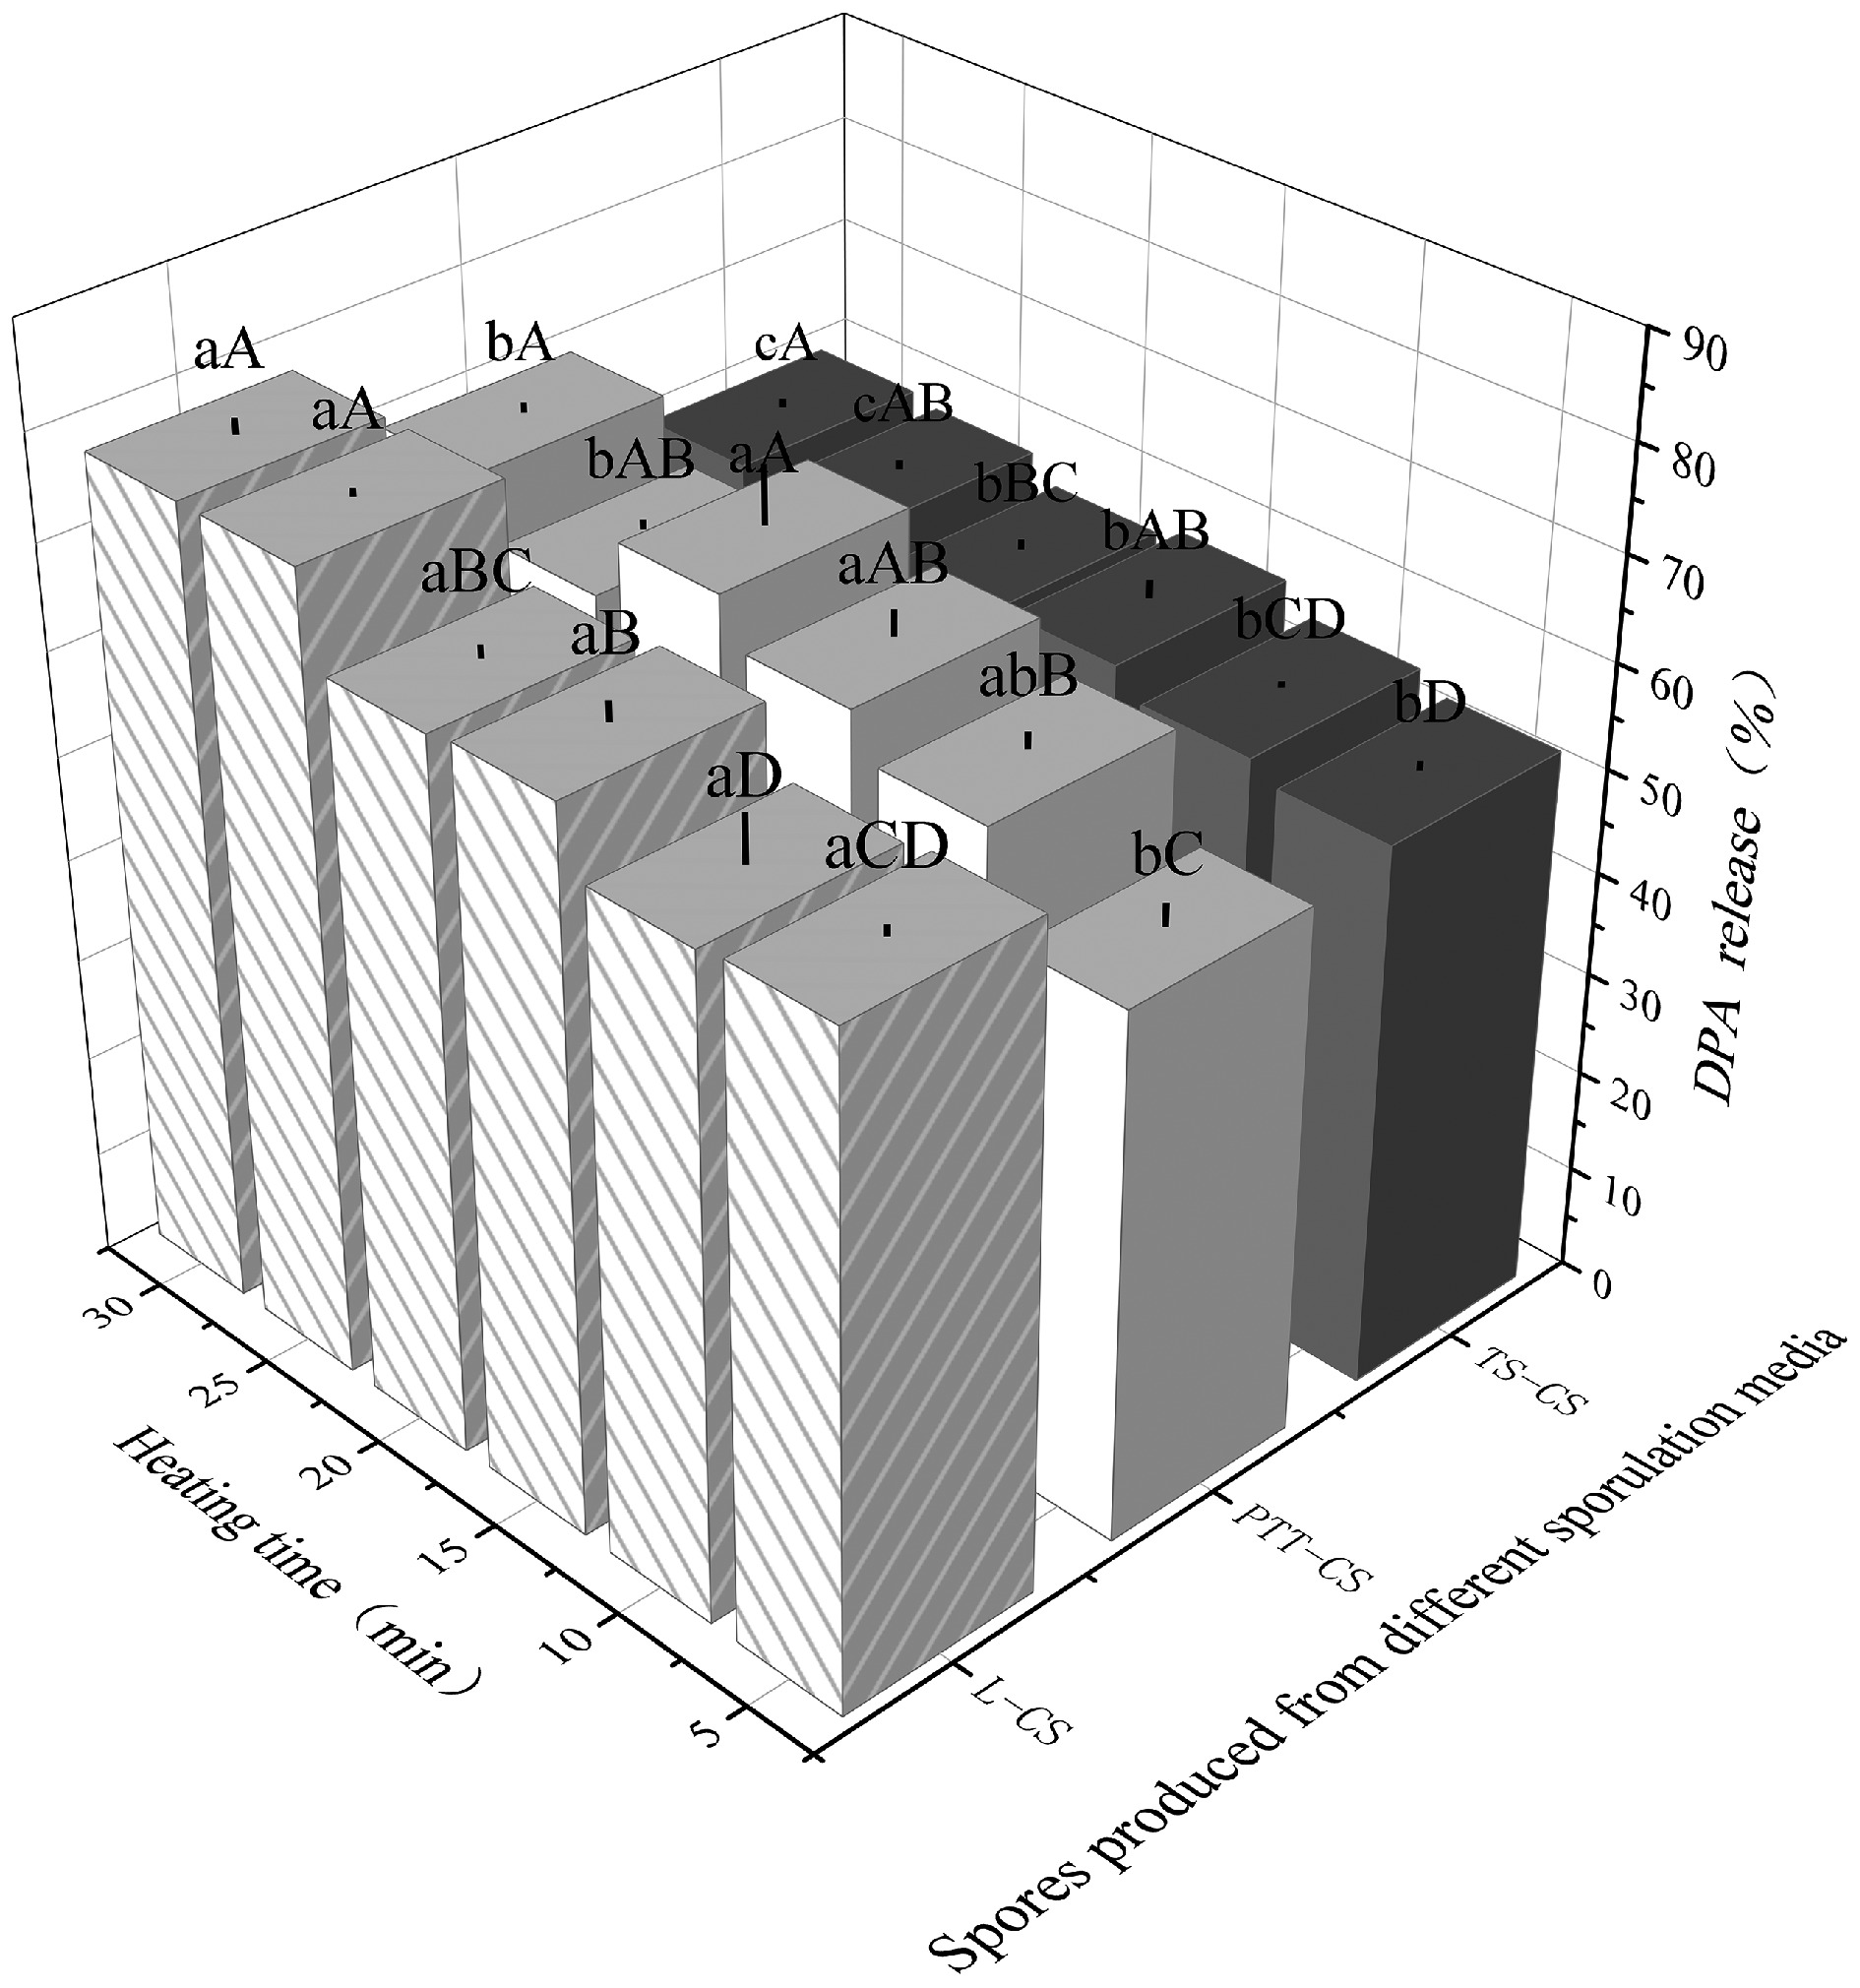
Figure 3.
The DPA release of C. sporogenes spores produced by sporulation media with different calcium salts under heating (90 °C). Capital letters indicate significant differences in the DPA release of the same spores under different heating times, and lowercase letters indicate significant differences in the DPA release among different spores under the same heat treatment condition.
-
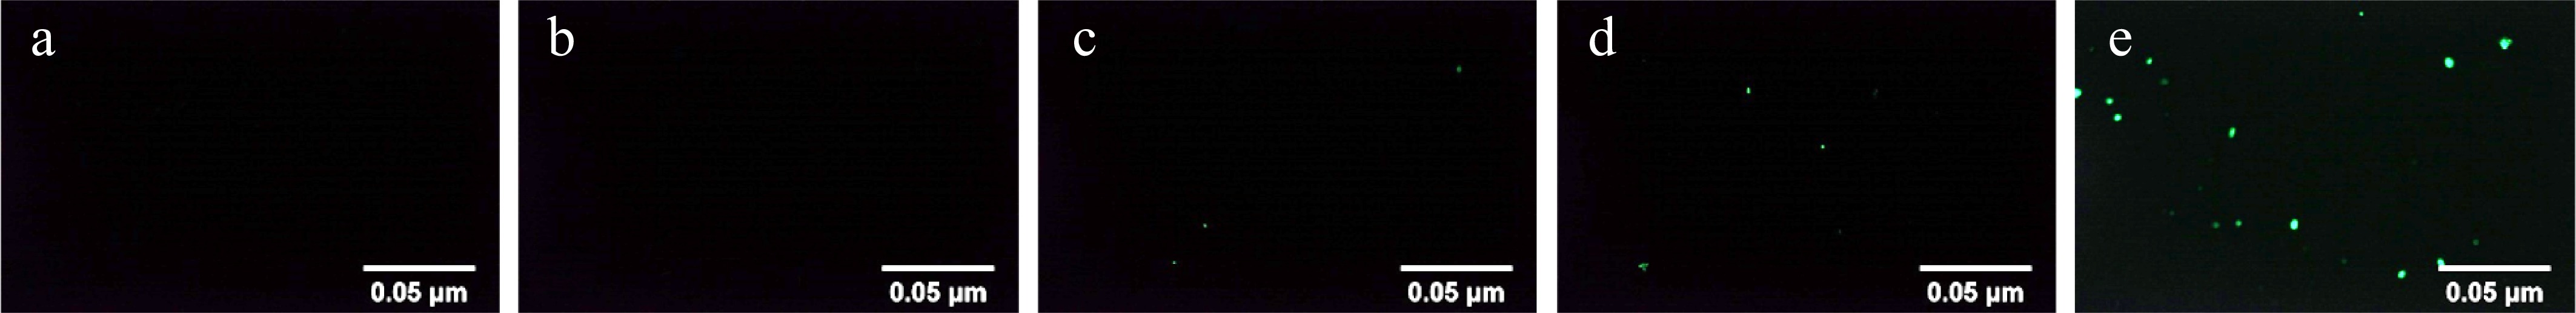
Figure 4.
Fluorescence PI staining of C. sporogenes spores under different lysozyme concentrations. (a) Lysozyme concentration was 0.2 μg/mL. (b) Lysozyme concentration was 0.6 μg/mL. (c) Lysozyme concentration of 1 μg/mL. (d) Lysozyme concentration was 1.4 μg/mL. (e) The concentration of lysozyme was 2 μg/mL.
-
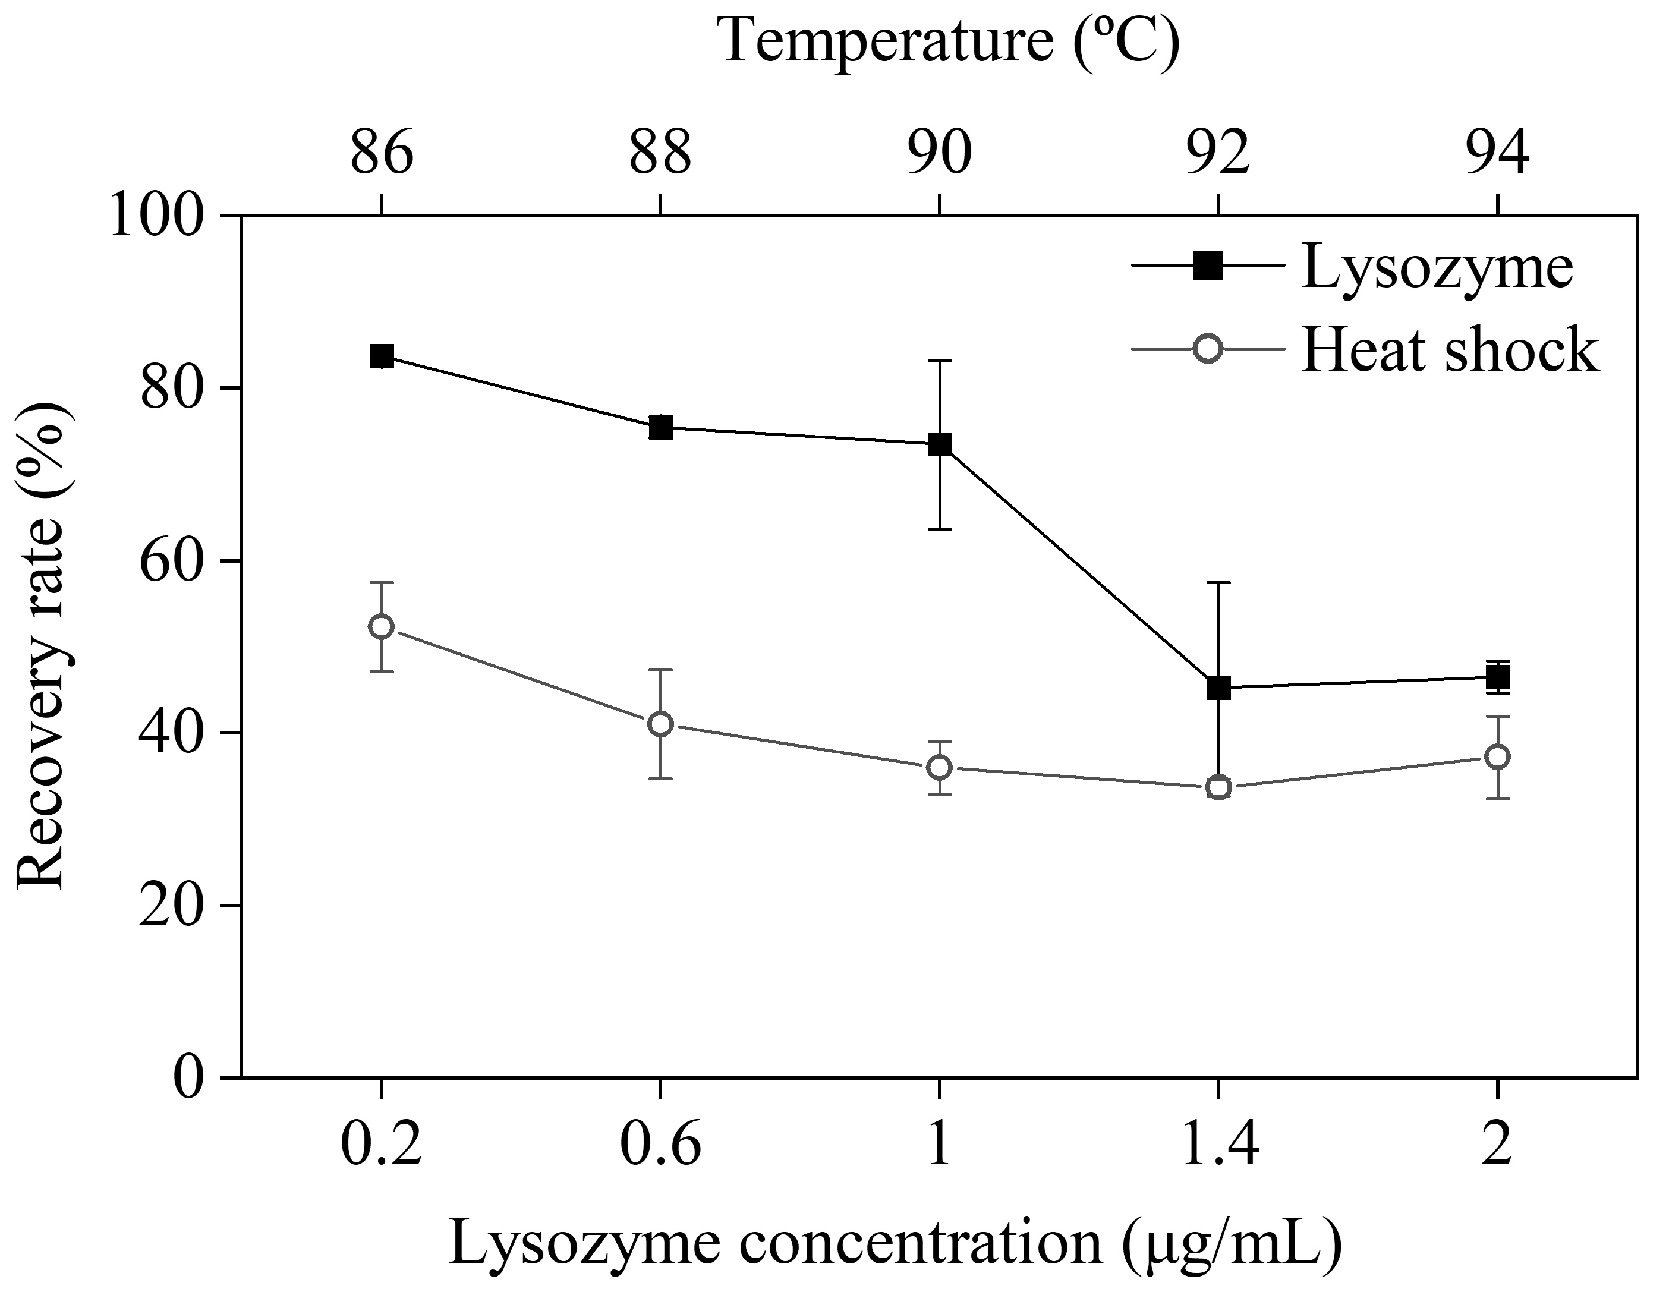
Figure 5.
Recovery rate of C. sporogenes spores under different purification conditions.
-
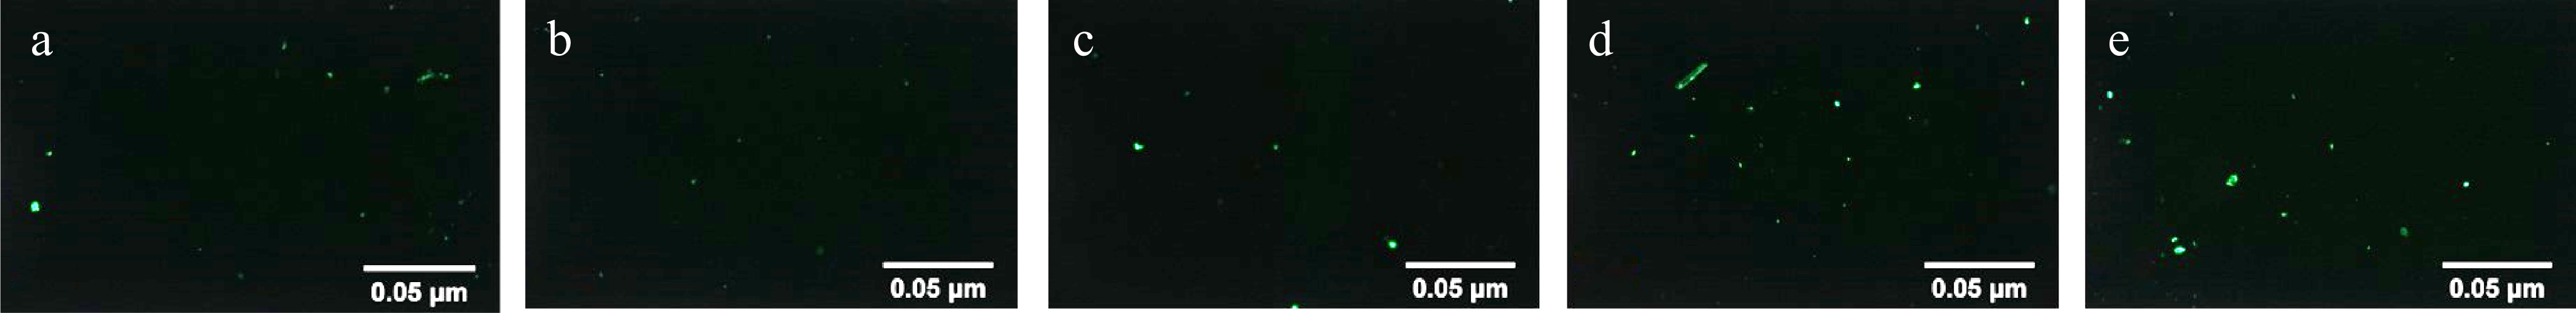
Figure 6.
Fluorescence PI staining of C. sporogenes spores at different heat shock temperatures. (a) Heat shock temperature was 86 °C. (b) Heat shock temperature was 88 °C. (c) Heat shock temperature was 90 °C. (d) Heat shock temperature was 92 °C. (e) Heat shock temperature was 94 °C.
-
Calcium salt Sporulation rate (%) D90 °C (min) Calcium carbonate 15.63 ± 0.25b 20.40 ± 0.72a Calcium fluoride 0.31 ± 0.00d − Calcium gluconate 47.64 ± 0.68a 18.09 ± 0.07b Calcium chloride 13.83 ± 1.57c 14.24 ± 0.63c Different letters mean there is a significant difference between values in the same column (p < 0.05). Table 1.
The sporulation efficiency and D90 °C of C. sporogenes spores produced in sporulation media with different calcium salts.
-
Lysozyme Heat shock Lysozyme concentrations (μg/mL) Spore survivors [Log (CFU/mL)] Temperature
(°C)Spore survivors
[Log (CFU/mL)]0.2 8.66 ± 0.03a 86 8.45 ± 0.04a 0.6 8.63 ± 0.01a 88 8.35 ± 0.10ab 1.0 8.60 ± 0.09a 90 8.29 ± 0.07b 1.4 8.38 ± 0.14b 92 8.26 ± 0.02b 2.0 8.40 ± 0.02b 94 8.30 ± 0.09b Different letters mean there is a significant difference between values in the same column (p < 0.05). Table 2.
The survivors of C. sporogenes spores under different lysozyme concentrations and heat-shock temperatures.
Figures
(6)
Tables
(2)