-
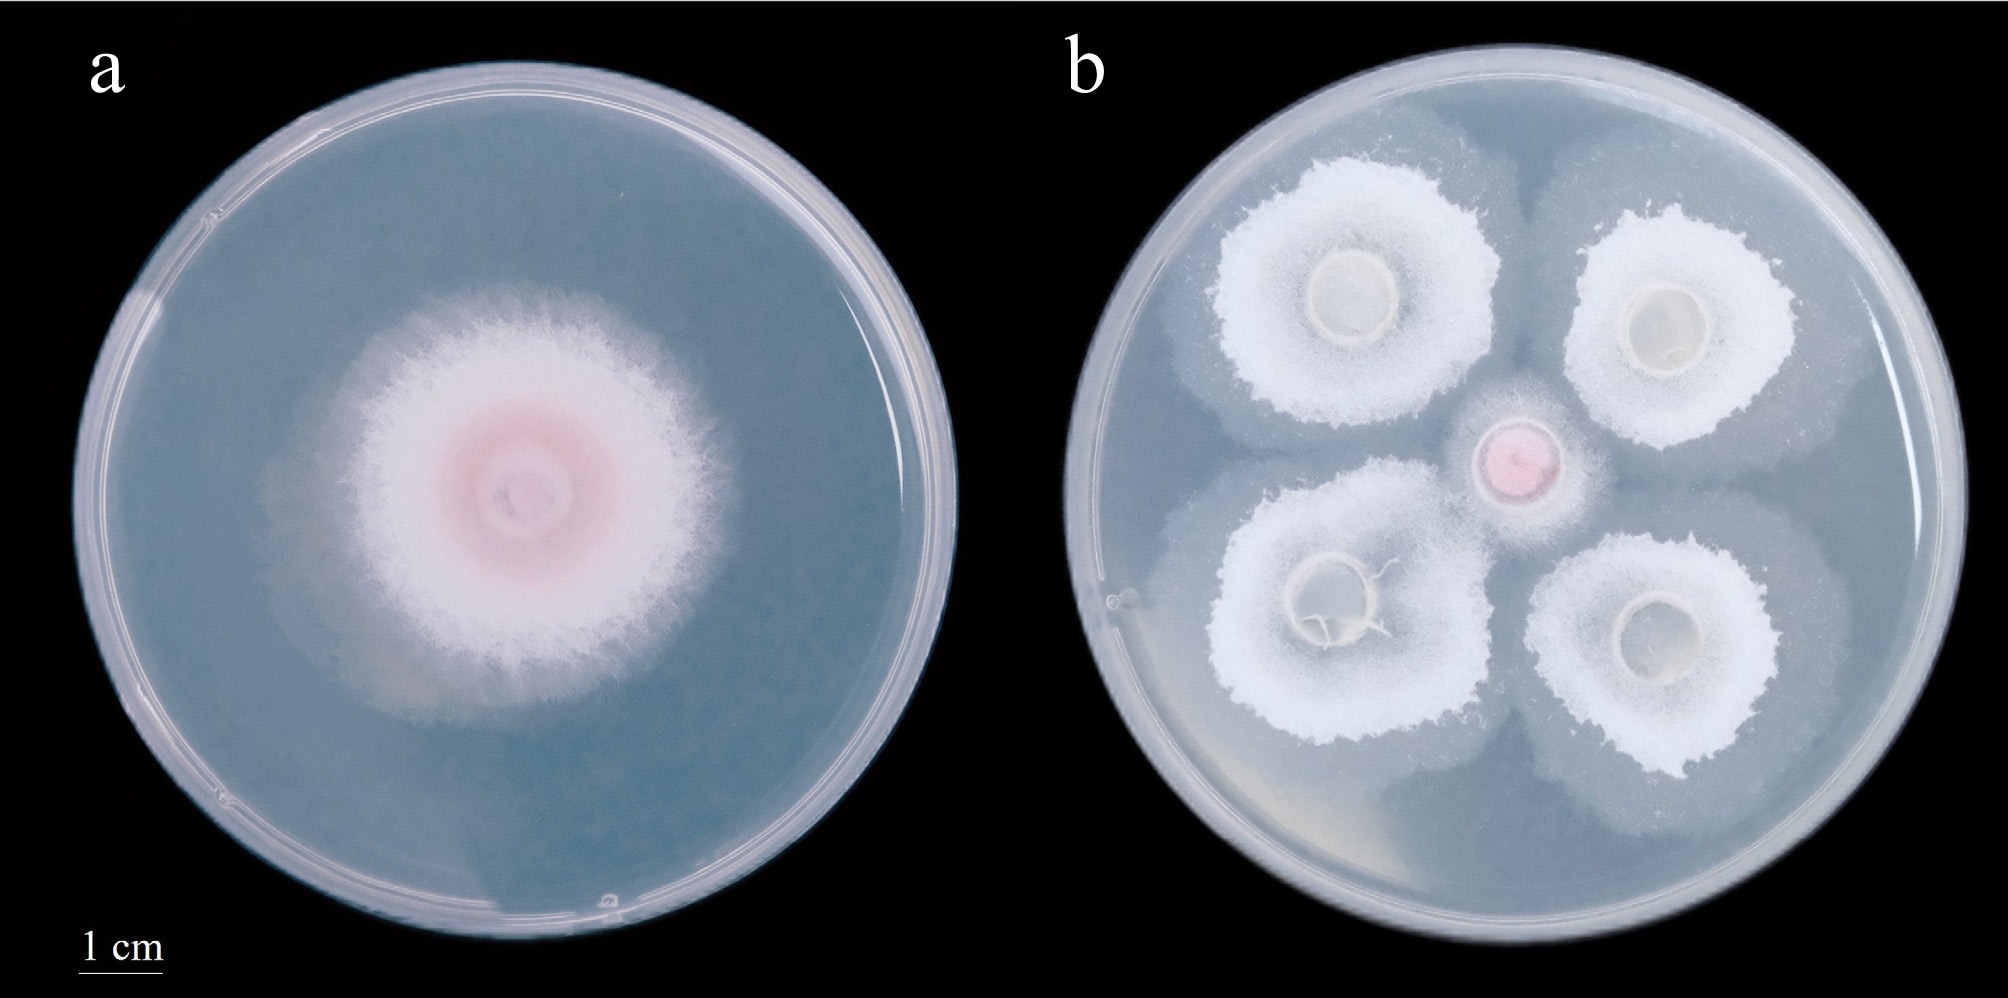
Figure 1.
Dual culture assay between strain Z35 and F. oxysporum after 2 d of incubation (the diameter of the petri dish is 9 cm).
-
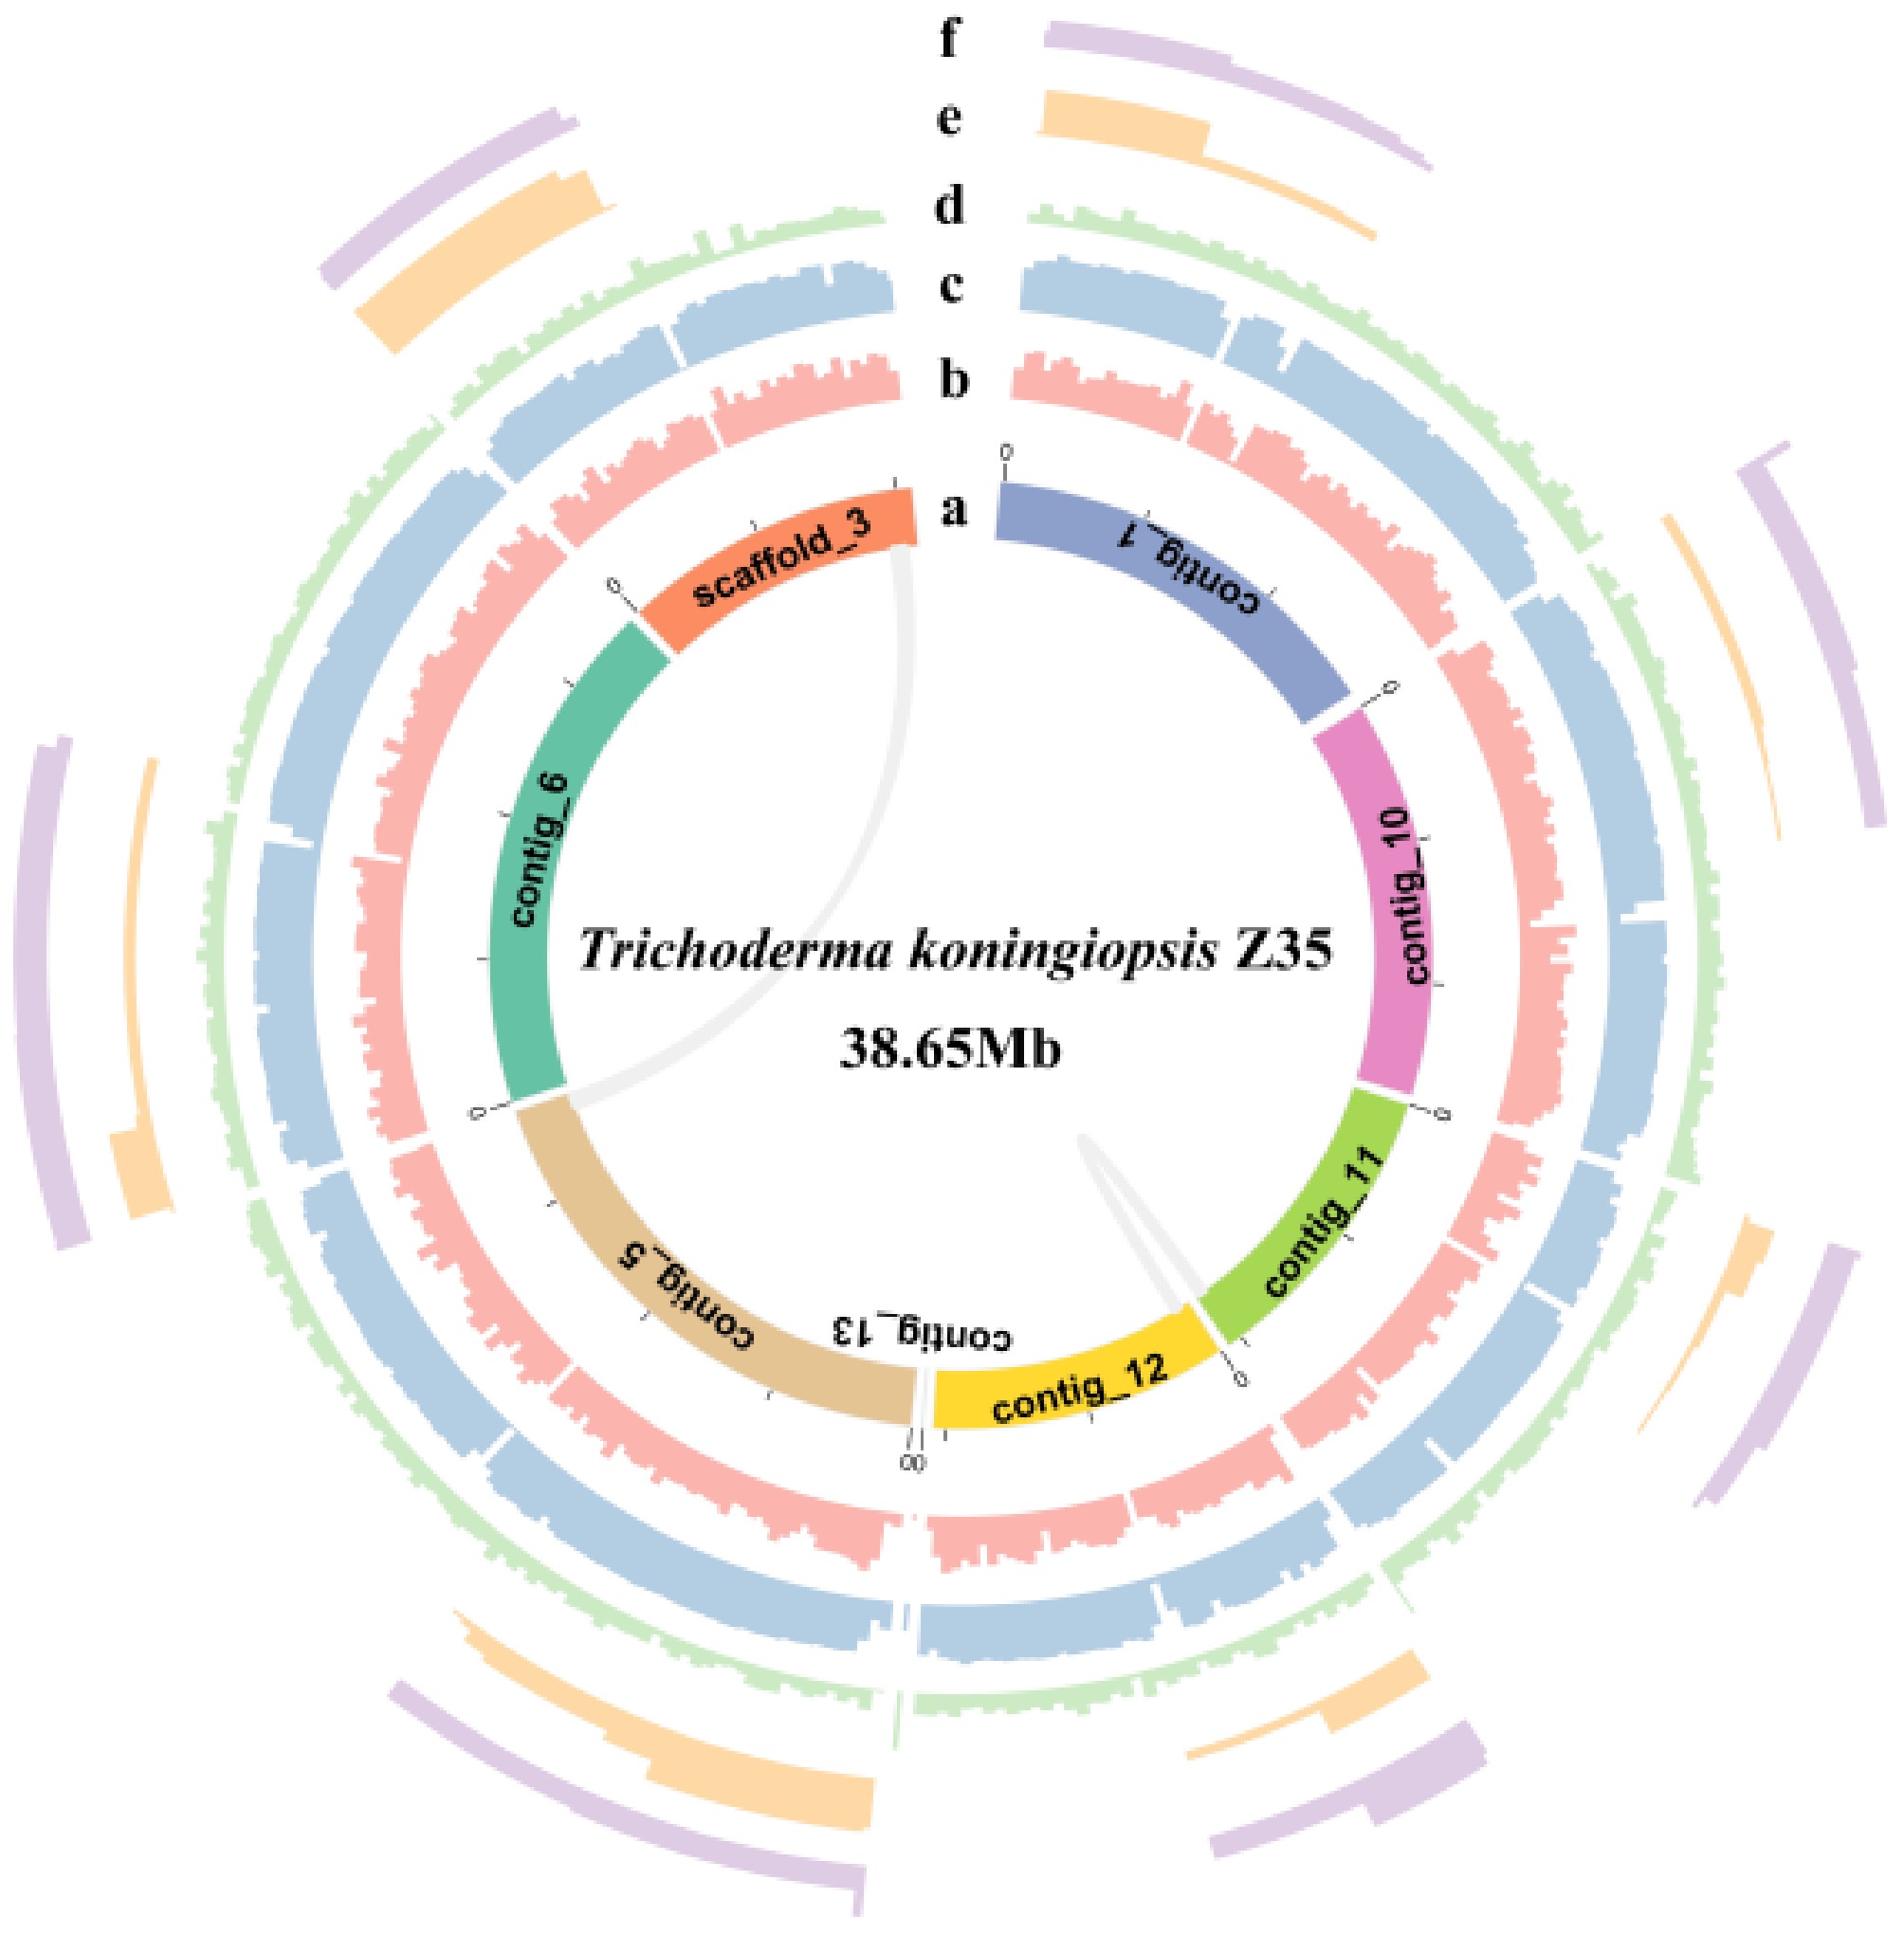
Figure 2.
Circos plot of the genome of strain Z35. From the innermost to the outermost ring, the plot displays the scaffold, gene density, GC content, GC skew, Copia, and Gypsy elements.
-
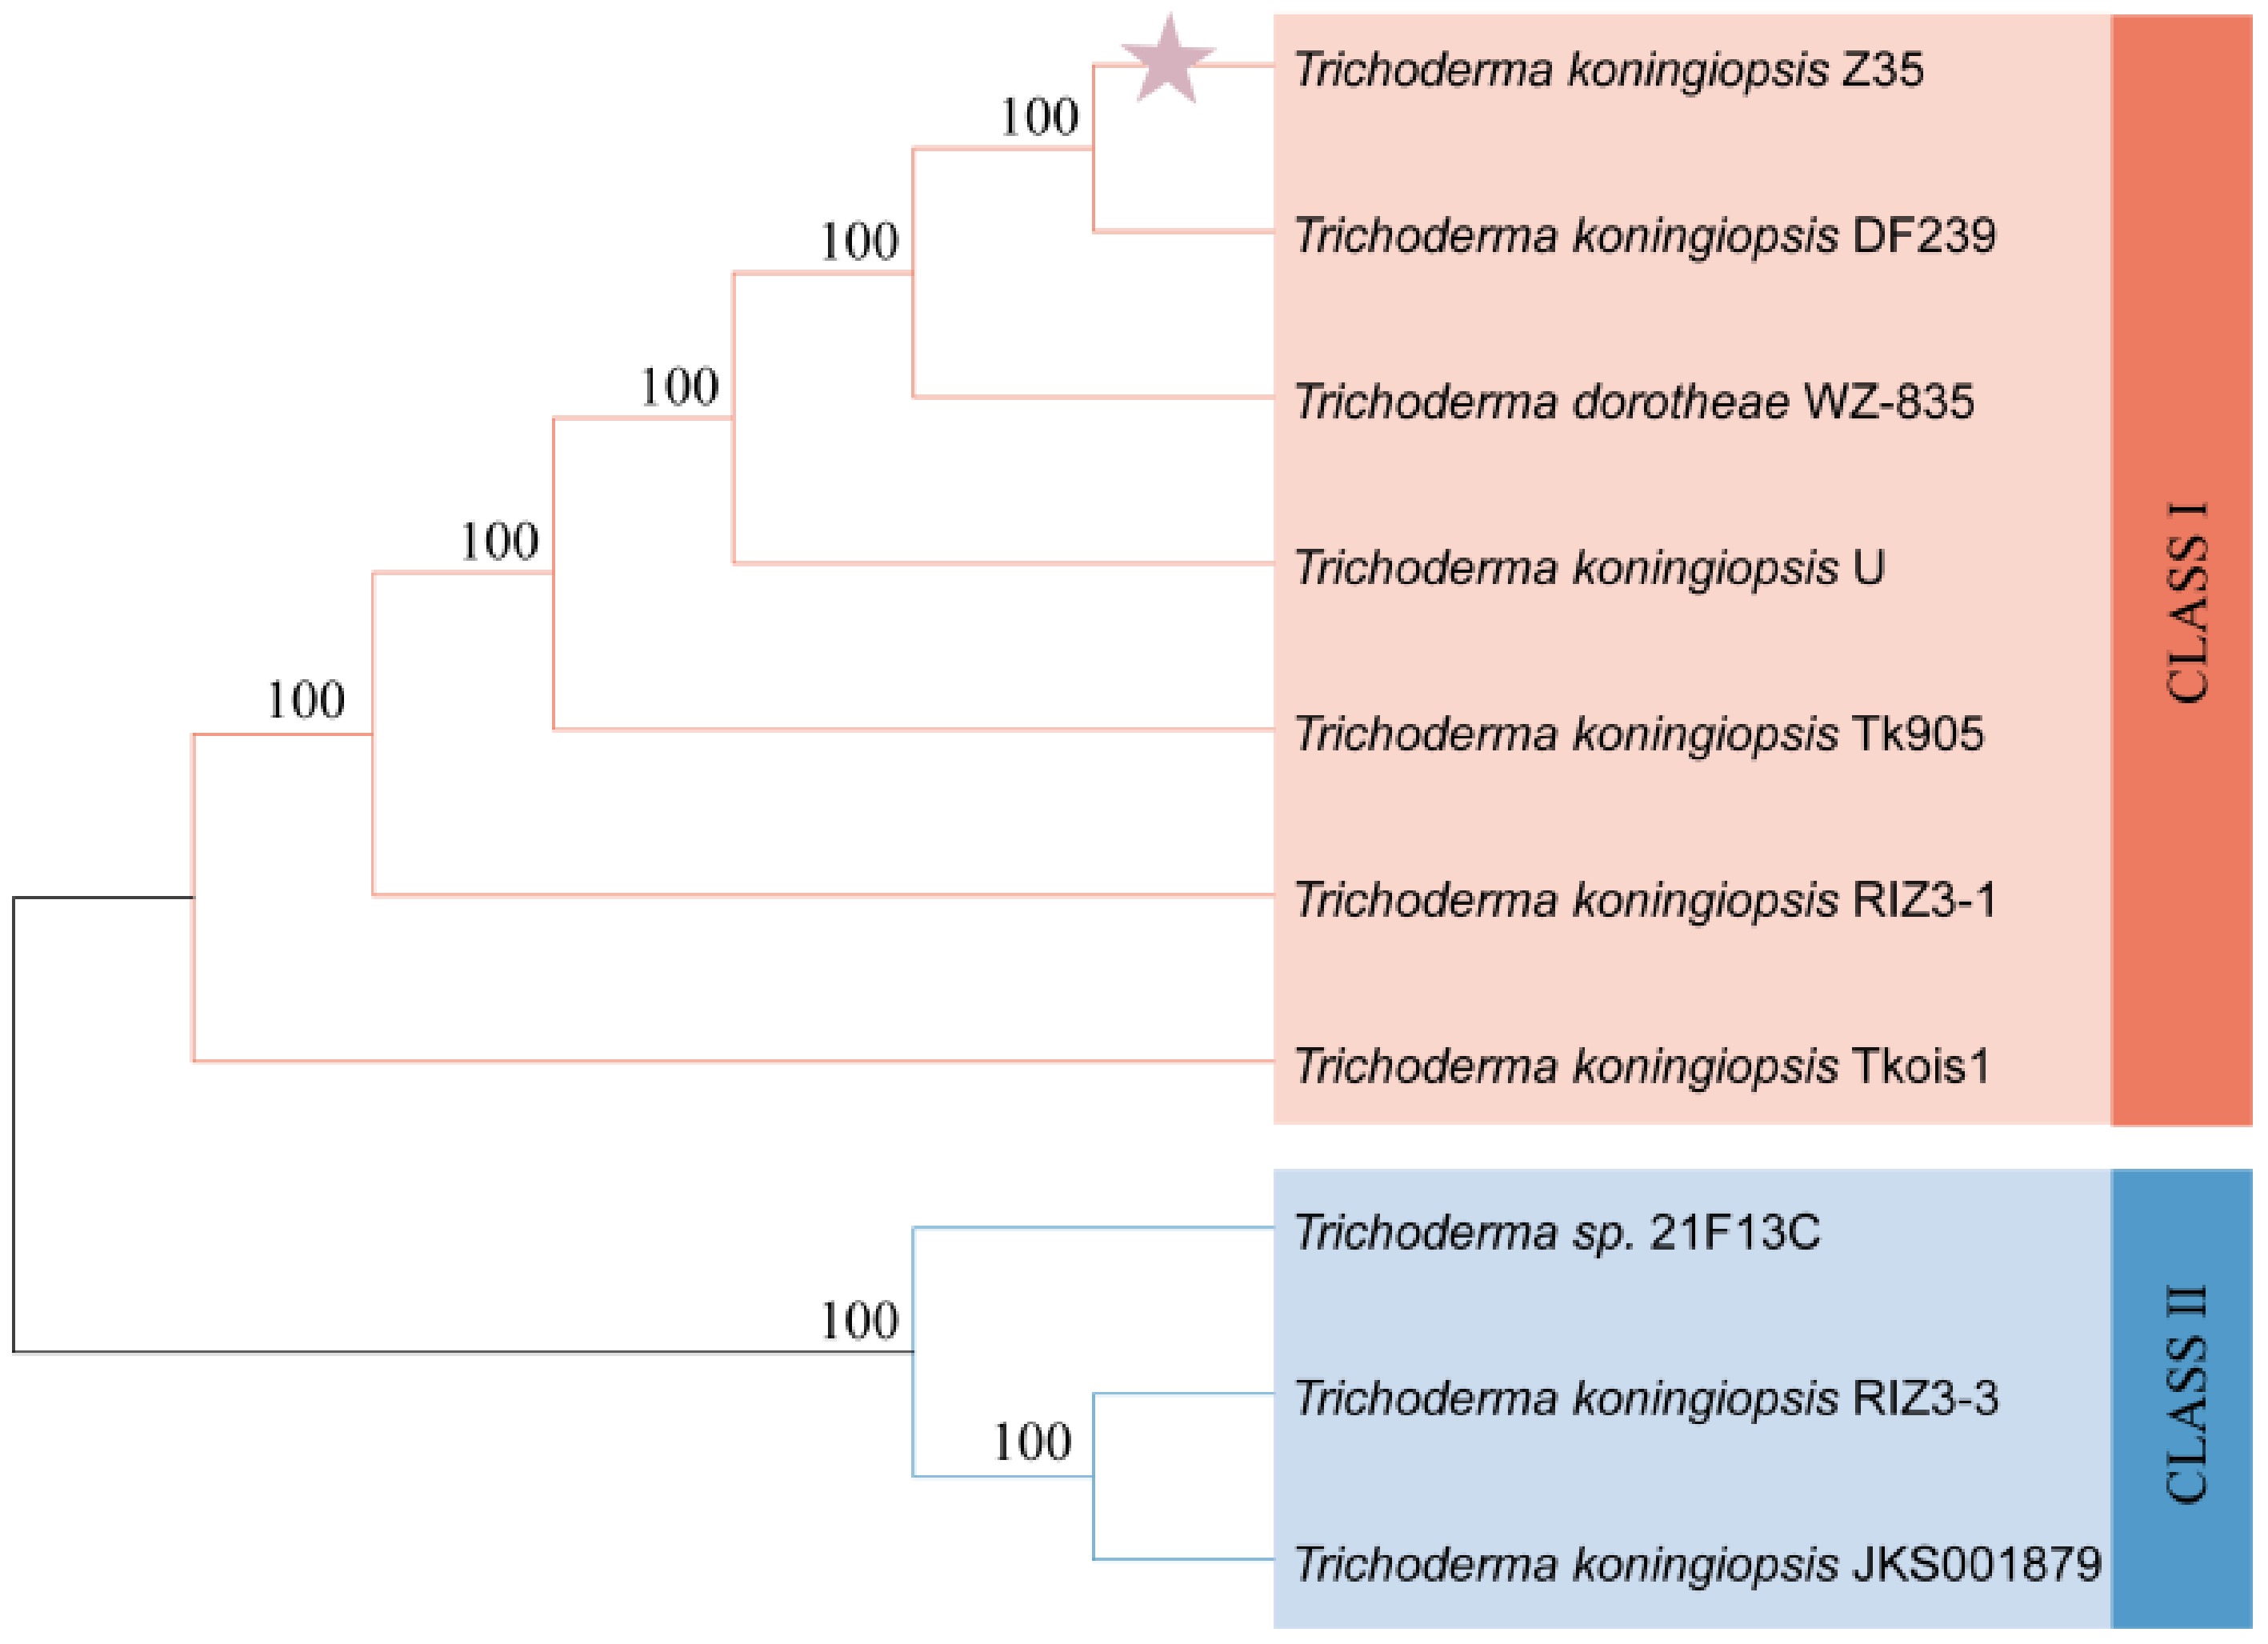
Figure 3.
Phylogenetic tree of strain Z35 based on ITS sequence alignment.
-
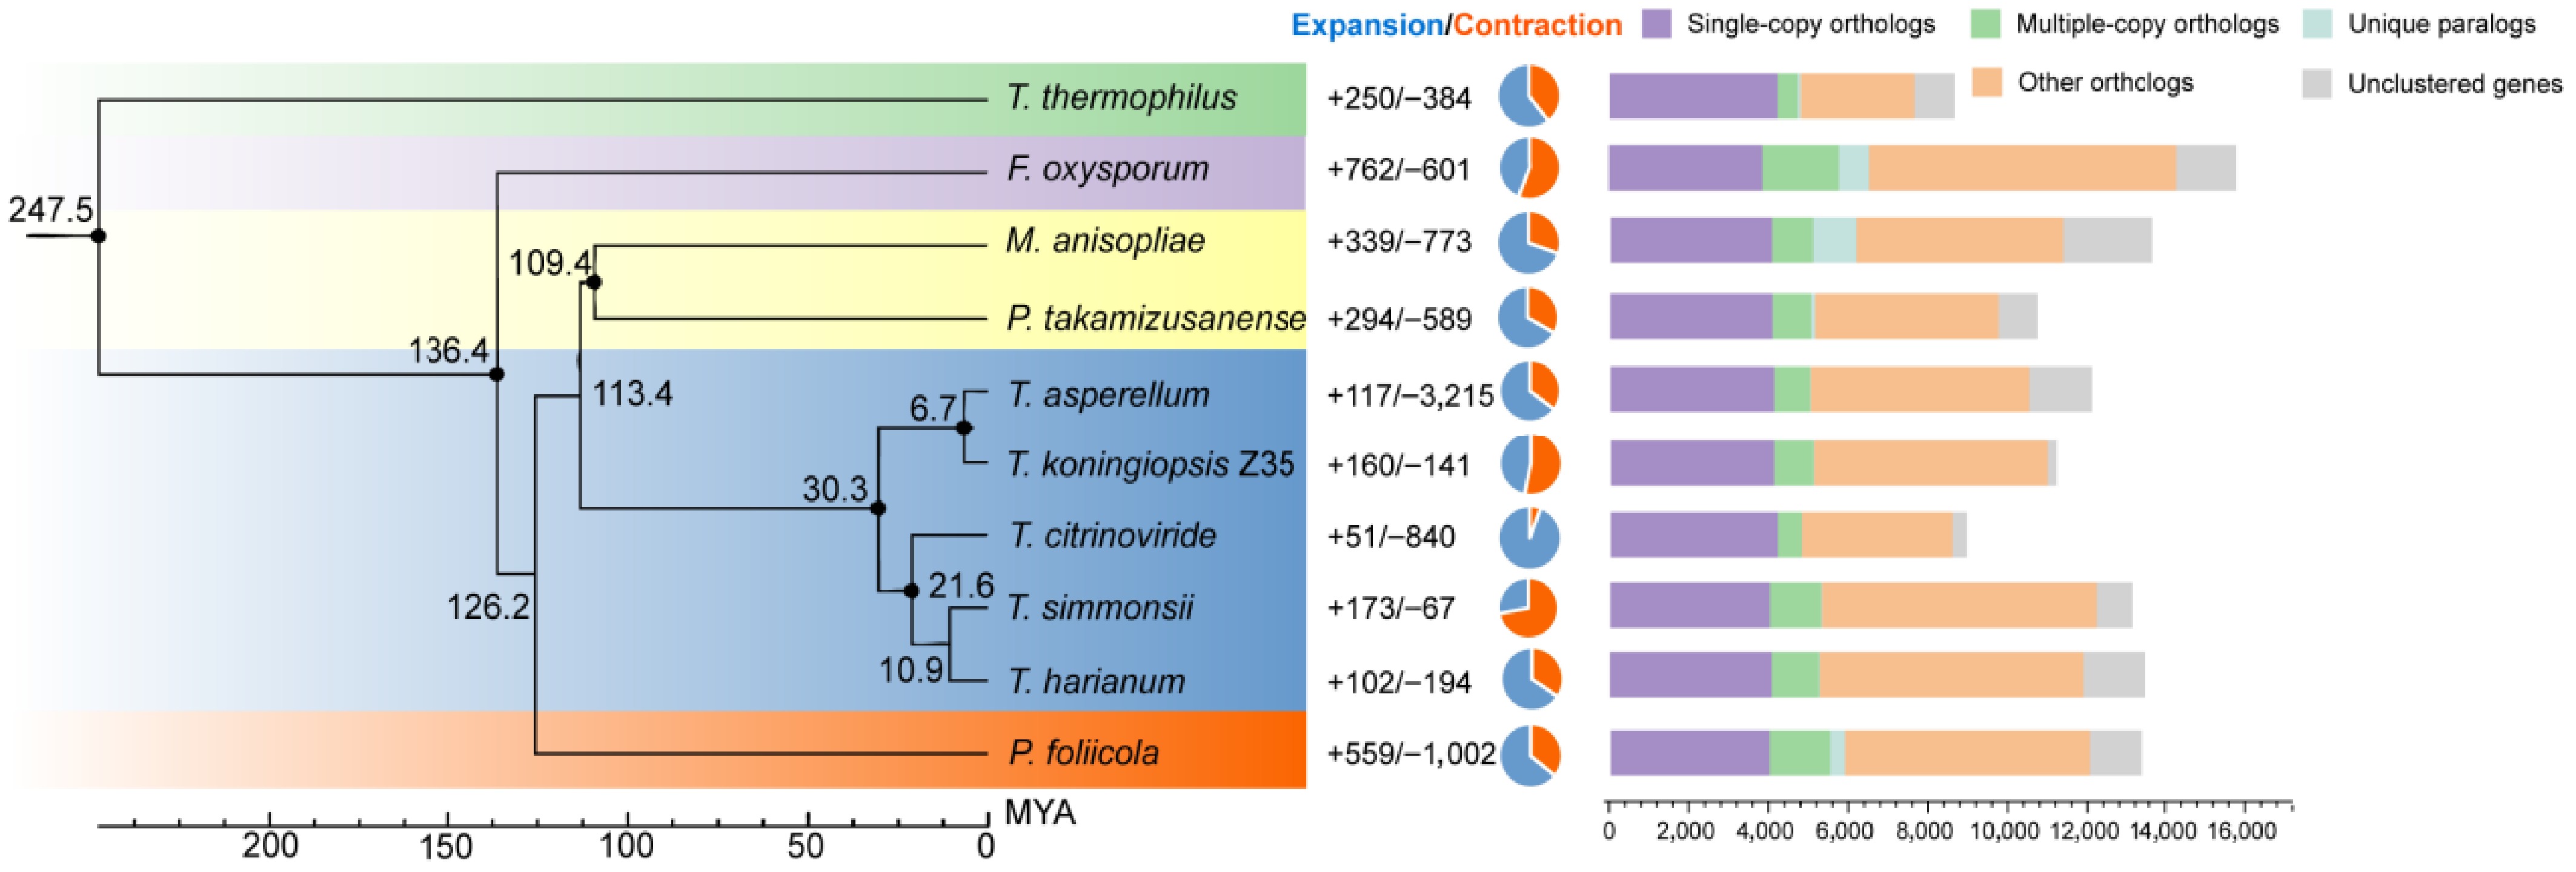
Figure 4.
Maximum likelihood phylogenetic tree based on single-copy orthologous genes from seven Trichoderma species and three outgroup taxa. All nodes are supported with 100% bootstrap values. The black numbers on the branches indicate estimated divergence times in MYA. Gene family expansions and contractions for each species are represented by blue and orange pie charts, respectively.
-
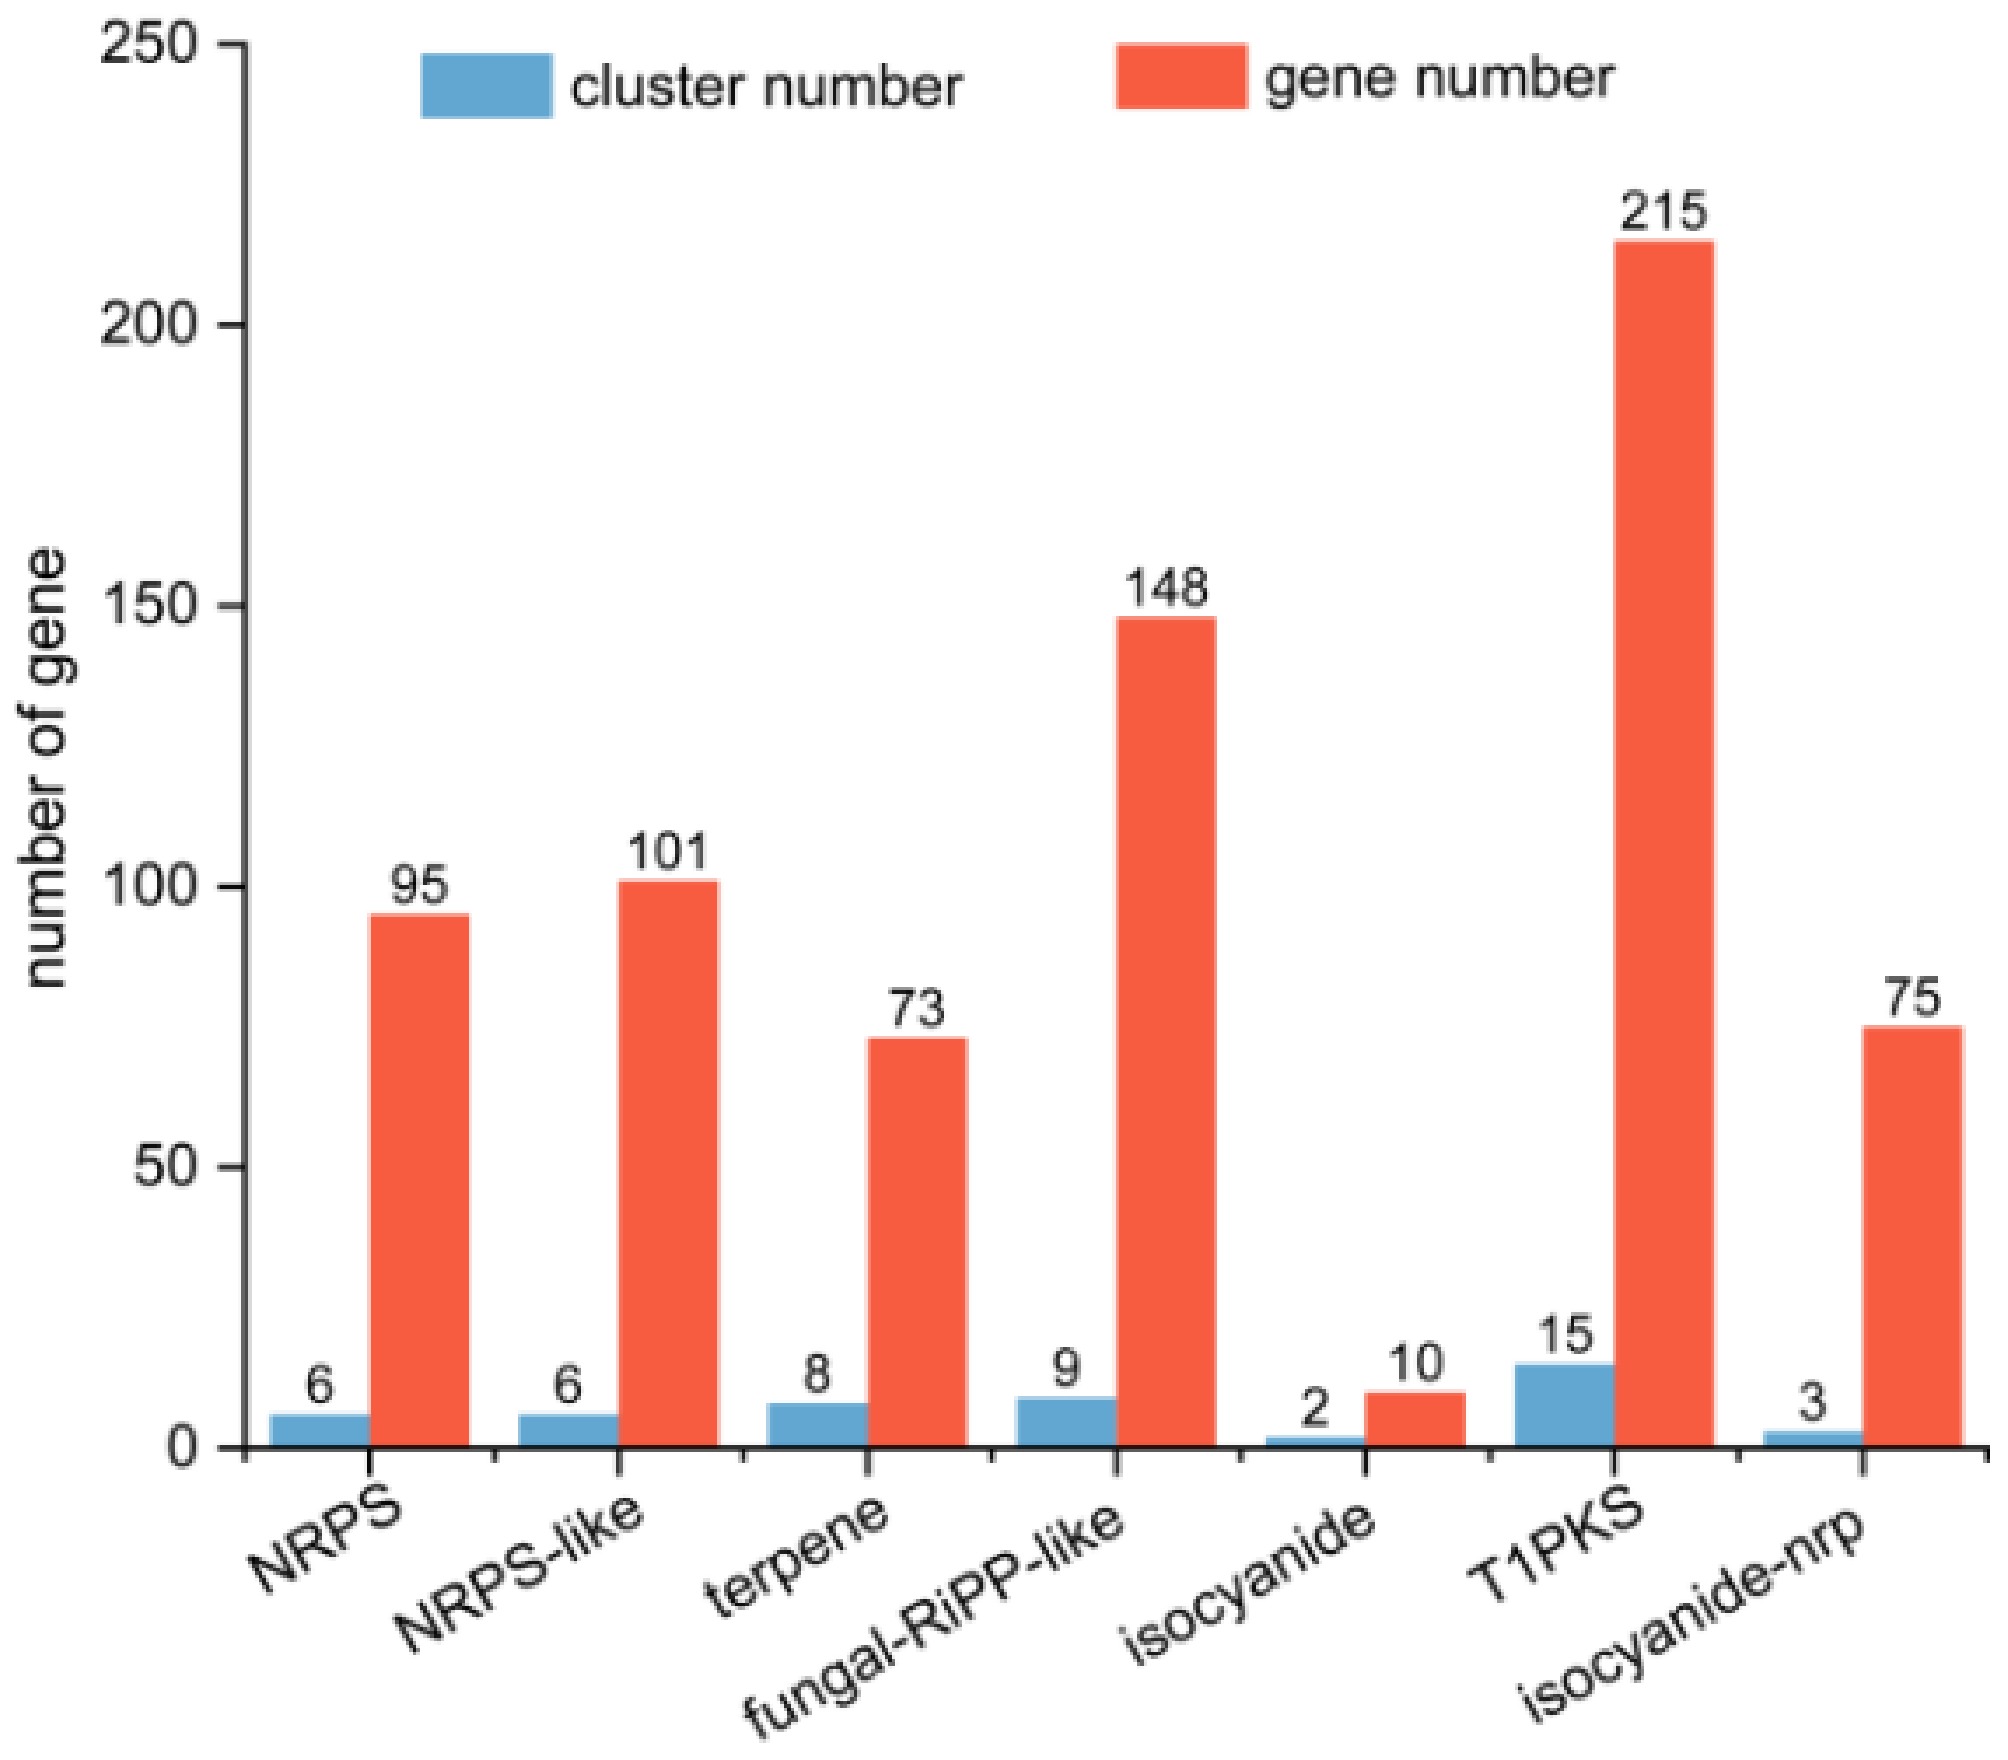
Figure 5.
Quantitative analysis of secondary metabolite biosynthetic gene clusters (BGCs) in T. koningiopsis Z35. Abbreviations: NRPS, NonRibosomal Peptide Synthetase; NRPS-like, NonRibosomal Peptide Synthetase-Like; T1PKS, Type I PolyKetide Synthase; Isocyanide-NRP, Isocyanide–NonRibosomal Peptide Synthetase.
-
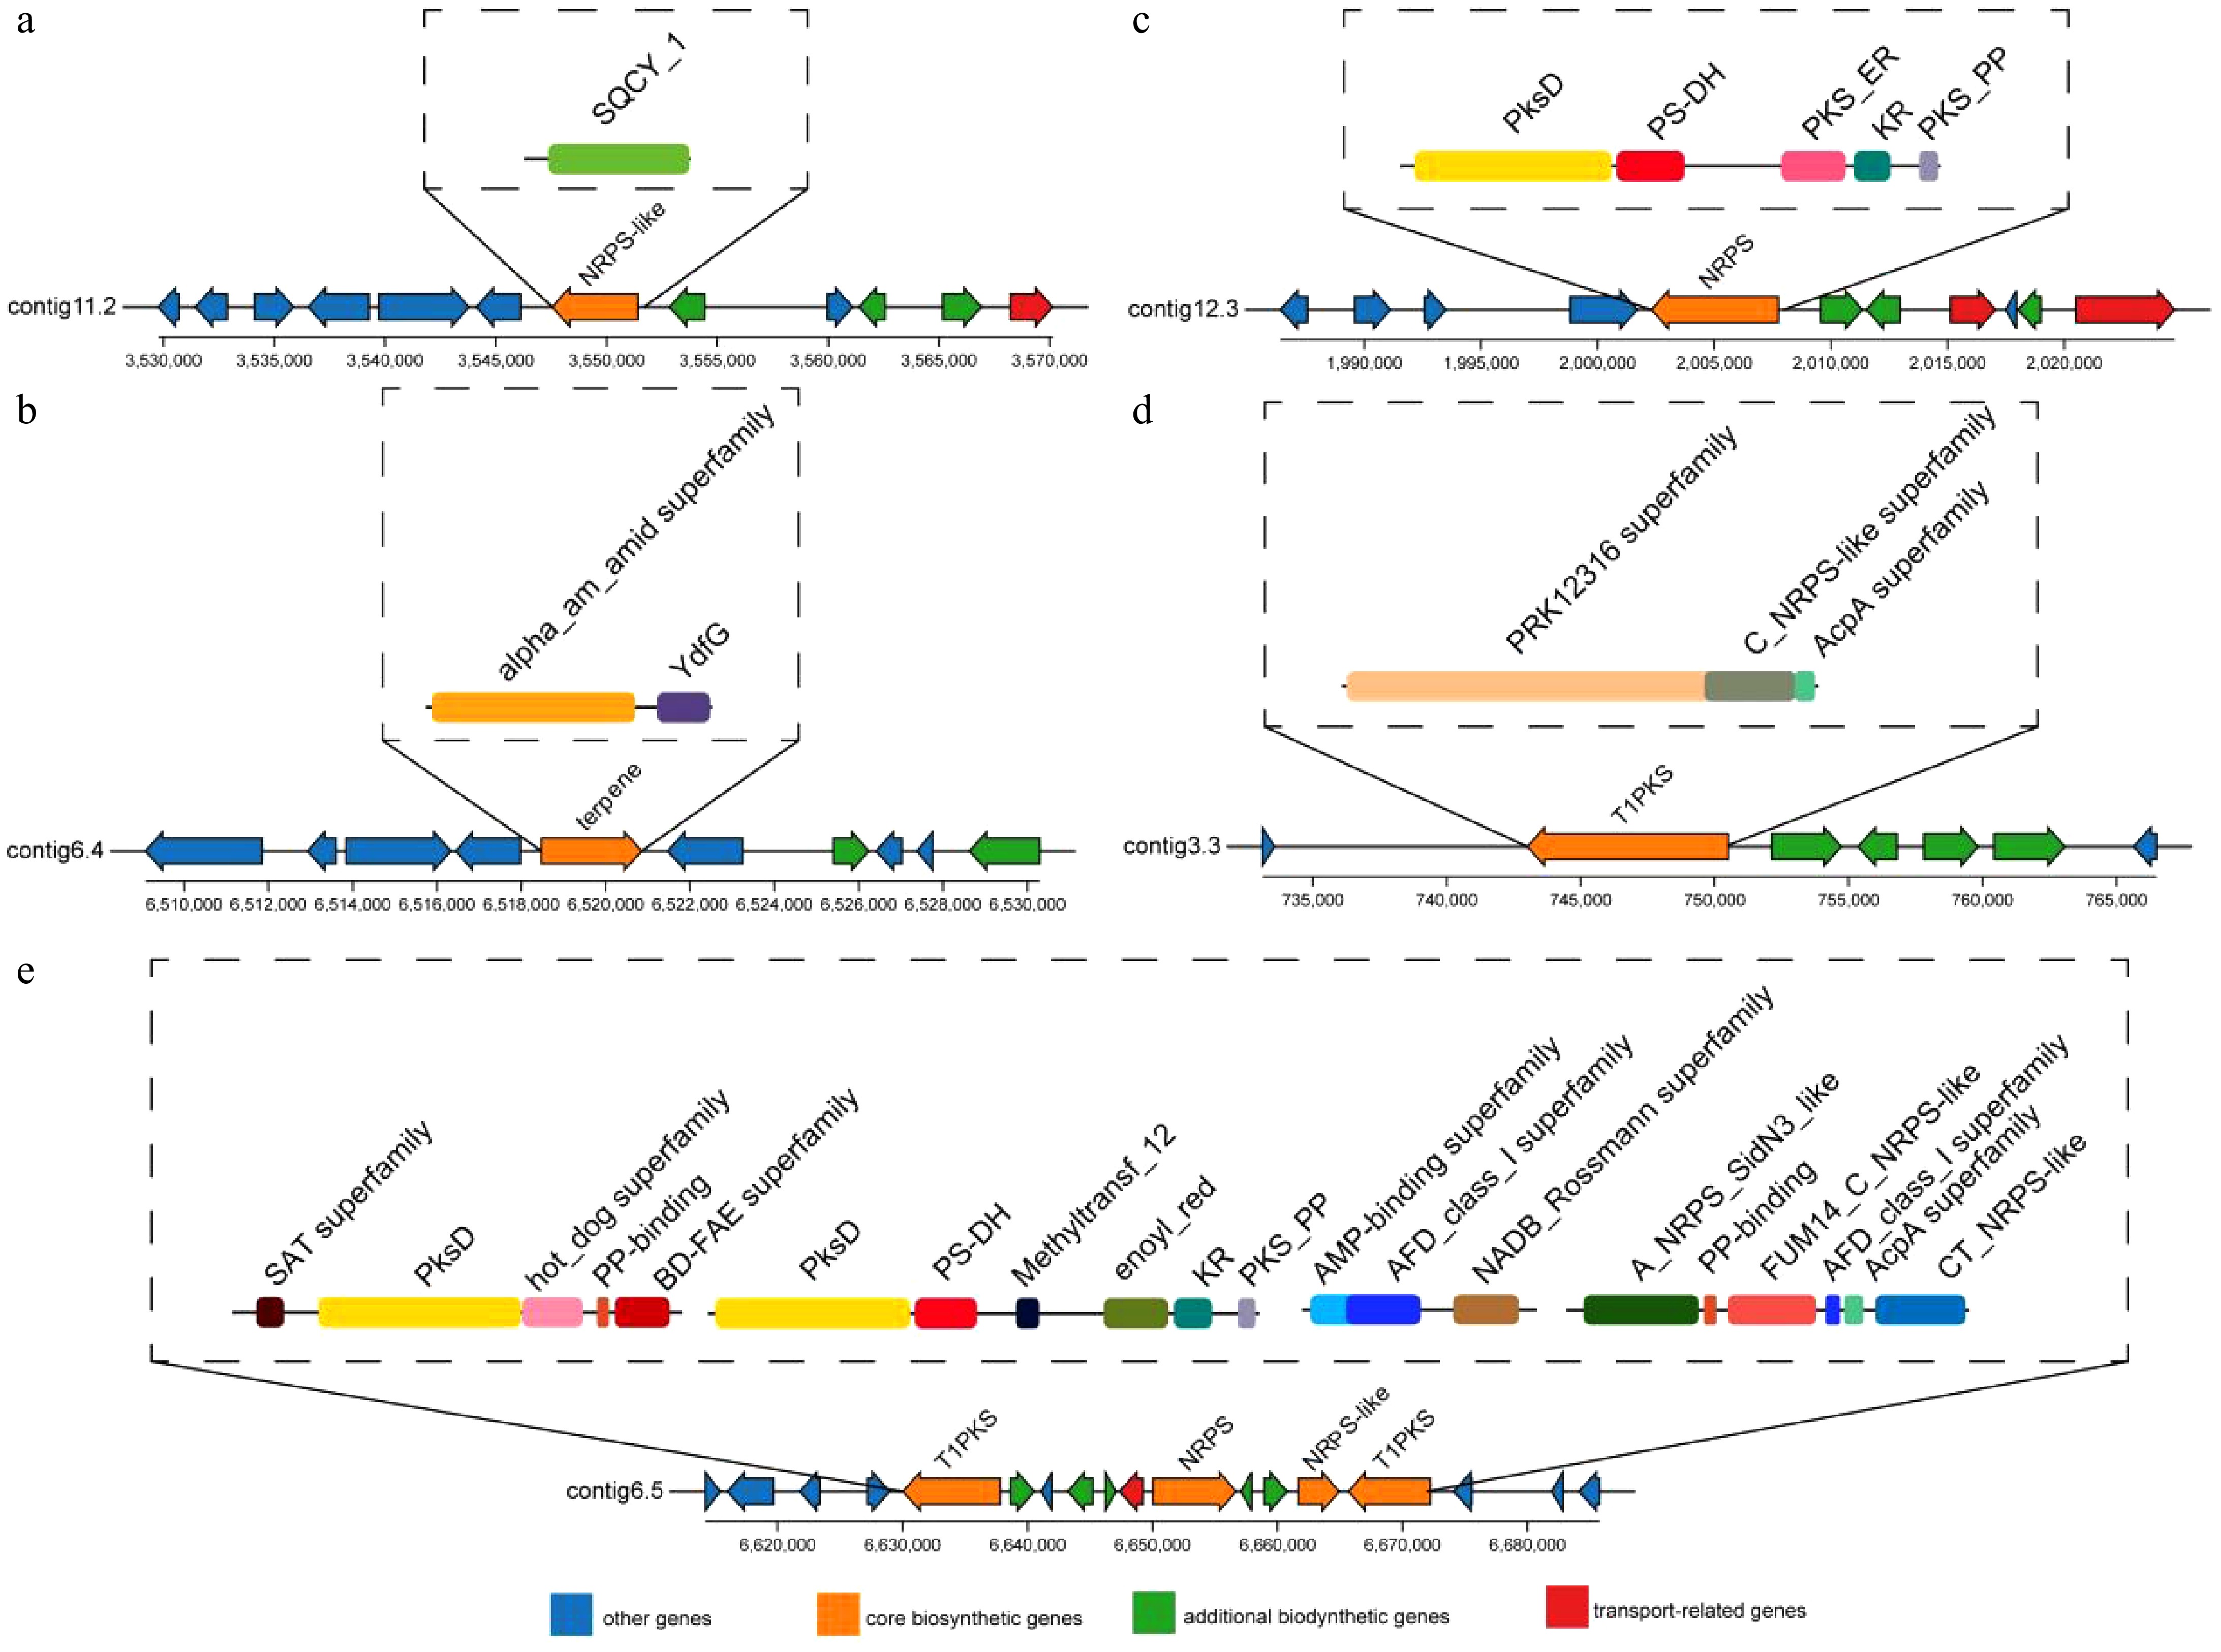
Figure 6.
Structural analysis of five BGCs identified in the T. koningiopsis Z35 genome using antiSMASH.
-
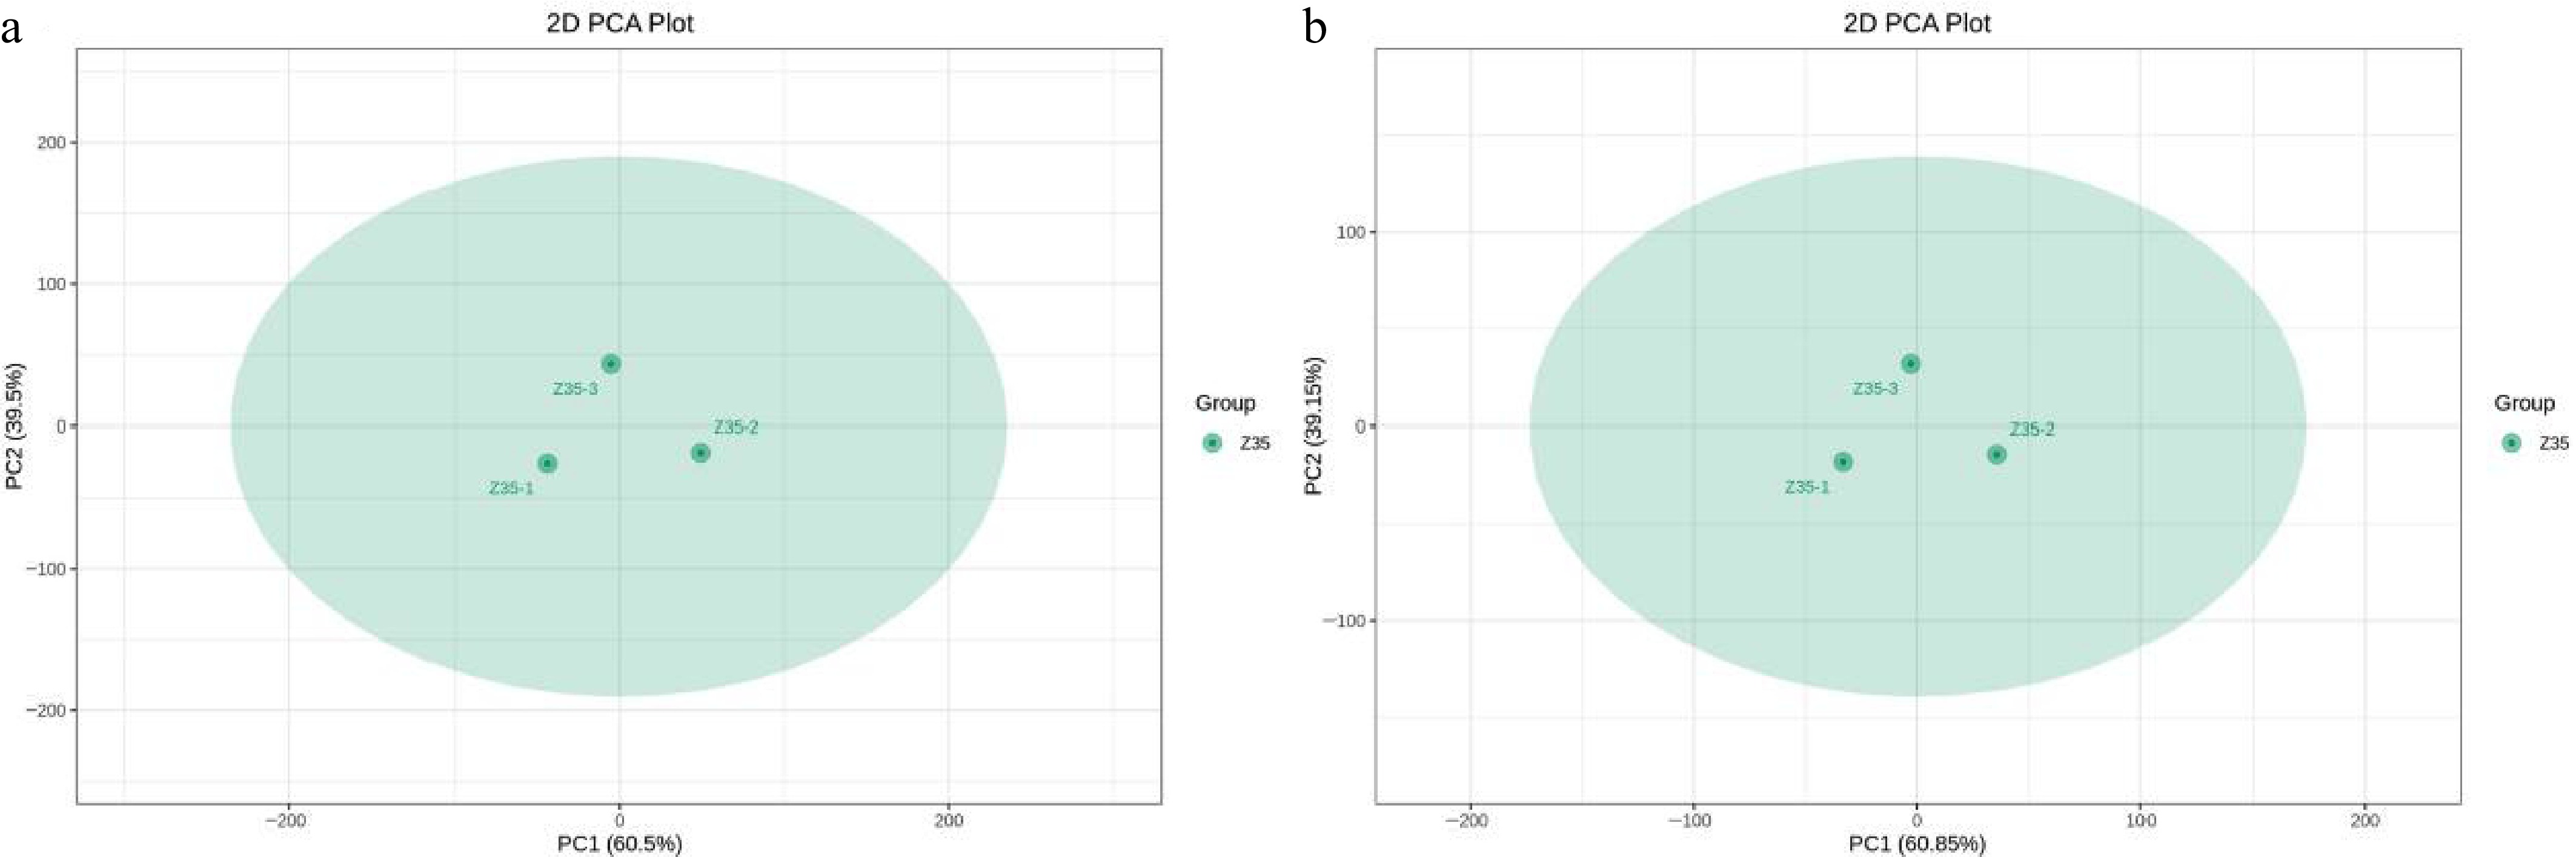
Figure 7.
Principal component analysis (PCA) of three biological replicates of T. koningiopsis Z35.
-
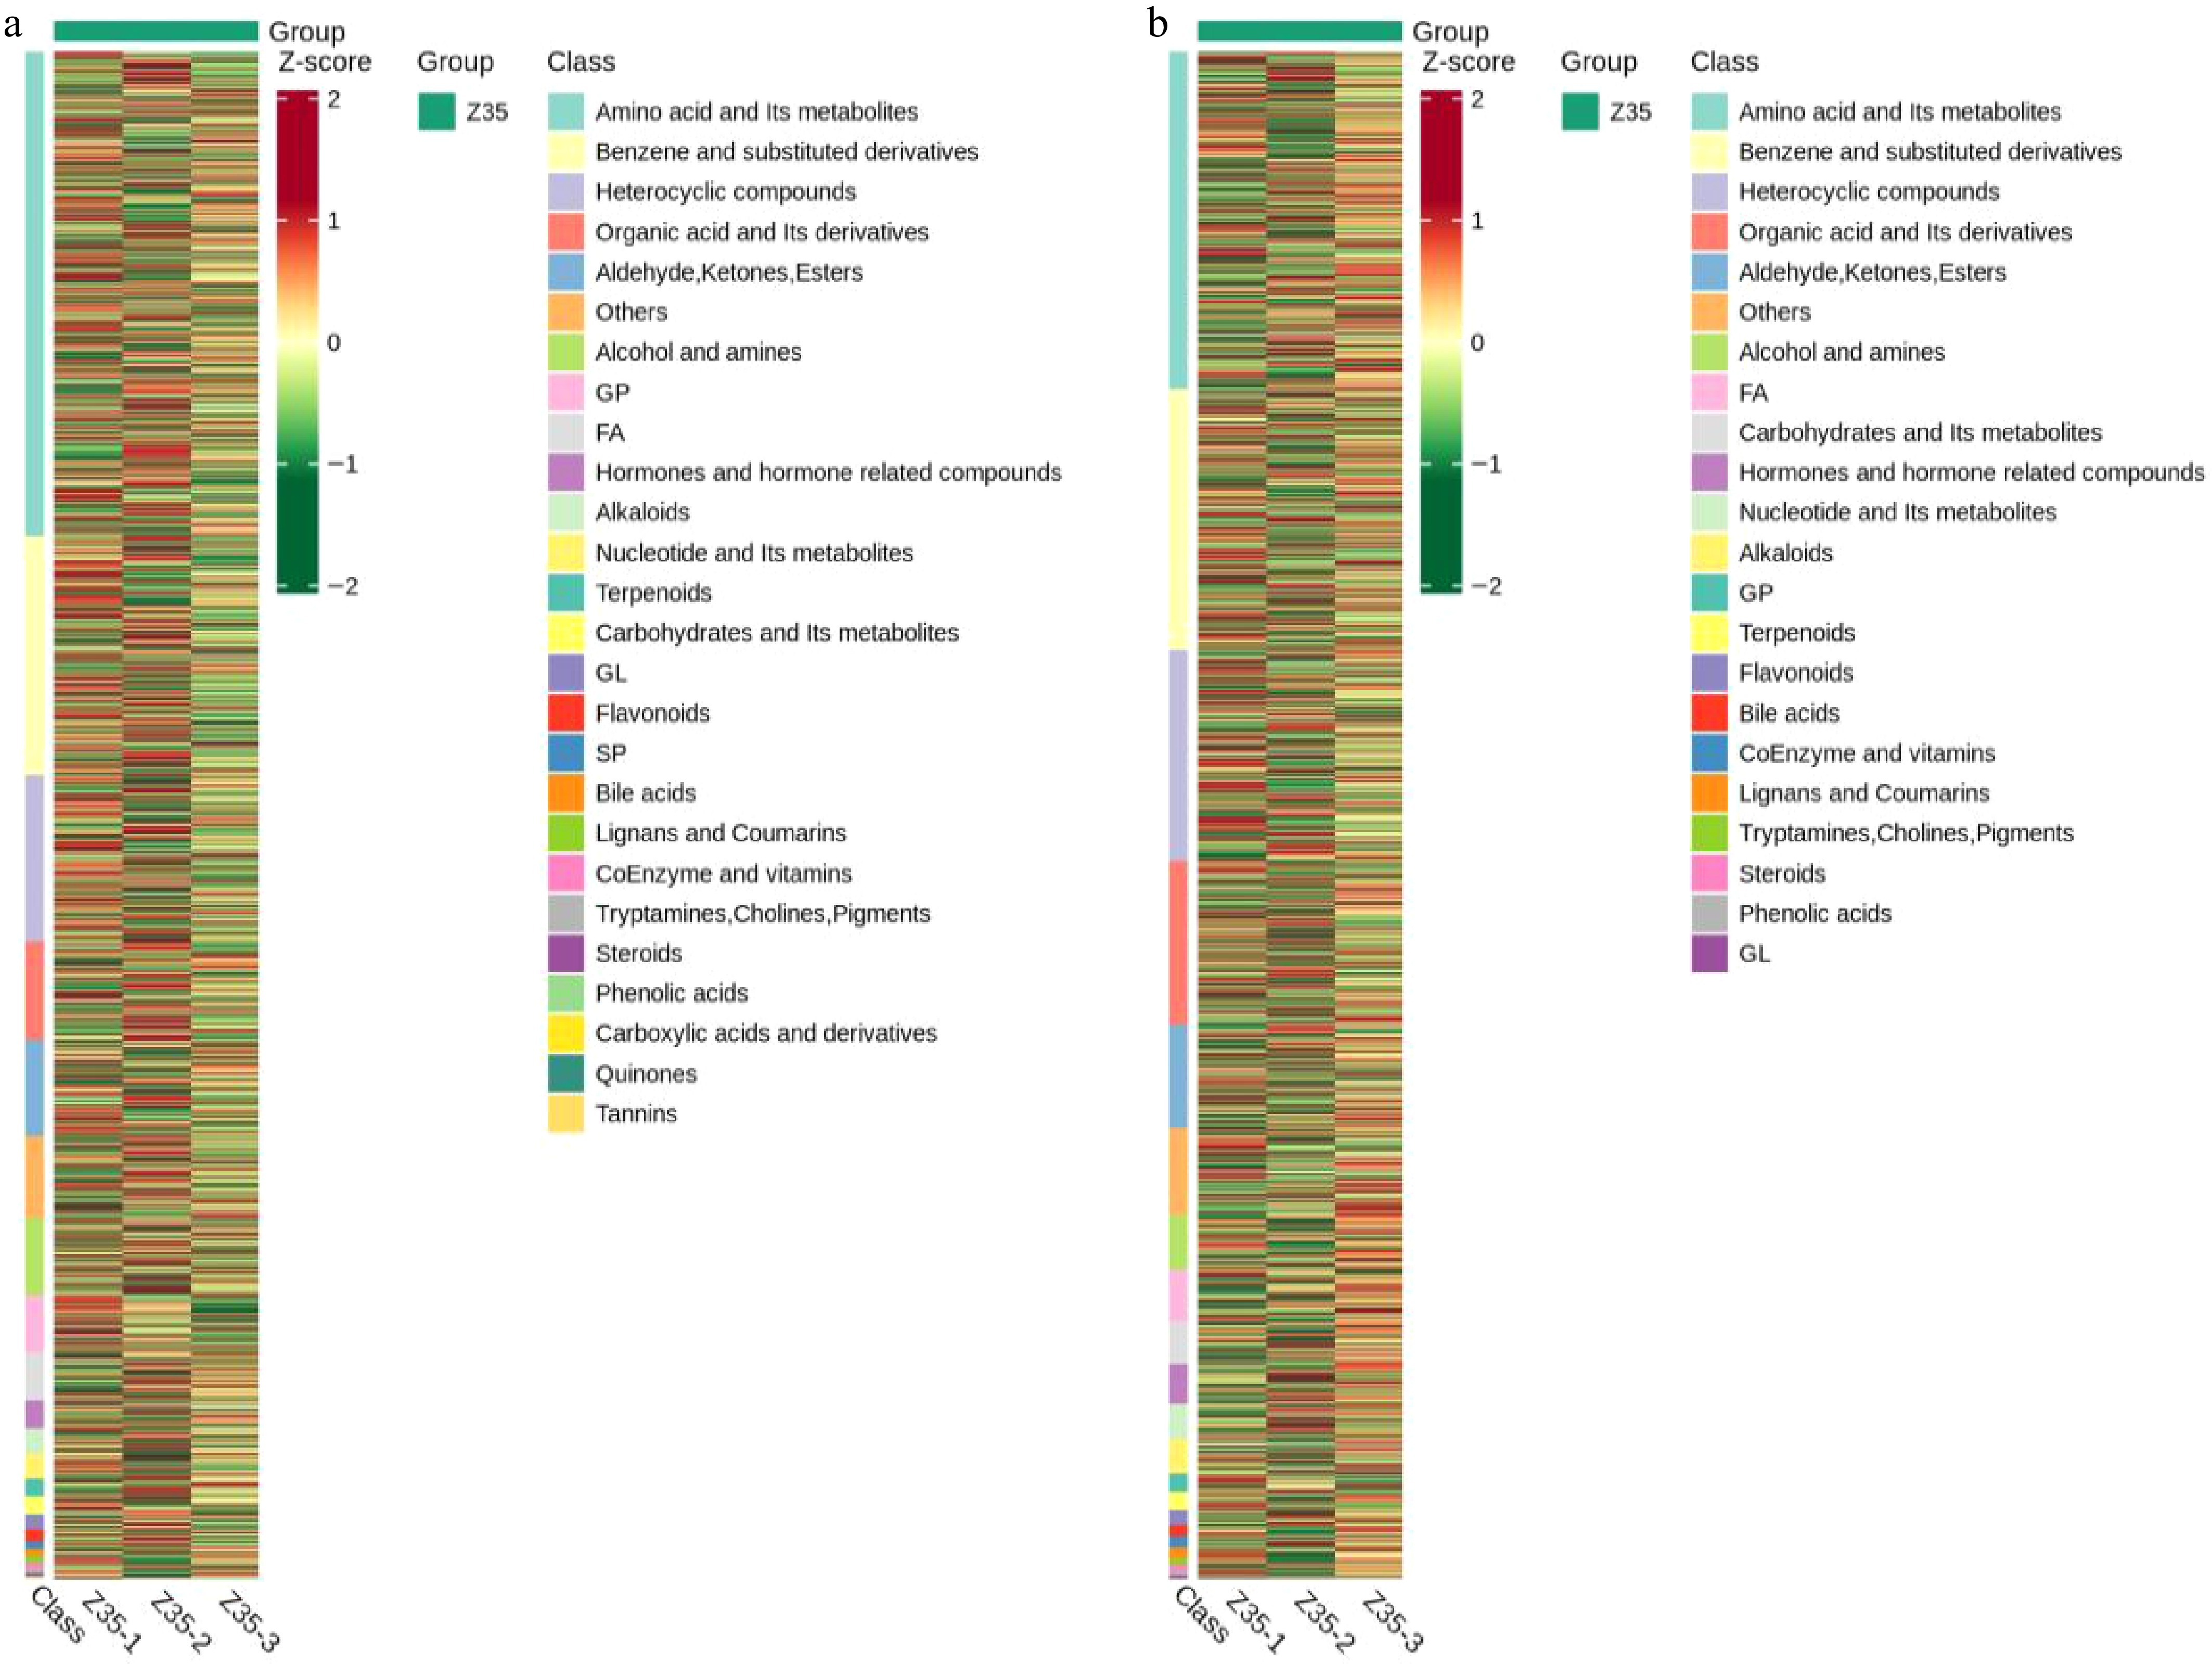
Figure 8.
Hierarchical clustering analysis of metabolites detected in the fermentation broth of Z35 under positive and negative ion mode.
Figures
(8)
Tables
(0)