-
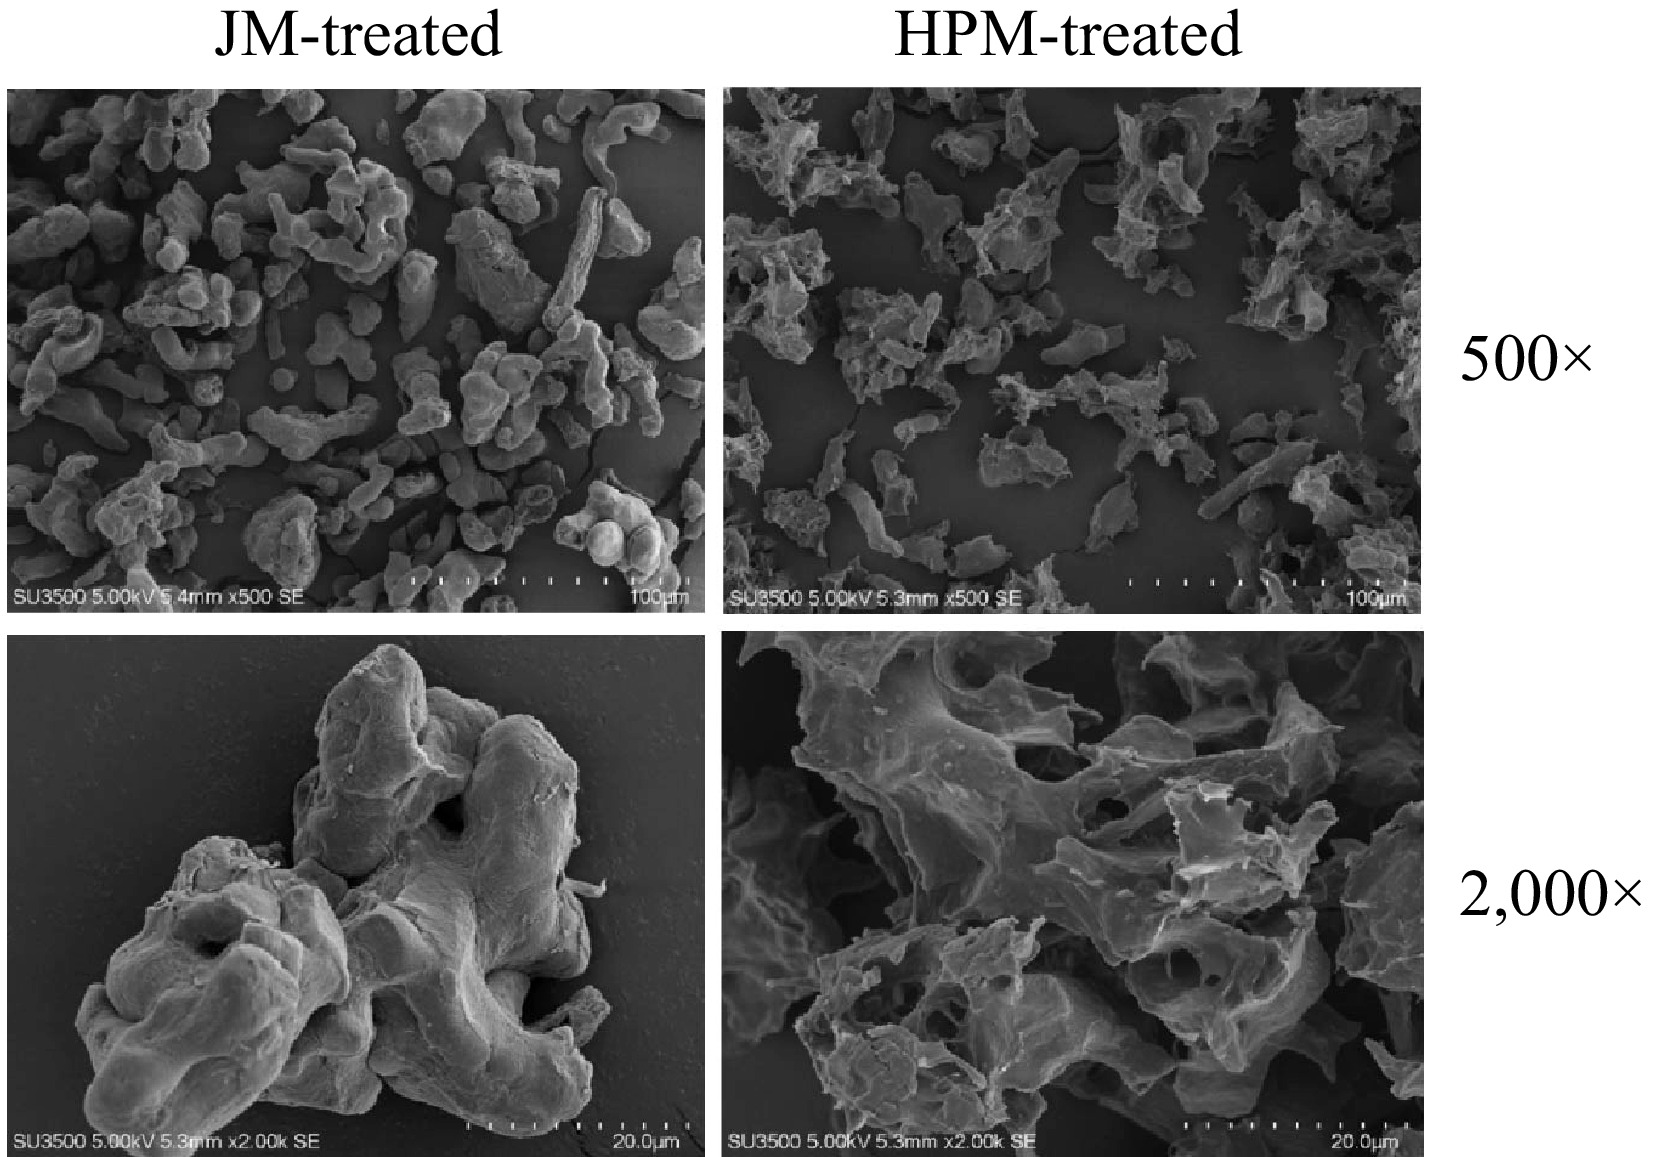
Figure 1.
SEM micrographs of P. cocos powders with JM-treated and HPM-treated at different magnifications (500× and 2,000×).
-
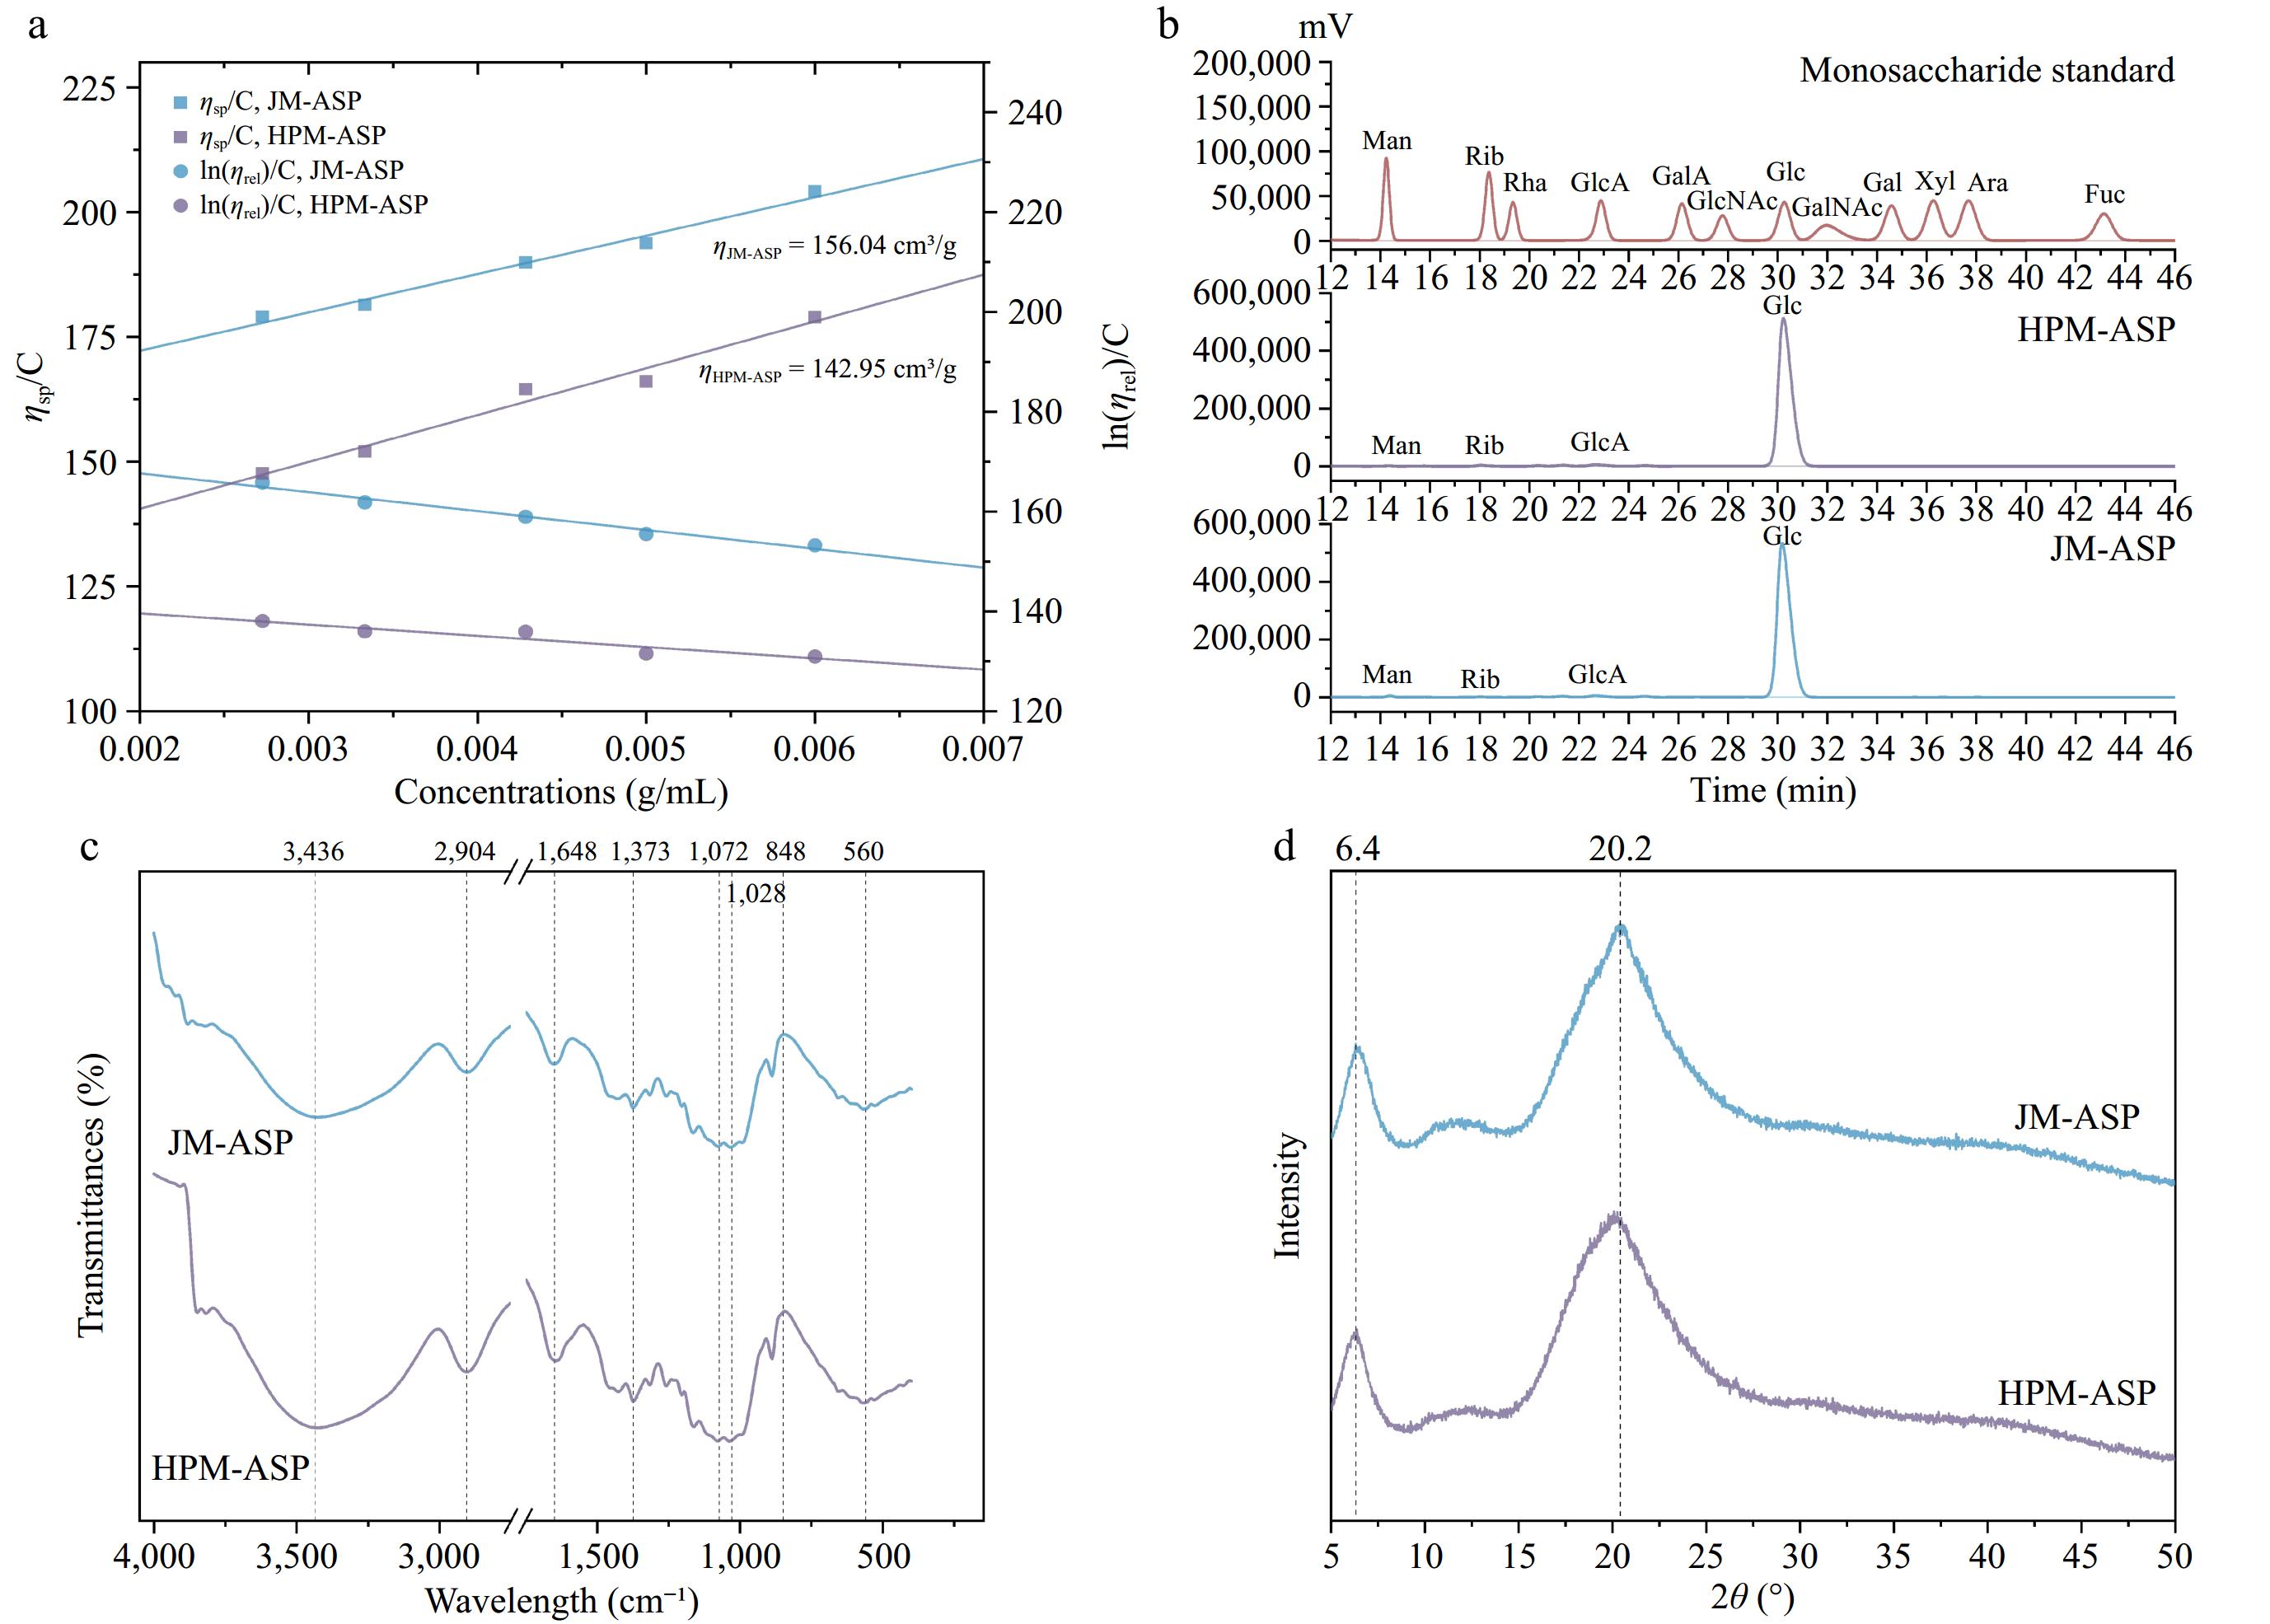
Figure 2.
Physicochemical properties and structural characterization of ASPs. (a) Intrinsic viscosity. (b) Monosaccharide composition. Peak identity: Man, mannose; Rib, ribose; Rha, rhamnose; GlcA, glucuronic acid; GalA, galacturonic acid; GlcNAc, N-acetylglucosamine; Glc, glucose; GalNAc, N-acetylgalactosamine; Gal, galactose; Xyl, xylose; Ara, arabinose; Fuc, fucose. (c) FTIR. (d) XRD.
-
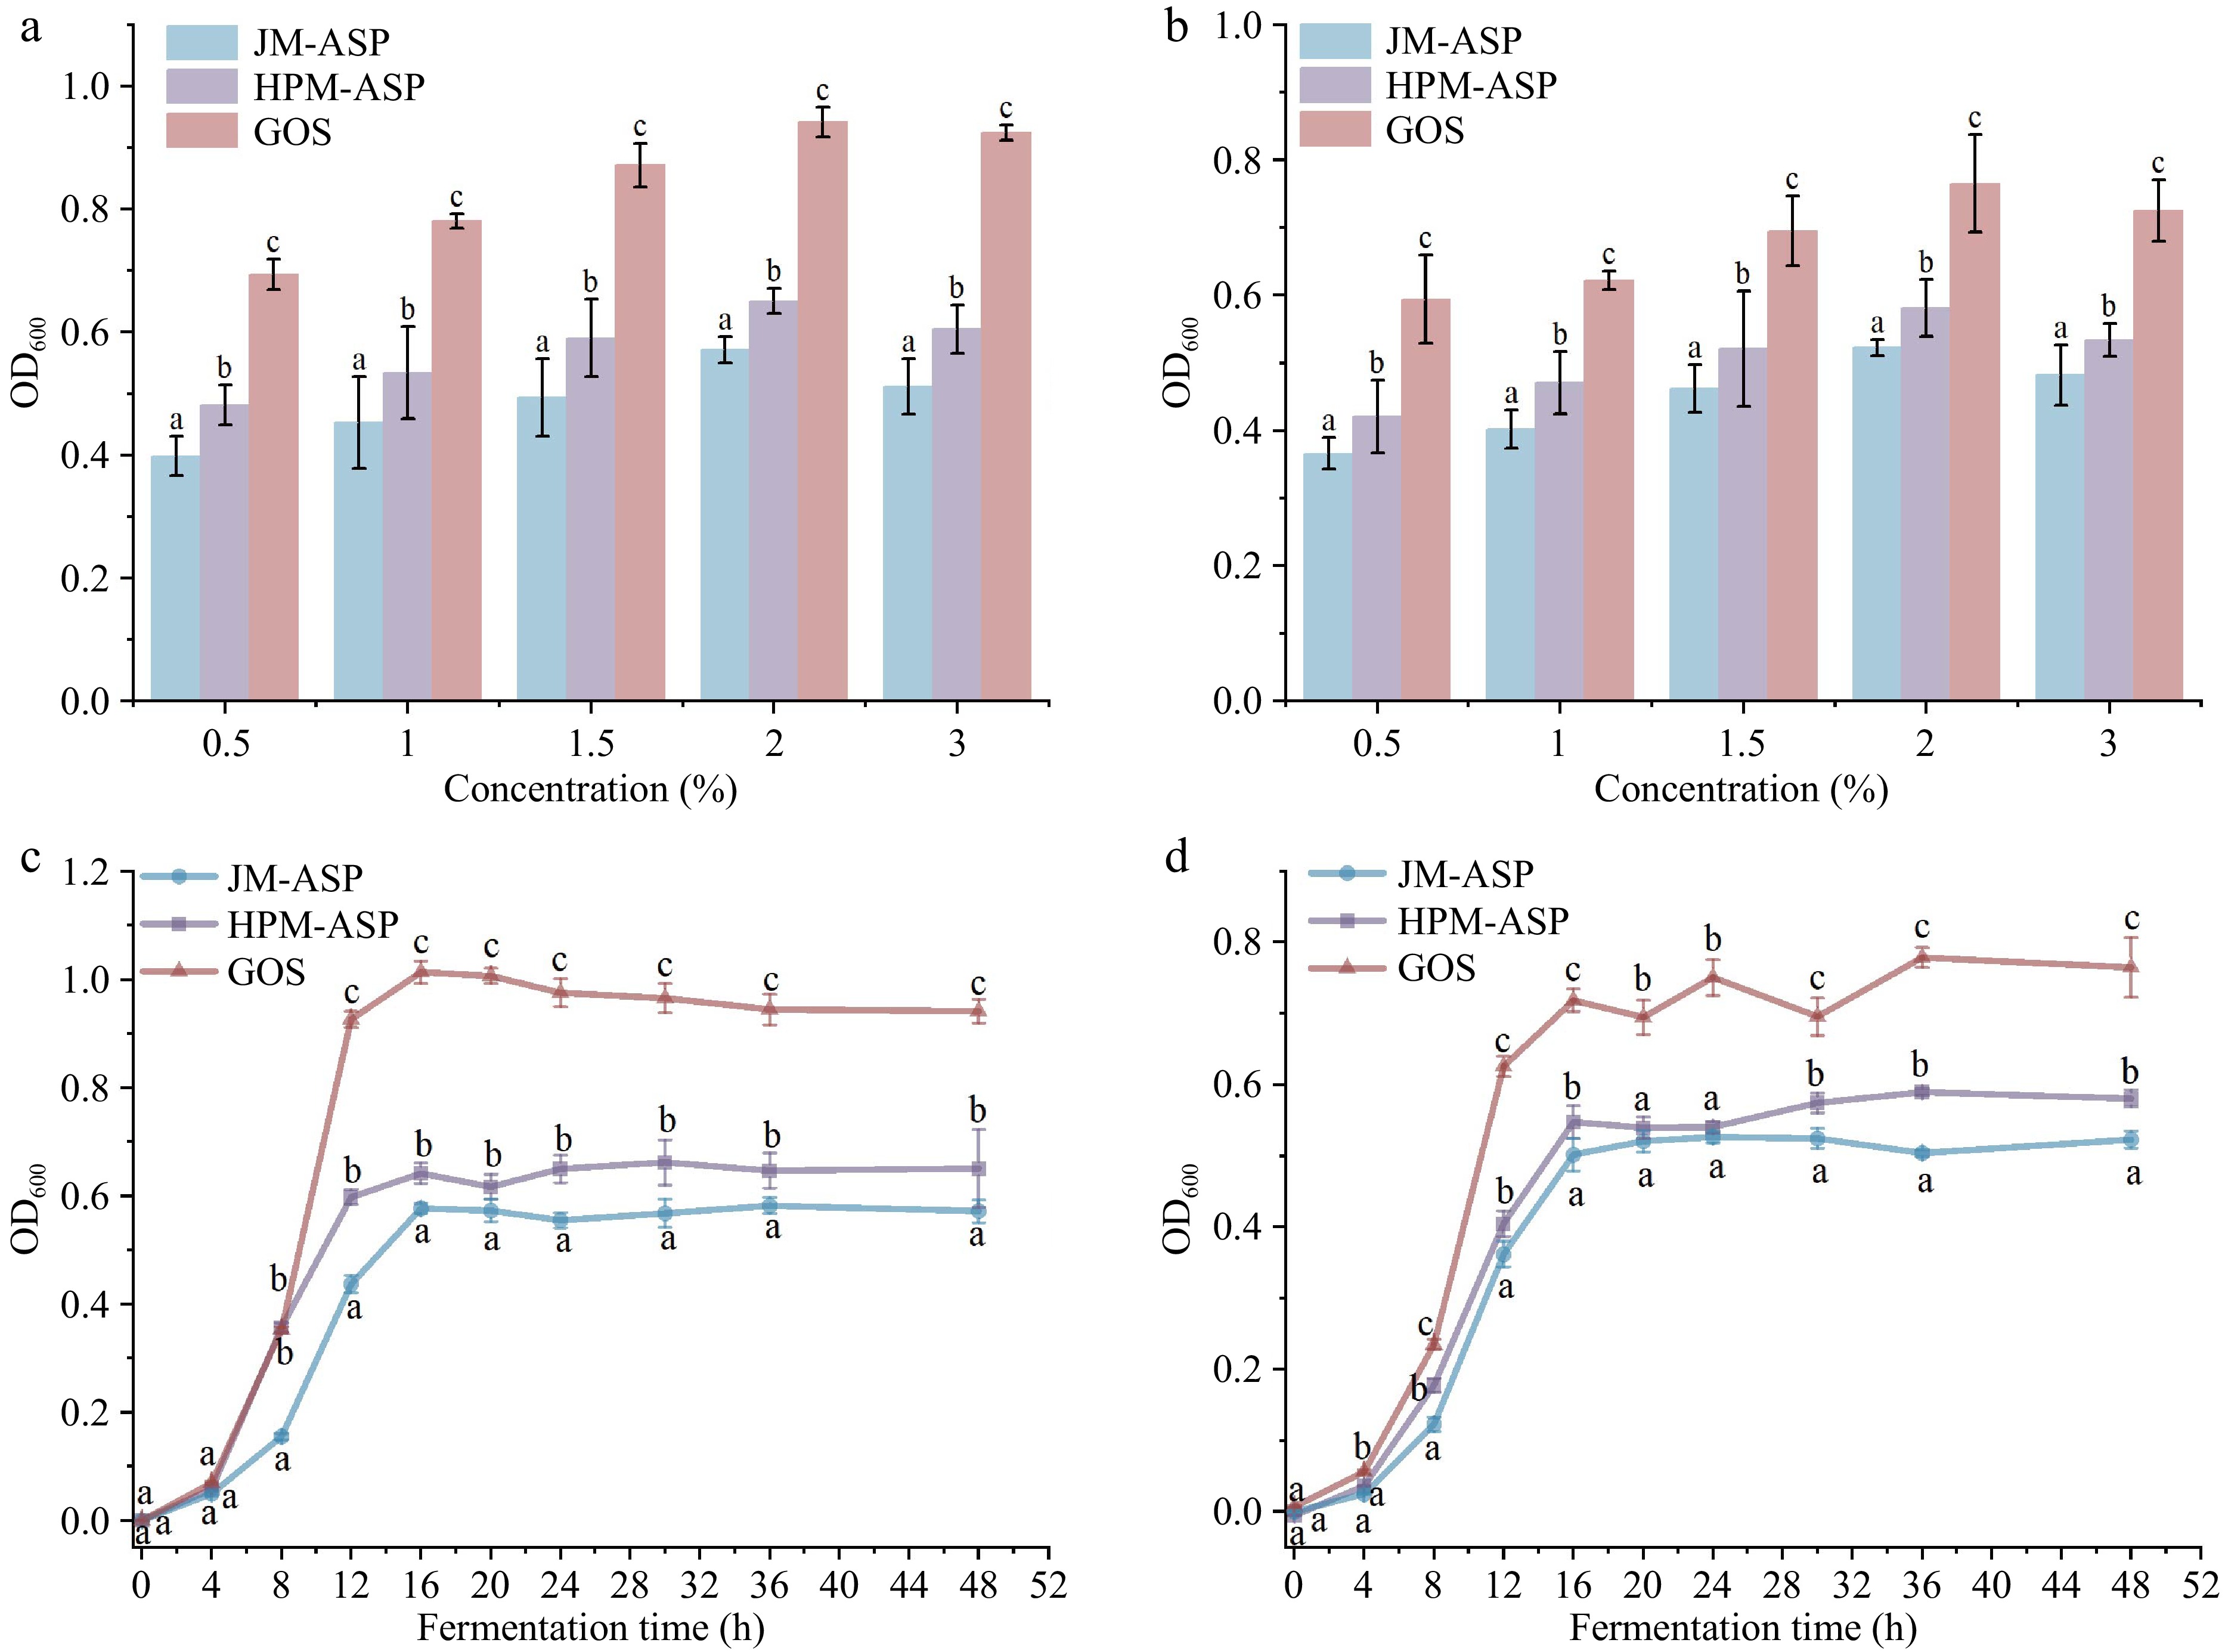
Figure 3.
Effect of GOS and ASPs on the prebiotic activity. (a) Proliferation of LGG after 48 h. (b) Proliferation of BB-12 after 48 h. (c) Growth curves of LGG over 48 h. (d) Growth curves of BB-12 over 48 h.
-
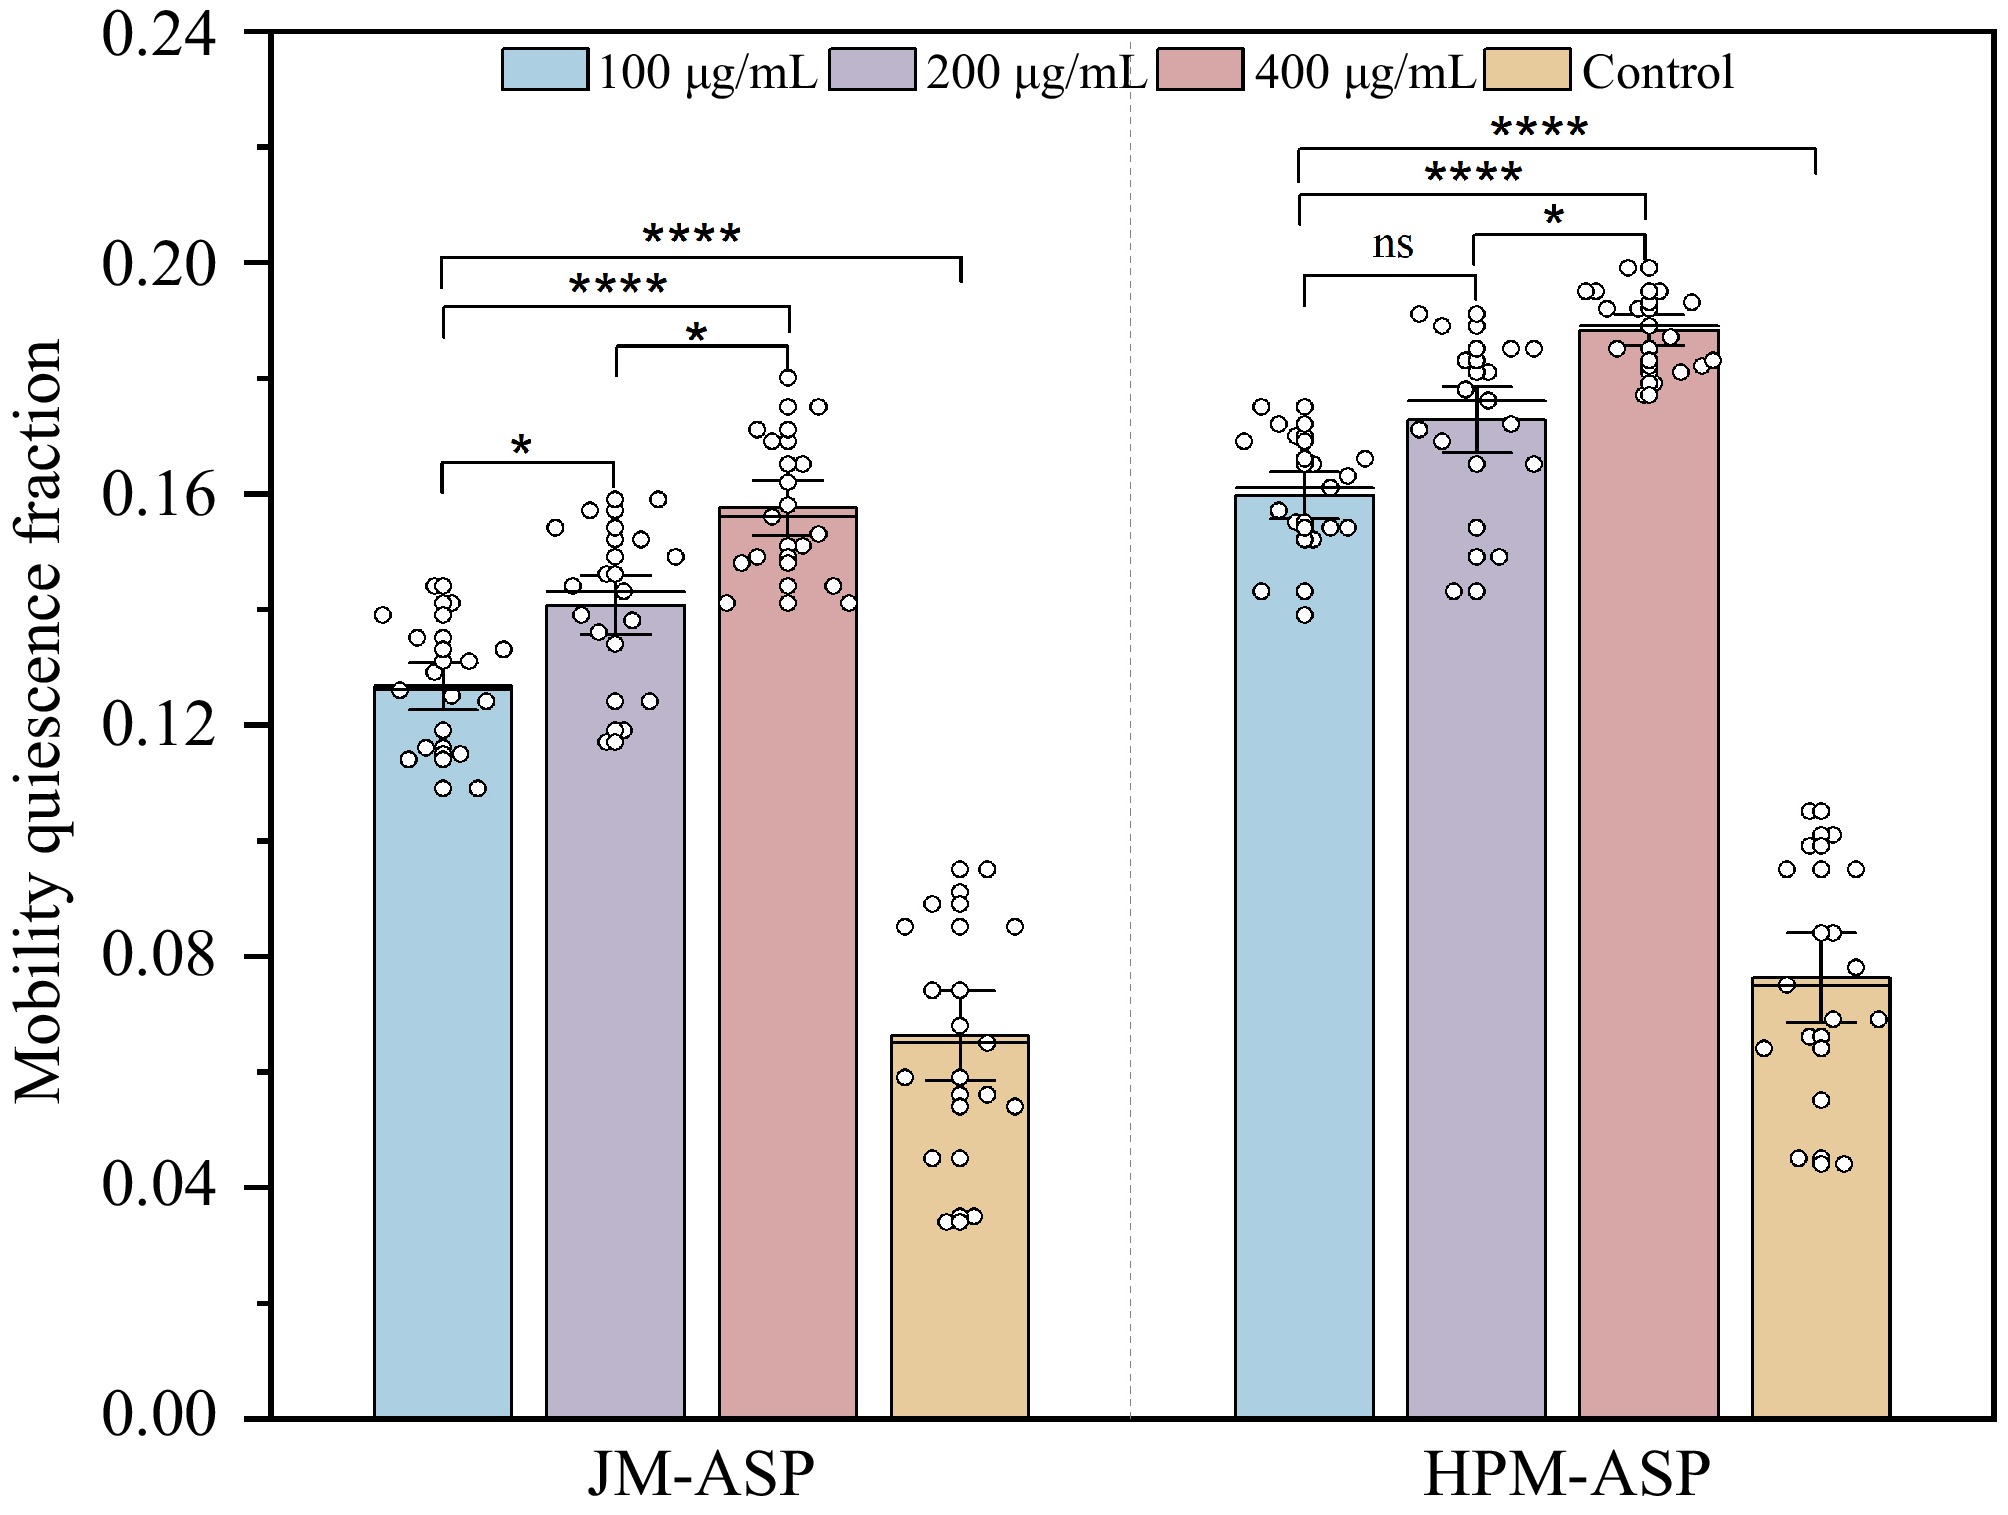
Figure 4.
Mobility quiescence fraction of JM-ASP and HPM-ASP in C. elegans exposed to different concentrations. Values are presented as the mean ± SD, and the data were analyzed by ANOVA using SPSS 25.0, * p < 0.05, ** p < 0.01, *** p < 0.001, **** p < 0.0001, and ns (not significant) p > 0.05.
-
Sample D10 (μm) D50 (μm) D90 (μm) Span JM-treated 13.70 ± 0.01a 31.60 ± 0.01a 63.70 ± 0.01a 1.58 ± 0.01a HPM-treated 22.47 ± 0.06b 75.20 ± 0.09b 149.20 ± 0.58b 1.69 ± 0.01b Note: Different letters superscripted in the results were significantly different at p < 0.05. Table 1.
Particle size distribution of P.cocos powders.
-
Sample L* a* b* ΔE JM-treated 85.15 ± 0.01a 1.74 ± 0.01a 9.96 ± 0.04a 14.08 ± 0.04a HPM-treated 83.95 ± 0.10b 2.03 ± 0.02b 10.56 ± 0.07b 14.31 ± 0.15b Different letters superscripted in the results were significantly different at p < 0.05. Table 2.
The color difference of P.cocos powders.
-
Sample WHC (g·g−1) OHC (g·g−1) SC (mL g−1) JM-treated 3.47 ± 0.22a 1.41 ± 0.01a 3.41 ± 0.16a HPM-treated 6.95 ±0.27b 3.46 ± 0.02b 3.96 ± 0.11b Different letters superscripted in the results were significantly different at p < 0.05. Table 3.
Water-holding capacity (WHC), oil-holding capacity (OHC), and swelling capacity (SC) of P. cocos powders.
-
Extraction yield (%) Total carbohydrate (%) Protein (%) Uronic acid (%) Crystallinity index (%) JM-ASP 78.75 ± 1.70a 91.23 ± 0.24a 0.91 ± 0.01a 2.56 ± 0.11a 14.20 ± 1.12a HPM-ASP 89.14 ± 4.67b 94.56 ± 0.02b 0.42 ± 0.02b 2.23 ± 0.08b 8.23 ± 0.85b Yield, (Weight of crude polysaccharide / Weight of P.cocos powder) × 100. Different letters superscripted in the results were significantly different at p < 0.05. Table 4.
The chemical compositions and crystallinity index of crude ASPs.
-
Monosaccharide composition (%) JM-ASP HPM-ASP Mannose 0.510 0.170 Ribose 0.205 0.520 Glucuronic acid 1.348 1.304 Galacturonic acid 0.098 0.075 Glucose 97.537 97.775 Galactomannan 0.084 0.016 Xylose 0.093 0.032 Arabinose 0.080 0.056 Fucose 0.045 0.051 Table 5.
Monosaccharide composition of the crude ASPs.
Figures
(4)
Tables
(5)