-
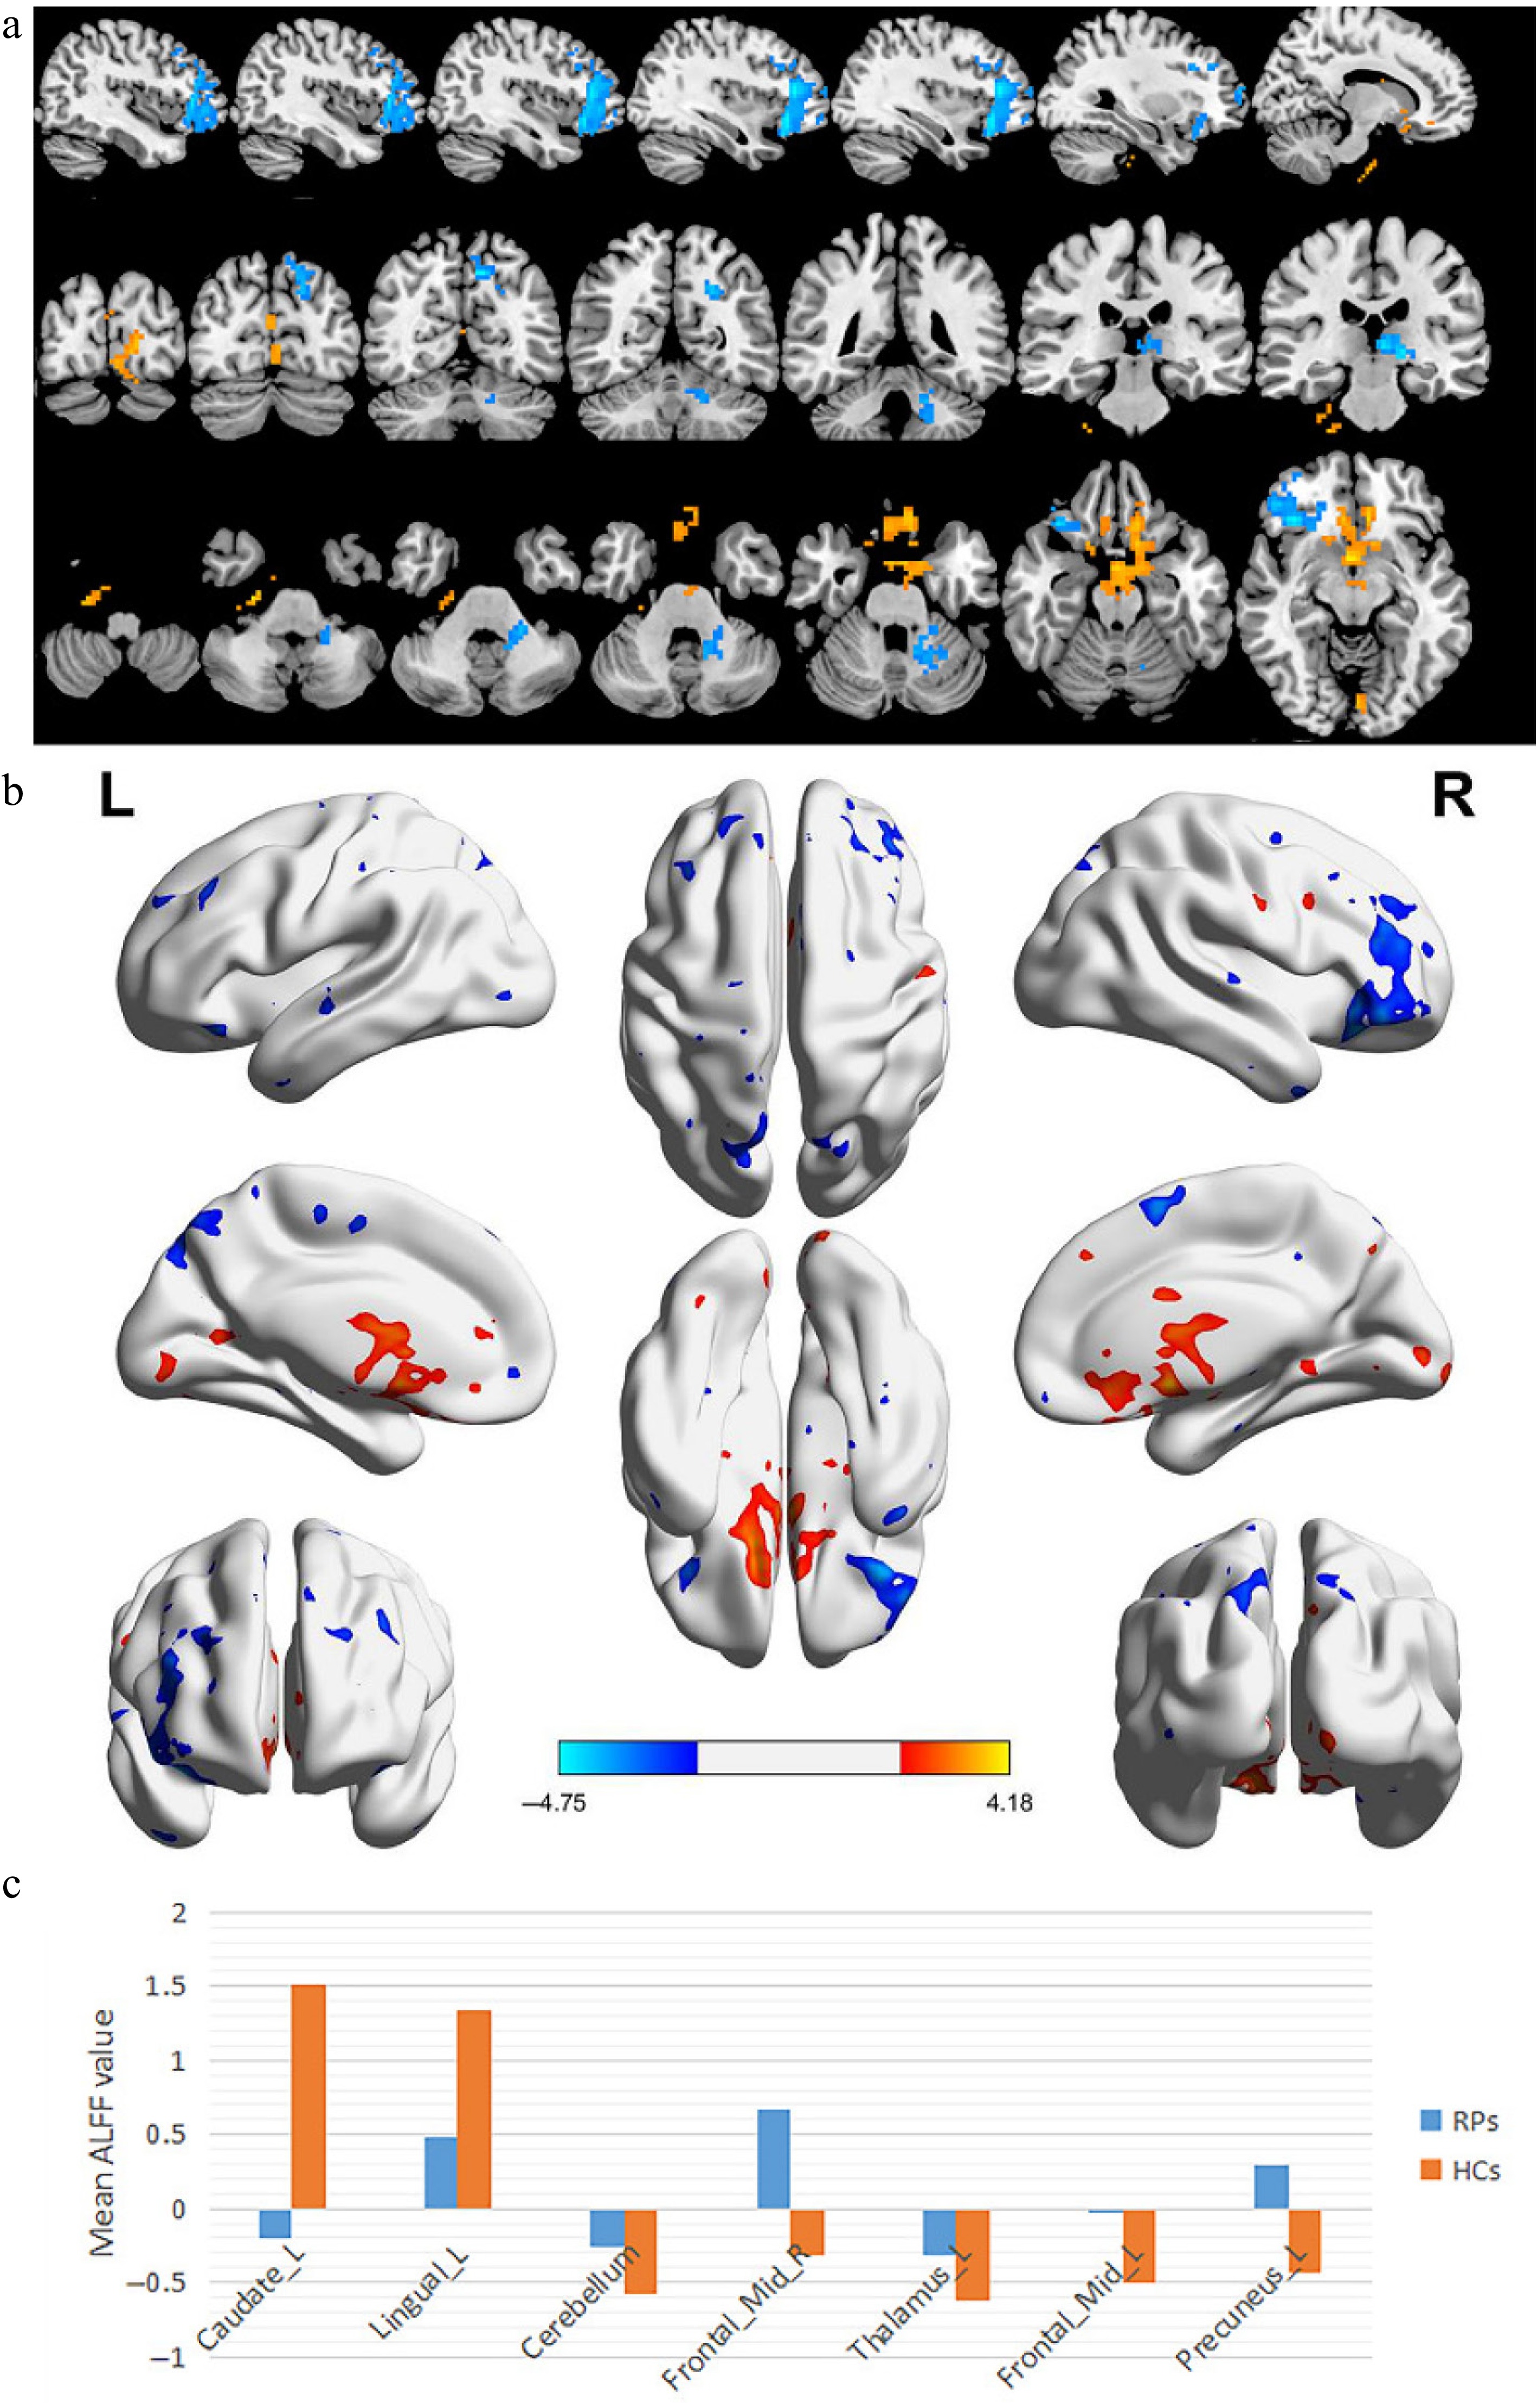
Figure 1.
(a), (b) Spontaneous brain activity in the RP and the HCs. Distinct differences of activity were detected in caudate L, lingual L, cerebellum, frontal mid R, thalamus L, frontal. Mid L, precuneus L. The red or yellow indicates higher ALFF values, while the blue indicates lower ALFF values. The significance level for multiple comparisons using Gaussian Random Field (GRF) theory is p < 0.01 (corrected by AlphaSim for clusters > 40 voxels, p < 0.01, z > 2.3). (c) The mean values of the altered ALFF values between the two groups. Abbreviations: ALFF, amplitude of low-frequency fluctuation; RP, retinitis pigmentosa; HCs, healthy controls; L, left; R, right.
-
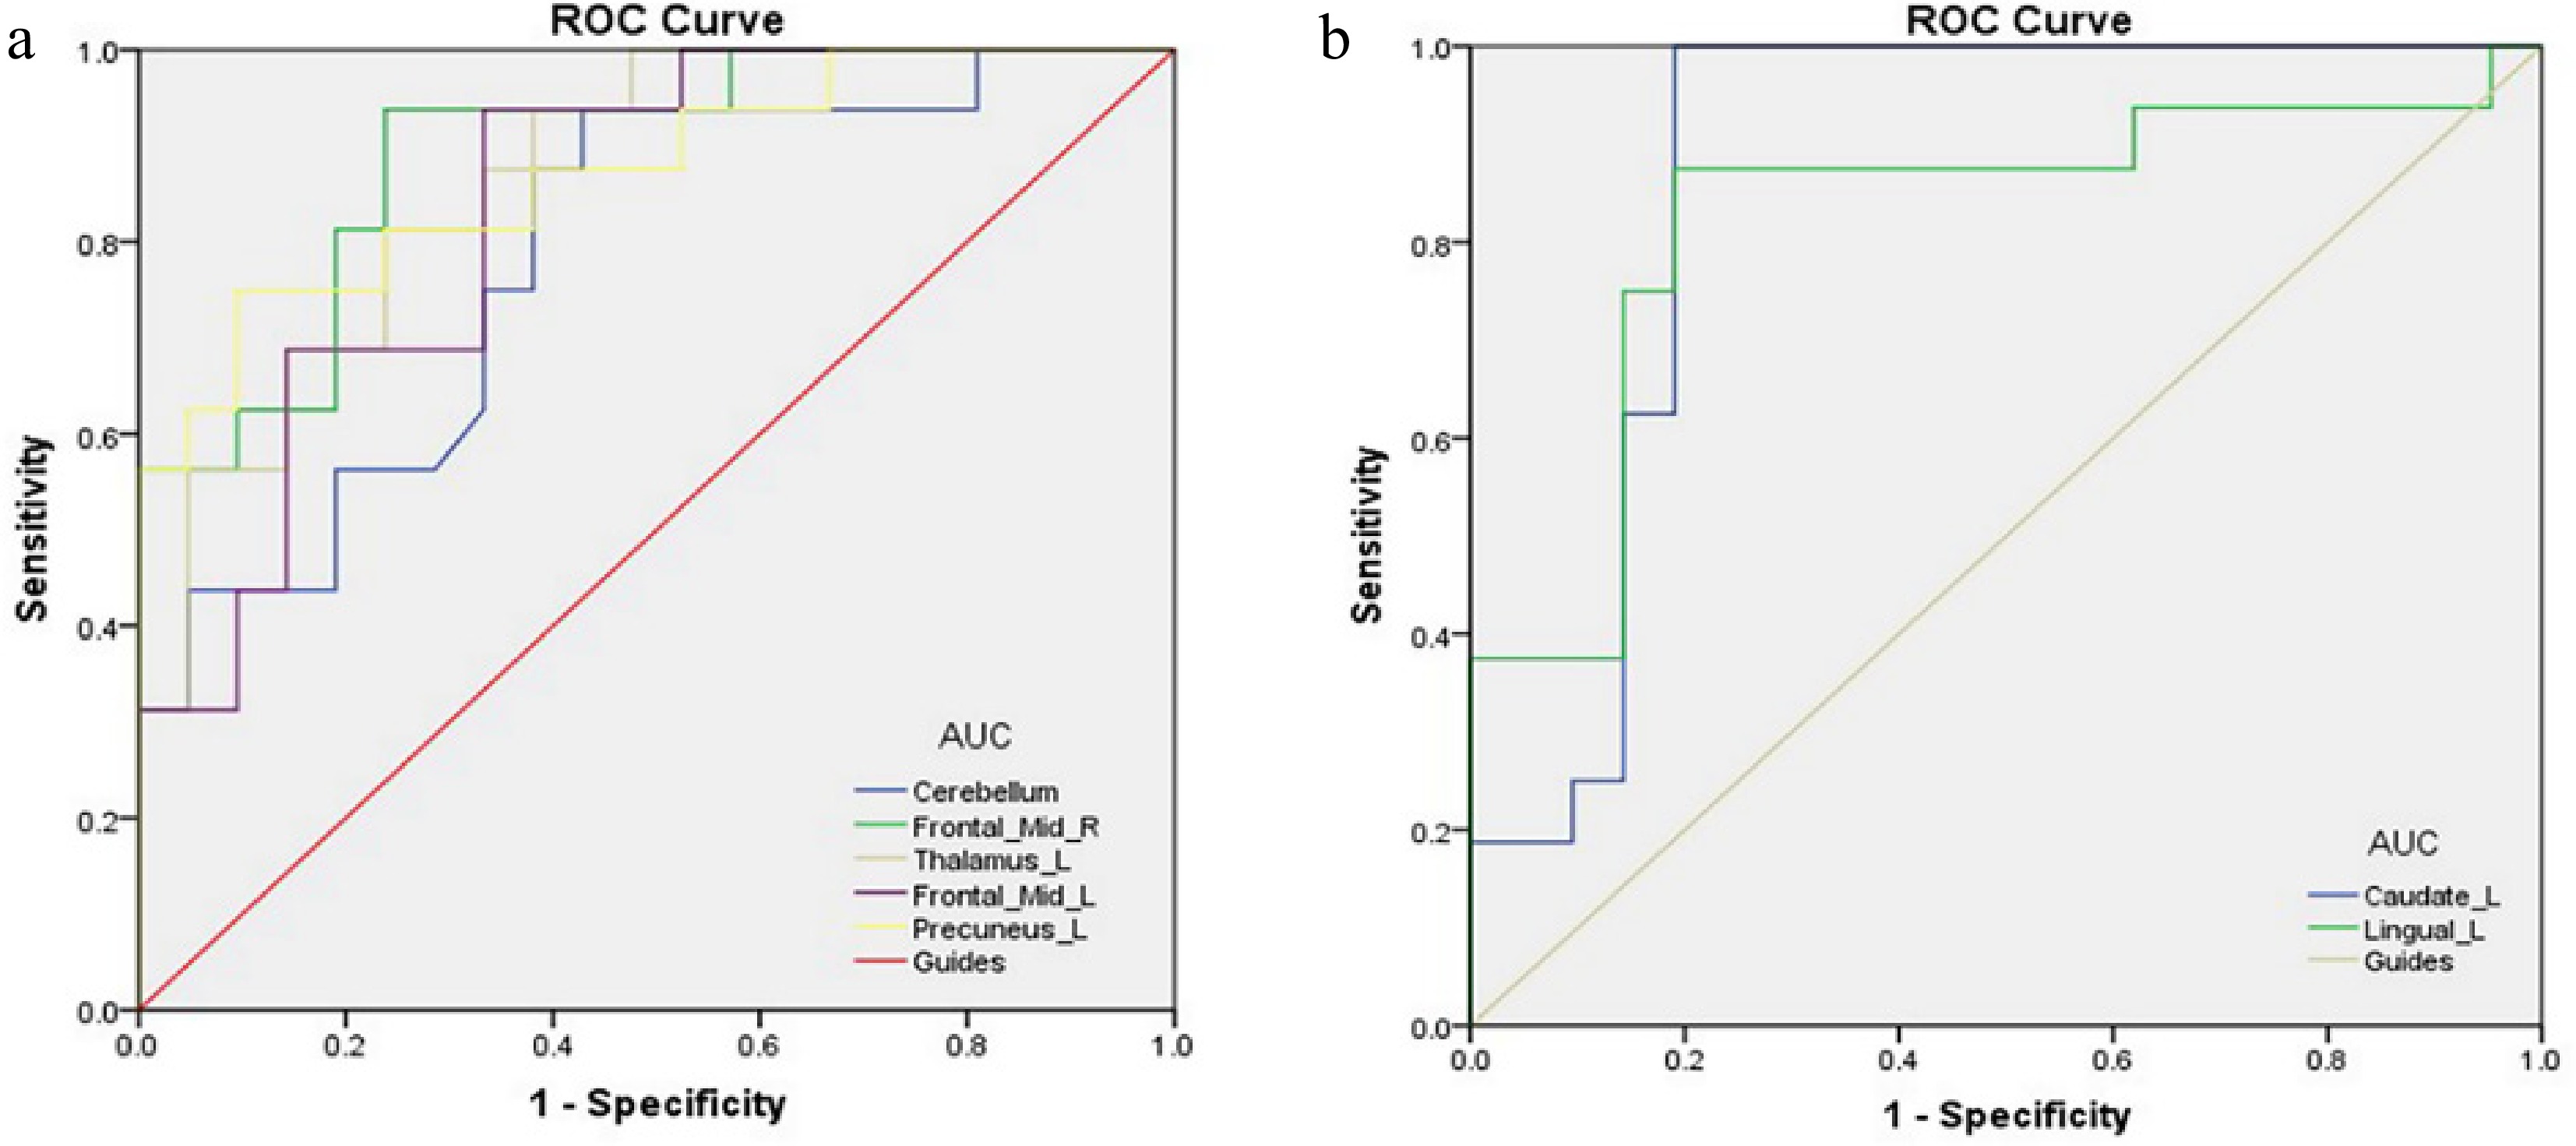
Figure 2.
ROC curve analysis of the mean ALFF values in the altered brain areas. Note: Only the average of ALFF for each brain region was included in this model. (a) ROC curve analysis of the mean ALFF value in brain areas where the mean ALFF value of the RP group was higher than the control group. The area under the ROC curve was 0.784 (p = 0.003; 95% CI: 0.636−0.933) for Cerebellum, Frontal_Mid_R 0.893 (p < 0.0001; 95% CI: 0.791−0.995), Thalamus_L 0.866 (p < 0.0001; 95% CI: 0.753−0.979), Frontal_Mid_L 0.836 (p = 0.001; 95% CI: 0.709−0.963), Precuneus_L 0.872 (p < 0.0001; 95% CI: 0.755−0.989). (b) ROC curve analysis of the mean ALFF value in brain areas where the mean ALFF value of the RP group was lower than the control group. The area under the ROC curve was 0.869 (p < 0.0001; 95% CI: 0.743−0.995) for Caudate_L, Lingual_L 0.824 (p = 0.001; 95% CI: 0.676−0.973). Abbreviations: ROC, receiver operating characteristic; ALFF, amplitude of low-frequency fluctuation; CI, confidence interval; HCs, healthy controls; RP, retinitis pigmentosa.
-
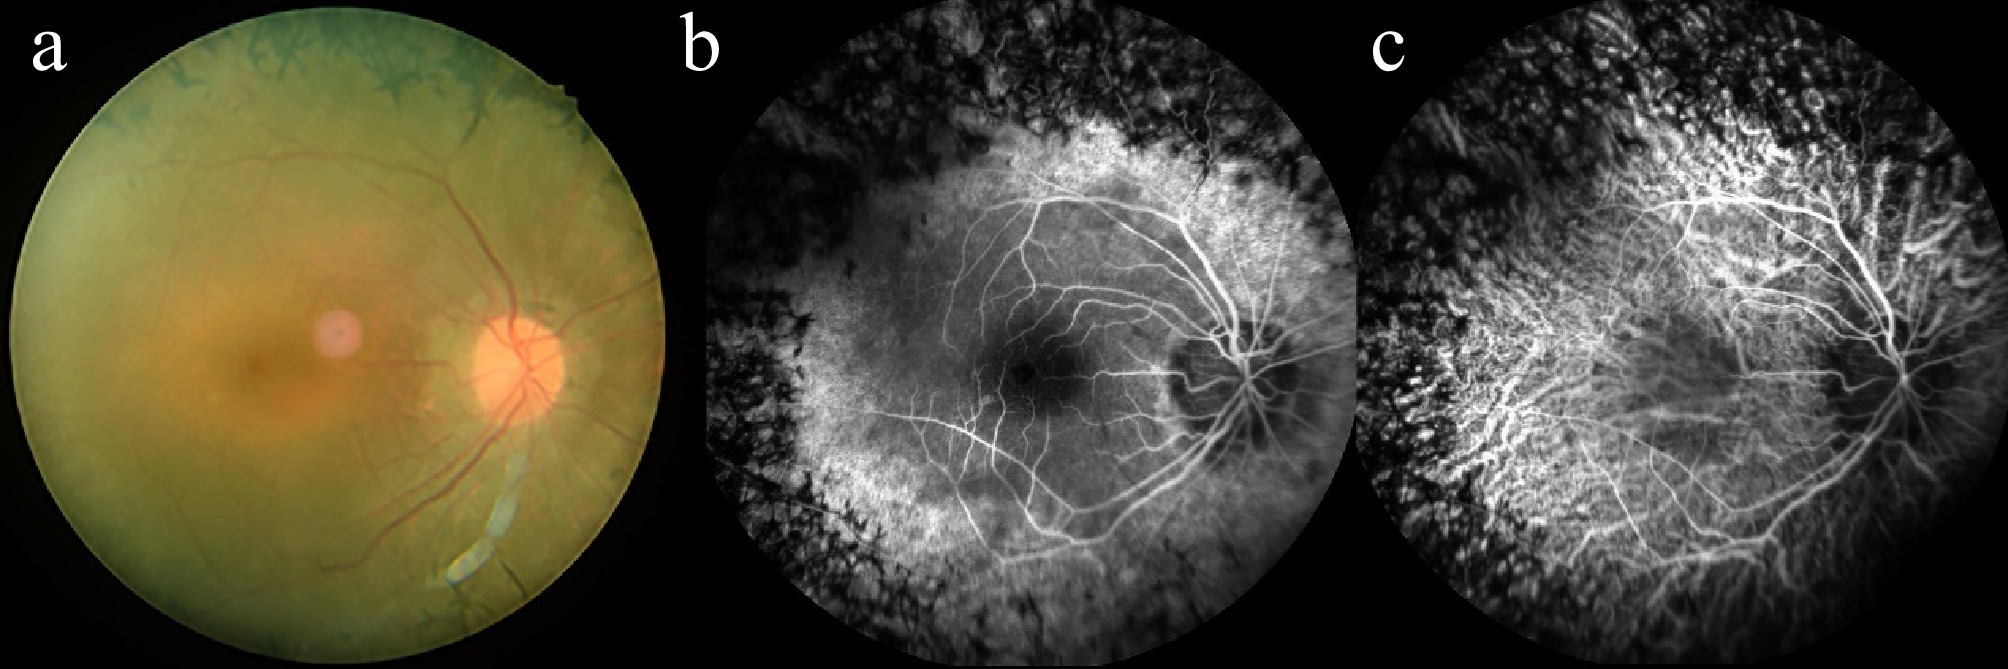
Figure 3.
Example of retinitis pigmentosa seen on (a) fundus camera, (b) fluorescence fundus angiography, and (c) indocyanine green angiography.
-
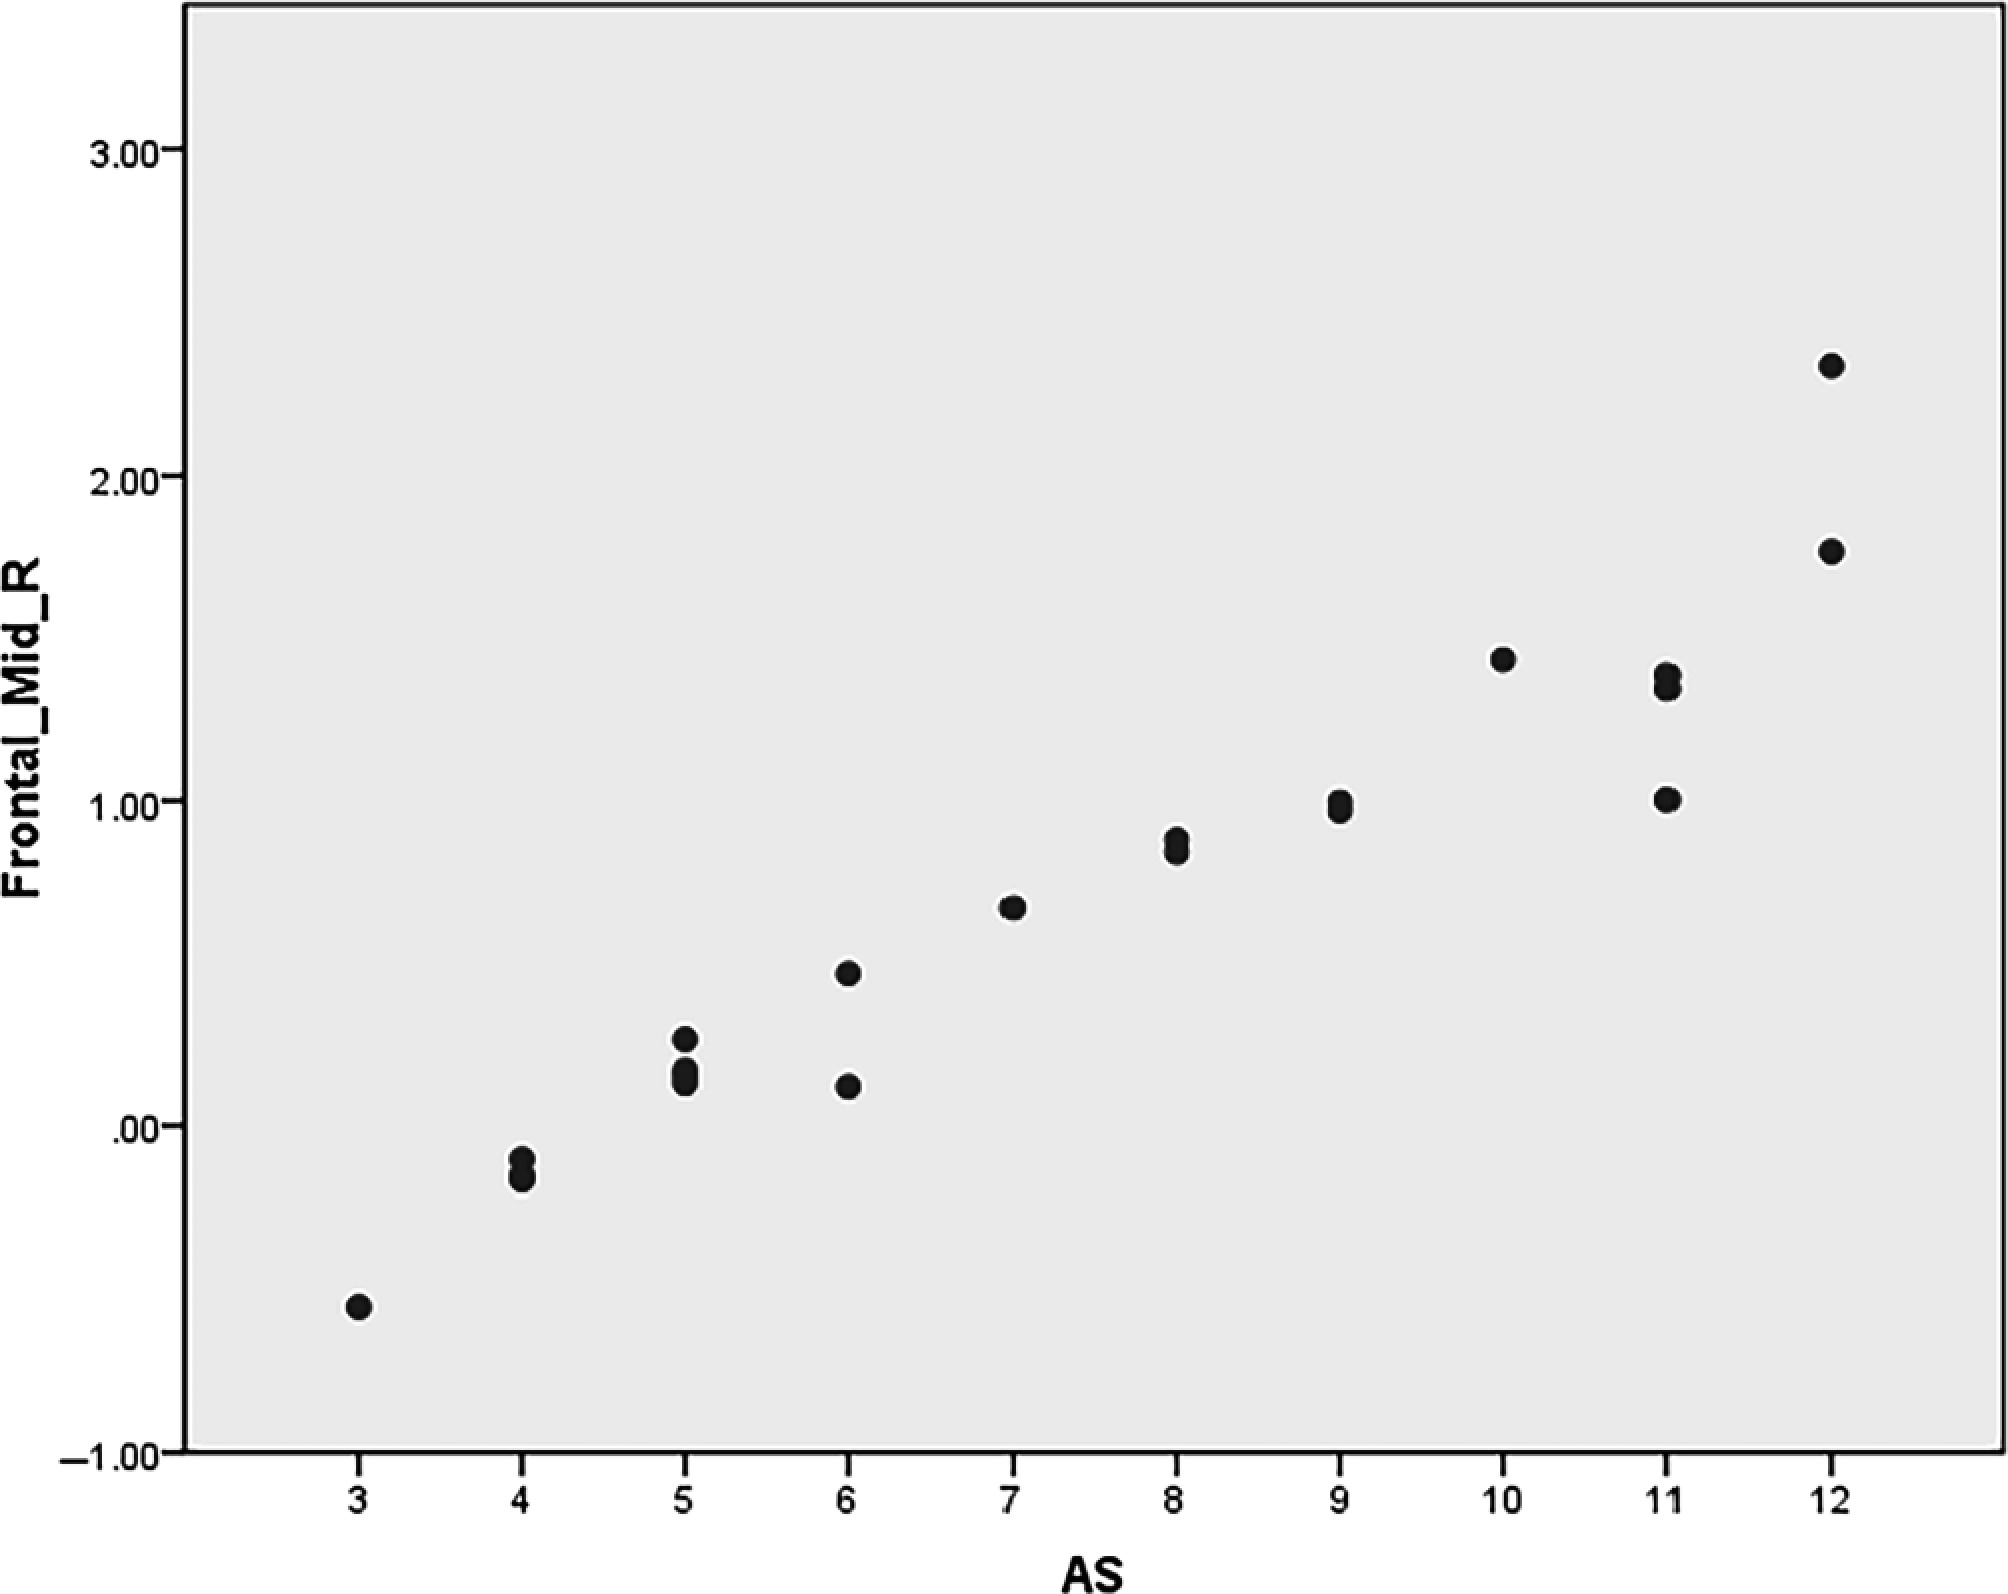
Figure 4.
The signal value of right middle frontal gyrus in RP was positively correlated with anxiety score. RP, retinitis pigmentosa; AS, anxiety score.
-
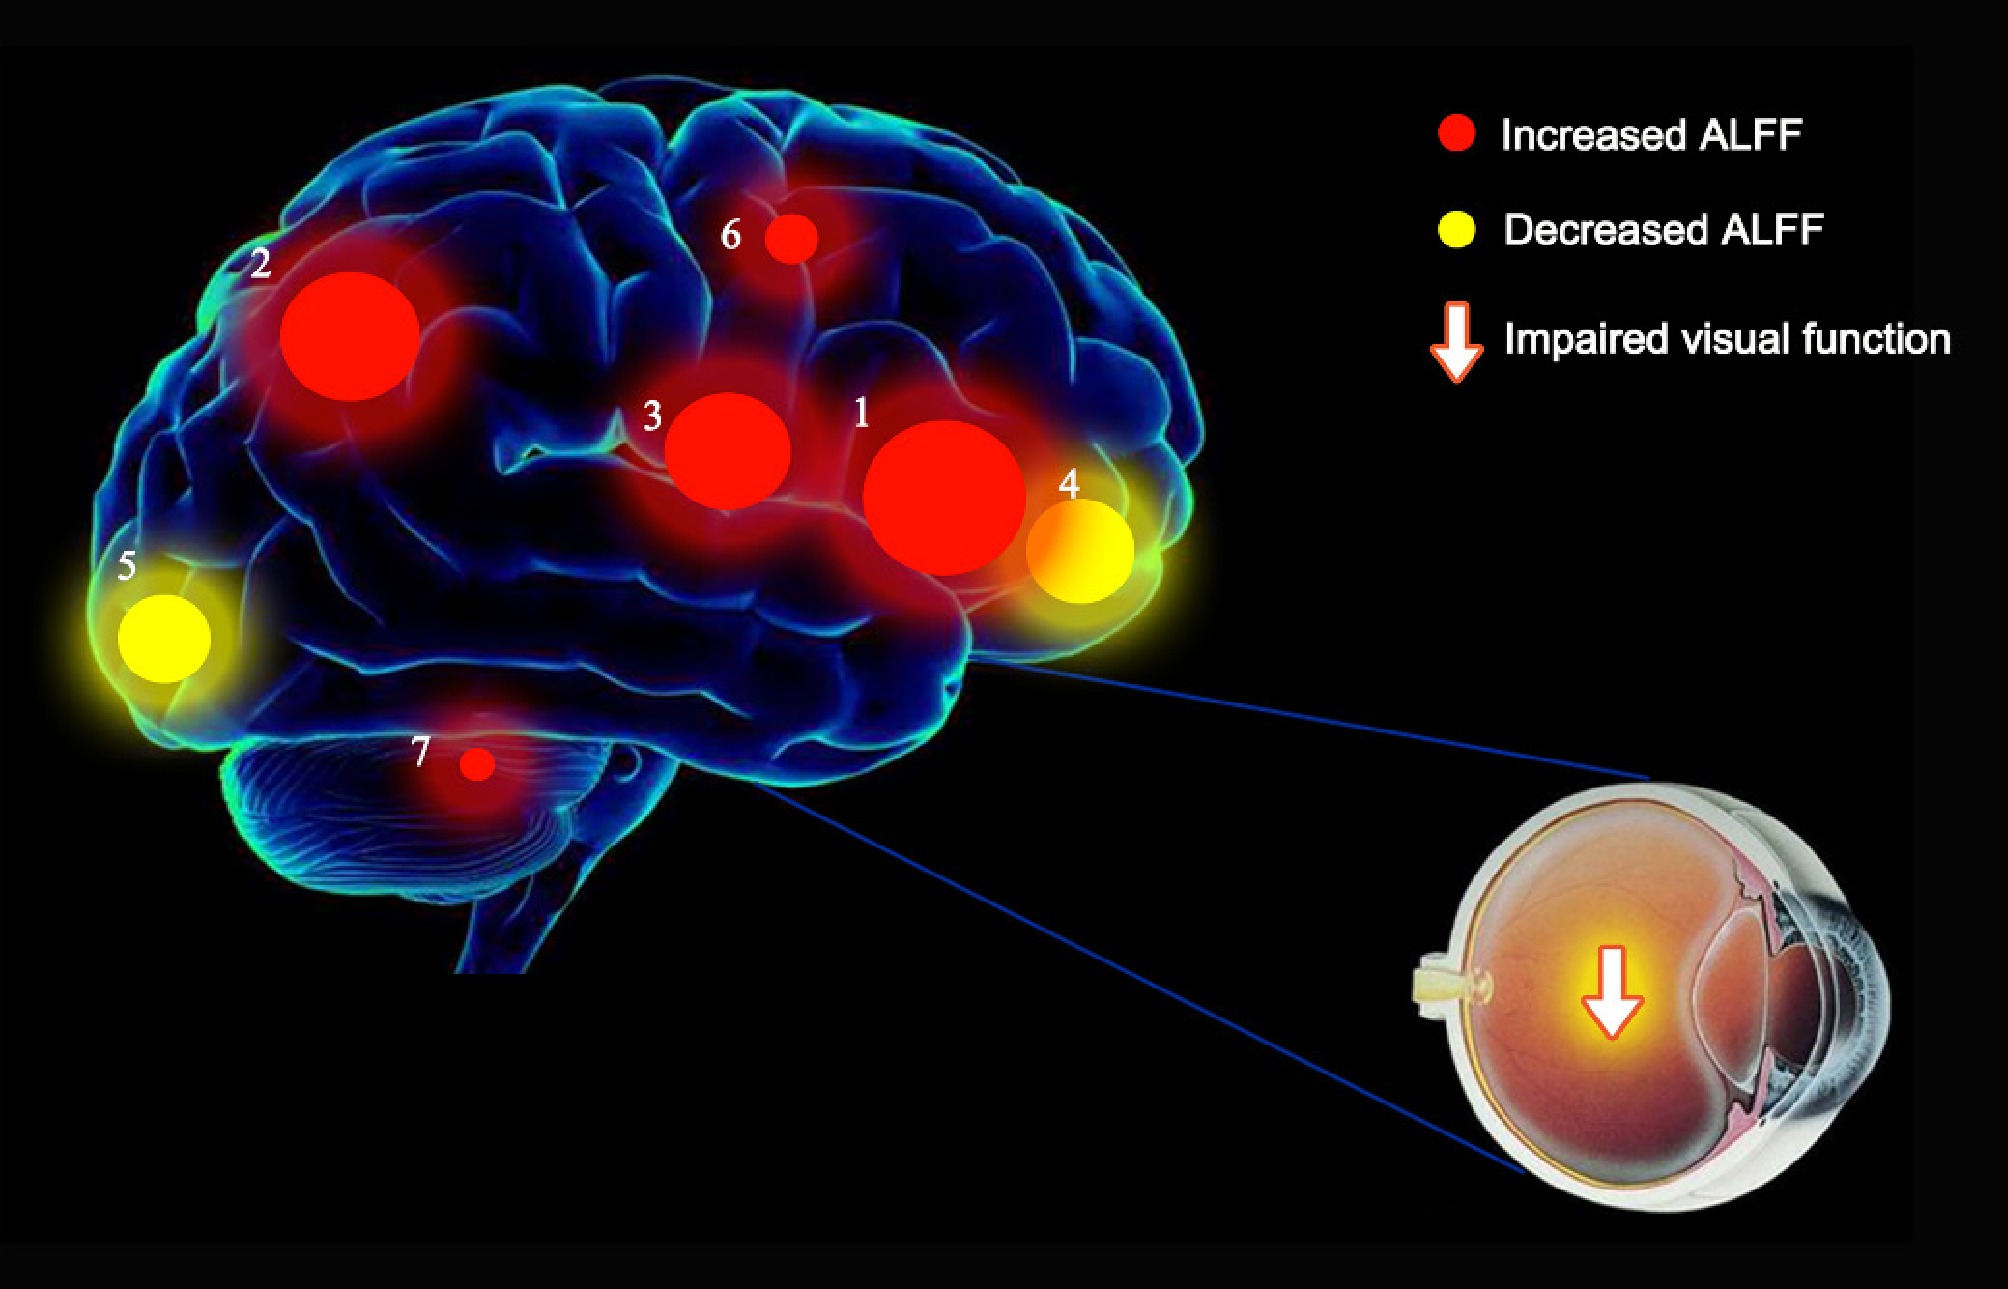
Figure 5.
The retinitis pigmentosa results of brain activity. Compared with the HCs, the ALFF values of the following regions were decreased to varying extents: 4: Caudate_L (BA 11, t = 4.18), 5: Lingual_L (BA 18, t = 3.53). Compared with the HCs, the ALFF values of the following regions were increased to varying extents: 1: Frontal_Mid_R (BA 47, t = −4.75), 2: Precuneus_L (BA 7, t = −4.48), 3: Thalamus_L (t = −4.26), 6: Frontal_Mid_L (BA 9, t = −3.53), 7: Cerebellum (t = −3.32).
-
Condition RP HCs t p-value Male/female 12/8 12/8 N/A > 0.99 Age (years) 50.67 ± 6.22 50.46 ± 5.87 0.089 0.90 Weight (kg) 61.76 ± 6.43 60.21 ± 5.76 0.065 0.81 Handedness 20 R 20 R N/A > 0.99 Duration of RP (years) 14.76 ± 4.87 N/A N/A N/A Best-corrected Va-right eye 0.35 ± 0.15 1.05 ± 0.15 −0.532 0.007* Best-corrected Va-left eye 0.50 ± 0.20 1.05 ± 0.10 −0.672 0.009* IOP-R (mmHg) 17.76 ± 1.64 16.16 ± 1.56 0.079 0.72 IOP-L (mmHg) 16.28 ± 1.87 16.45 ± 2.05 0.067 0.80 * p < 0.05 Independent t-tests comparing two groups. Abbreviations: RP, retinitis pigmentosa; HCs, healthy controls; N/A, not applicable; R, right, L, left. Table 1.
Demographics and clinical measurements between RP and HCs.
-
Brain areas (AAL template) MNI coordinates BA Peak voxels T value ROI cluster number X Y Z HCs > RP (comparison of ALFF values) Caudate_L 0 3 −15 11 935 4.18 Cluster 3 Lingual_L −3 −81 −6 18 146 3.53 Cluster 5 HCs < RP (comparison of ALFF values) Cerebellum −21 −36 −36 129 −3.32 Cluster 2 Frontal_Mid_R 36 36 12 47 615 −4.75 Cluster 4 Thalamus_L −18 −24 0 80 −4.26 Cluster 6 Frontal_Mid_L −21 42 27 9 105 −3.53 Cluster 7 Precuneus_L −12 −63 48 7 135 −4.48 Cluster 8 ALFF, amplitude of low-frequency fluctuation; AAL, anatomical automatic labeling; BA, Brodmann area; RP, retinitis pigmentosa; HCs, healthy controls; MNI, Montreal Neurological Institute; L, left; R, right; B, bilateral. Table 2.
Brain regions with statistically significant ALFF values between RP and HCs.
-
Brain regions Experimental result Brain function Anticipated results Caudate_L RP < HCs The part of the extrapyramidal system Dystonia, chorea Lingual_L RP < HCs Visual processing, word processing Visual impairment, aphasia Cerebellum RP > HCs Regulate body balance, regulate muscle tension, coordinate random movement Cerebellar ataxia, rotational movement disorder, nystagmus, imbalance and standing instability Frontal_Mid_R RP > HCs Controls spontaneous eye movement, part of the default model network Mental disorders, including depression and anxiety Thalamus_L RP > HCs Conduction pathways of various senses in the whole body Disturbance of consciousness and sleep, disturbance of thermoregulation, disturbance of endocrine metabolism, disturbance of circulation and respiration, disturbance of digestive system, and local neurological signs Frontal_Mid_L RP > HCs Controls spontaneous eye movement, part of the default model network Mental disorders Precuneus_L RP > HCs Cognitive function, episodic memory, self-related information processing Cognitive and affective disorders RP, retinitis pigmentosa; HCs, healthy controls. Table 3.
Brain region alternation and its potential impact.
-
Author Year Disease Brain areas UDs > NCs UDs < NCs Kang et al.[33] 2019 Retinal detachment FSO, ITG OL, MFG Shi et al.[10] 2020 Vitreous hemorrhage RCPL, LCPL RMFG, RIFG, LMGF, RSFG, RMFG, LMFG Lin et al.[12] 2020 Retinitis pigmentosa RCPL, LITG, RFG RMFG, BC, BP, BSFG Ling et al.[13] 2021 Hyperthyroidism exophthalmos No brain region LCFSC Peng et al.[20] 2021 Neovascular glaucoma RSFG, LMFG RC, RMOG, LCG, RP, LMFG UD, unusual disease; NCs, normal controls; LCPL, left cerebellum posterior lobe; LCG, left cingulate gyrus; LCFSC, left calcarine fissure and surrounding cortex; LMFG, left medial frontal gyrus; RC, right cuneus; RMOG, right middle occipital gyrus; RSFG, right superior frontal gyrus; RIFG, right inferior frontal gyrus; BP, bilateral precuneus; RMFG, right middle frontal gyrus; RSFG, right superior frontal gyrus; RP, right precuneus; RC, right cuneus; FSO, frontal superior orbital; ITG, inferior temporal gyrus; OL, occipital lobe; MFG, medial frontal gyrus; LITG, left inferior temporal gyrus; BC, bilateral cuneus; BSFG, bilateral superior frontal gyrus. Table 4.
Amplitude of low-frequency fluctuations method applied in ophthalmological diseases.
Figures
(5)
Tables
(4)