-
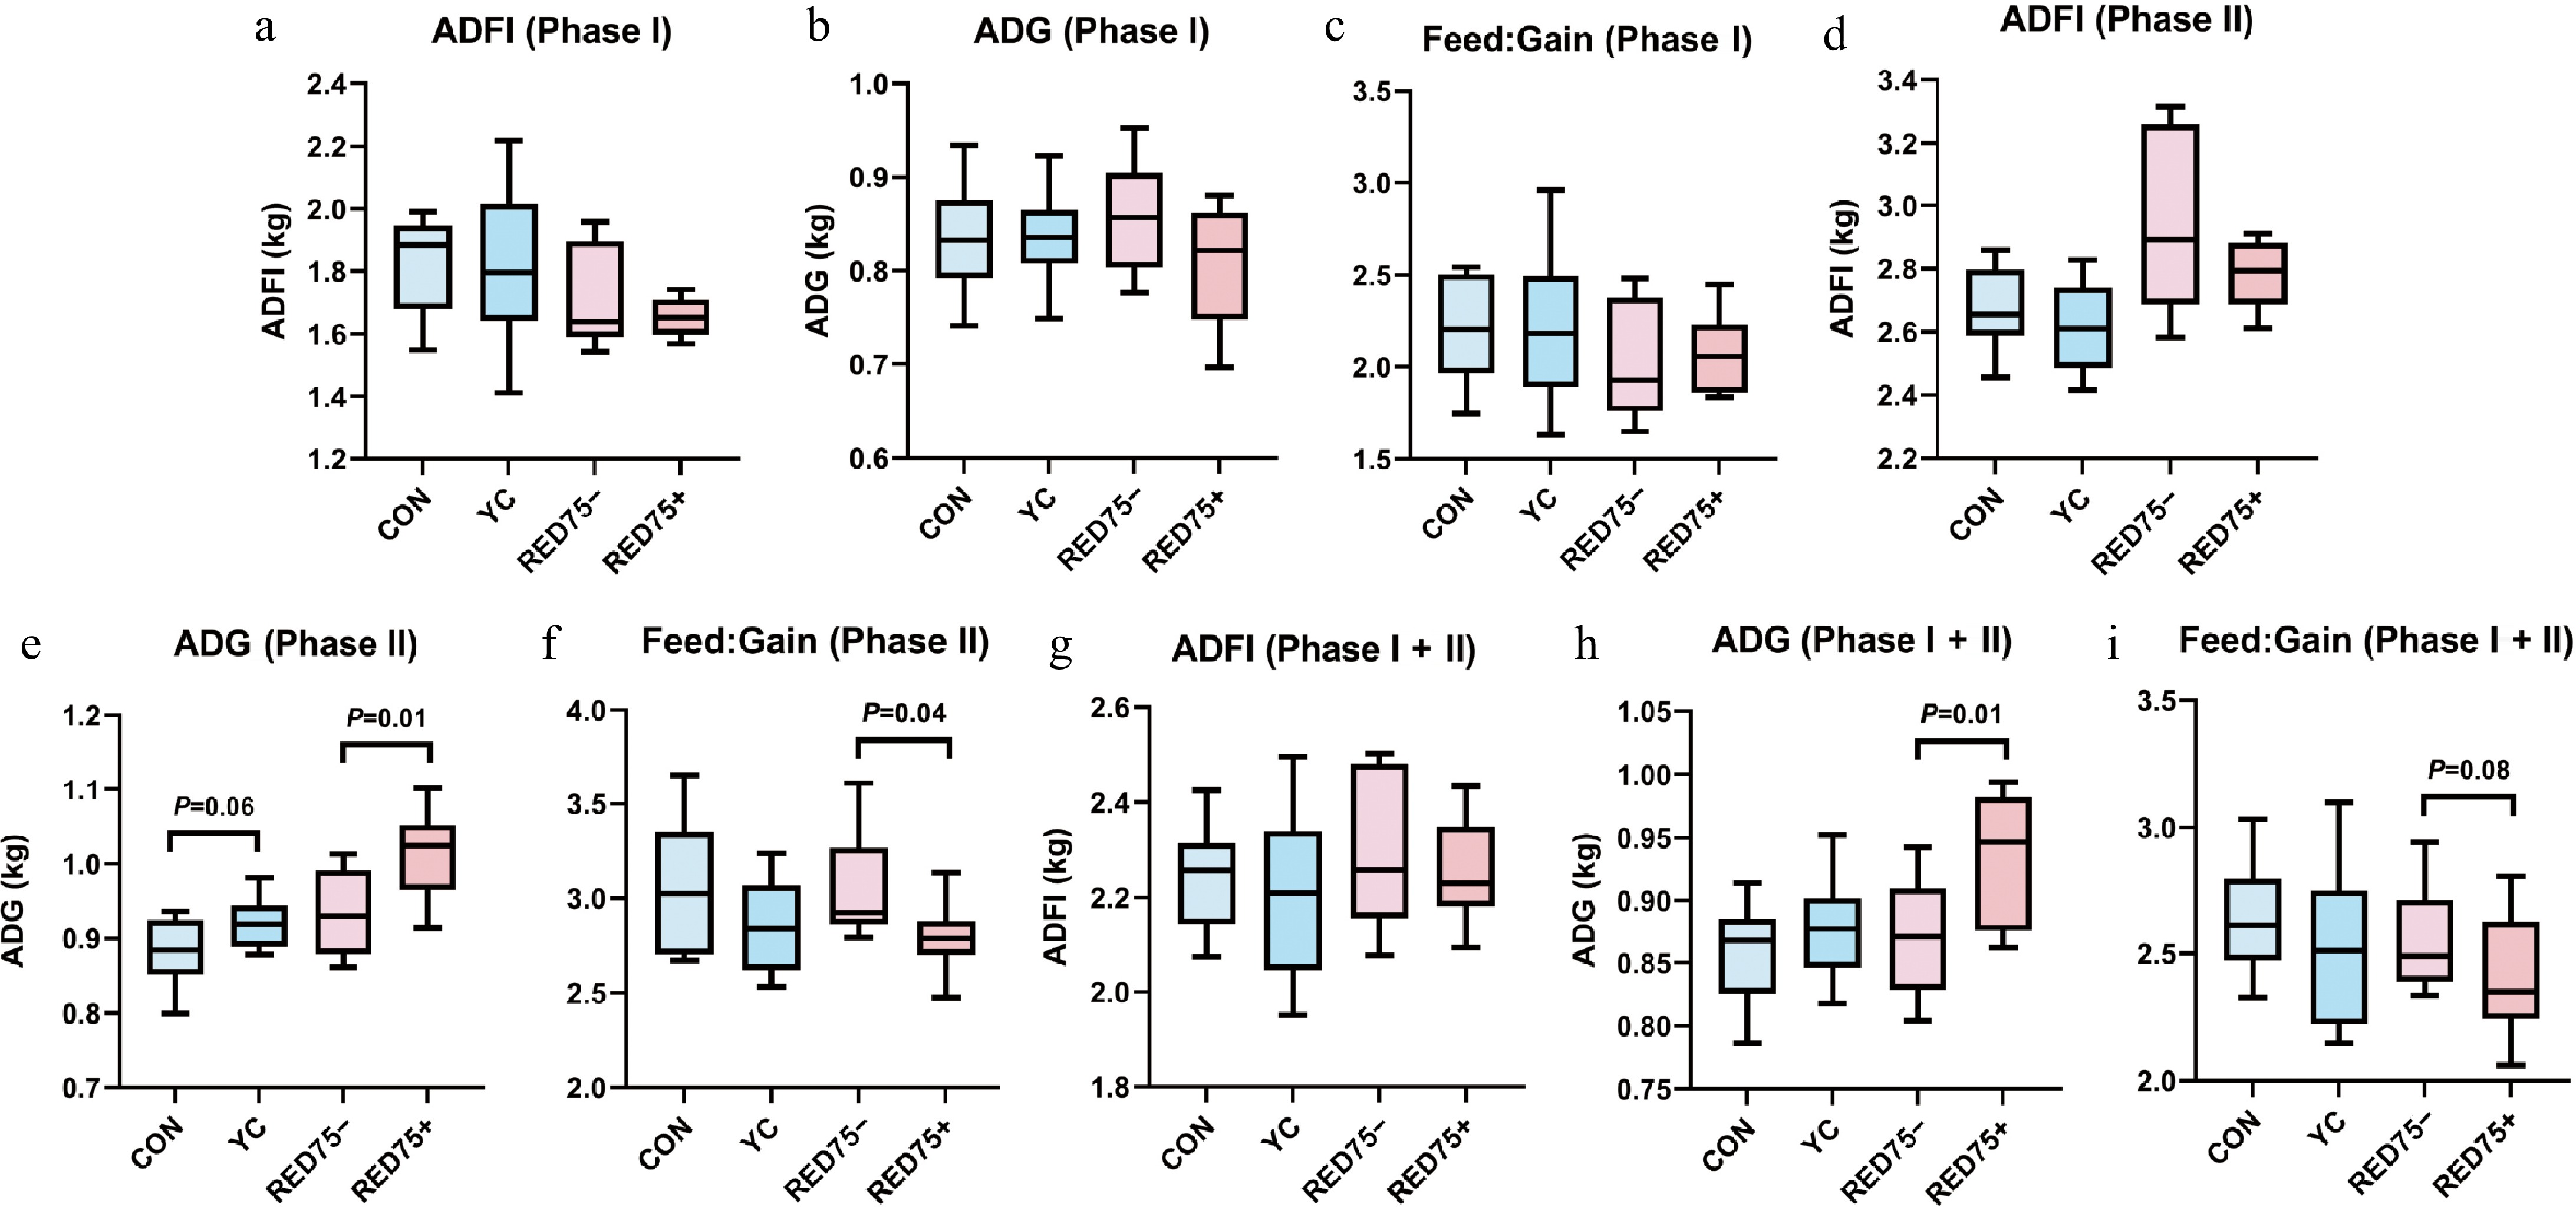
Figure 1.
Effects of supplementation of yeast-derived postbiotic on growth performance of growing pigs. Dietary treatments were: (1) CON: basal diet with normal net energy meet with China National Feeding Standard of Swine (GB/T 39235-2020); (2) YC: CON supplemented with 0.5 g/kg yeast derived postbiotic XPC Ultra diet; (3) RED75–: diet with the net energy reduced by 75 kcal/kg (comparing with CON); (4) RED75+: RED75– supplemented with 0.5 g/kg XPC Ultra diet. Pigs were fed for Phase I (30–50 kg) and Phase II (50–75 kg). ADG, average daily gain; ADFI, average daily feed intake. Bars represented standard error of mean (SEM). Student's t-test was performed when comparing CON and YC, or RED75– and RED75+. The significant level was set as p < 0.05. A trend was set as 0.05 ≤ p < 0.10.
-
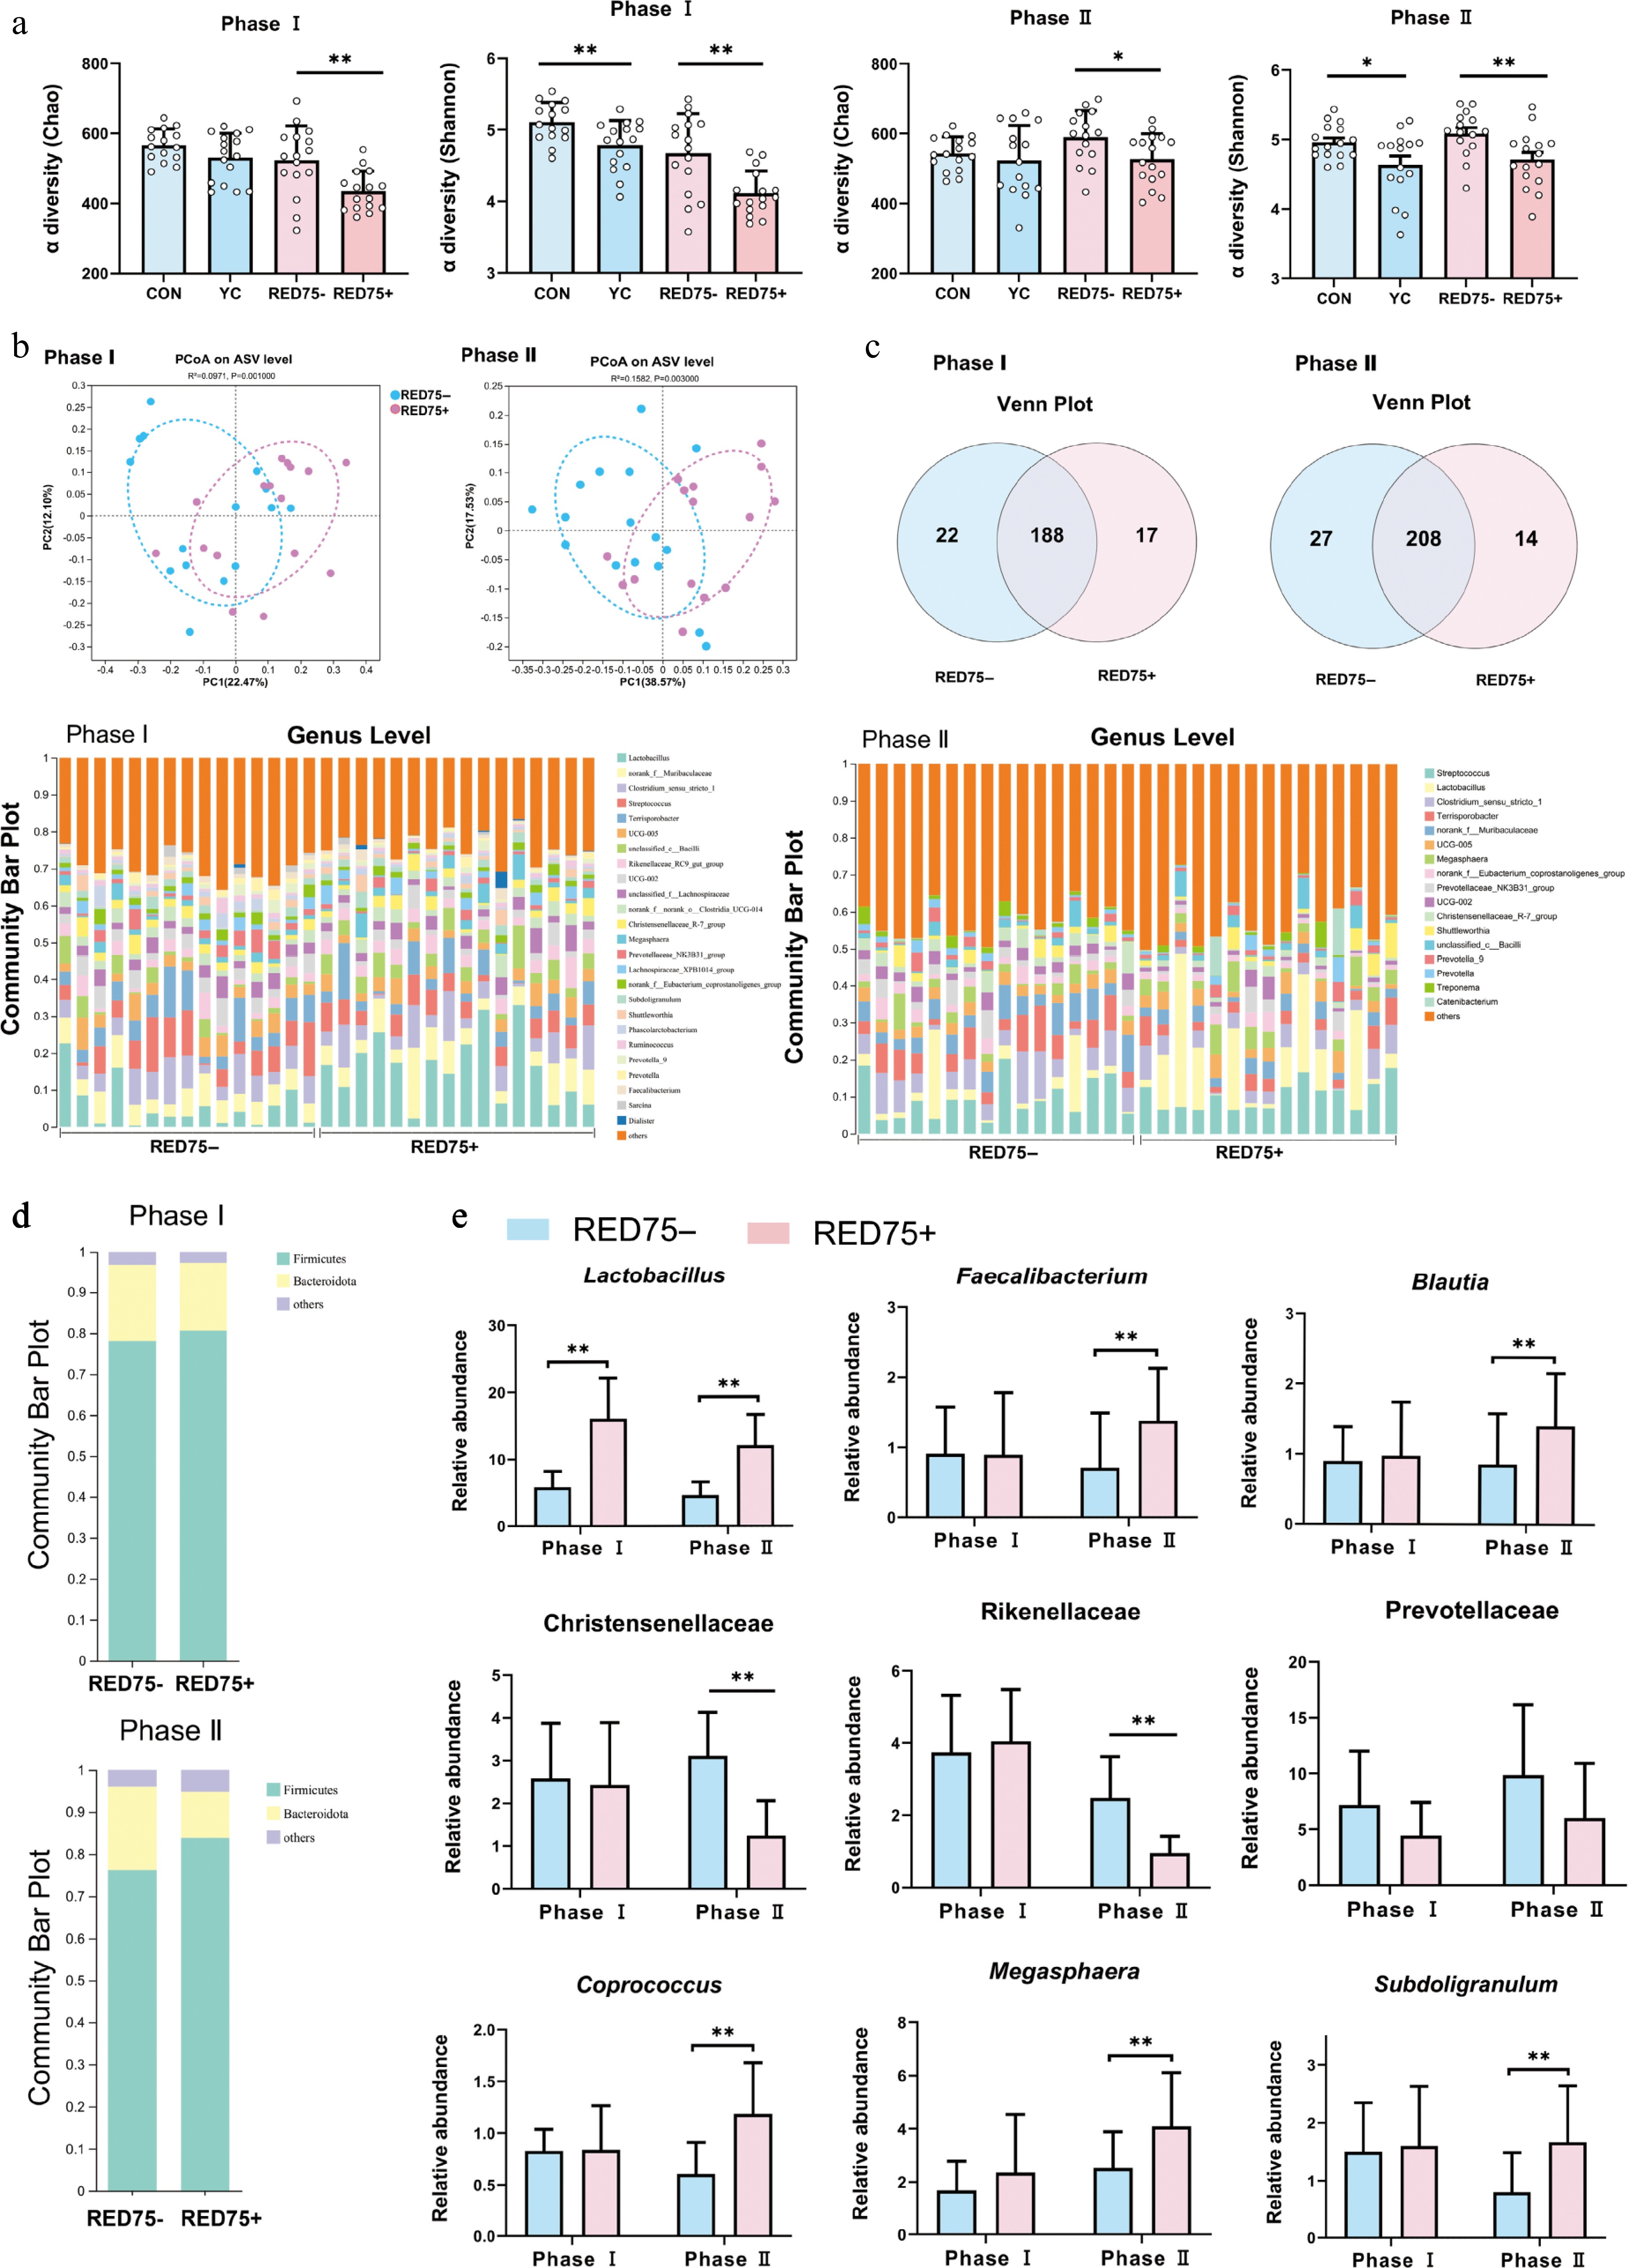
Figure 2.
Effects of supplementation of yeast-derived postbiotic and dietary energy concentration on fecal bacterial composition in Phase I and Phase II. (a) Effect on alpha-diversity represented by Chao and Shannon. (b) Effect on principal coordinates analysis (PCoA). (c) Venn diagram of genera composition of CON and YC. (d) Genus composition of CON and YC represented by the composition of individual fecal sample (n = 16). (e) Abundance of significantly altered genera. Dietary treatments were CON (basal diet); YC (CON with 0.5 g XPC Ultra/kg); RED75– (CON reduced net energy by 75 kcal); RED75+ (CON reduced net energy by 75 kcal with 0.5 g XPC Ultra/kg). Pigs were fed for Phase I (30–50 kg) and Phase II (50–75 kg). p-values were calculated using Adonis test and were adjusted by false discovery rate (FDR) correction according to Benjamini-Hochberg procedure. The significant level was set as FDR < 0.10; * presented FDR < 0.10.
-
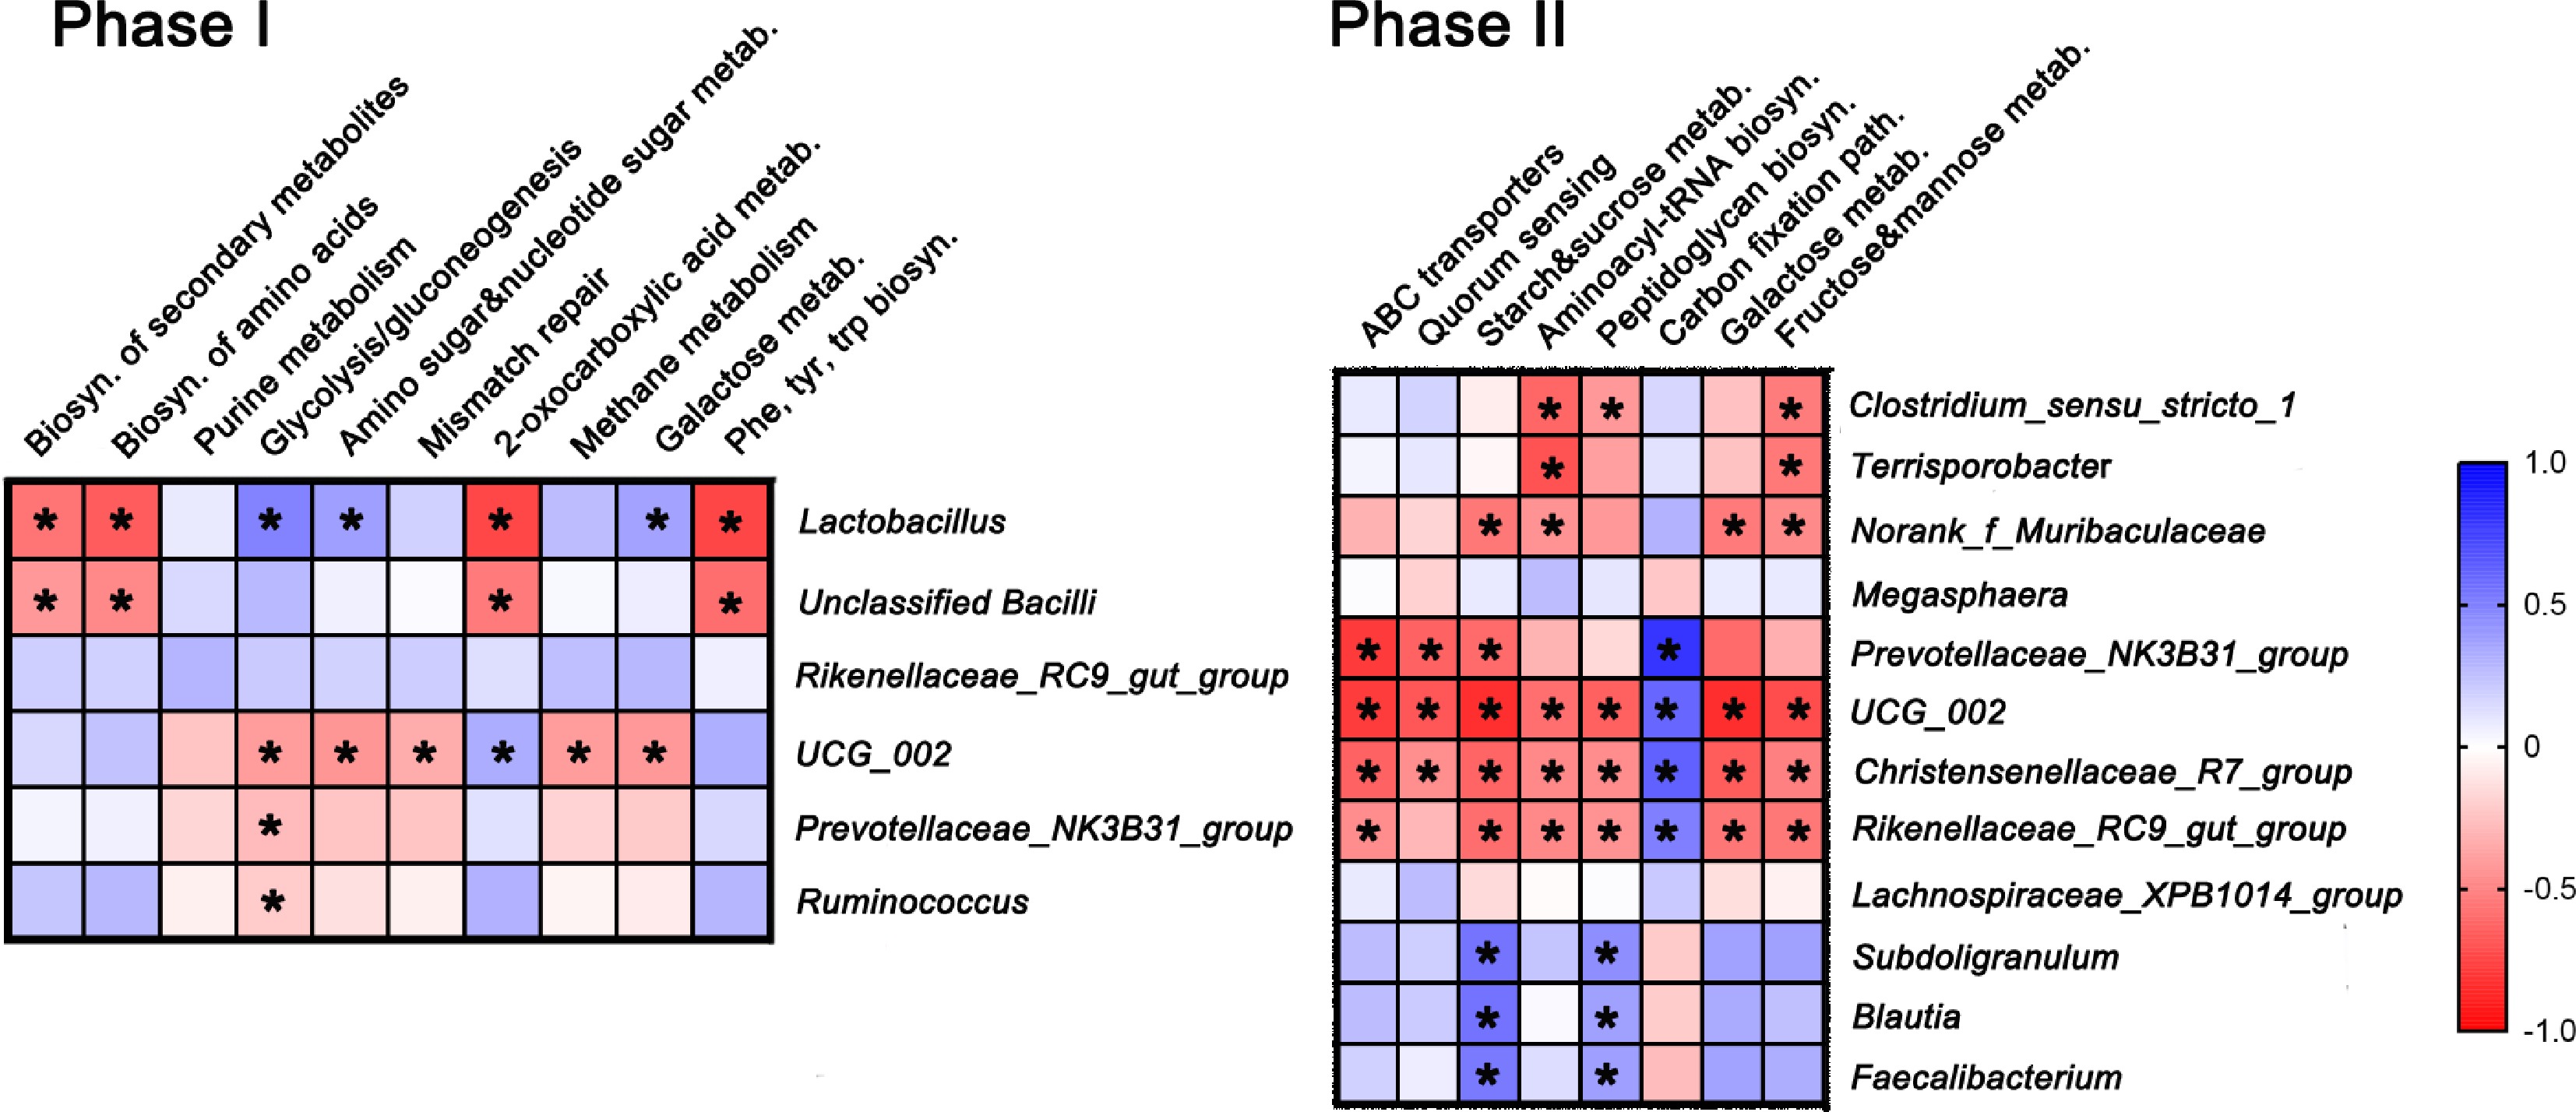
Figure 3.
Correlation analysis between the screened bacterial genera abundance and metabolic pathways. The statistically altered bacterial genera (the abundance was within the top 15 bacteria of the total bacterial composition) and the significant metabolic pathways between CON and YC were screened. Spearman correlation coefficient between bacterial taxa and the numbers of unique sequences mapped to various metabolic pathway were calculated, and p < 0.05 was considered as significant and labeled with *. Dietary treatments were CON (basal diet); YC (CON with 0.5 g XPC Ultra/kg) for growing pigs during Phase I (30–50 kg) and Phase II (50–75 kg).
-
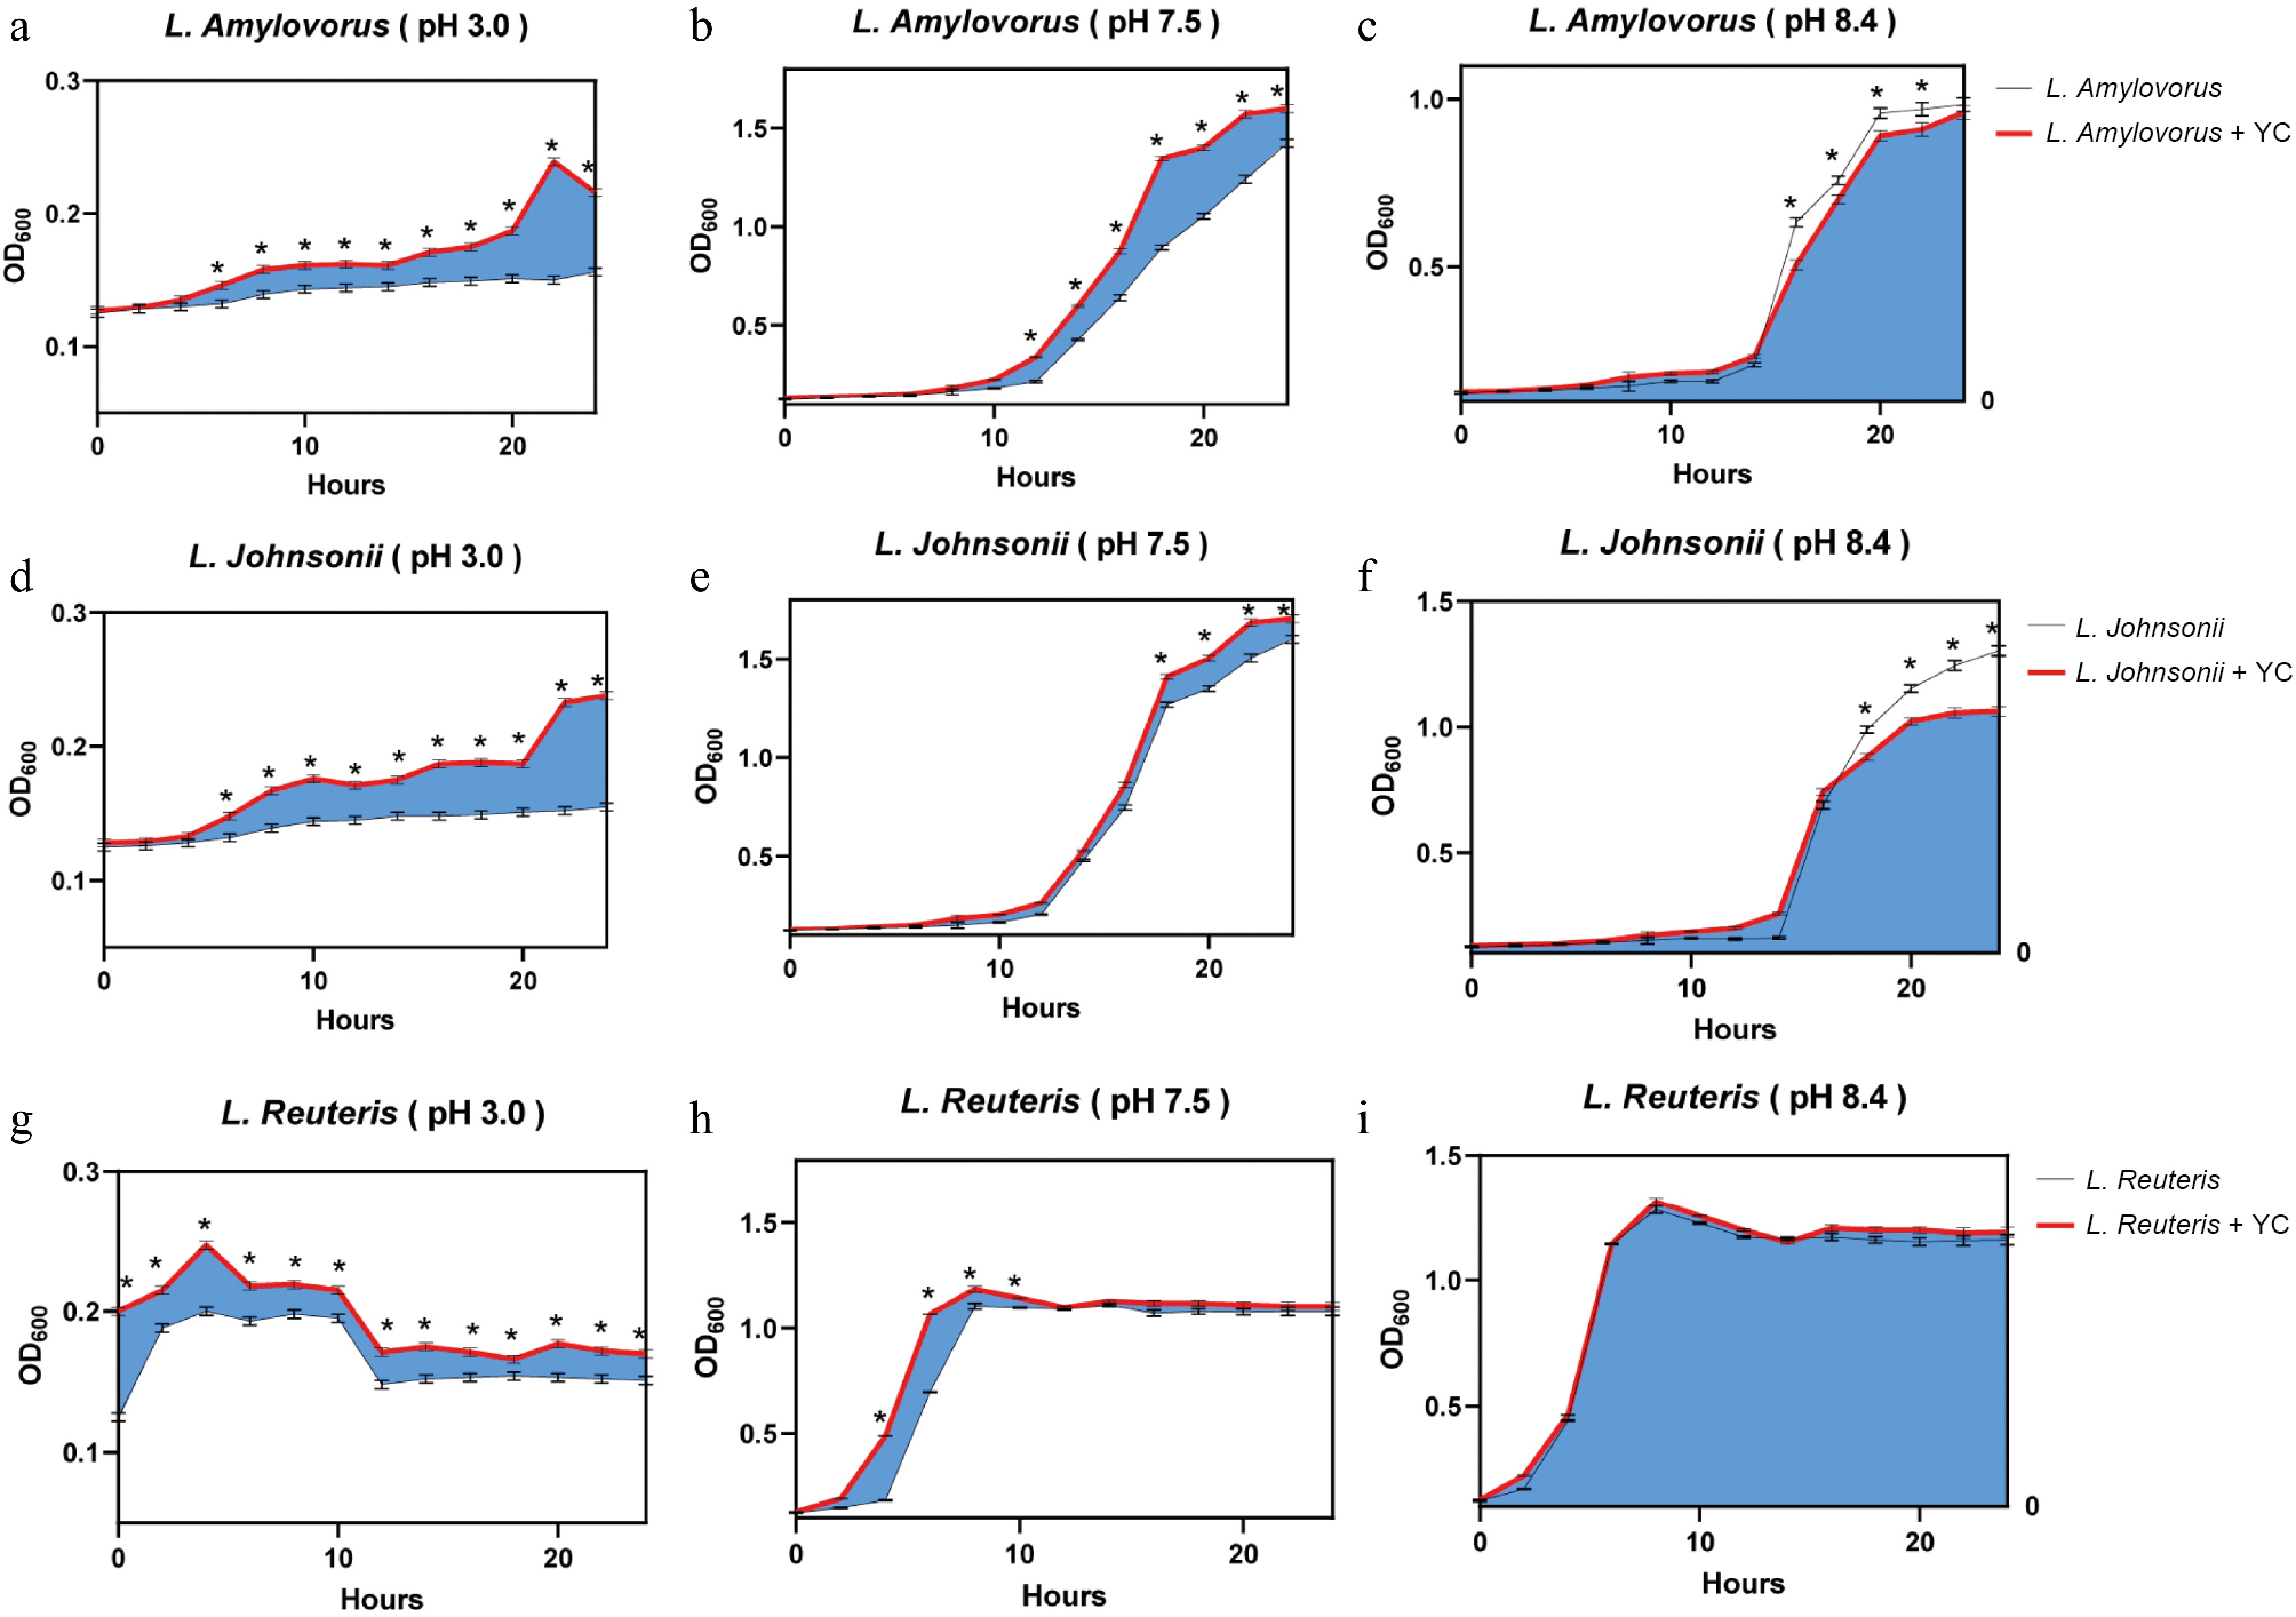
Figure 4.
Growth curves of Lactobacillus strains with yeast-derived postbiotic XPC Ultra at different pH in vitro. Different pH values were mimic the regional pH in stomach, jejunum, and colon. The growth curves (OD absorbance at 600 nm) of L. amylovorus, L. johnsonii, and L. reuteris at pH 3.0, 7.5, and 8.4 (n = 3) were shaded with either blue (MRS broth with XPC Ultra) or white (MRS broth without XPC Ultra). The overlap areas of the growth curves were colored according to the shade color of the growth curve of lower-growing bacteria. Student t-test was performed to statistically differ treatments. The significant level was set as p < 0.05 and labelled as *.
-
Item 30–50 kg BW 50–75 kg BW CON YC RED75− RED75+ CON YC RED75− RED75+ Ingredients (%) Corn 58.50 58.50 52.00 52.00 62.00 62.00 56.00 56.00 Soybean meal 13.00 13.00 10.95 10.95 9.30 9.30 7.55 7.55 Wheat bran 17.00 17.00 20.00 20.00 5.50 5.45 13.20 13.15 Corn DDGS 5.00 5.00 5.00 5.00 8.00 8.00 8.00 8.00 Rice bran meal 1.00 0.95 7.20 7.15 10.00 10.00 10.00 10.00 Wheat flour 2.00 2.00 2.00 2.00 2.00 2.00 2.00 2.00 Limestone 1.00 1.00 0.83 0.83 1.16 1.16 1.20 1.20 Dicalcium phosphate 0.90 0.90 0.82 0.82 0.60 0.60 0.55 0.55 Salt 0.35 0.35 0.35 0.35 0.35 0.35 0.35 0.35 L-lysine·HCl 0.440 0.440 0.468 0.468 0.376 0.376 0.414 0.414 DL-Methionine 0.093 0.093 0.097 0.097 0.032 0.032 0.038 0.038 Threonine 0.122 0.122 0.134 0.134 0.092 0.092 0.105 0.105 Tryptophan 0.030 0.030 0.036 0.036 0.025 0.025 0.028 0.028 Premix1 0.40 0.40 0.40 0.40 0.40 0.40 0.40 0.40 Choline chloride 0.08 0.08 0.08 0.08 0.08 0.08 0.08 0.08 Phytase 0.02 0.02 0.02 0.02 0.02 0.02 0.02 0.02 XPC Ultra 0.00 0.05 0.00 0.05 0.00 0.05 0.00 0.05 Mold inhibitor 0.05 0.05 0.05 0.05 0.05 0.05 0.05 0.05 Antioxidants 0.015 0.015 0.015 0.015 0.015 0.015 0.015 0.015 Total 100.00 100.00 100.00 100.00 100.00 100.00 100.00 100.00 Calculated nutrient levels (%)2 NE (kcal/kg) 2,325.00 2,325.00 2,250.00 2,250.00 2,325.00 2,325.00 2,250.00 2,250.00 Calcium 0.65 0.65 0.65 0.65 0.62 0.62 0.62 0.62 Total phosphorous 0.63 0.63 0.74 0.74 0.60 0.60 0.65 0.65 Available phosphorus 0.28 0.28 0.28 0.28 0.23 0.23 0.23 0.23 Crude protein 15.50 15.50 15.51 15.51 14.48 14.48 14.52 14.52 NDF 17.85 17.85 18.25 18.25 19.60 19.60 20.37 20.37 SID AA Isoleucine 0.51 0.51 0.49 0.49 0.46 0.46 0.45 0.45 Leucine 1.12 1.12 1.08 1.08 1.16 1.16 1.11 1.11 Lysine 0.92 0.92 0.92 0.92 0.80 0.80 0.80 0.80 Methionine 0.30 0.30 0.30 0.30 0.25 0.25 0.25 0.25 Methionine + cysteine 0.52 0.52 0.52 0.52 0.45 0.45 0.45 0.45 Threonine 0.55 0.55 0.55 0.55 0.49 0.49 0.49 0.49 Tryptophan 0.17 0.17 0.17 0.17 0.14 0.14 0.14 0.14 Valine 0.60 0.60 0.60 0.60 0.57 0.57 0.56 0.56 Experimental diets were a corn-soybean meal-based diet: (1) CON: basal diet with normal net energy meet with China National Feeding Standard of Swine (GB/T 39235-2020); (2) YC: CON supplemented with 0.5 g/kg yeast derived postbiotic XPC Ultra diet; (3) RED75–: diet with the net energy reduced by 75 kcal/kg (comparing with CON); (4) RED75+: RED75– supplemented with 0.5 g/kg XPC Ultra diet. BW: Body weight; NE: Net energy; ME: Metabolizable energy; NDF: Neutral detergent fiber; SID: Standardized ileal digestibility. 1 The premix provided the following per kilogram of the diet: vitamin A, 9,000 IU; vitamin D3, 3,000 IU; vitamin E, 24 IU; vitamin K3, 1.8 mg; vitamin B1, 2 mg; vitamin B1, 2.0 mg; vitamin B6, 3.0 mg; vitamin B2, 5.0 mg; vitamin B12, 0.1 mg; niacin, 40 mg; vitamin B5, 15 mg; folic acid, 1.0 mg; biotin, 0.05 mg; choline chloride, 500 mg; Fe, 80 mg; Cu, 20 mg; Zn, 90 mg; Mn, 80 mg; I, 0.35 mg; Se, 0.3 mg. 2 Gross energy, Crude protein, Calcium, Phosphorous NDF contents are measured values, while all others are calculated values. Table 1.
Ingredient composition and calculated nutrient composition of experimental diets (as-fed basis).
-
Item CON YC RED75– RED75+ SEM p-value XPC Eng XPC × Eng Indicate number of observations for means Phase I (30–50 kg) Dry matter 87.63 87.61 87.76 87.51 0.06 0.95 0.99 0.95 Crude protein 86.37 88.48 87.95 87.07 0.41 0.75 0.97 0.45 Ash 44.25 45.06 45.11 43.91 0.25 0.84 0.88 0.32 NDF 56.37b 58.25a 57.59ab 56.31b 0.34 0.39 0.31 0.01 Calcium 61.39a 61.55a 60.27a 62.01b 0.36 0.02 0.38 0.44 Phosphorus 57.17 58.09 56.43 58.27 0.41 0.29 0.83 0.72 Gross energy 86.69 87.76 89.08 87.97 0.64 0.99 0.51 0.58 Phase II (50–75 kg) Dry matter 88.10 87.89 87.60 87.70 0.07 0.98 0.86 0.94 Crude protein 83.32a 85.47b 84.65a 86.67b 0.23 < 0.01 0.02 0.91 Ash 40.45 41.27 40.51 41.29 0.21 0.38 0.97 0.98 NDF 53.69a 55.89b 53.01a 55.01b 0.31 < 0.01 0.27 0.76 Calcium 65.07 65.75 64.33 65.34 0.40 0.56 0.69 0.91 Phosphorus 63.11a 64.08a 63.58a 65.45b 0.36 0.01 0.27 0.26 Gross energy 83.25a 84.53ab 82.78a 85.45b 0.61 0.01 0.66 0.18 Experimental diets were a corn-soybean meal-based diet: (1) CON: basal diet with normal net energy meet with China National Feeding Standard of Swine (GB/T 39235-2020); (2) YC: CON supplemented with 0.5 g/kg yeast derived postbiotic XPC Ultra diet; (3) RED75–: diet with the net energy reduced by 75 kcal/kg (comparing with CON); (4) RED75+: RED75– supplemented with 0.5 g/kg XPC Ultra diet. BW: Body weight; NE: Net energy; ME: Metabolizable energy; NDF: Neutral detergent fiber; SID: Standardized ileal digestibility; Eng: energy. Statistical significance was determined using one-way ANOVA among all dietary treatments (n = 16). a, b Values with different superscripts within a row differ (p < 0.05). Table 2.
Effects of yeast-derived postbiotic supplementation and dietary energy concentration on total tract apparent nutrient digestibility in growing pigs (%).
-
Item CON YC RED75– RED75+ SEM p-value XPC Eng XPC × Eng Indicate number of observations for each mean Phase I (30–50 kg) IL-1β, pg/mL 29.04a 21.96b 24.84ab 27.02b 0.65 < 0.01 0.25 0.01 IL-6, pg/mL 43.11 52.15 49.23 49.92 2.03 < 0.01 0.12 0.02 IL-10, pg/mL 22.18a 17.09b 18.90ab 20.13ab 0.49 < 0.01 0.81 < 0.01 TNF-α, pg/mL 97.56a 78.28b 93.07a 95.86a 1.92 < 0.01 0.08 0.01 IFN-γ, pg/mL 86.77a 54.14c 65.07c 73.57b 1.94 < 0.01 0.22 < 0.01 IgA, g/L 0.96a 1.06a 1.14b 1.00ab 0.02 0.05 0.28 < 0.01 IgG, g/L 7.05 6.87 6.89 6.78 0.07 0.47 0.37 0.73 IgM, g/L 0.98a 1.08ab 1.15b 1.19b 0.02 0.03 < 0.01 0.15 T-SOD, U/mL 137.32 134.47 138.81 134.13 0.68 < 0.01 < 0.01 < 0.01 MDA, nmol/mL 3.84a 3.68a 3.54a 2.28b 0.12 < 0.01 < 0.01 < 0.01 GSH-Px, U/mL 375.22a 386.69a 395.07a 406.10b 3.86 0.05 0.52 0.68 T-AOC, mmol/L 0.26 0.26 0.25 0.25 0.01 0.94 0.06 0.94 CAT, U/mL 5.78 6.28 5.96 6.64 0.12 < 0.01 0.08 0.54 Phase II (50–75 kg) IL-1β, pg/mL 27.04 28.00 24.09 29.43 0.67 < 0.01 0.26 0.03 IL-6, pg/mL 51.43 52.15 44.08 49.92 1.51 0.13 0.01 0.45 IL-10, pg/mL 18.32 18.15 17.71 16.01 1.27 0.38 0.04 0.84 TNF-α, pg/mL 72.60a 63.99a 71.06b 71.89b 2.33 0.22 0.09 0.07 IFN-γ, pg/mL 60.65 69.64 59.18 71.94 1.83 0.01 0.79 0.25 IgA, g/L 0.96 1.06 1.14 1.02 0.02 0.59 0.01 < 0.01 IgG, g/L 7.07 6.69 6.75 7.05 0.06 0.80 0.90 0.47 IgM, g/L 0.92 1.08 1.24 0.96 0.06 0.05 < 0.01 < 0.01 T-SOD, U/mL 136.34 142.46 143.19 139.71 0.82 0.7 0.56 0.18 MDA, nmol/mL 3.61a 2.99a 3.02a 2.75b 0.11 < 0.01 < 0.01 0.02 GSH-Px, U/mL 392.87 384.26 400.34 400.37 3.53 0.66 0.23 0.66 T-AOC, mmol/L 0.23a 0.24ab 0.28b 0.25ab 0.01 0.12 < 0.01 0.01 CAT, U/mL 5.22 5.80 5.54 6.00 0.14 < 0.01 < 0.01 < 0.01 Experimental diets were a corn-soybean meal-based diet: (1) CON: basal diet with normal net energy meet with China National Feeding Standard of Swine (GB/T 39235-2020); (2) YC: CON supplemented with 0.5 g/kg yeast derived postbiotic XPC Ultra diet; (3) RED75–: diet with the net energy reduced by 75 kcal/kg (comparing with CON); (4) RED75+: RED75– supplemented with 0.5 g/kg XPC Ultra diet. BW: Body weight; NE: Net energy; ME: Metabolizable energy; NDF: Neutral detergent fiber; SID: Standardized ileal digestibility; Eng: energy. Values listed for means and pooled standard error of mean (SEM) of all data are actual data. Statistical significance was determined using one-way ANOVA among all dietary treatments (n = 32).a, b, c Values with different superscripts within a row differ (p < 0.05). Table 3.
Effects of yeast-derived postbiotic supplementation and dietary energy concentration on serum indices of inflammatory, immunoglobulins, and antioxidant factors in growing pigs.
-
Item pH SEM Stomach 3.0 0.09 Jejunum 7.5 0.12 Colon 8.4 0.43 Values listed for means and pooled standard error of mean (SEM) of all data are actual data. Statistical significance was determined using one-way ANOVA among all dietary treatments (n = 3). Table 4.
The intestinal pH values of stomach, jejunum, and colon in growing pigs.
Figures
(4)
Tables
(4)