-
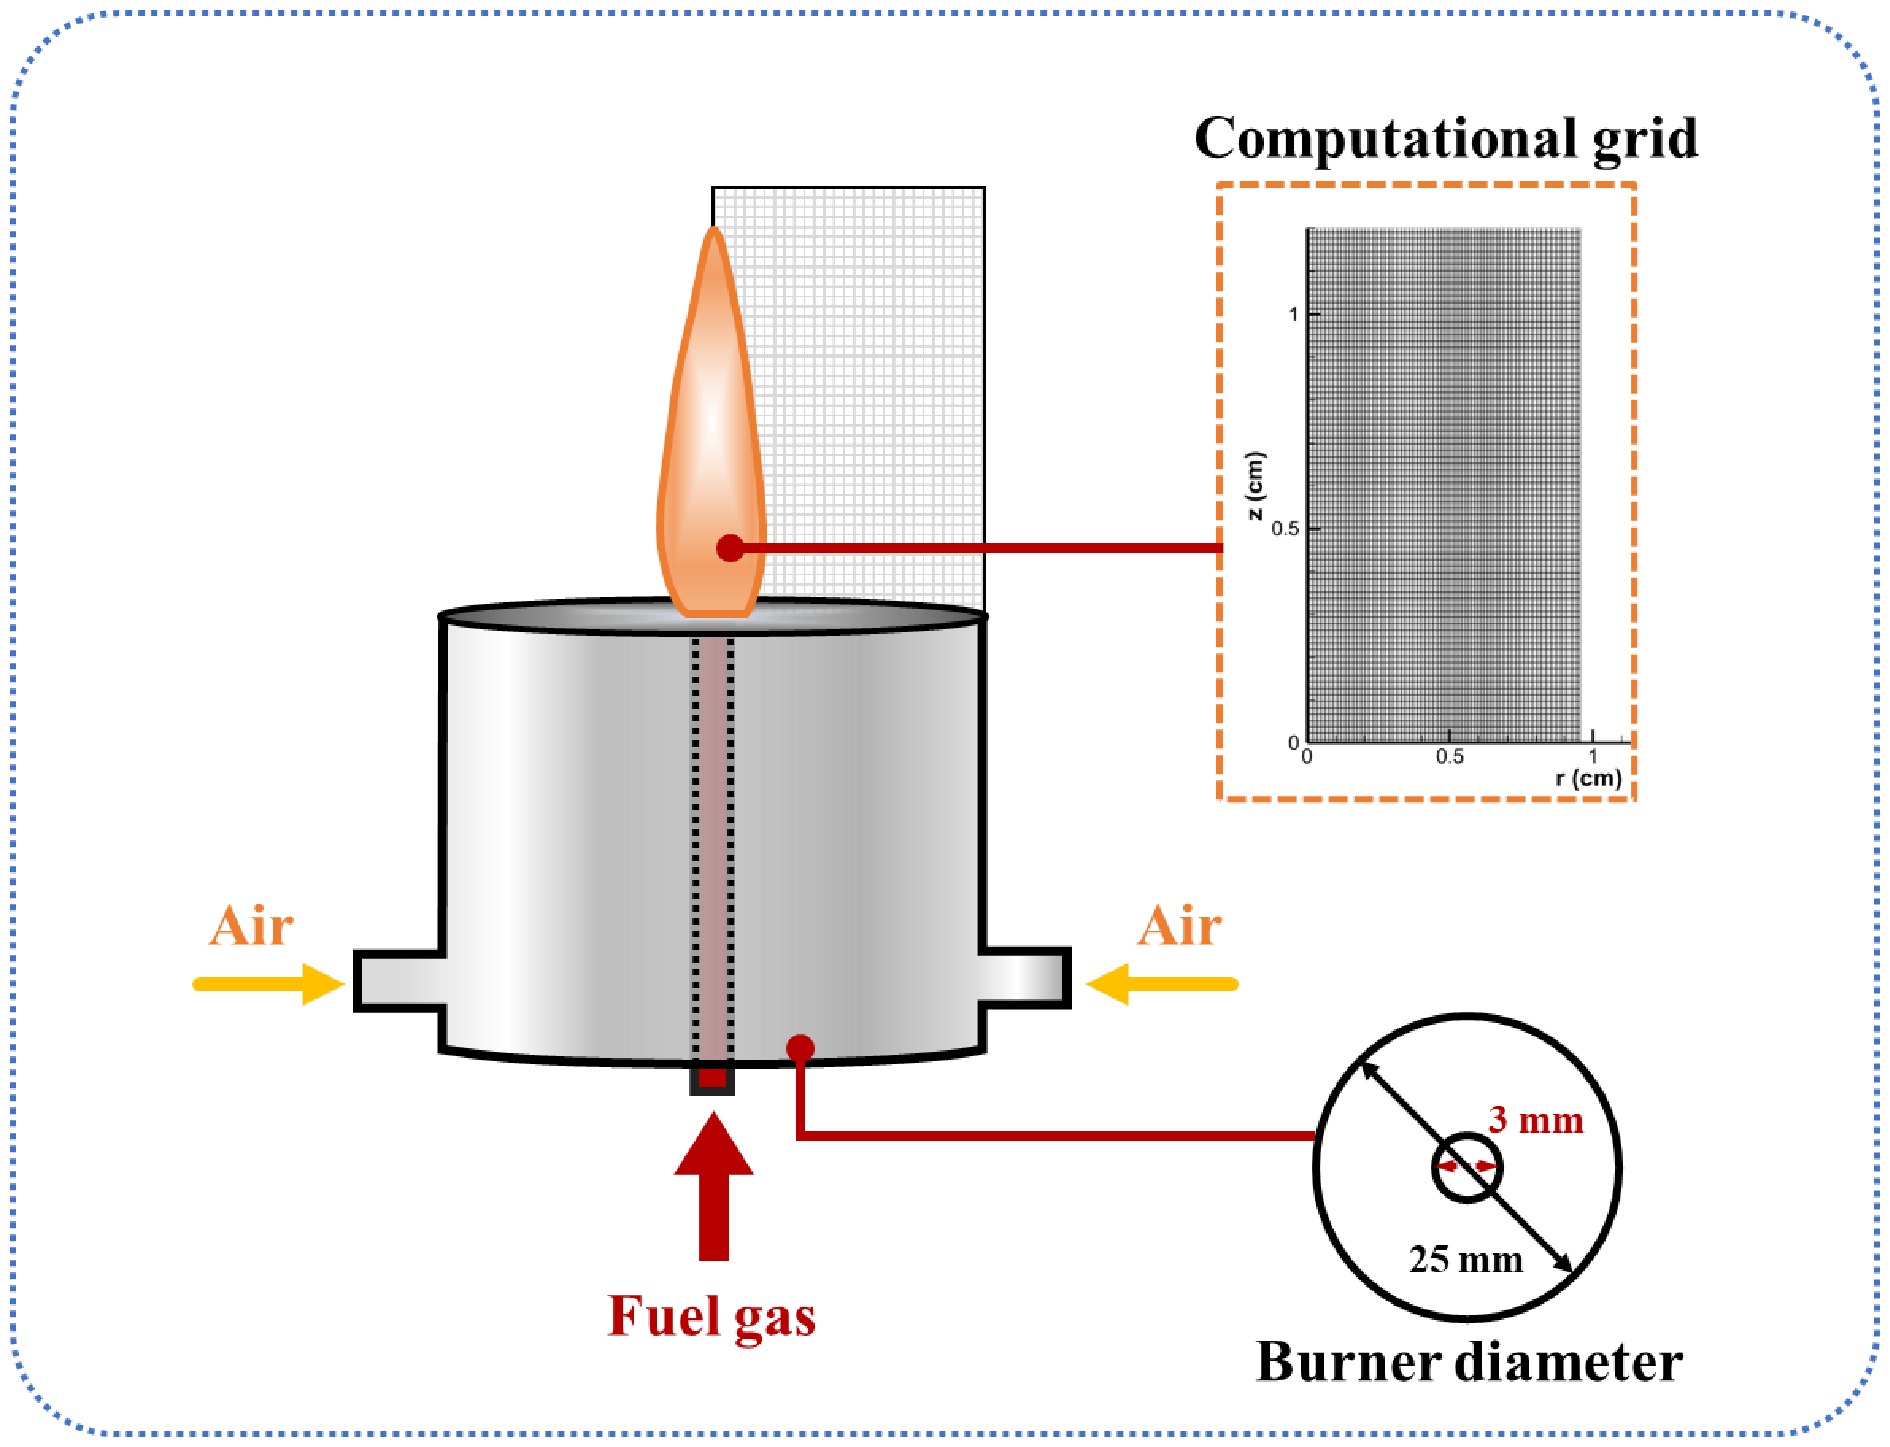
Figure 1.
Schematic diagram of burner structure and flame calculation area.
-
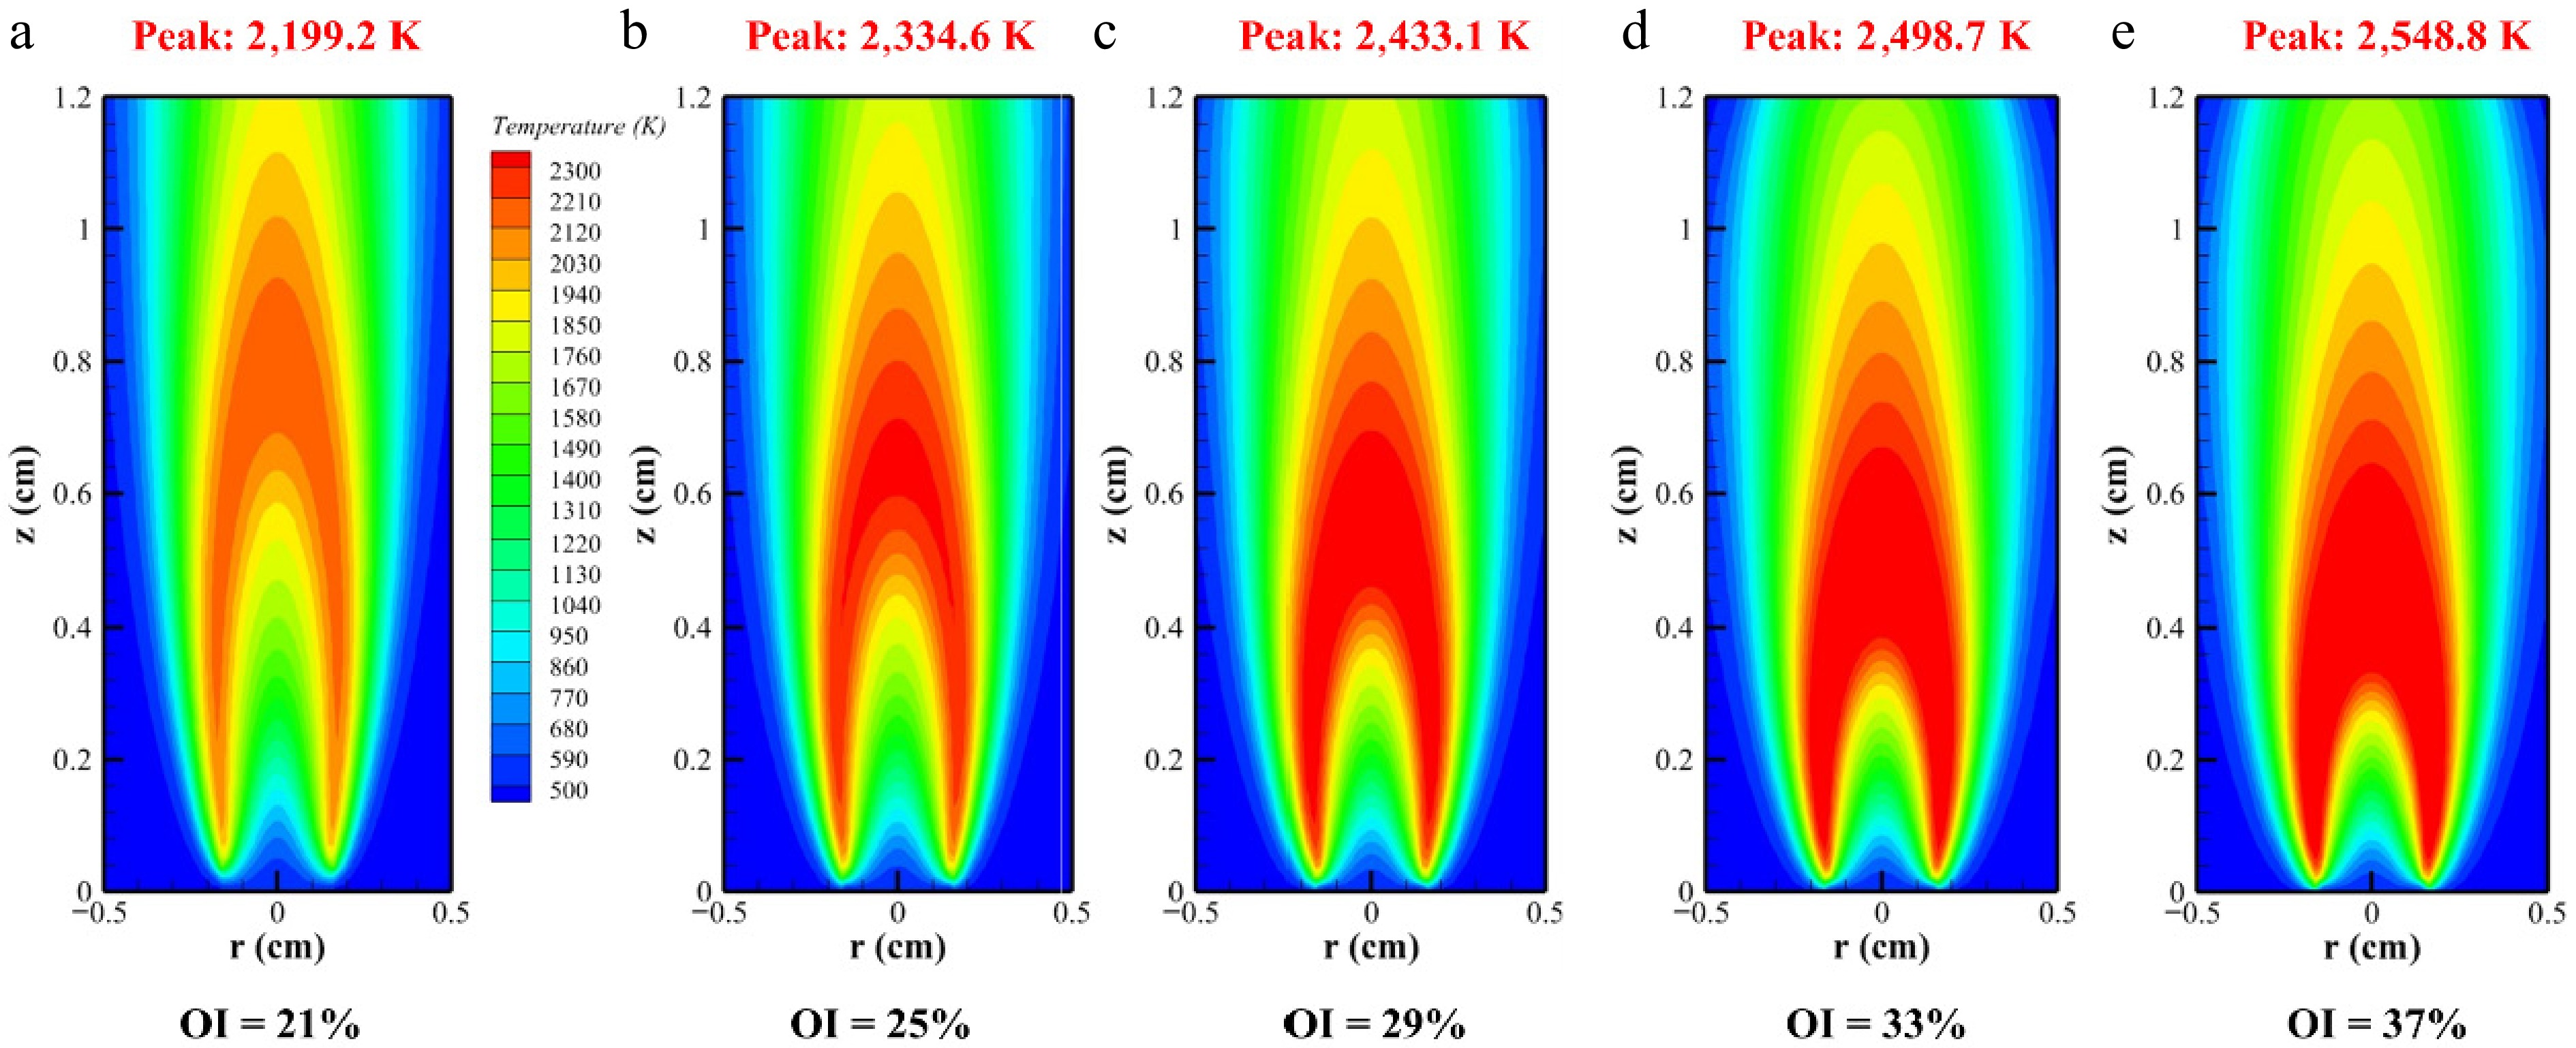
Figure 2.
Flame temperature distribution of methane/n-heptane flames at different OIs.
-
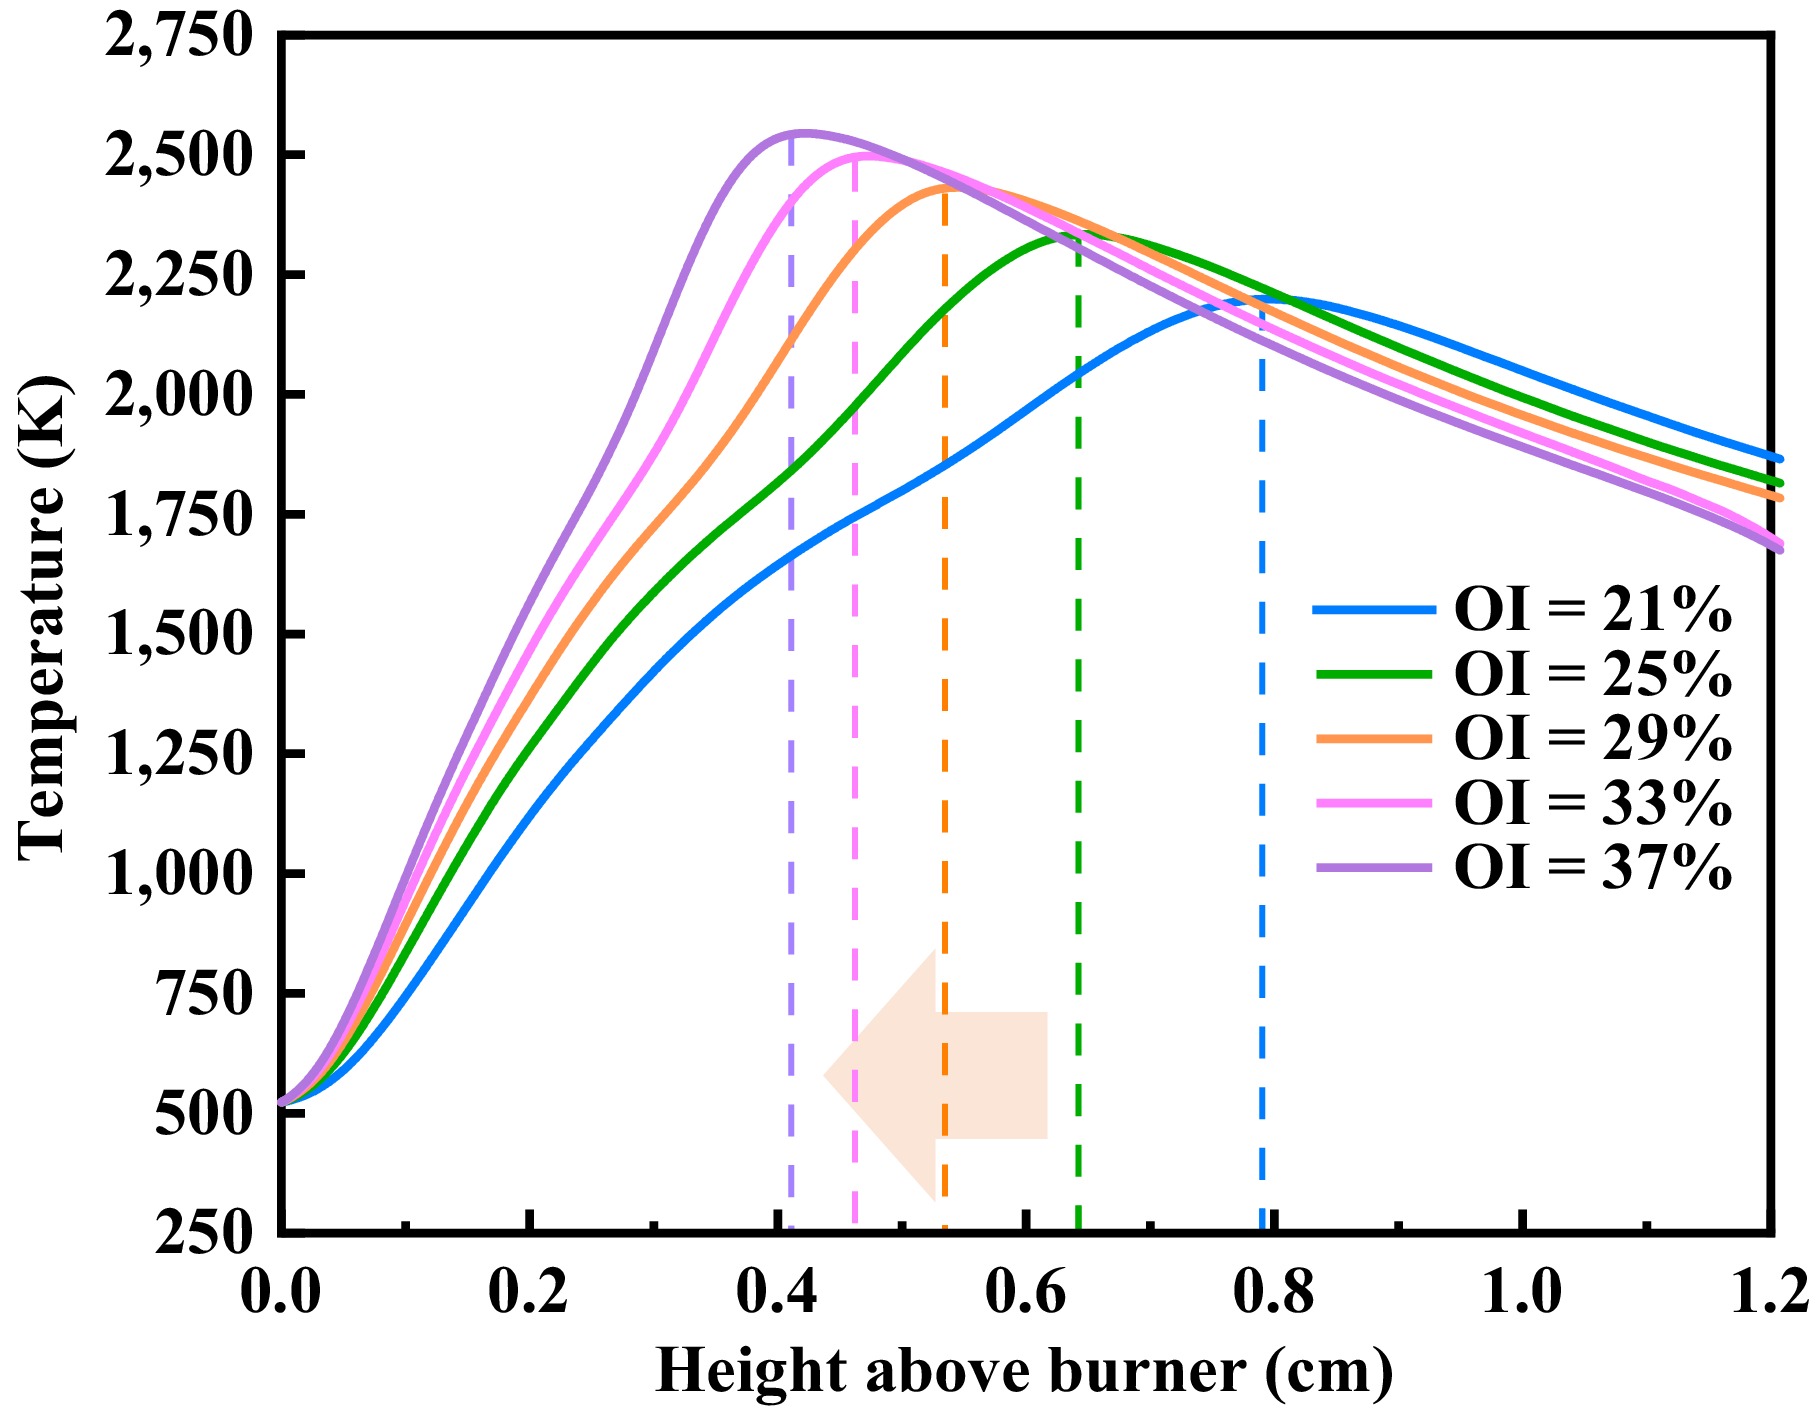
Figure 3.
Flame temperature distribution of different OIs along the flames' center axis for n-heptane/methane fuel at 2 atm.
-
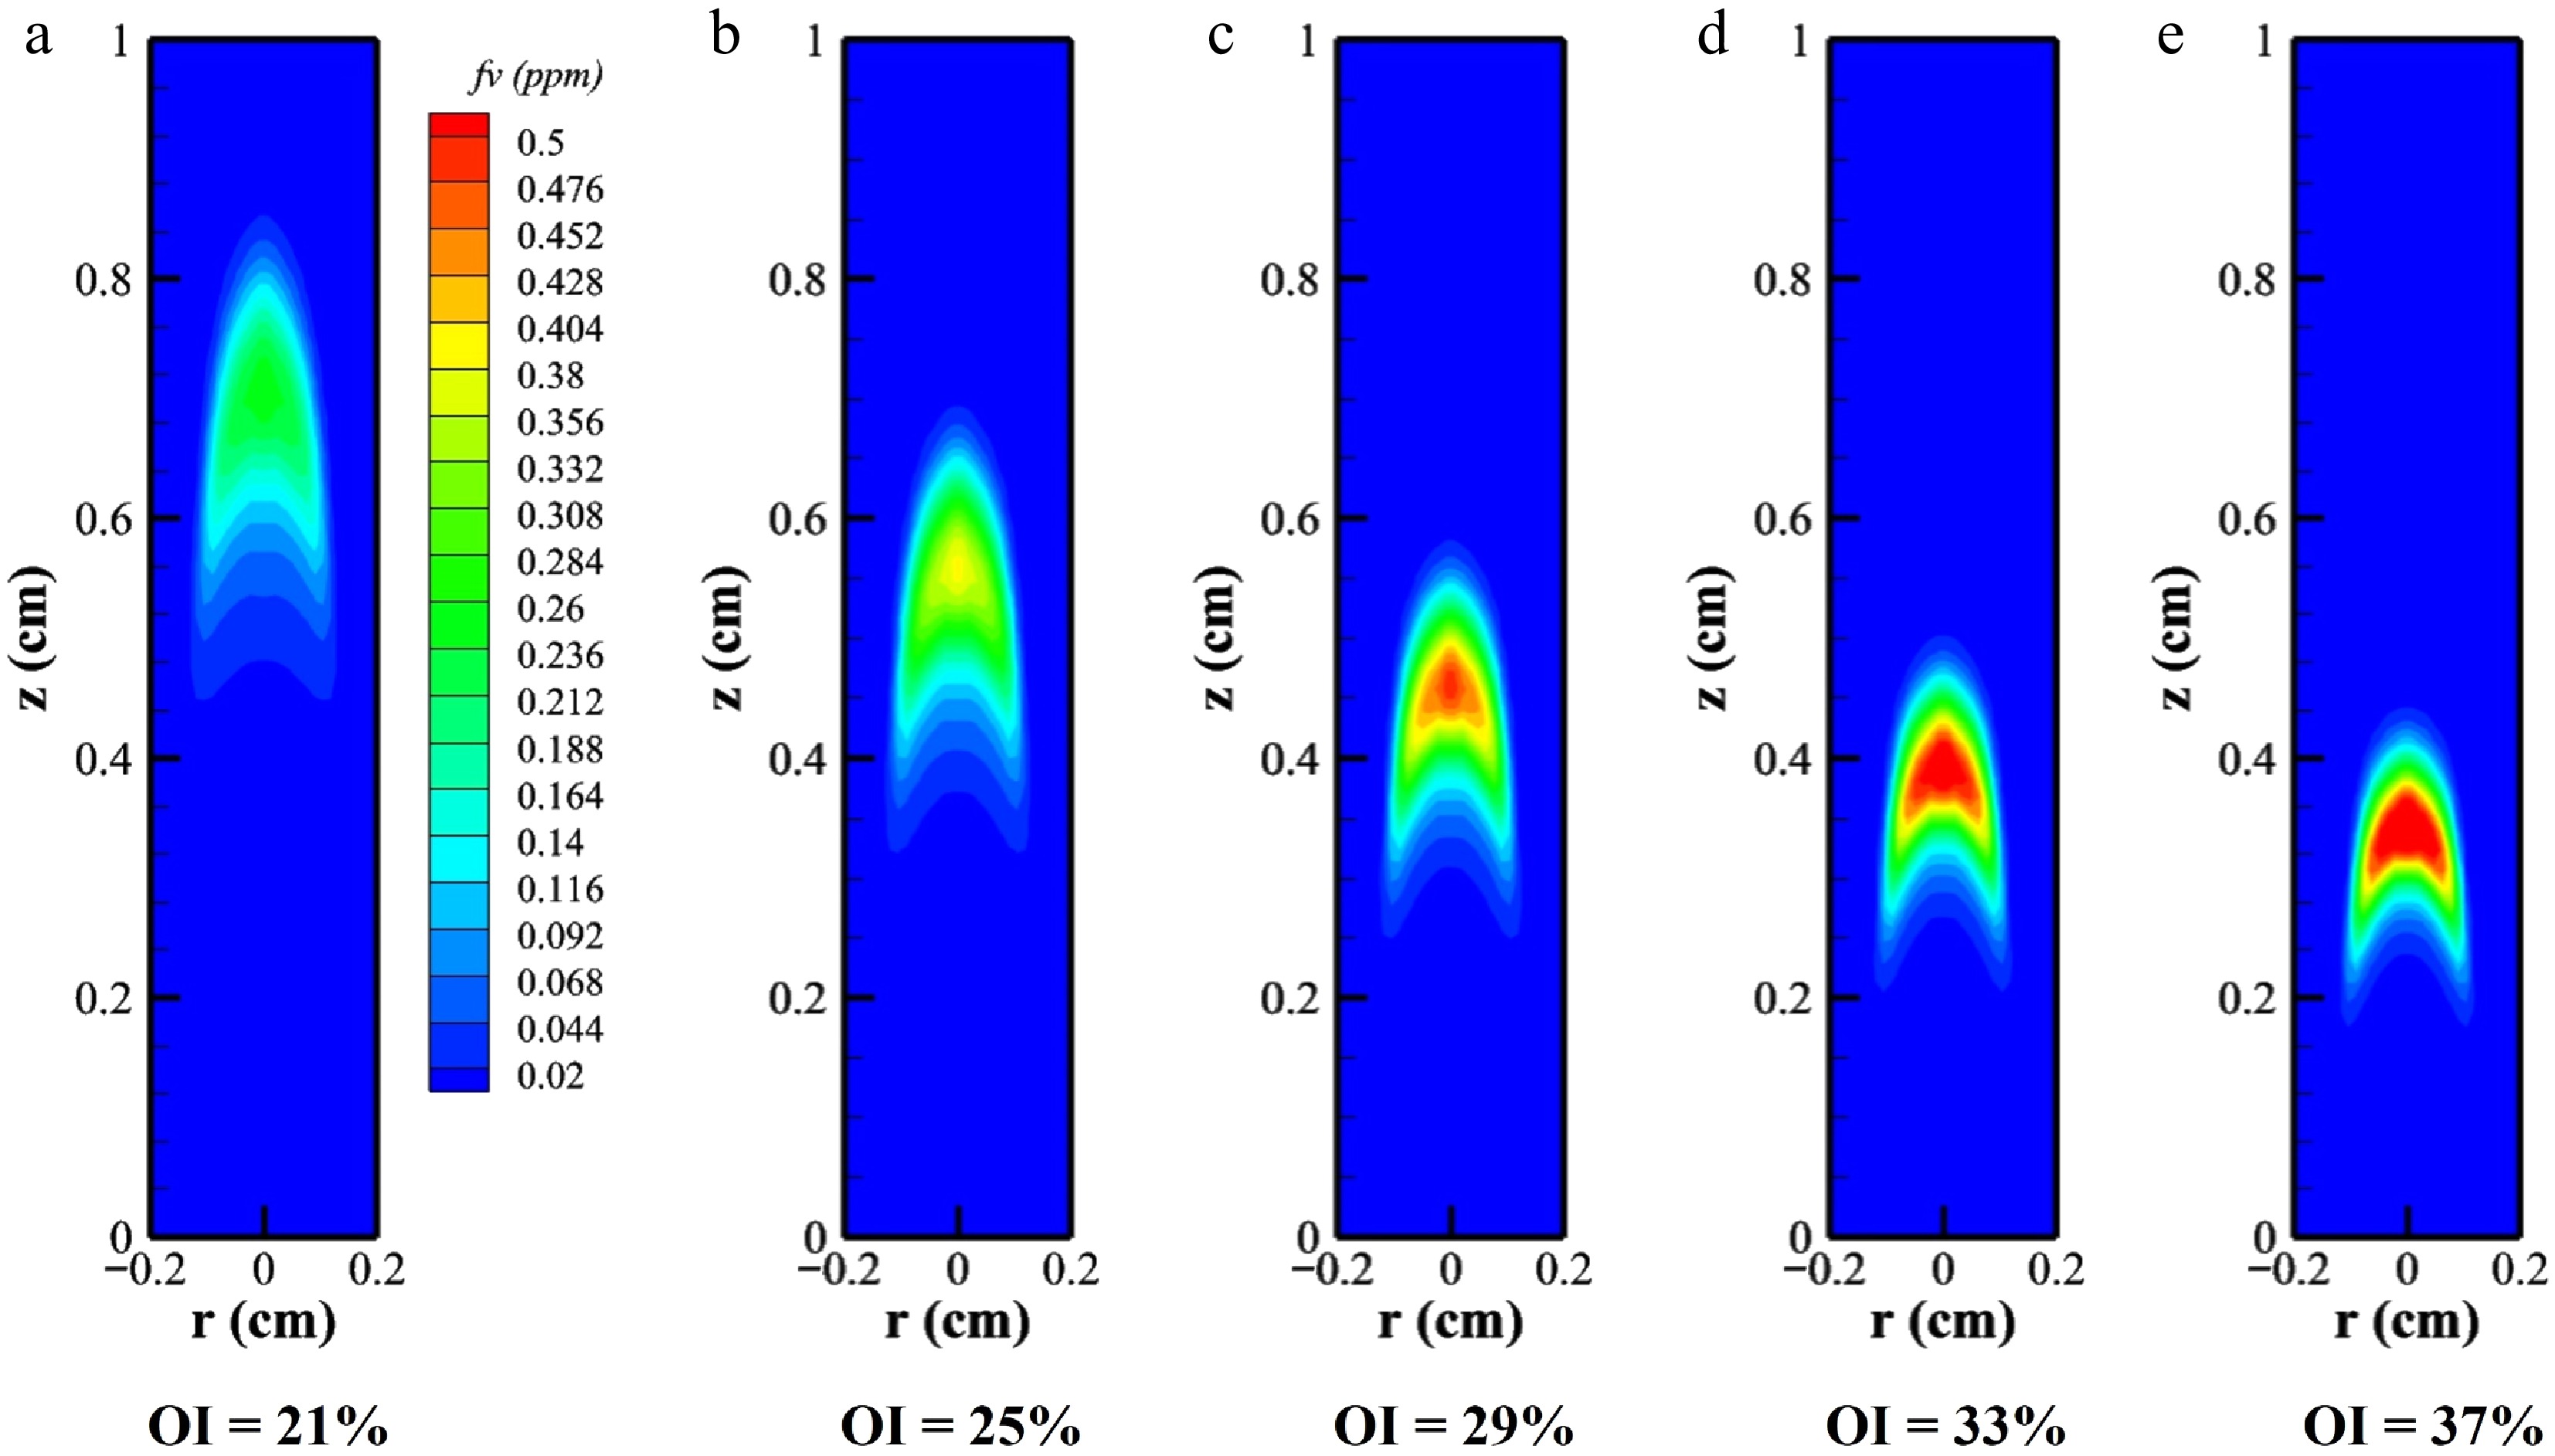
Figure 4.
Distribution of the SVF in methane/n-heptane flames under different OIs.
-
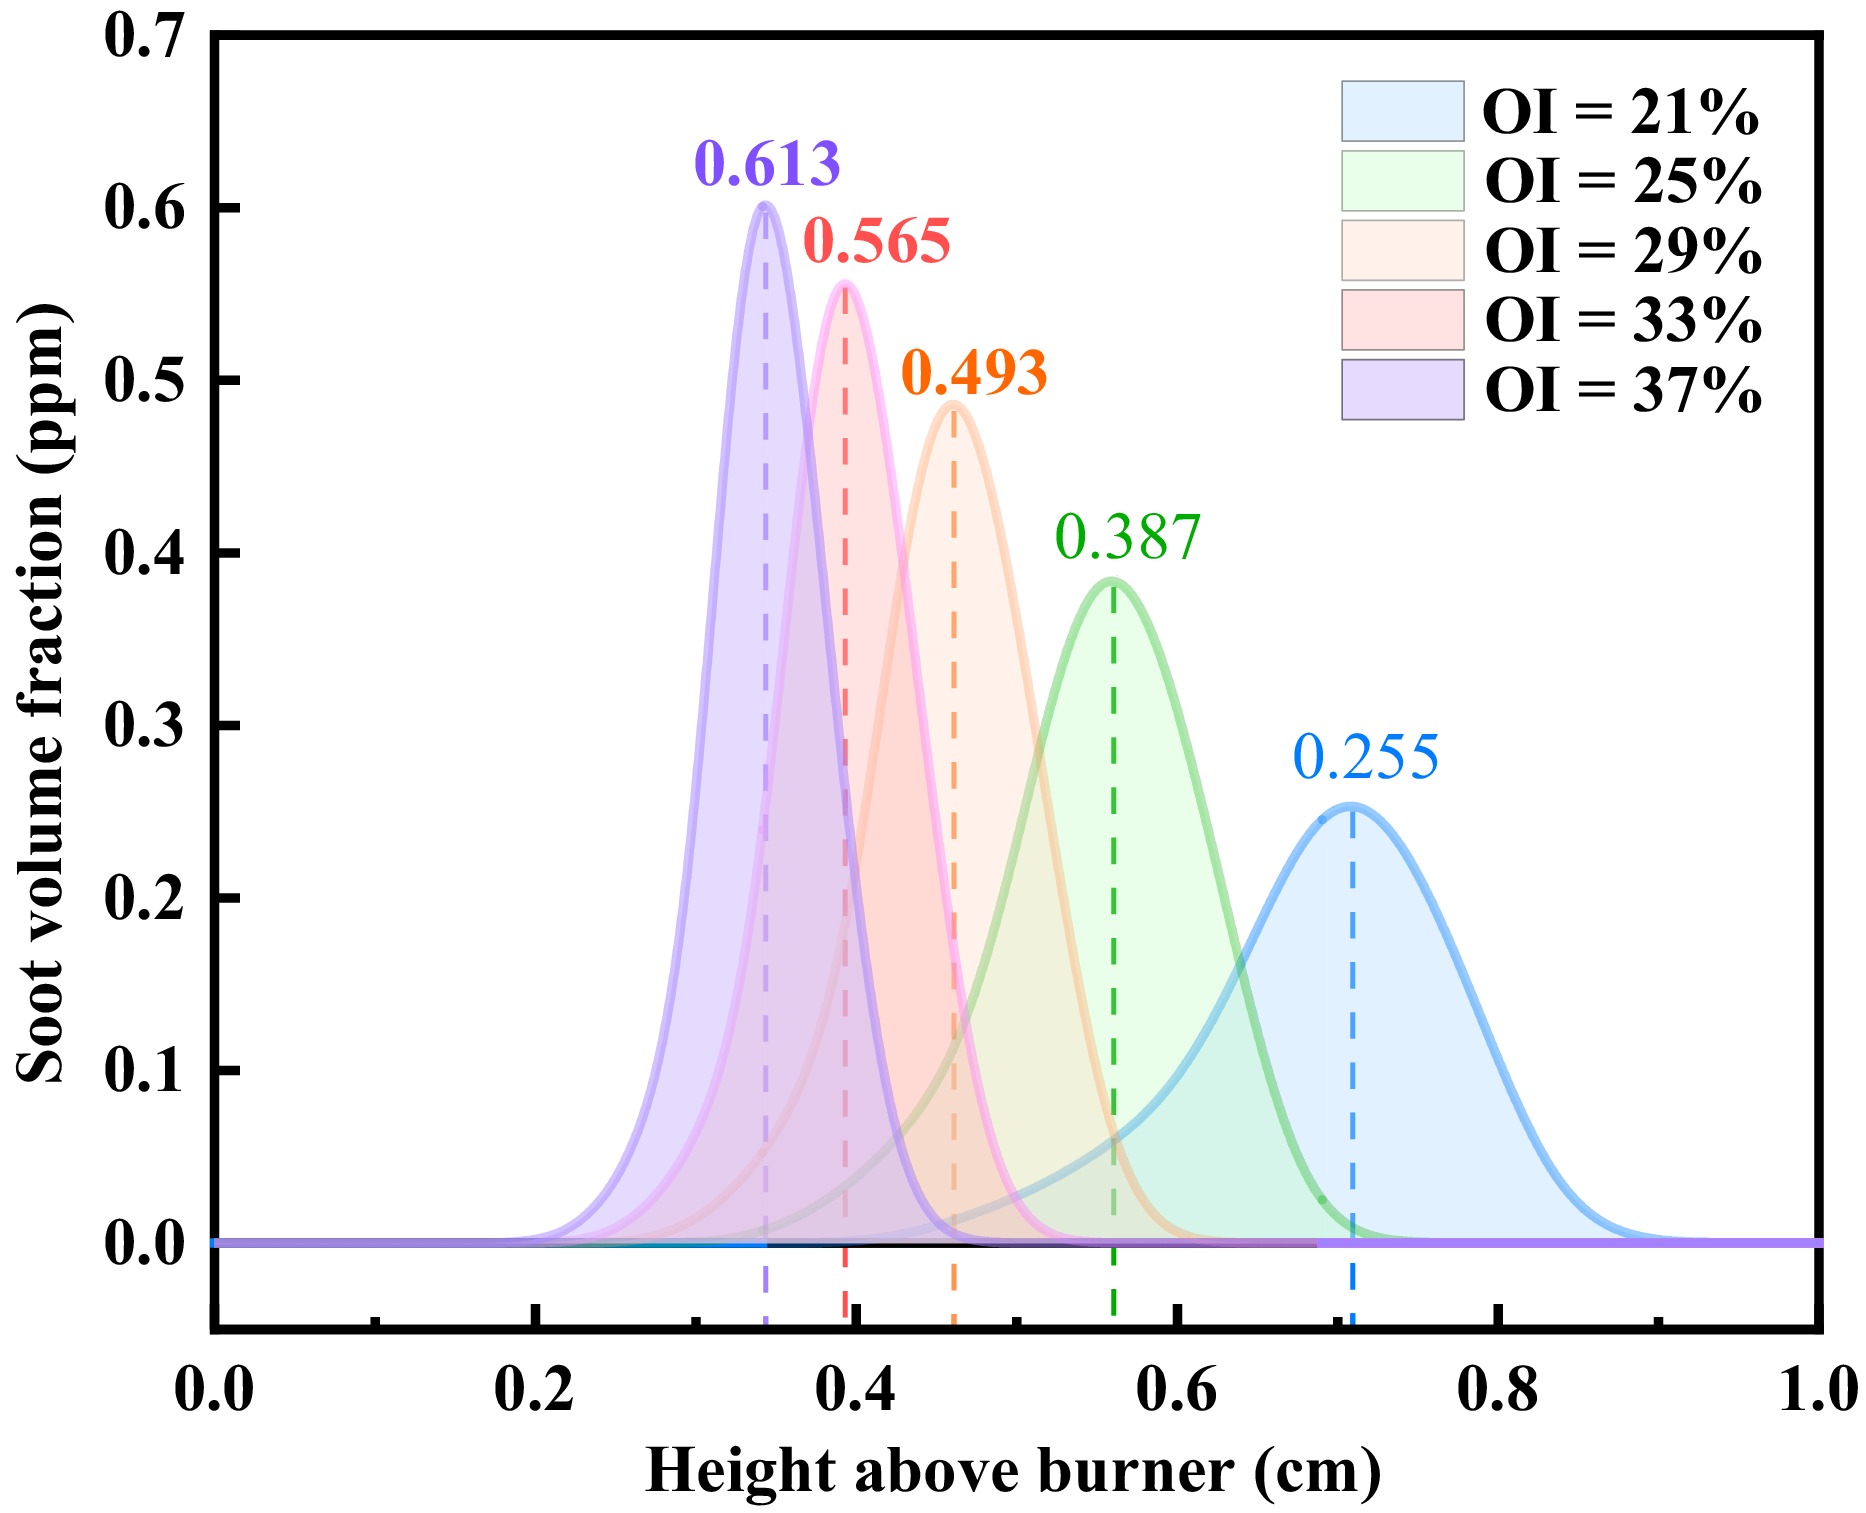
Figure 5.
Distribution of SVF on the central axis of methane/n-heptane flames under different OIs.
-
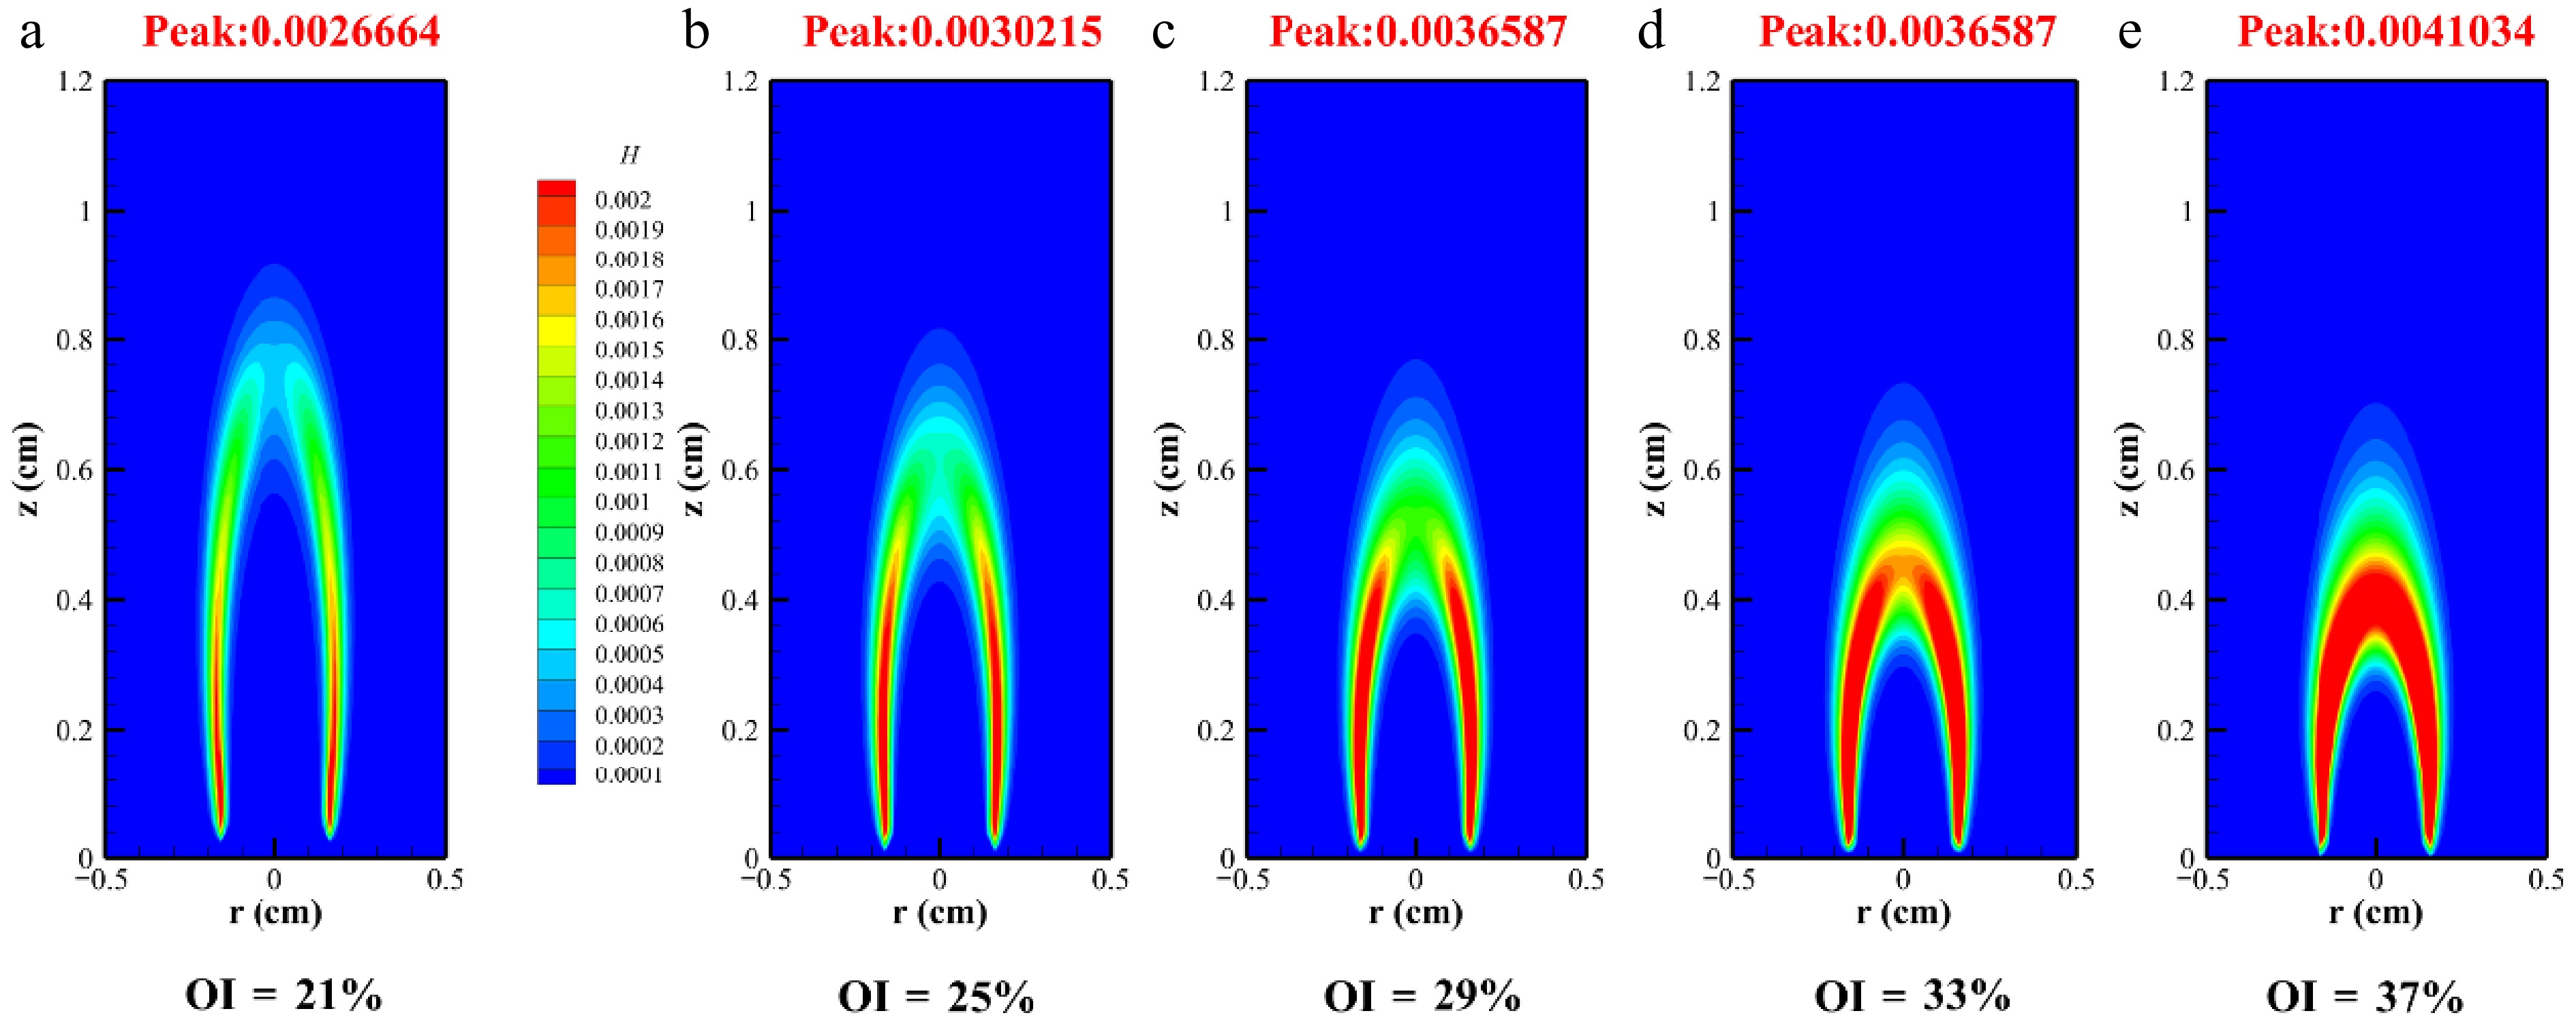
Figure 6.
Mole distribution of H radicals in methane/n-heptane flames at different OIs.
-
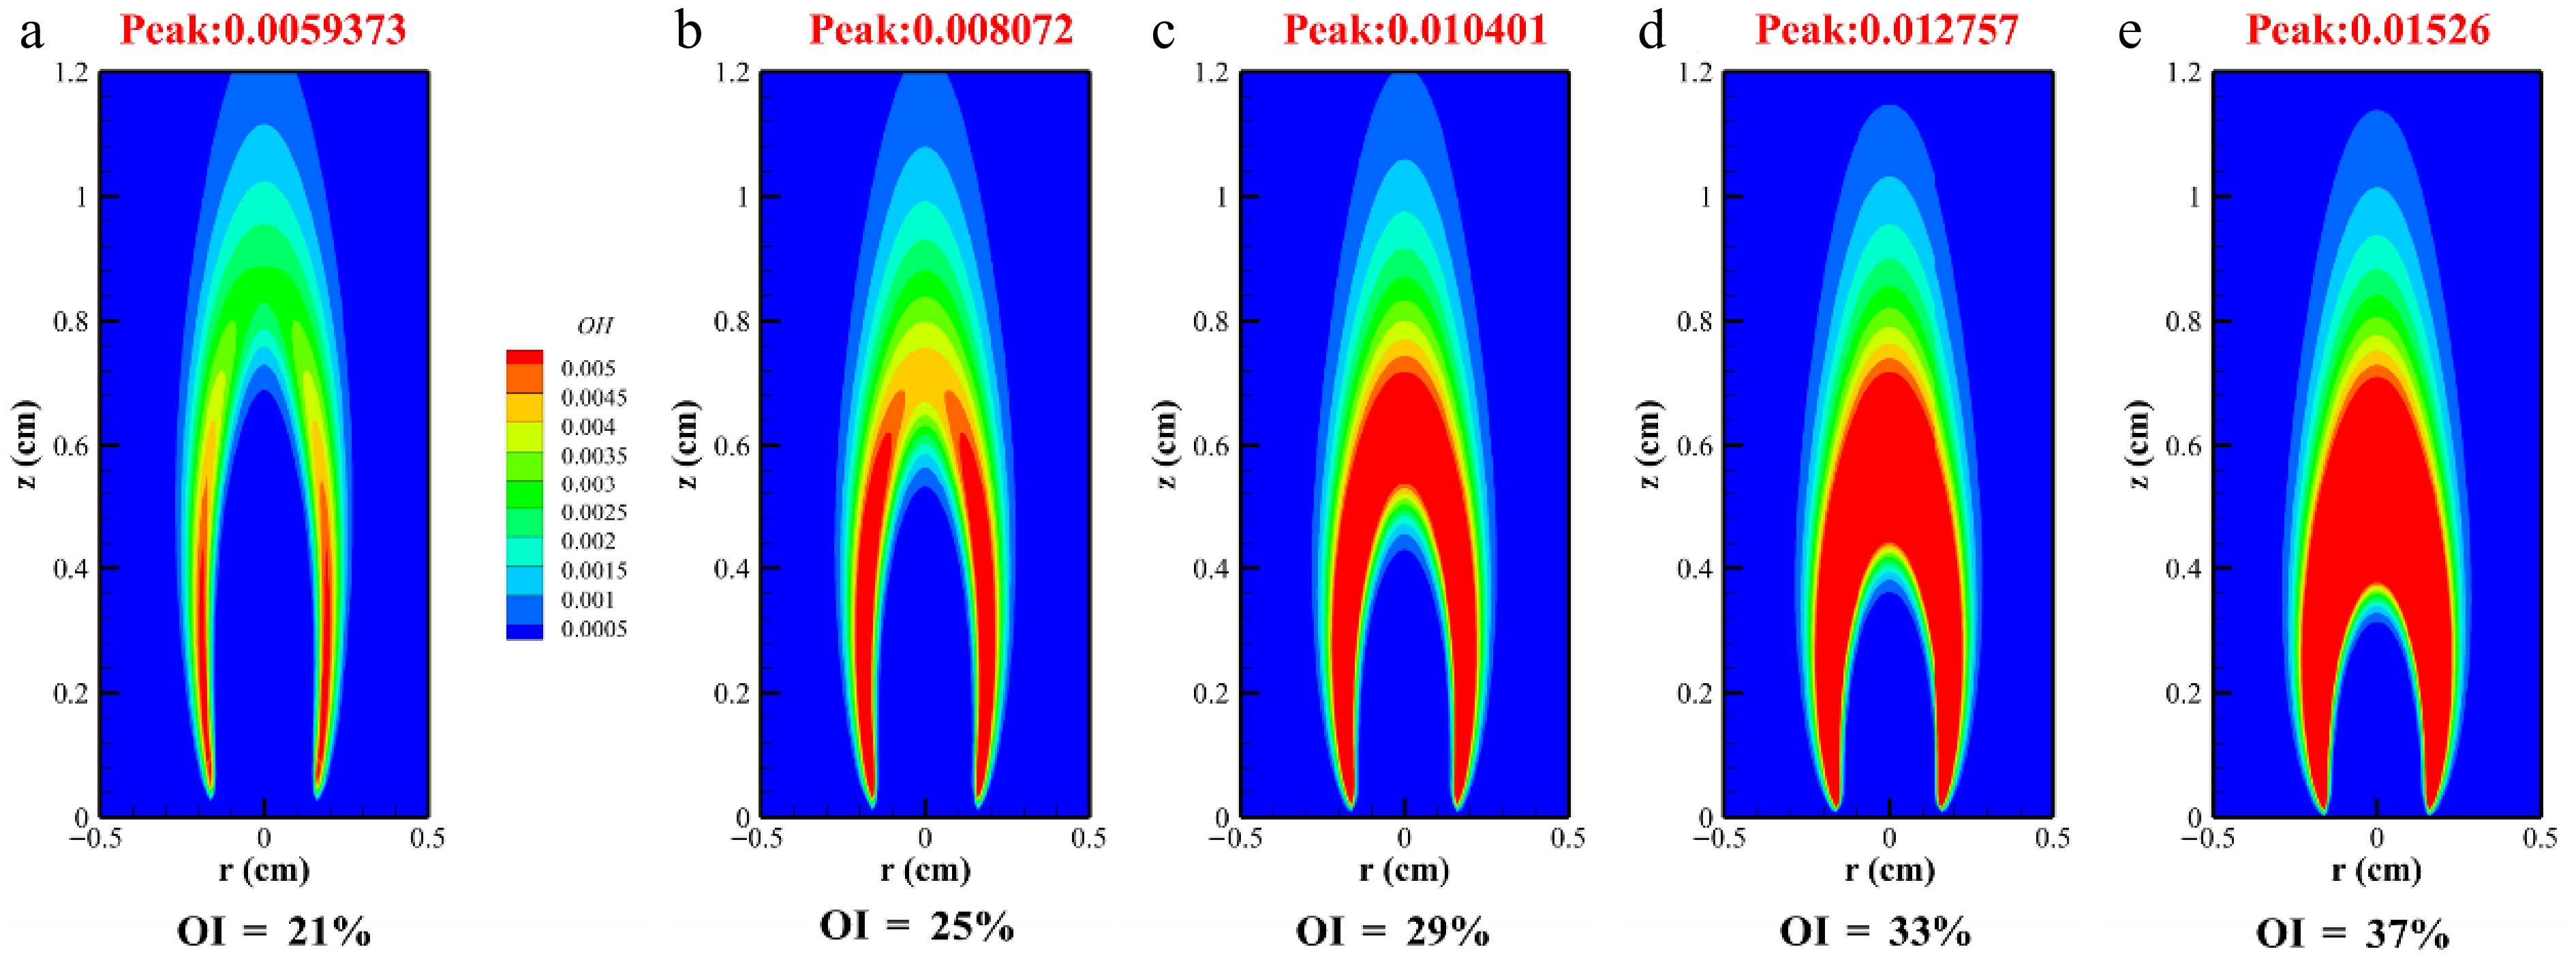
Figure 7.
Mole distribution of OH radicals in n-heptane/methane flames at different OIs.
-
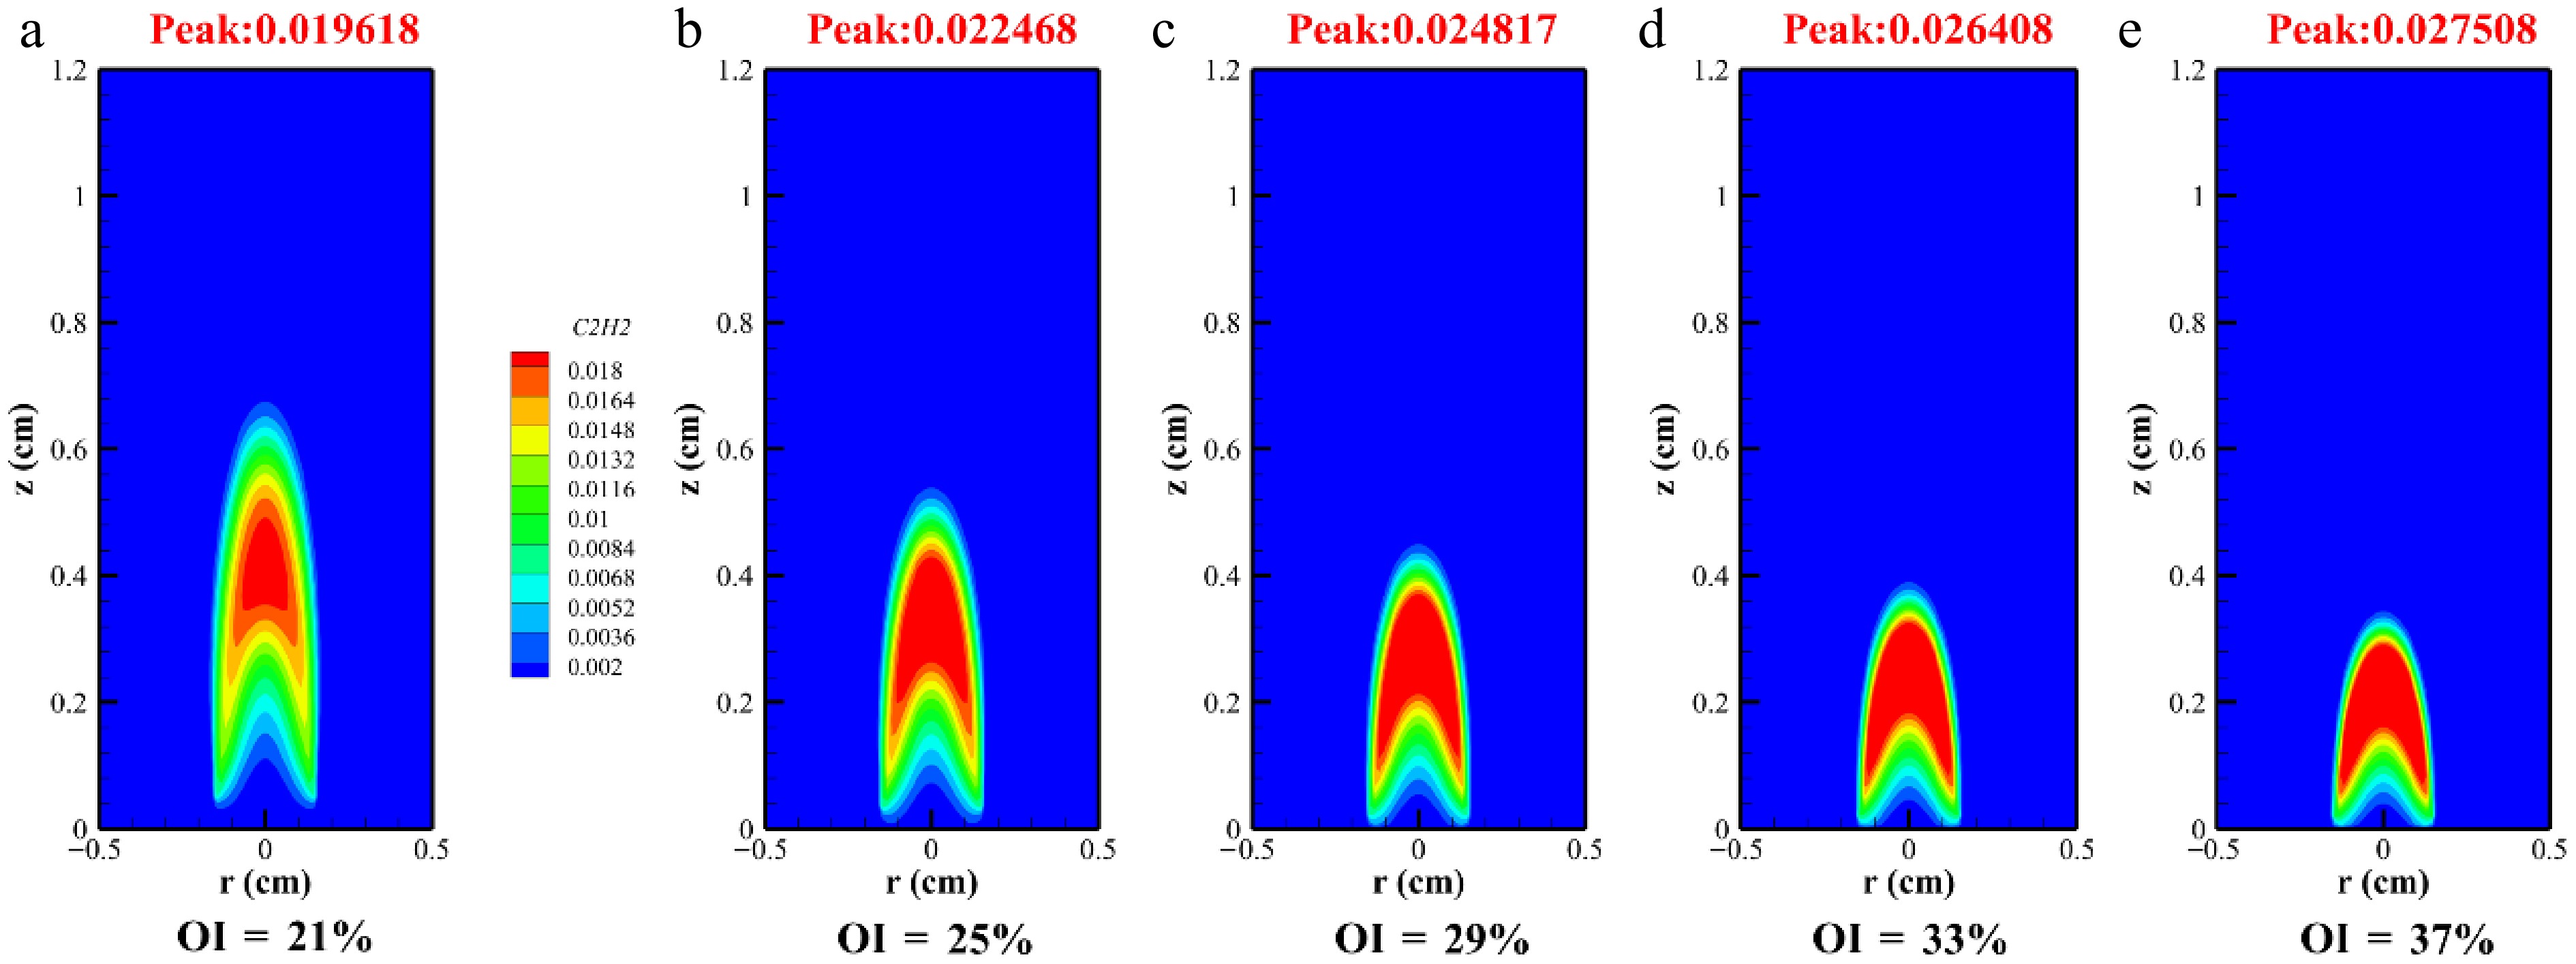
Figure 8.
Molar distribution of C2H2 in methane/n-heptane flames at different OIs.
-
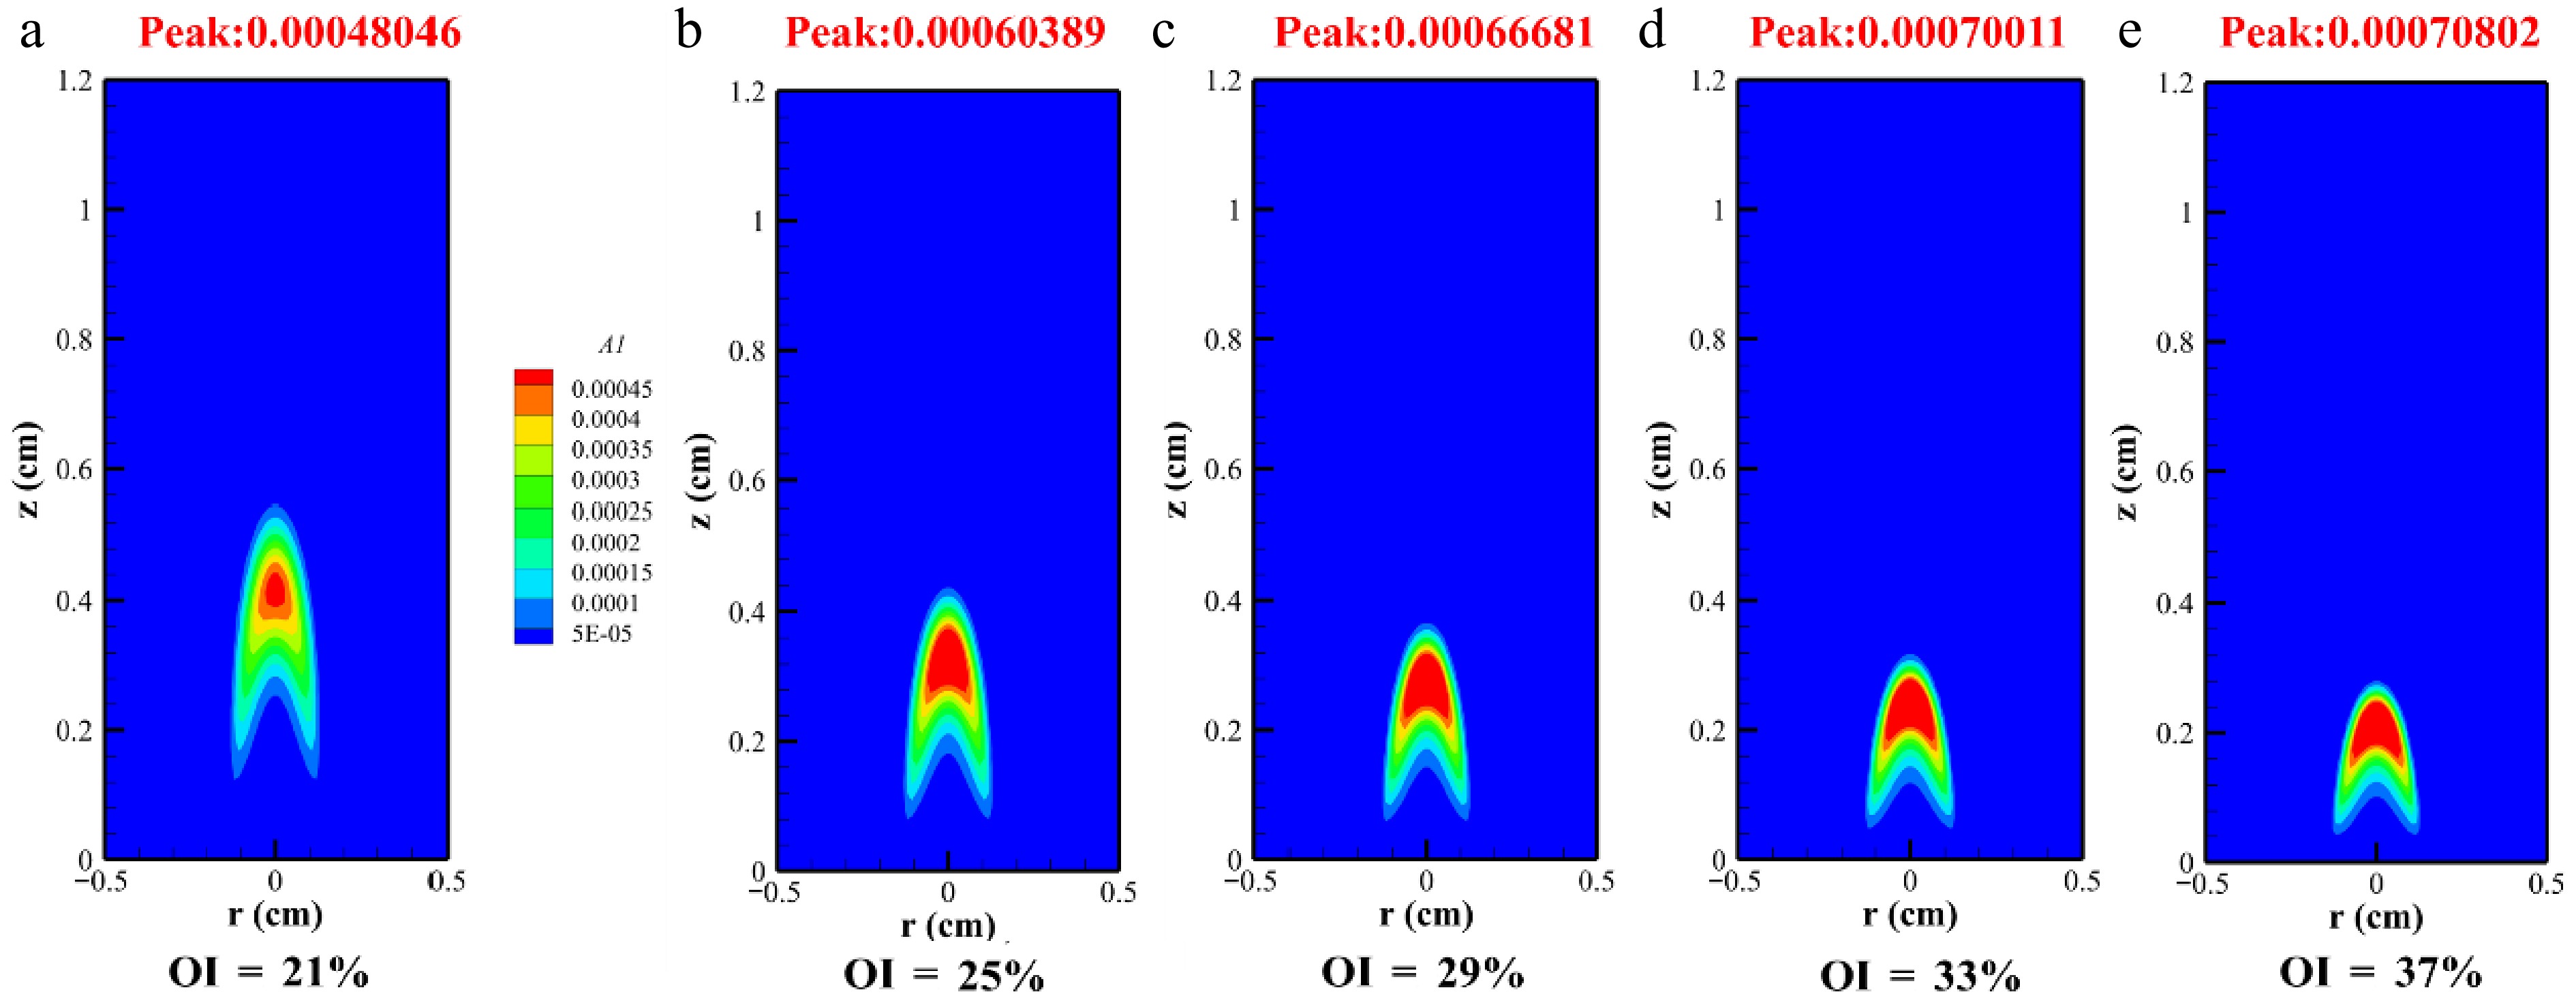
Figure 9.
Molar distribution of A1 in methane/n-heptane flames at different OIs.
-
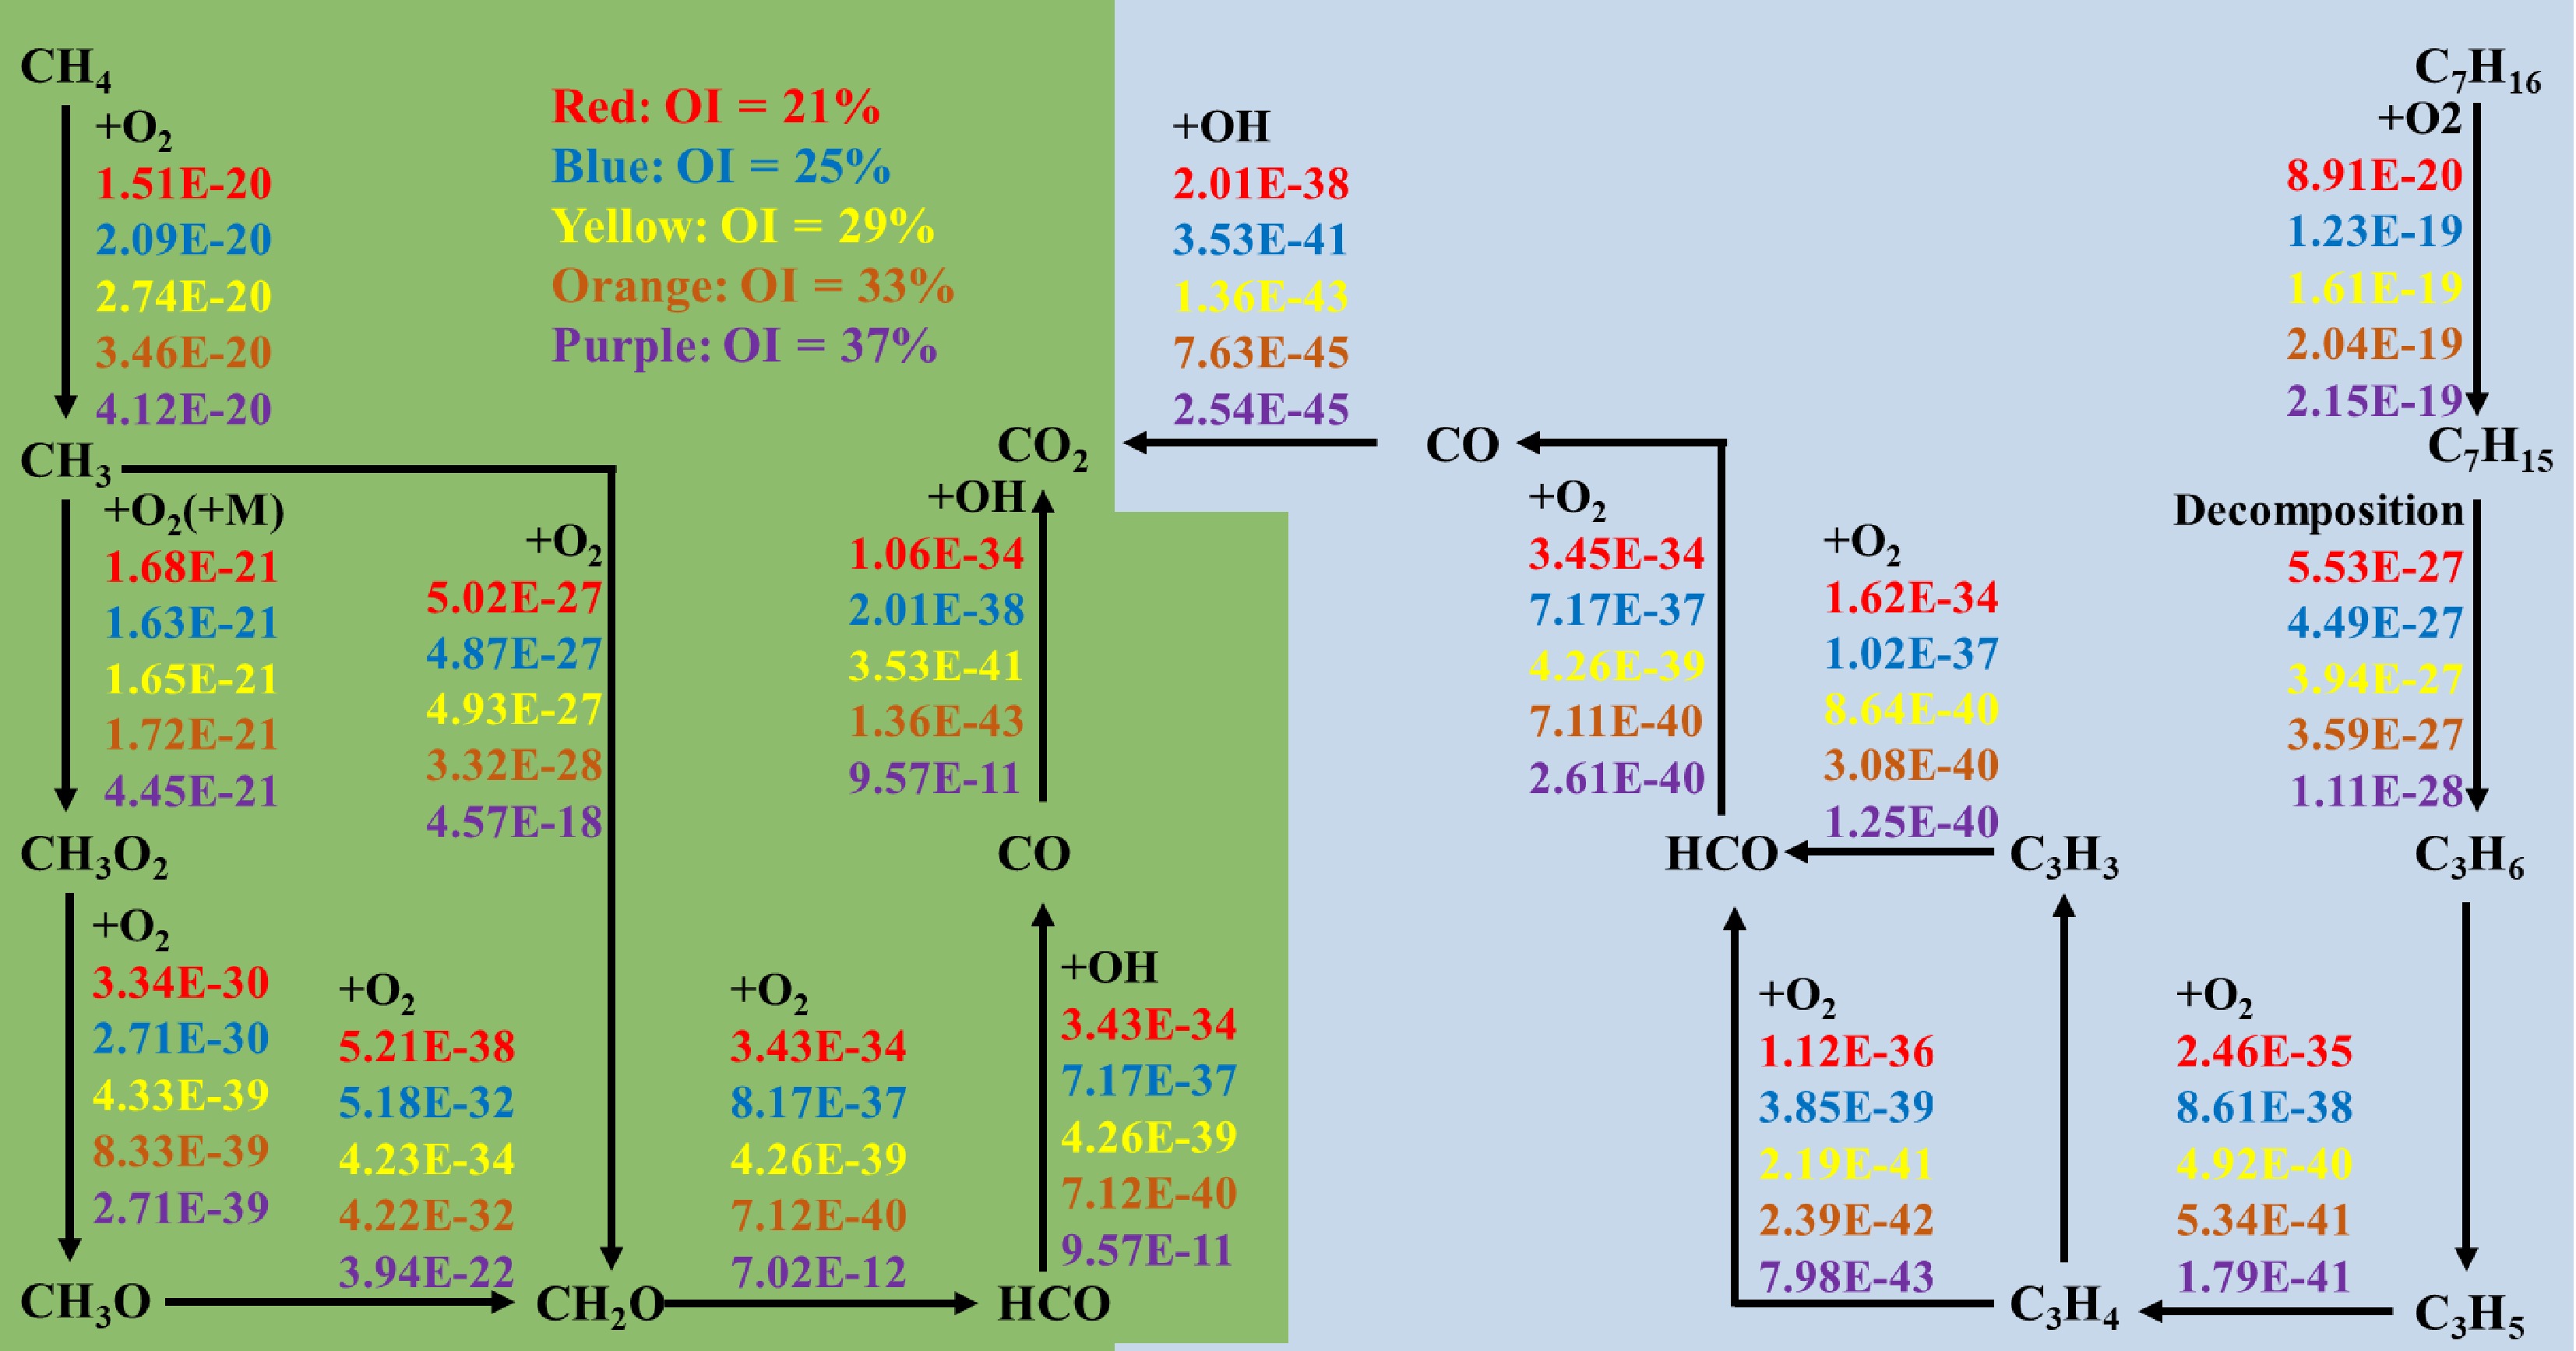
Figure 10.
Reaction pathways of methane and n-heptane at 2 atm under different OIs.
-
Cases OI
(%)Fuel (CH4 + n-heptane) Air (O2 + N2) Inlet velocity
(cm/s)Temperature
(K)Inlet velocity
(cm/s)Temperature
(K)1 21 9.35 523 46.09 473 2 25 9.35 523 38.71 473 3 29 9.35 523 33.37 473 4 33 9.35 523 29.33 473 5 37 9.35 523 26.16 473 Table 1.
Calculated operating conditions.
Figures
(10)
Tables
(1)