-
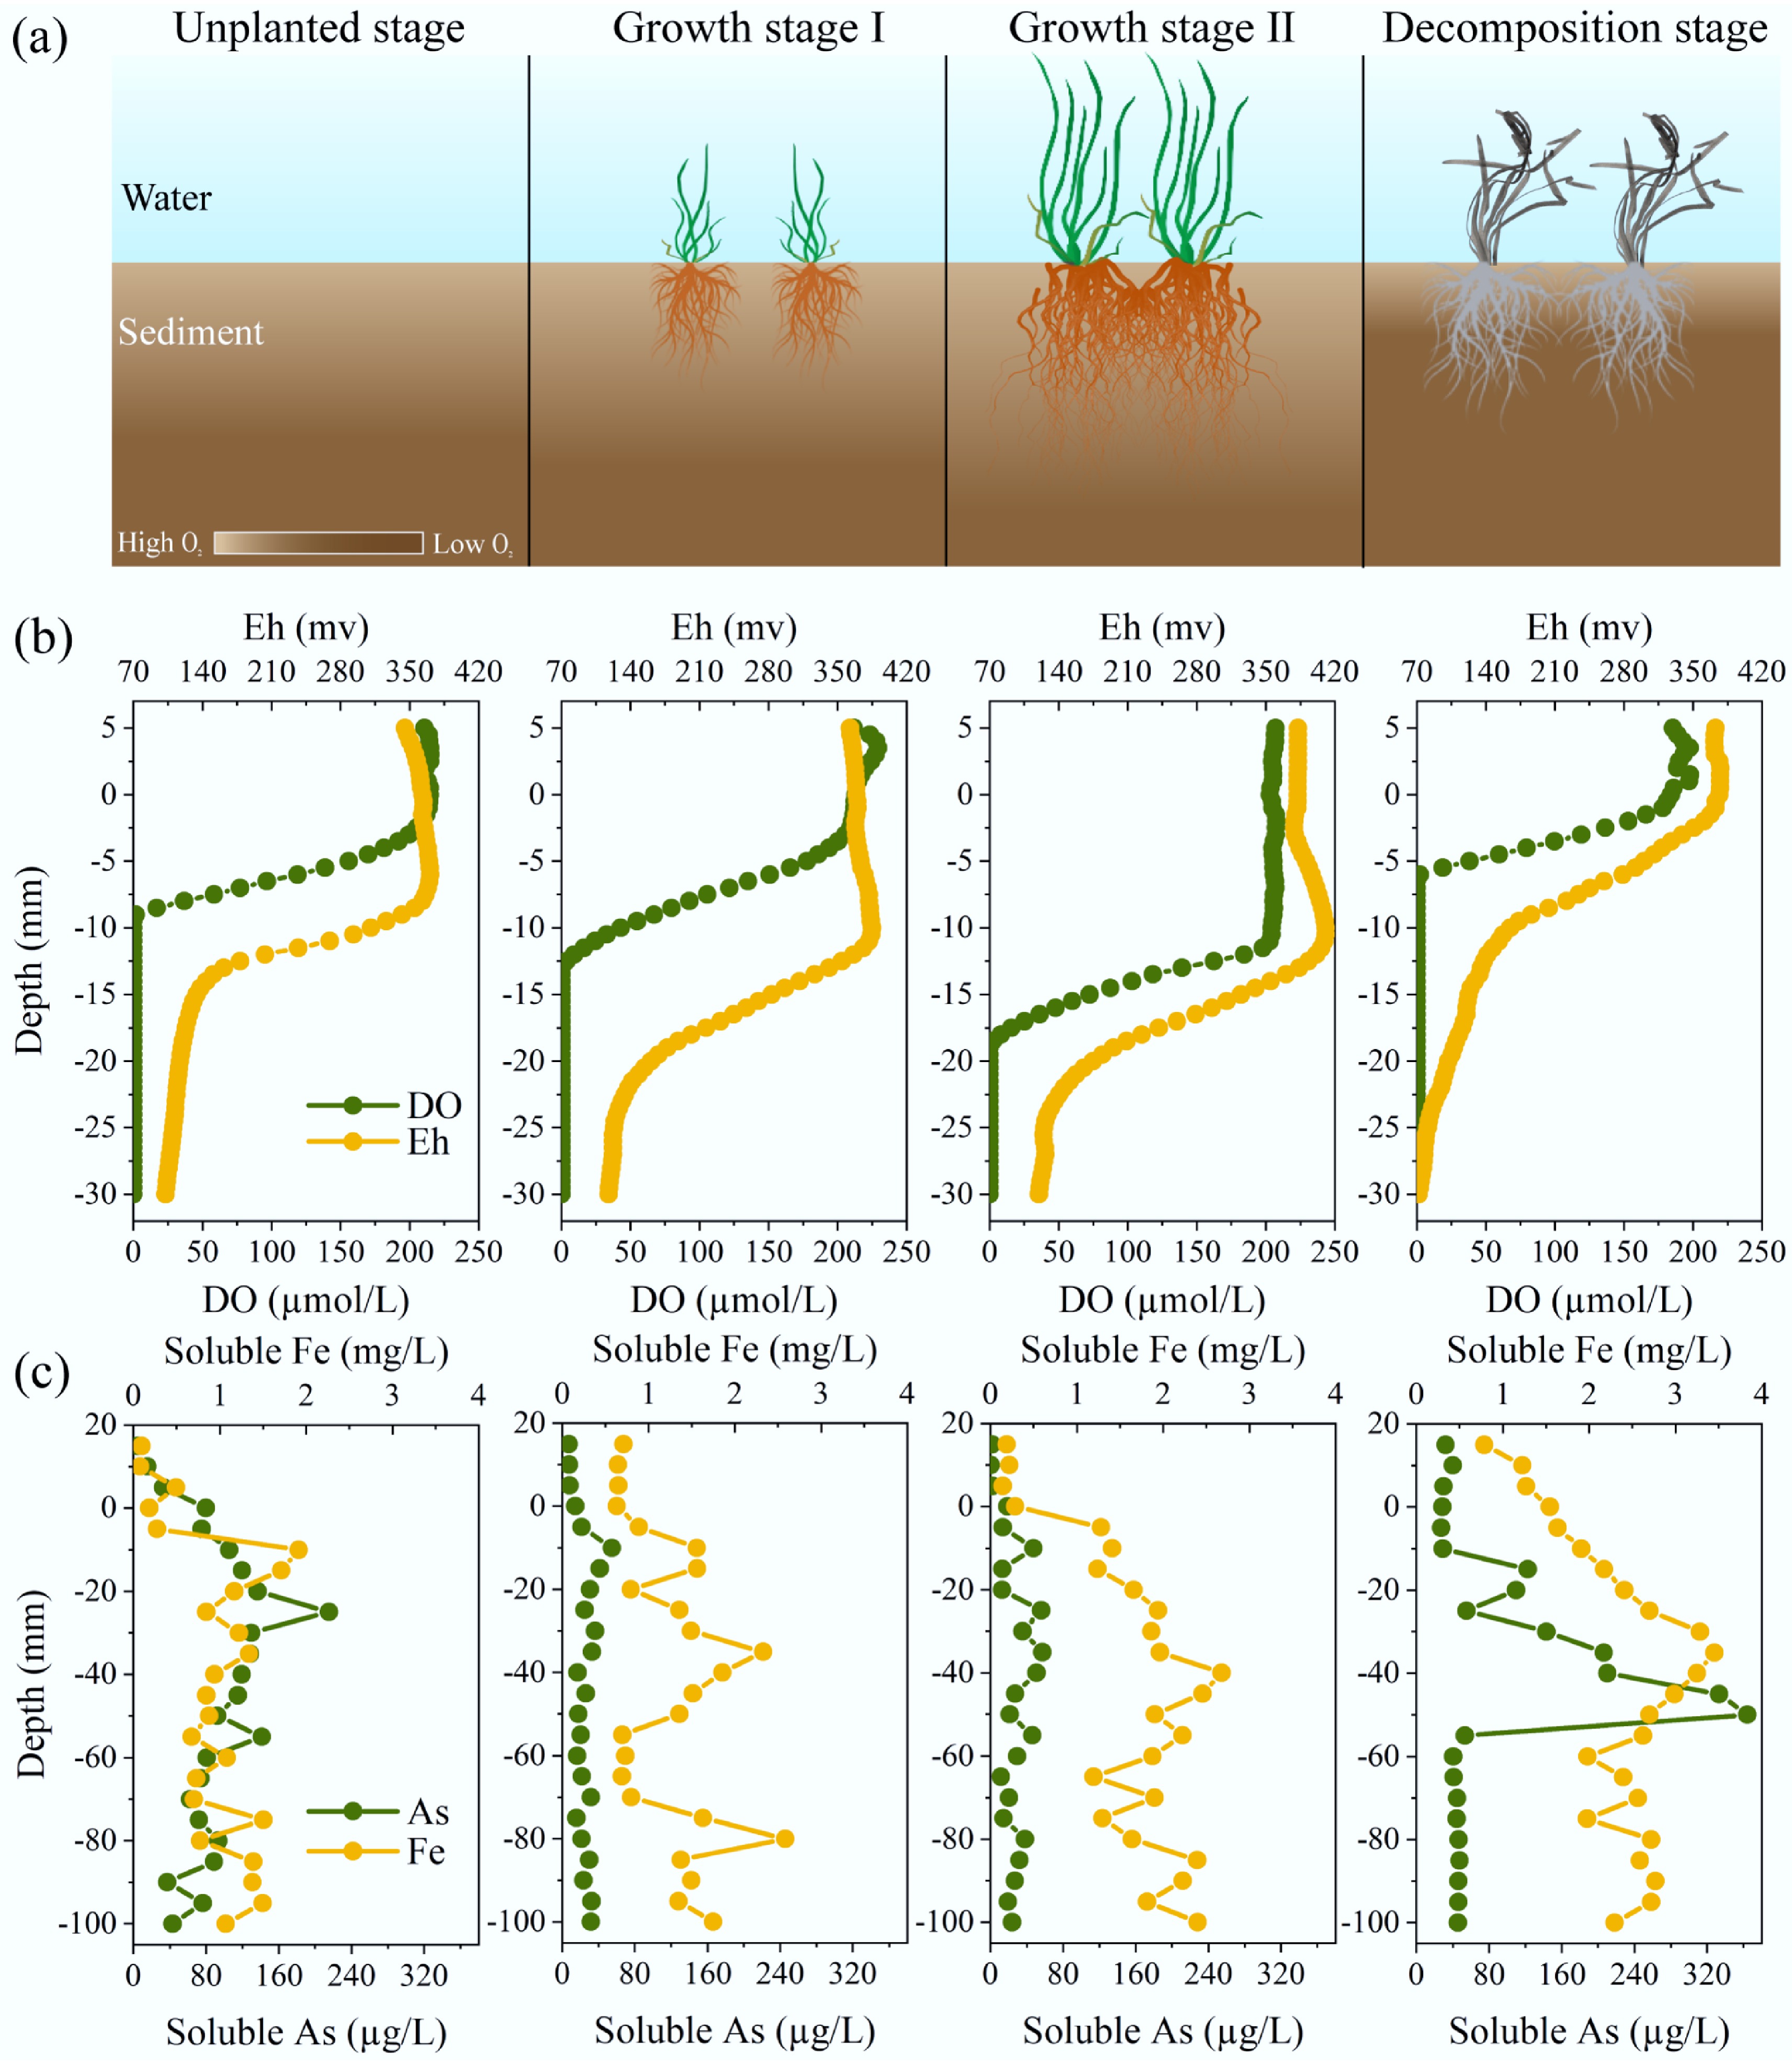
Figure 1.
Changes in physico-chemical properties in sediments during growth and death of submerged macrophytes. (a) Schematic illustration of growth and death of macrophytes, which changes the redox environments in sediments. (b) Vertical distributions of DO and Eh, and soluble As and Fe in sediments. (c) Vertical distributions of soluble As and Fe in sediments.
-
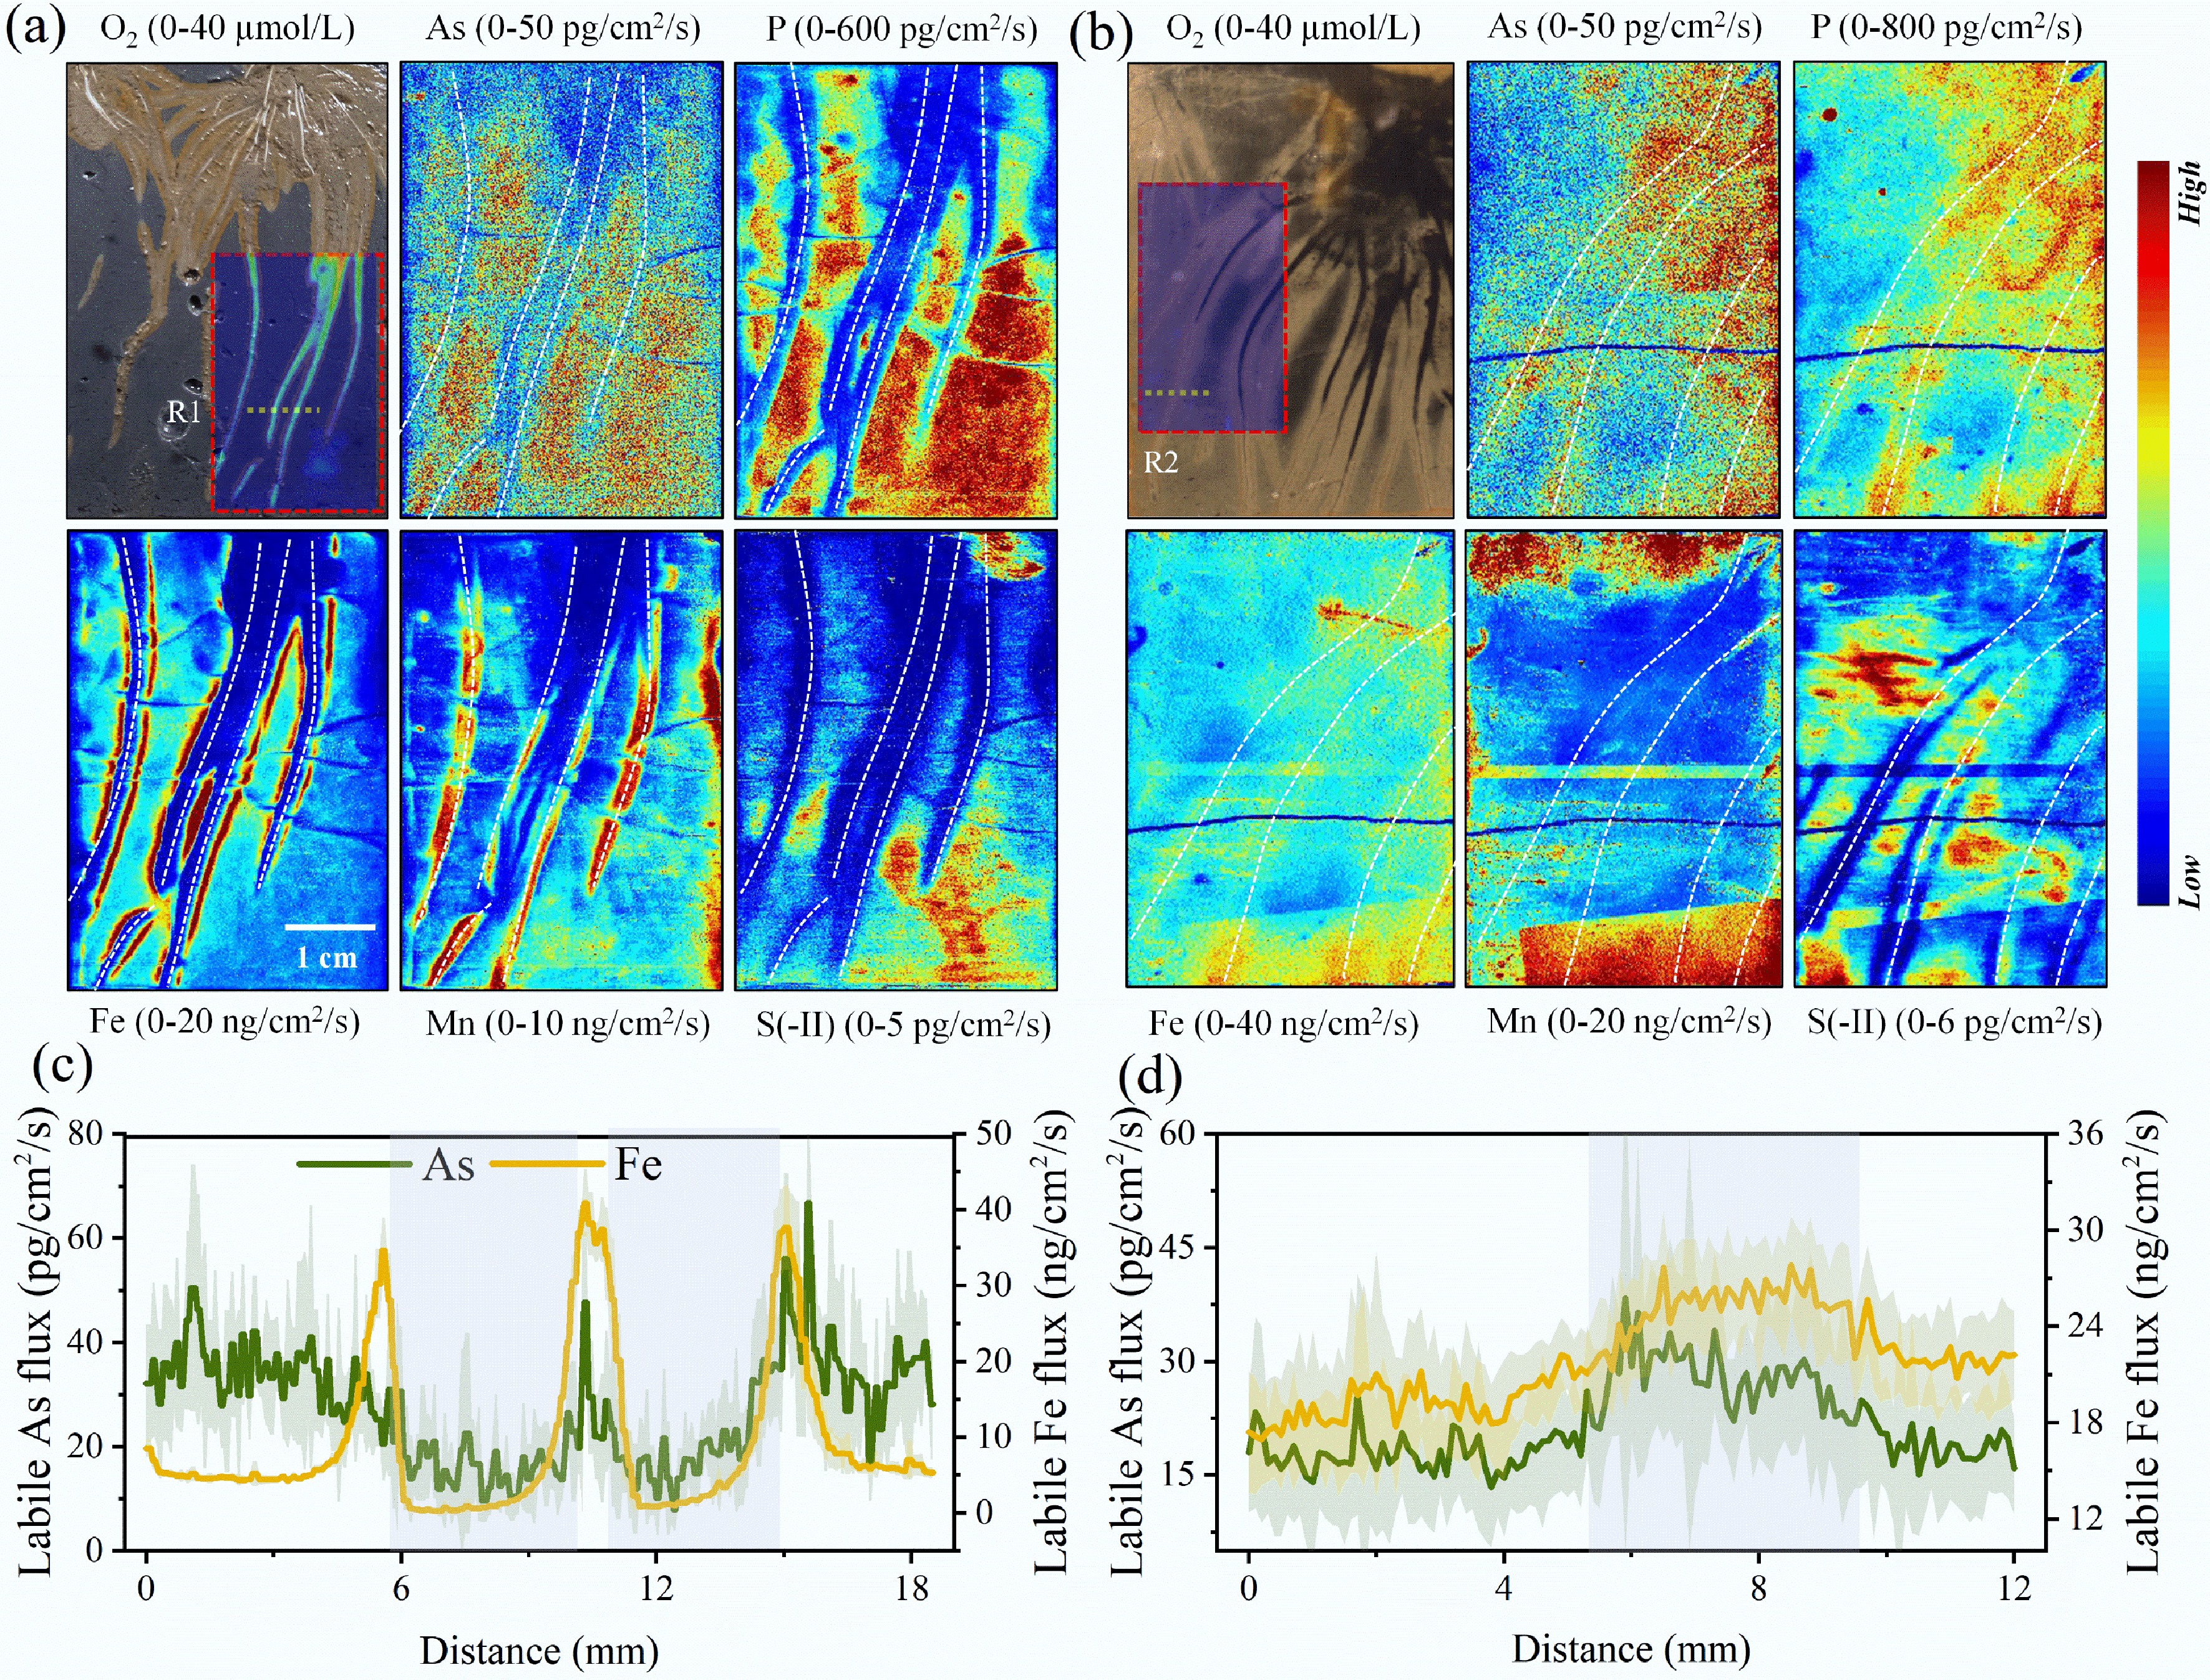
Figure 2.
High-resolution imaging of O2, As, and other relevant elements in sediments Two-dimensional distribution of O2 and labile fluxes of As, P, Fe, Mn, and S(-II) in the (a) rhizosphere, and (b) detritusphere. The white dotted lines represent the position of the roots. One-dimensional distribution of labile fluxes of As and Fe in the (c) rhizosphere (R1), and (d) detritusphere (R2), grey areas indicate rhizosphere or detritusphere.
-
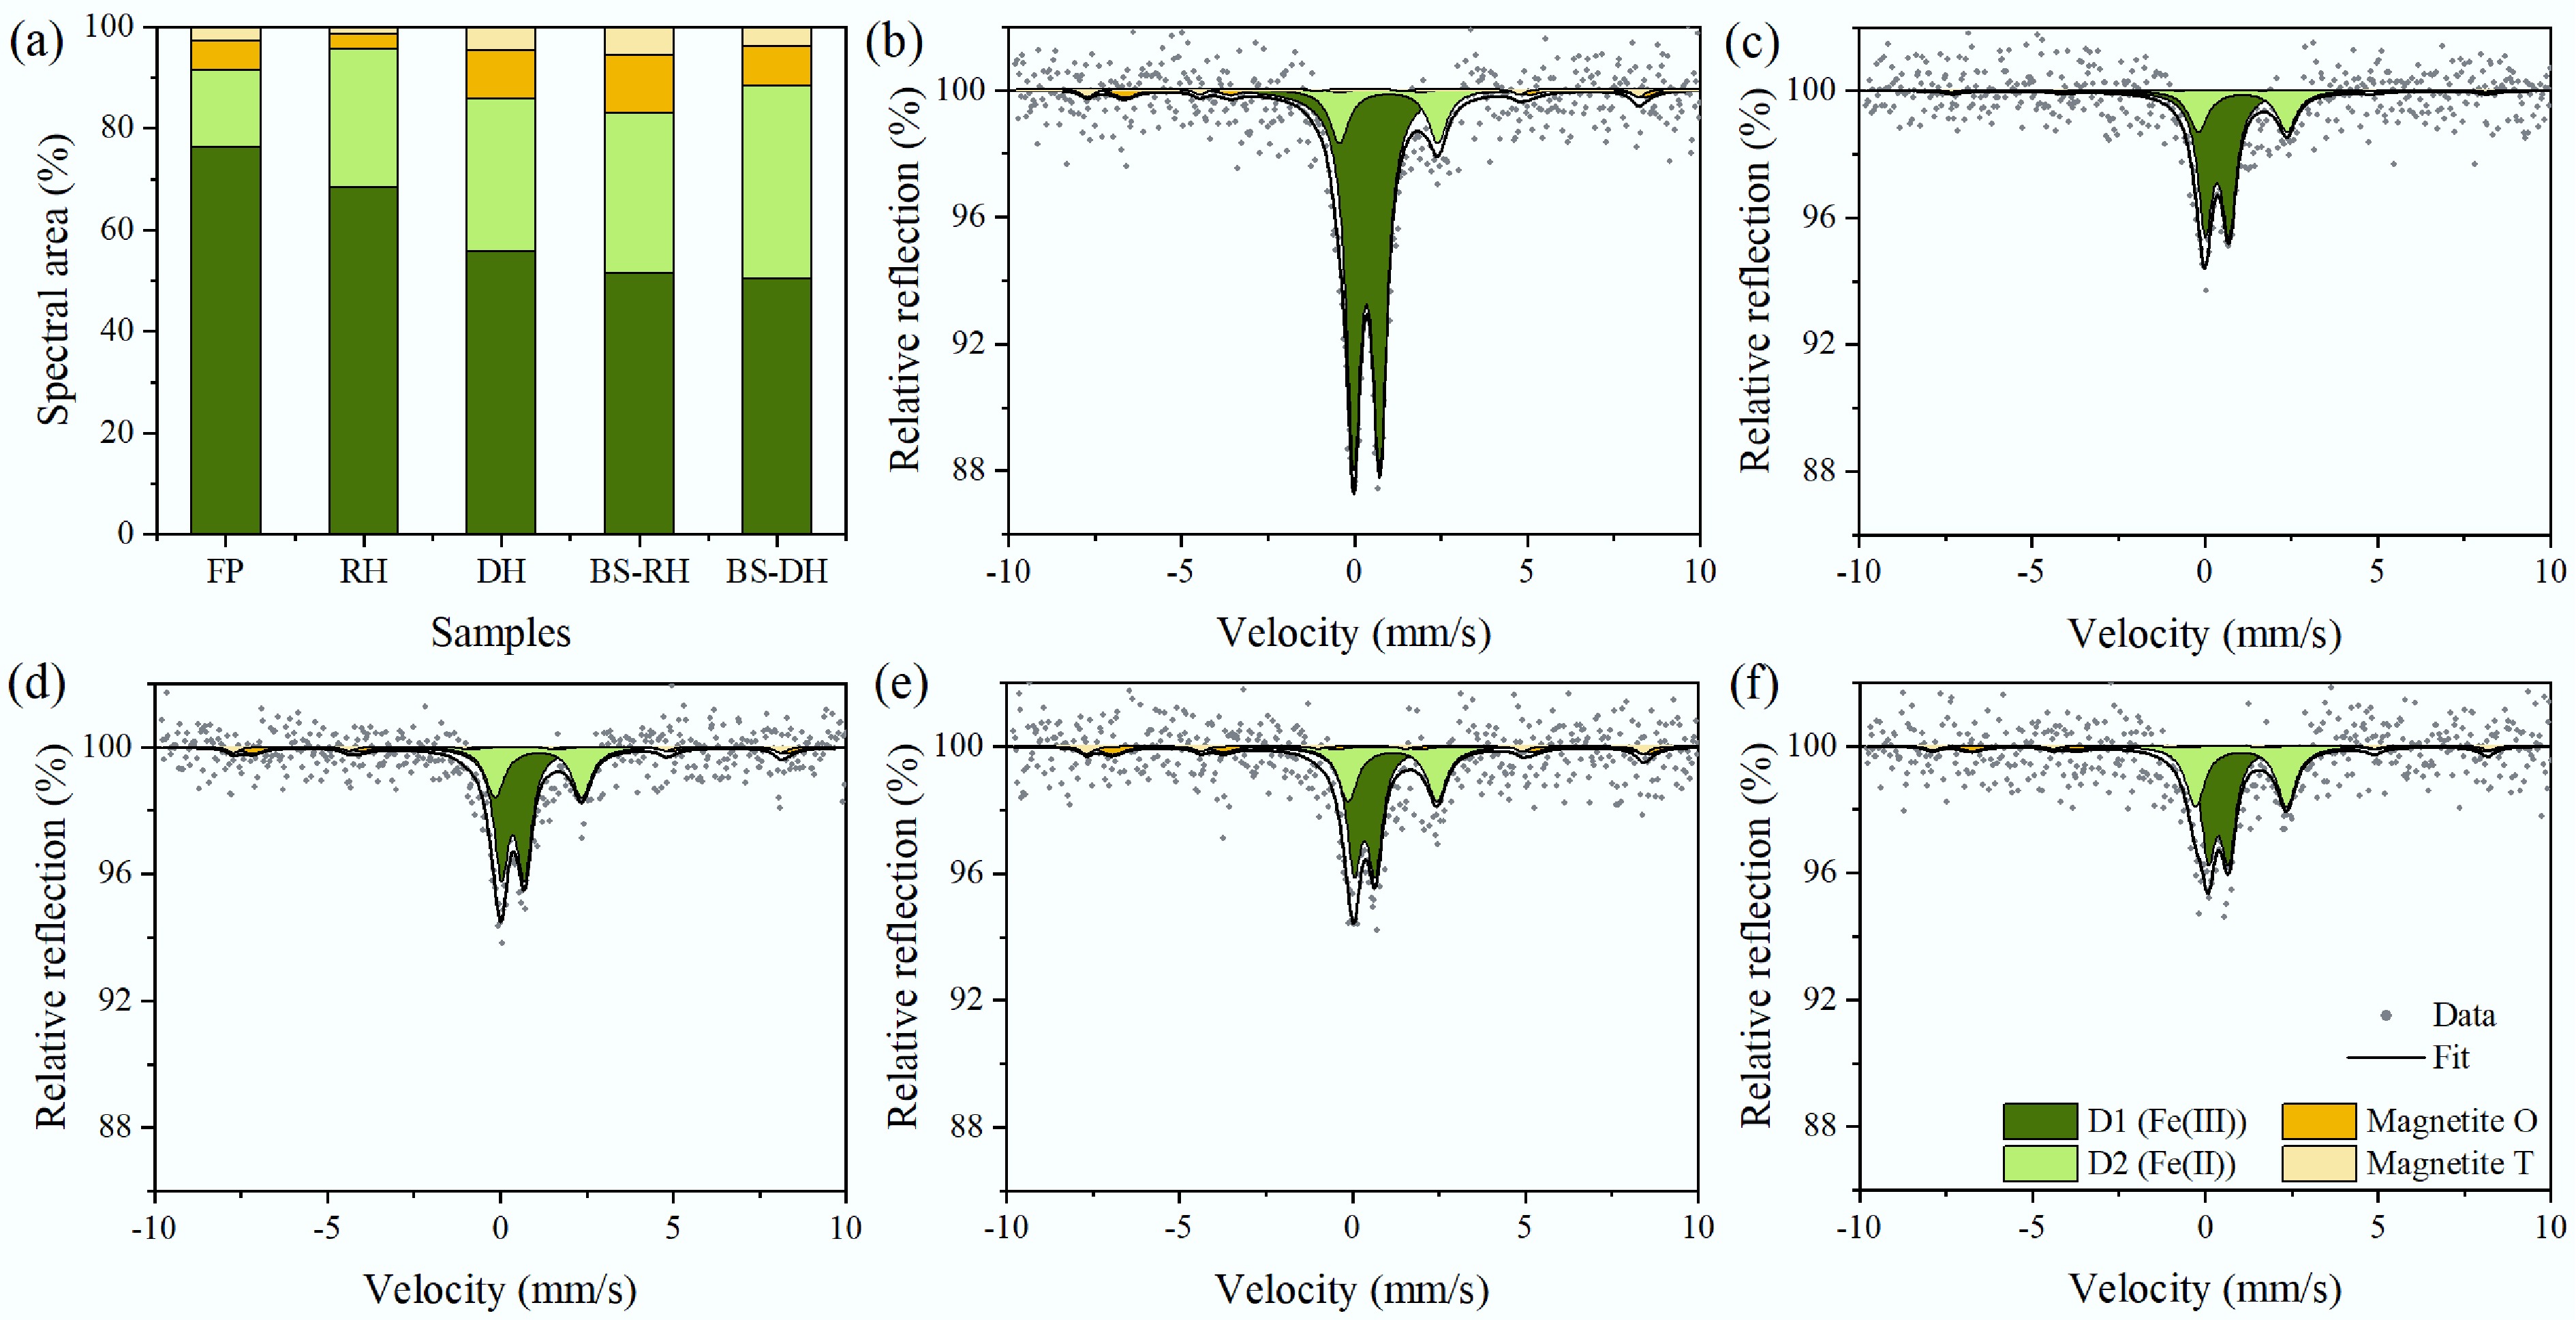
Figure 3.
(a) Fe phase fractions, and (b) corresponding Mössbauer spectra of Fe plaque (FP), (c) rhizosphere (RH), (d) detritusphere (DH), (e) bulk sediments during macrophytes growth (BS-RH), and (f) bulk sediments during macrophytes death (BS-DH).
-
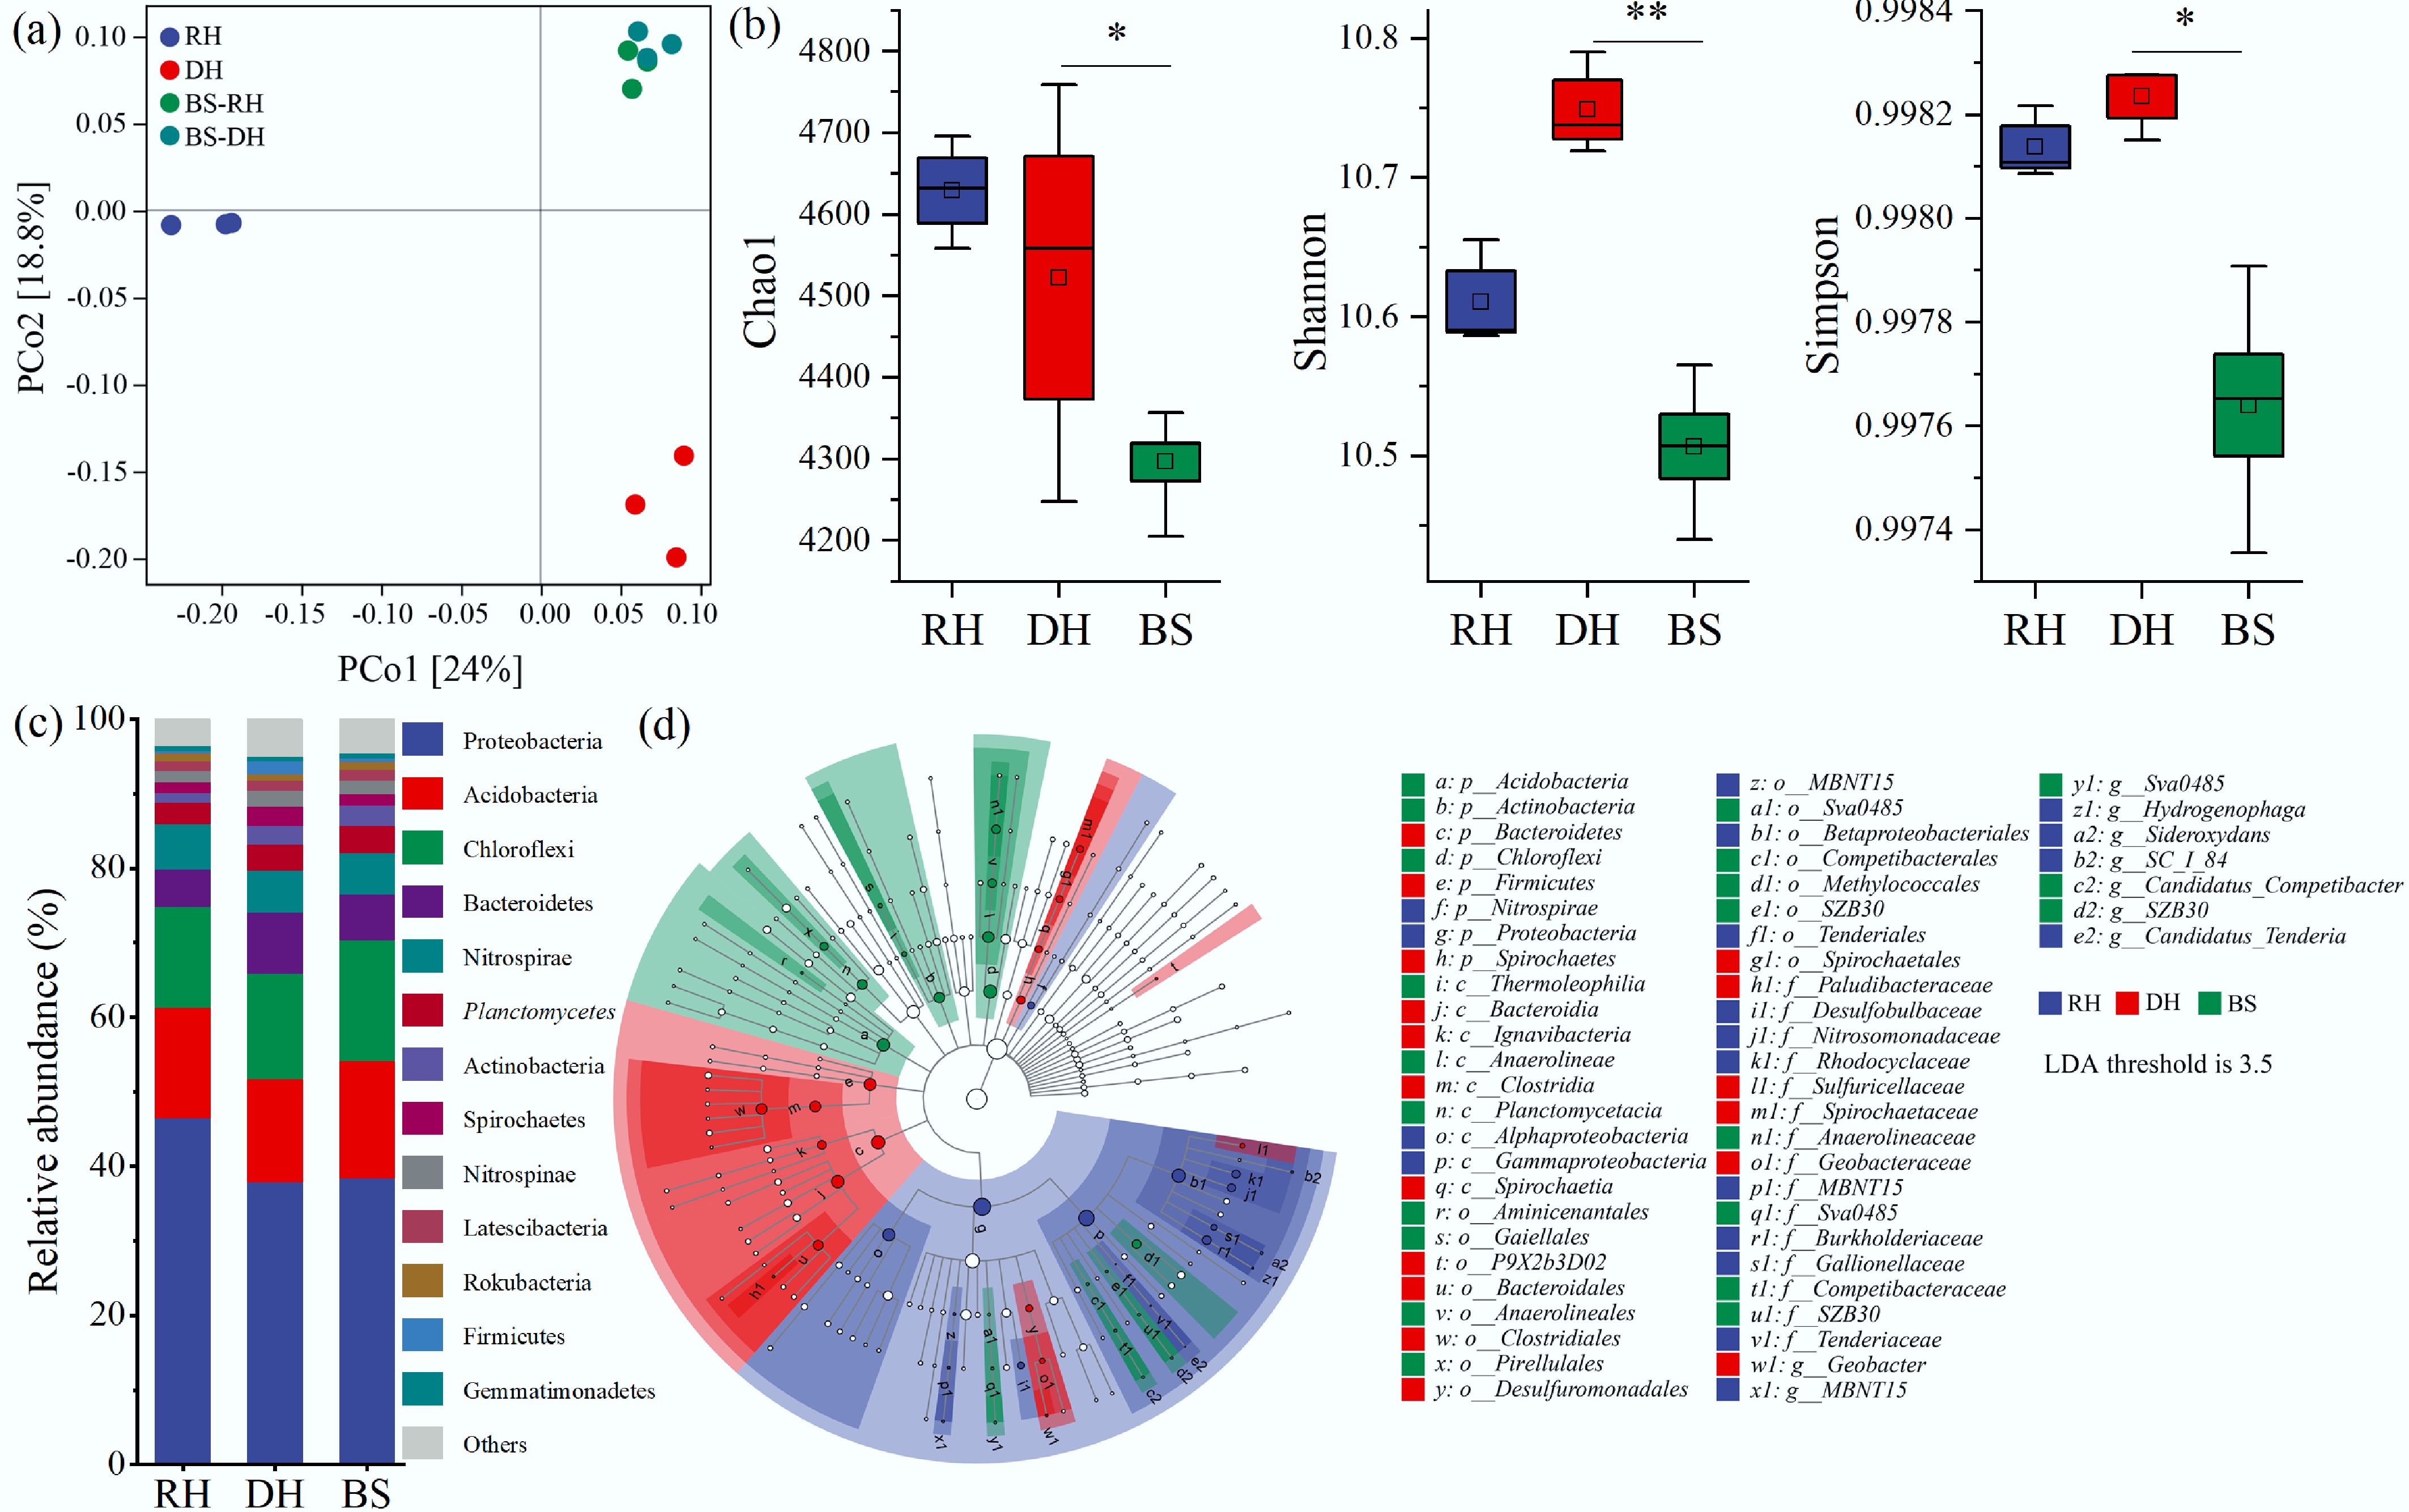
Figure 4.
Microbial diversity and community structures in the rhizosphere (RH), detritusphere (DH), and bulk sediment (BS). (a) Composition and structure differences of microbial communities using principal coordinate analysis (PCoA) based on the Bray-Curtis distance, with significant differences analyzed by permutational multivariate analysis of variance (PERMANOVA). (b) α-diversity, including the Chao1, Shannon, and Simpson indexes. (c) Relative abundance of bacterial communities at the phylum level. (d) Bacterial relationships among taxonomic units of microbiota, ranging from the phylum level down to the genus level. Significant differences at * p < 0.05, and ** p < 0.01.
-
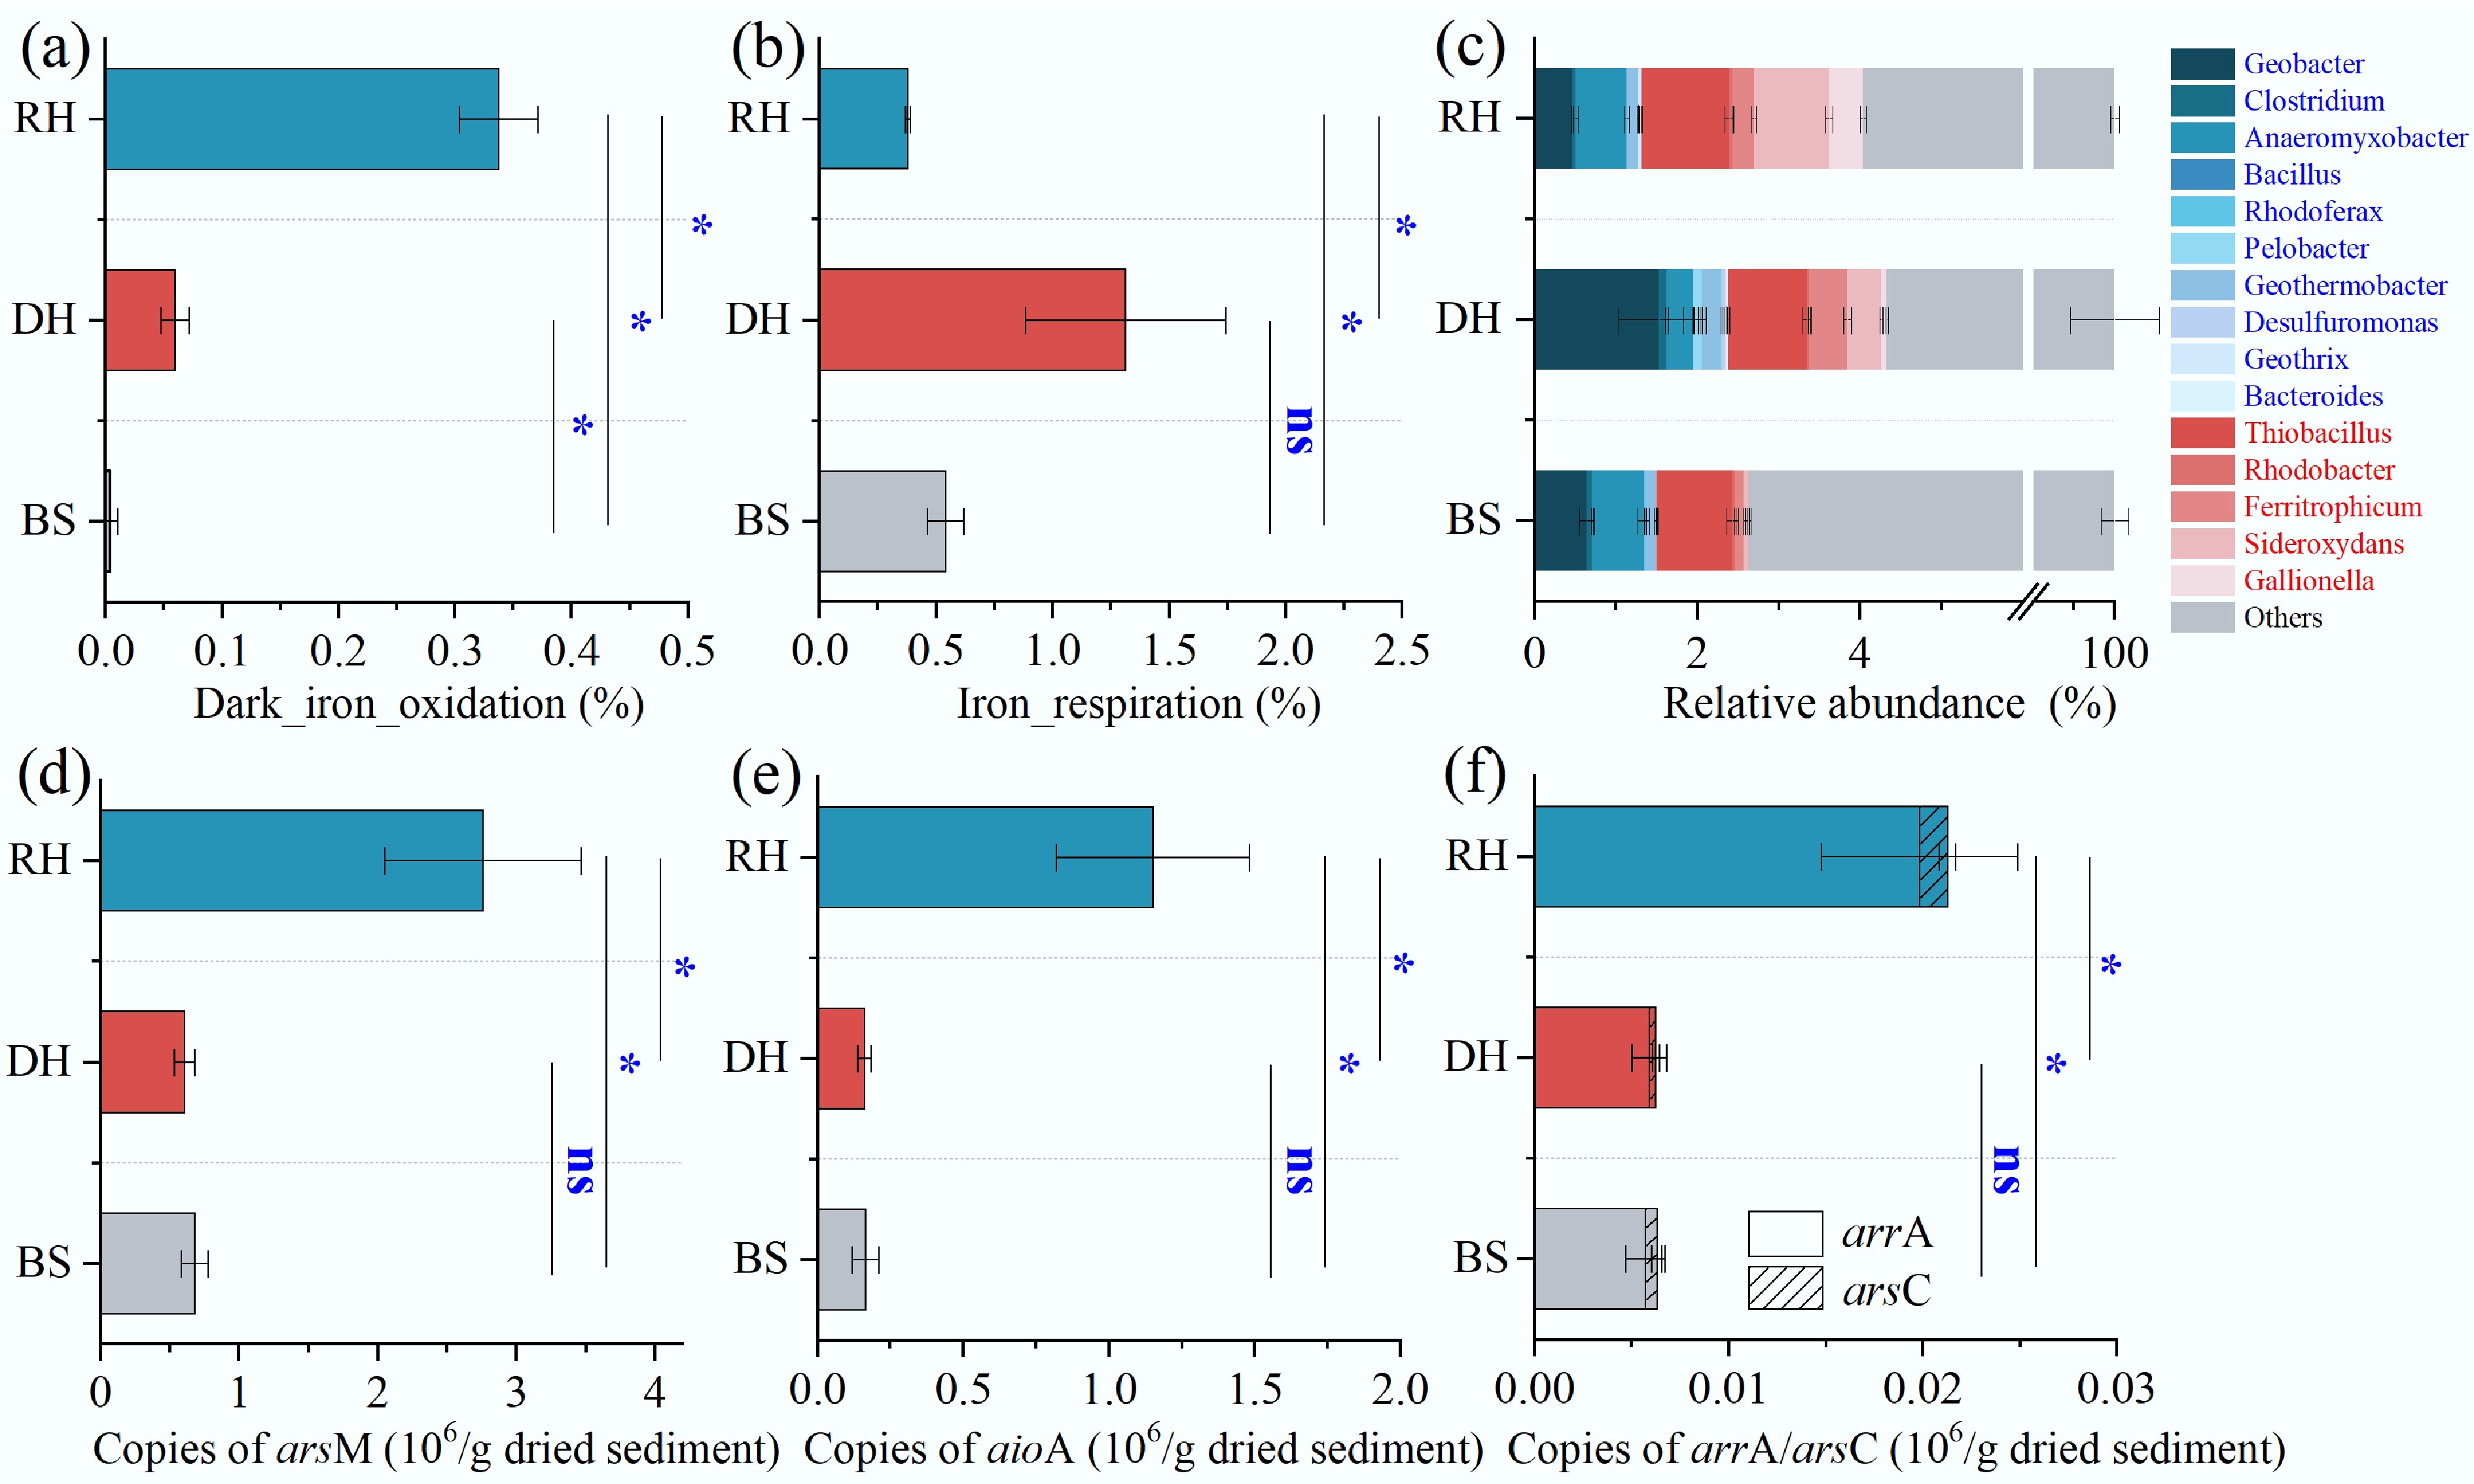
Figure 5.
Relative 16S rRNA (gene) abundance of Fe-cycling microbial communities and absolute quantification of As biotransformation genes in the rhizosphere (RH), detritusphere (DH), and bulk sediment (BS). (a) Dark_iron_oxidation function. (b) Iron_respiration function. (c) Relative abundance of typical Fe-reducing (bule text), and Fe-oxidizing (red text) bacteria. (d)–(f) Abundance of the arsM, aioA, arrA, and arsC, respectively. Significance levels at * p < 0.05; ns, not significant.
-
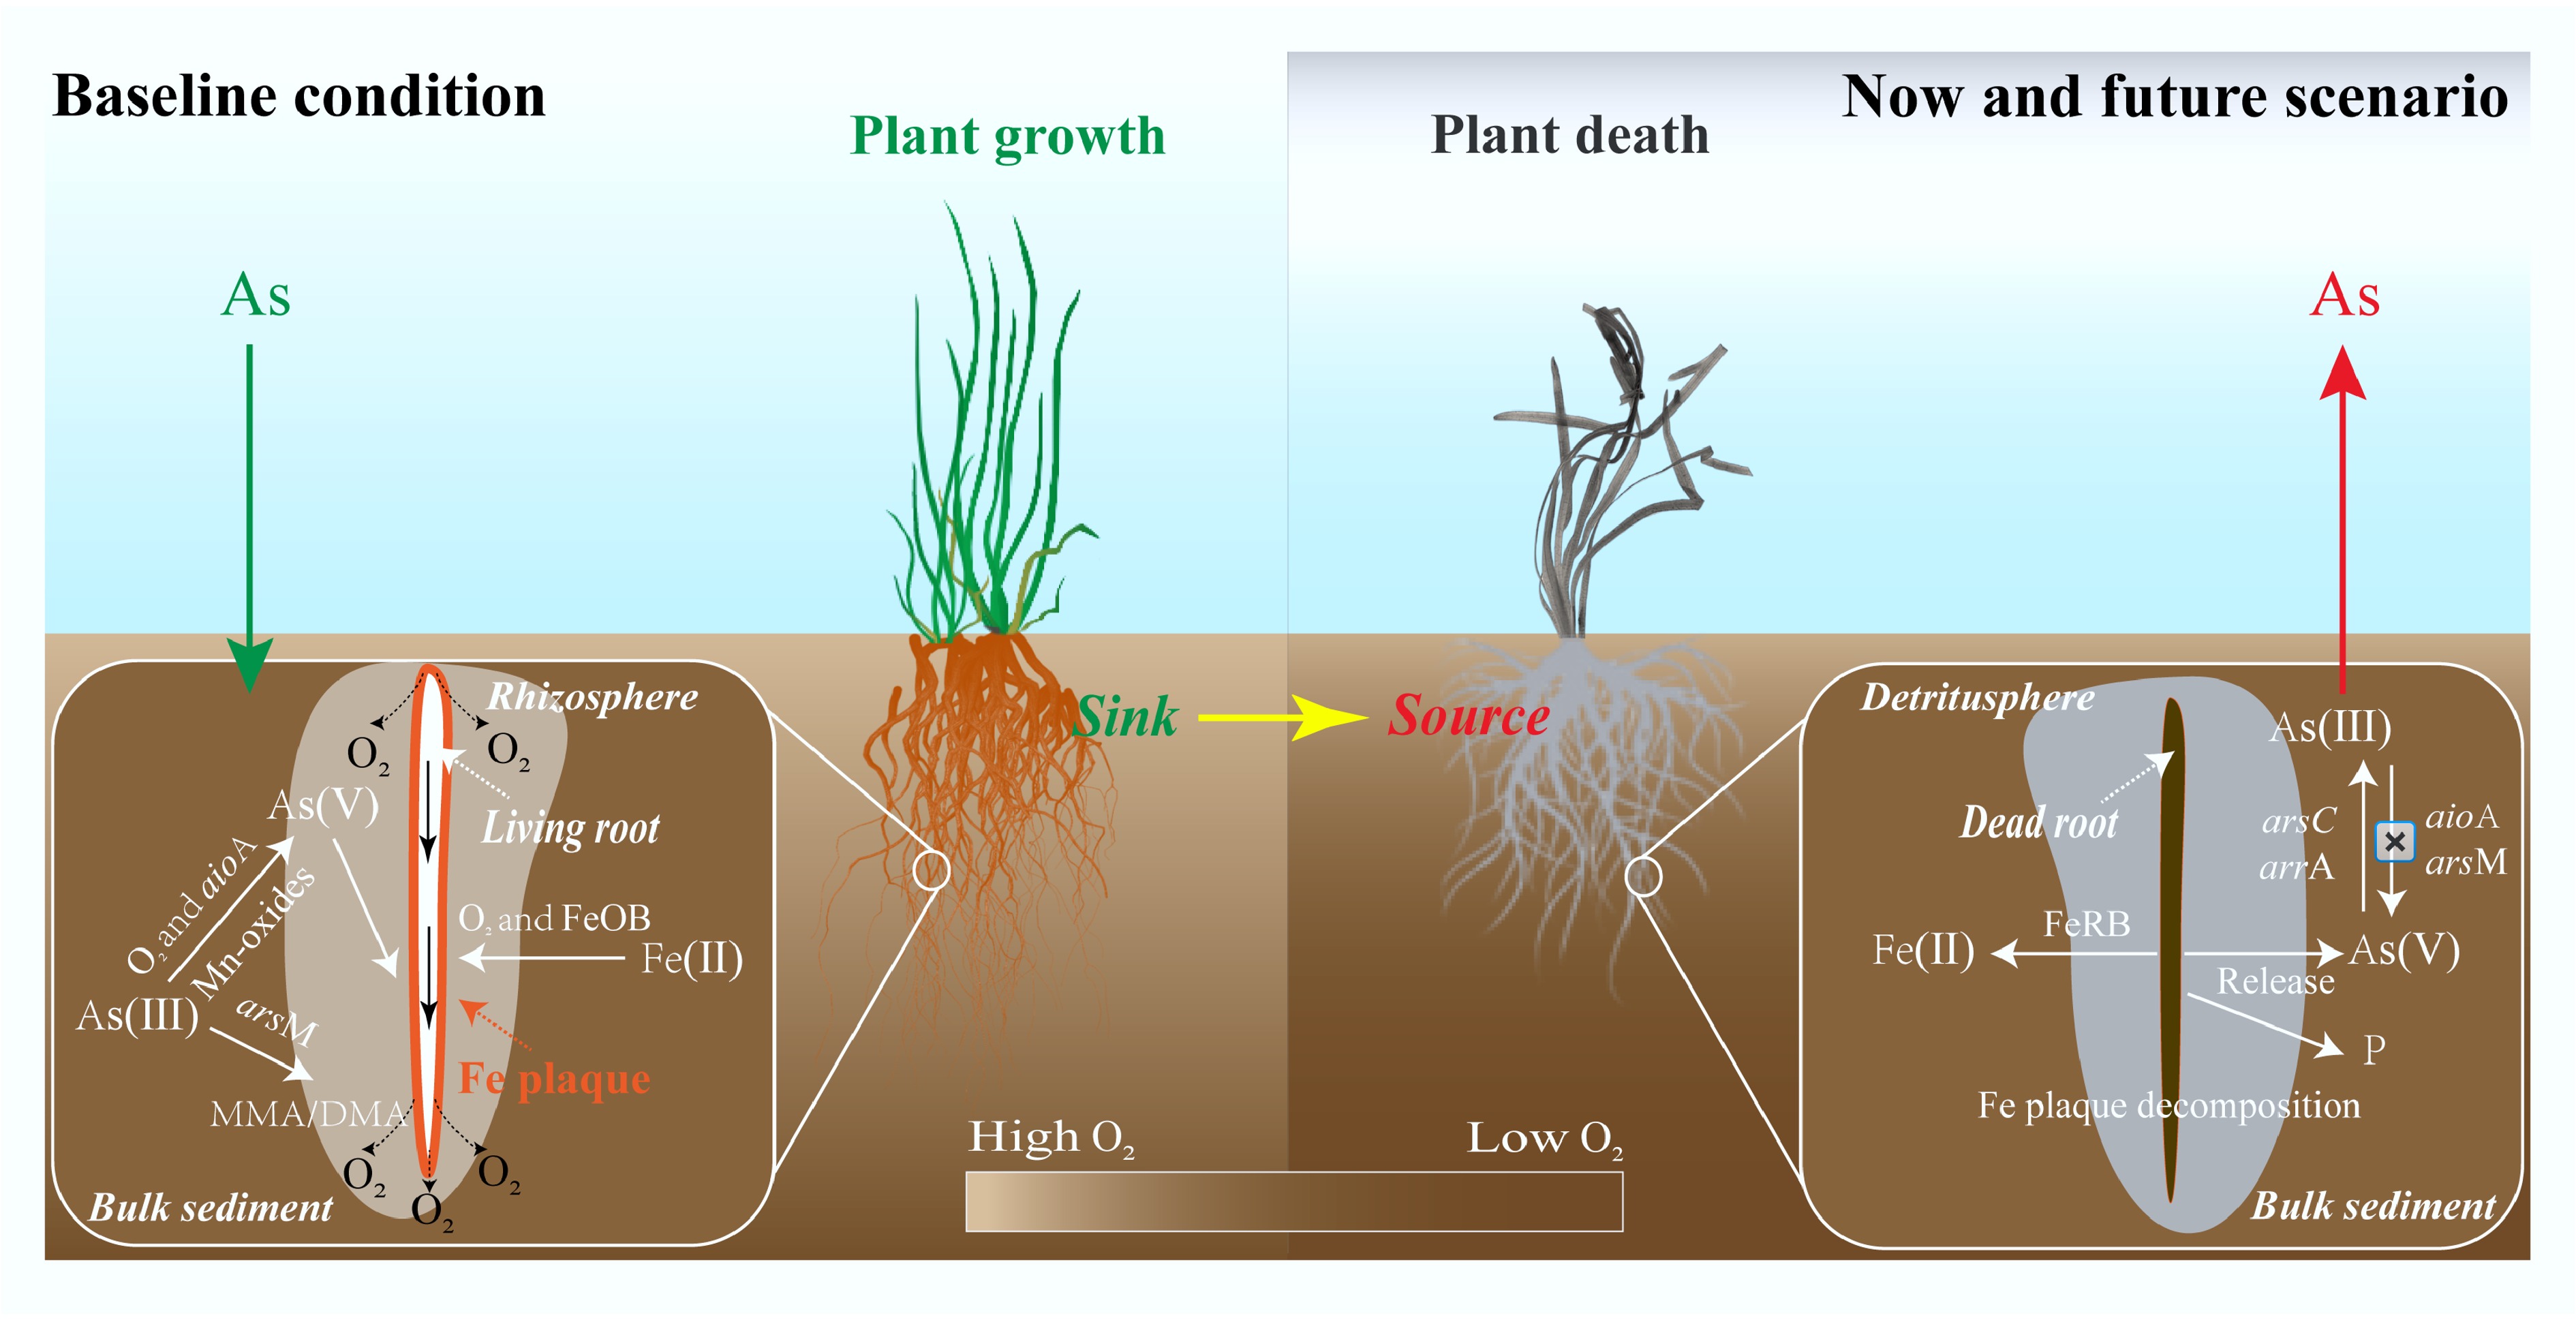
Figure 6.
Conceptual diagram of As mobilization processes in the rhizosphere and detritusphere. Baseline conditions (left) are compared to now and future scenarios (right) of widespread loss of submerged macrophytes.
Figures
(6)
Tables
(0)