-
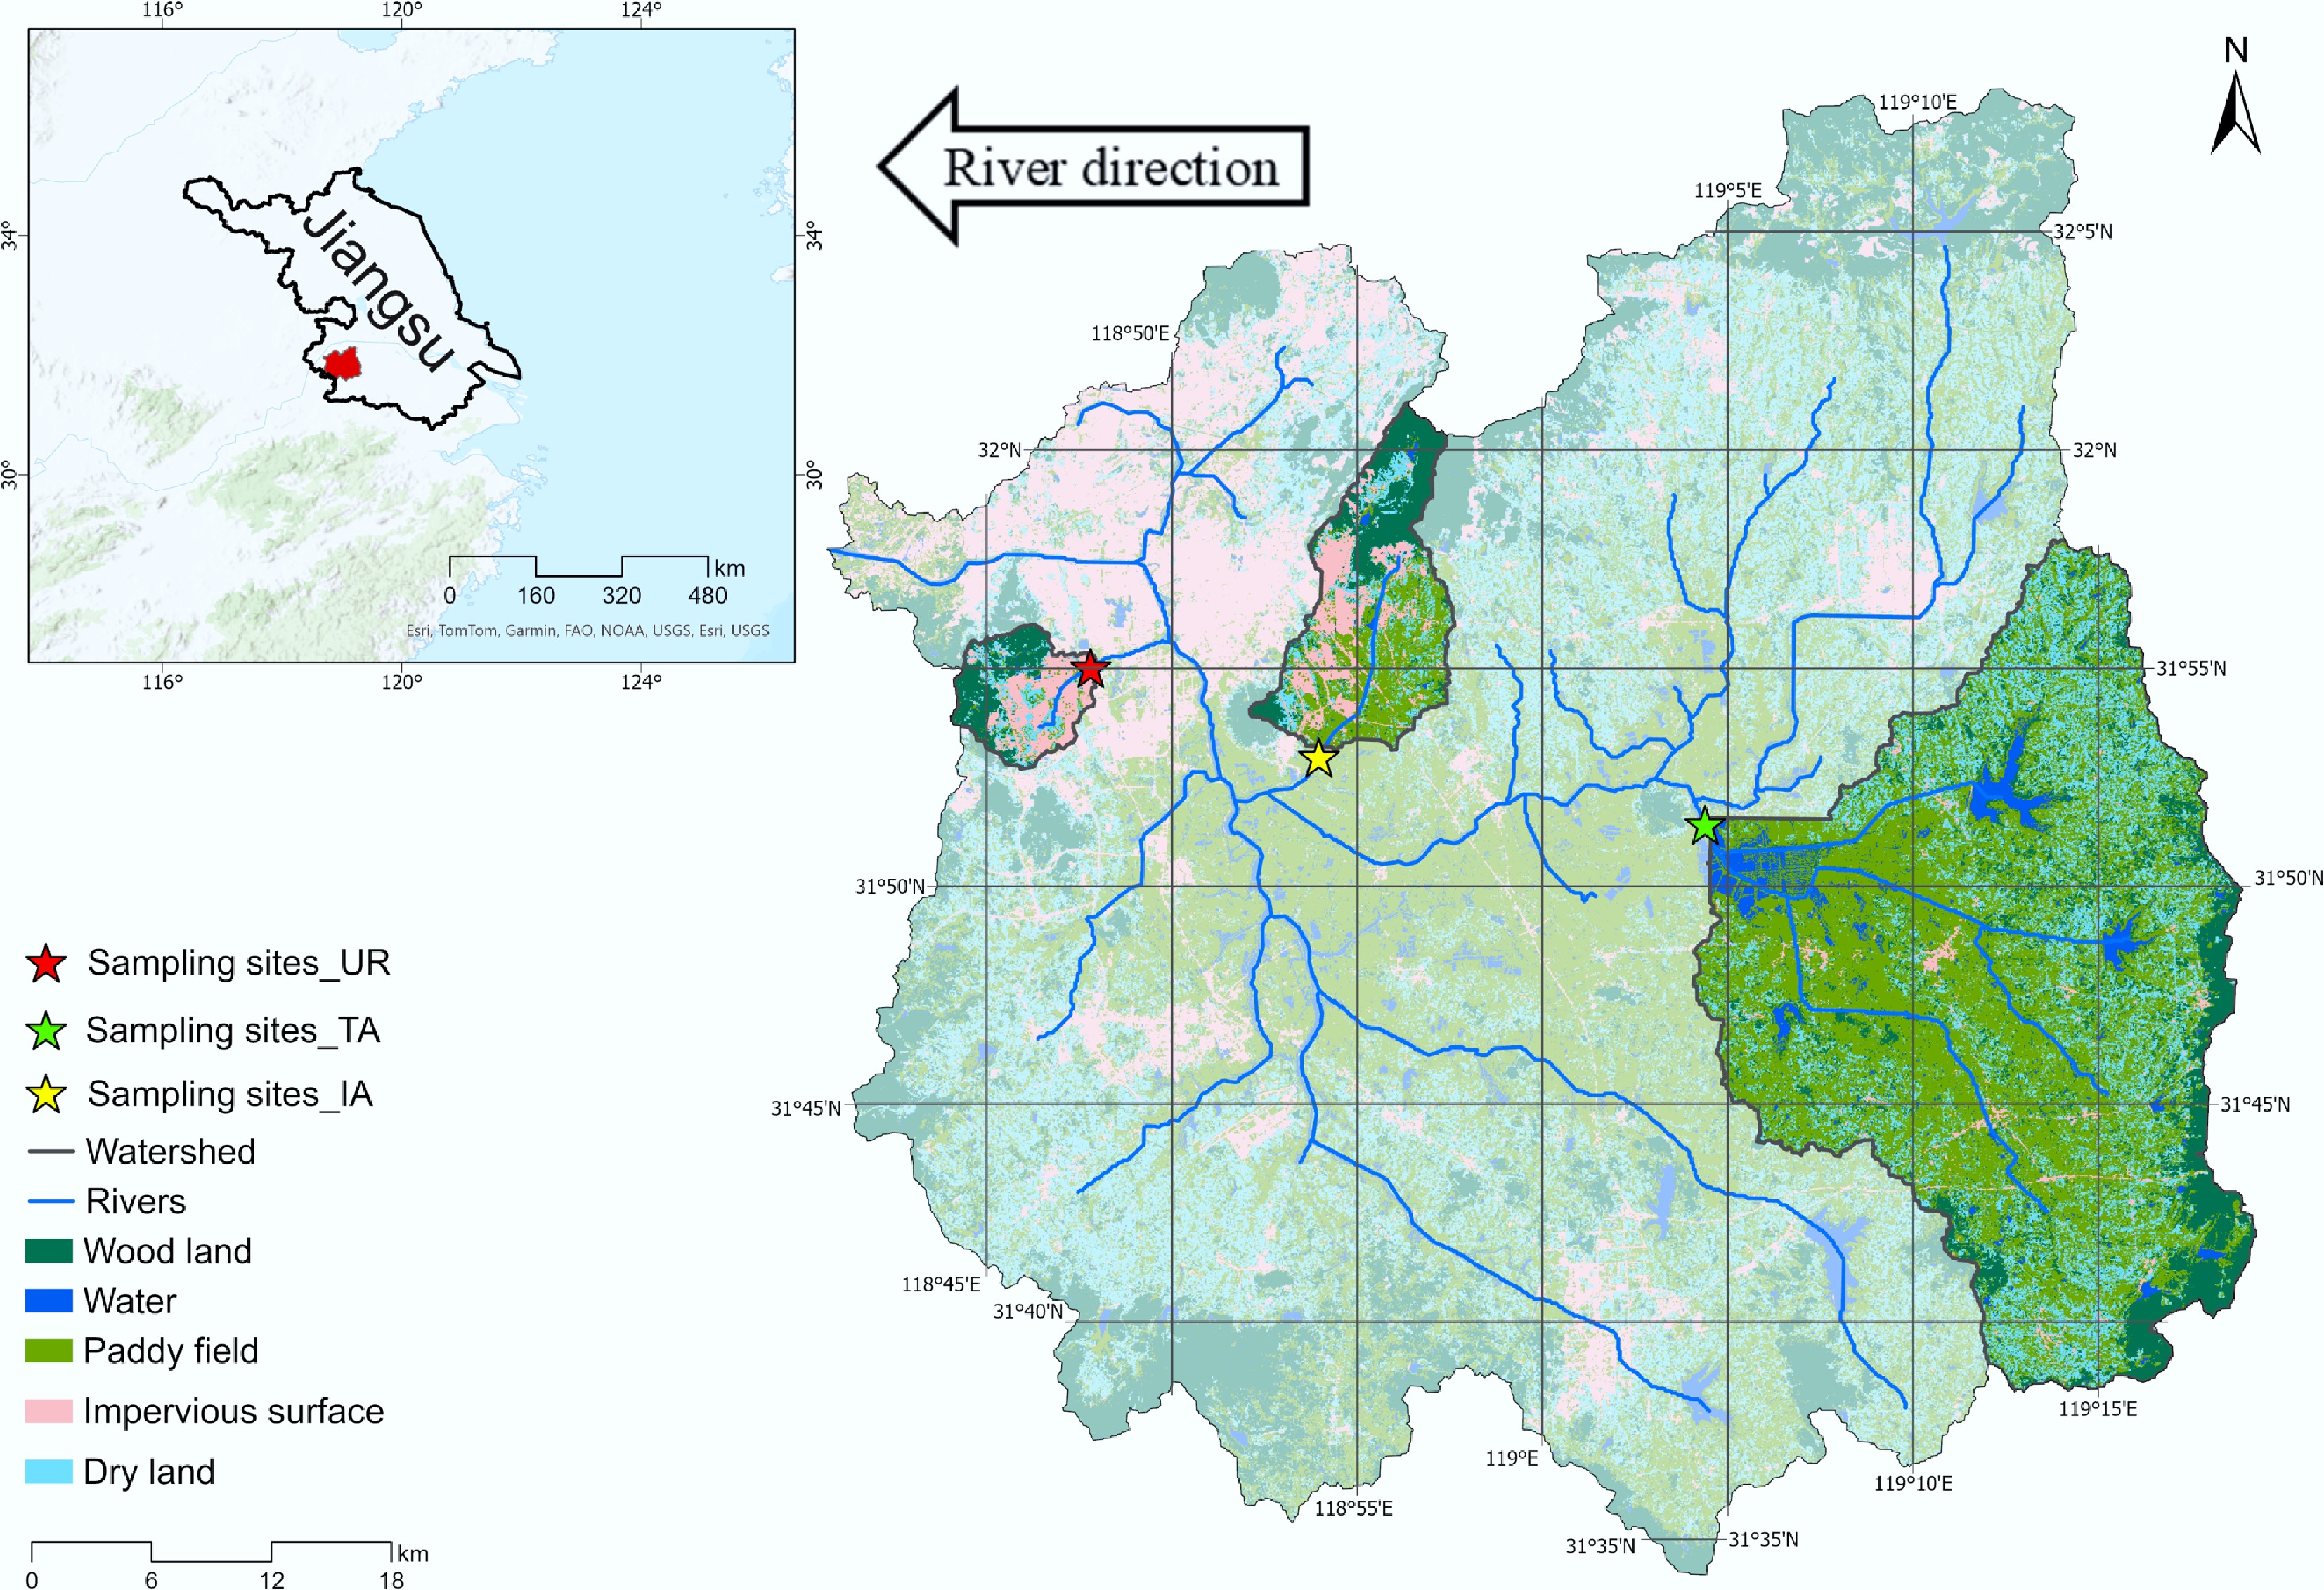
Figure 1.
Map of the study area and the distribution of monitoring stations.
-
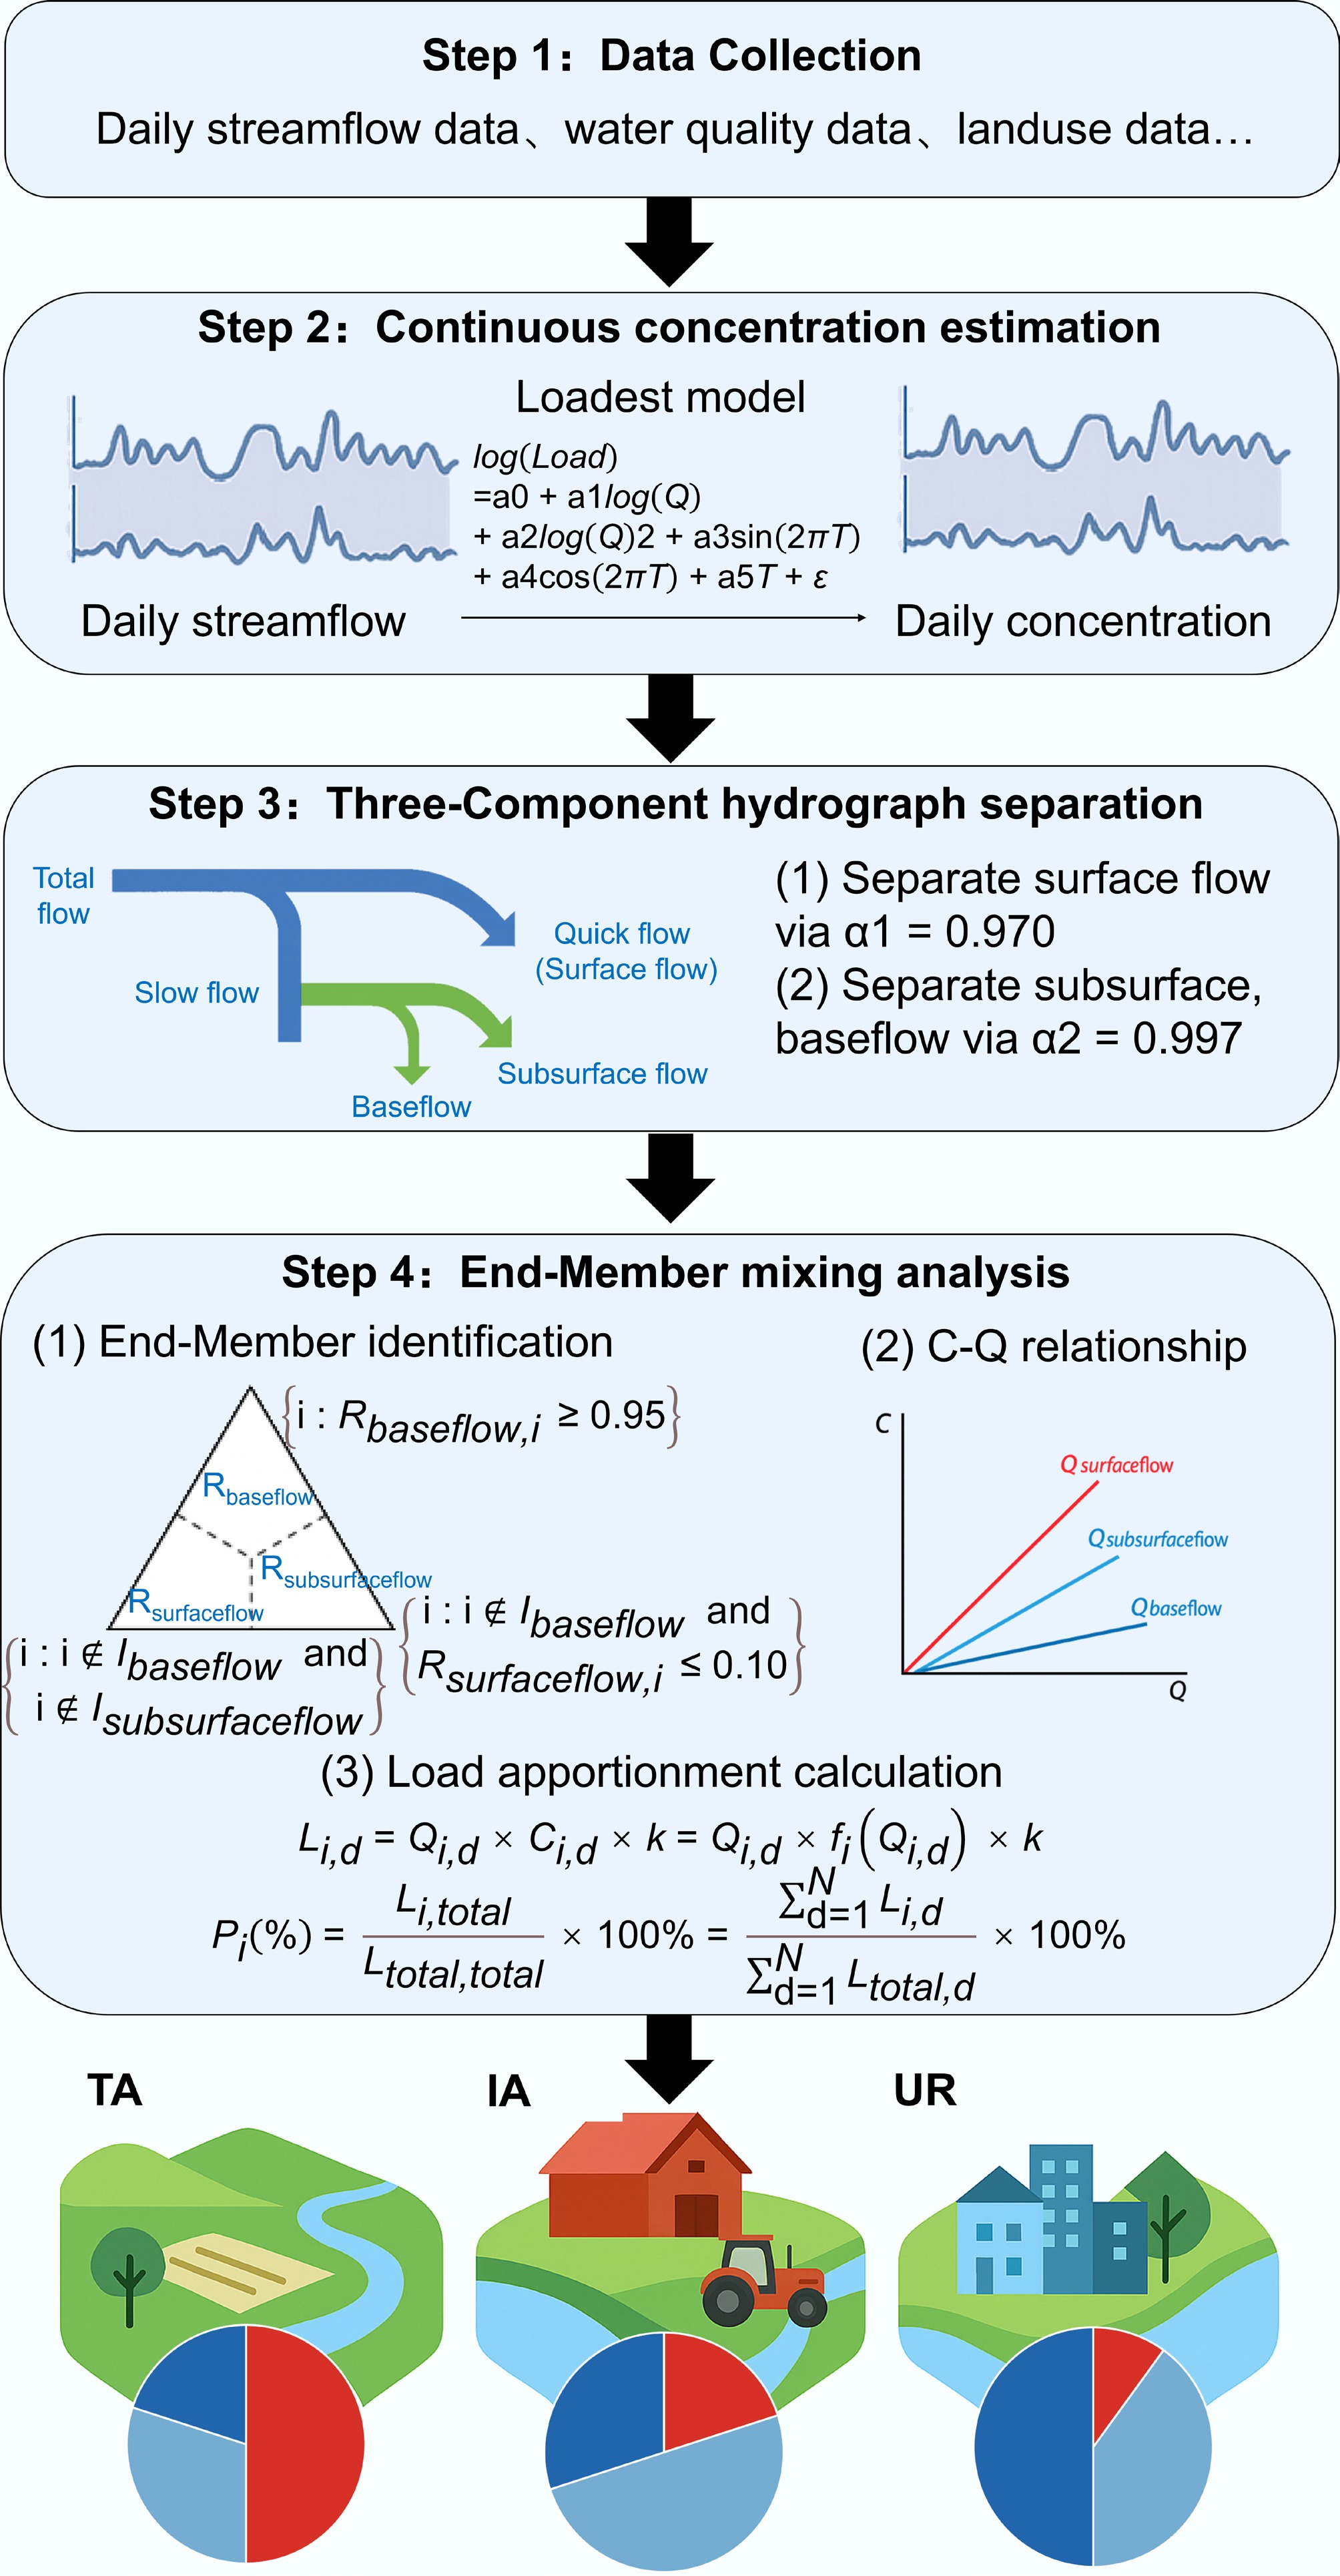
Figure 2.
Integrated analytical framework.
-
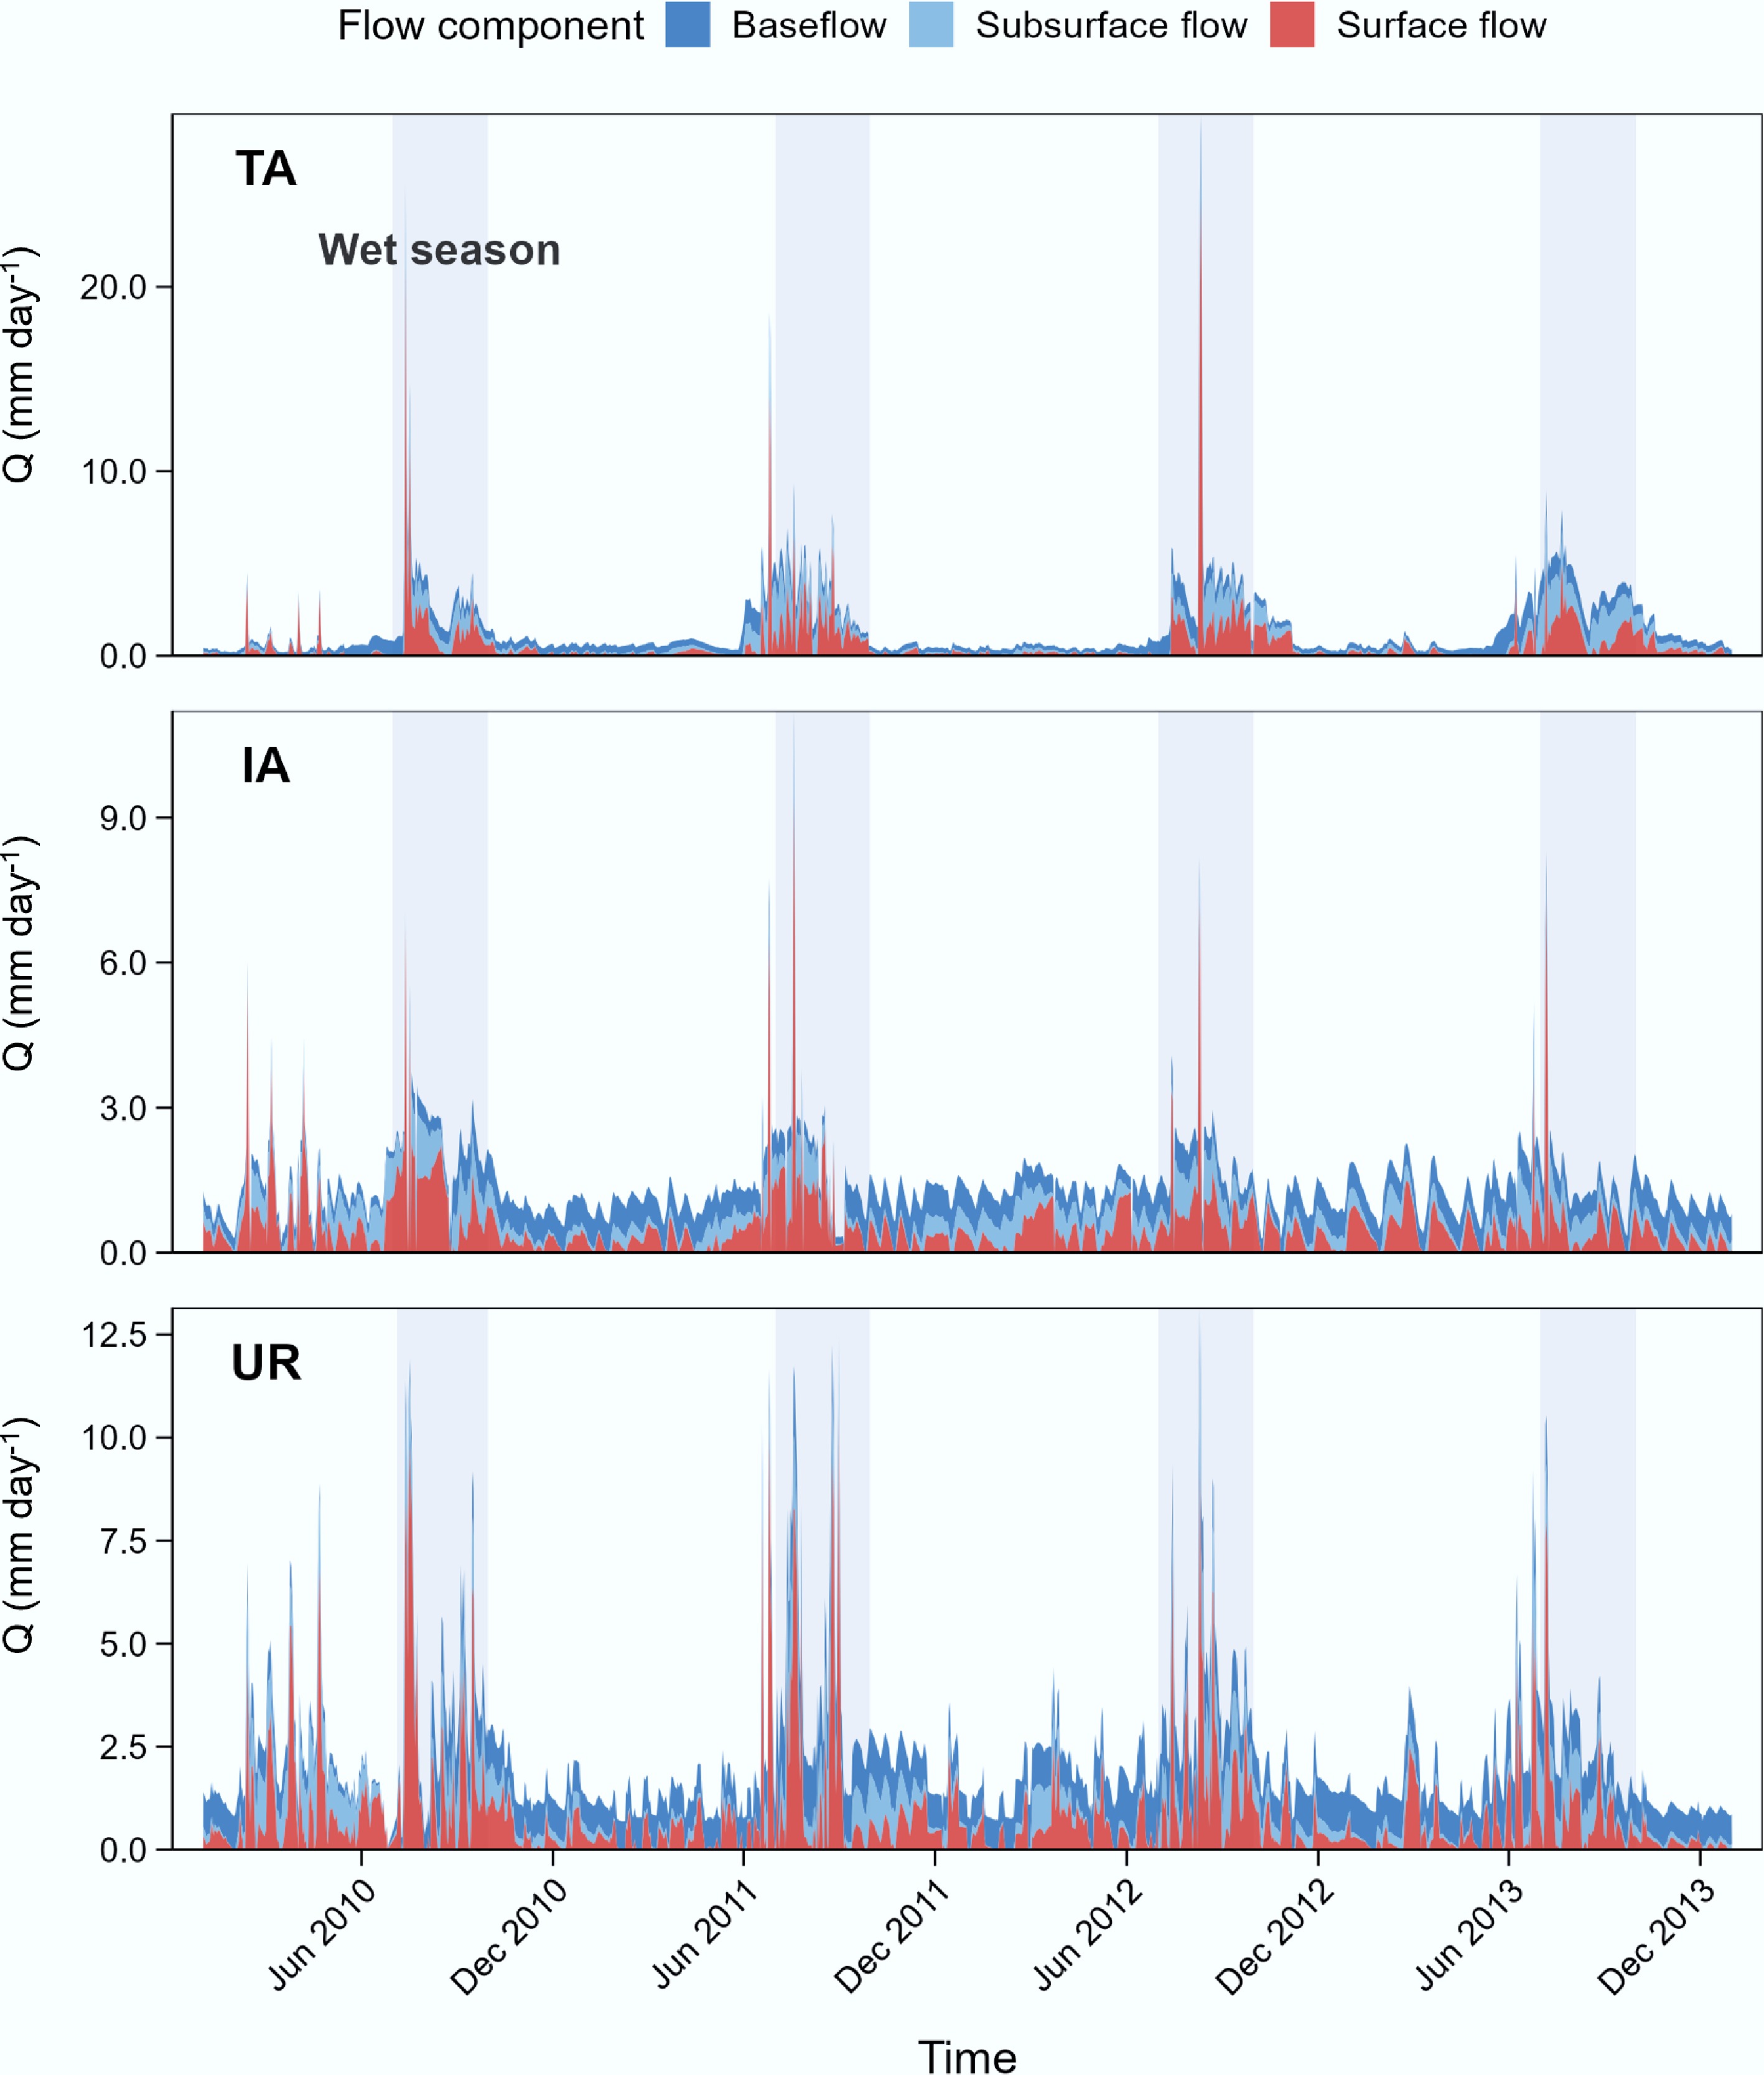
Figure 3.
Hydrological pathway separation showing flow components (baseflow, subsurface flow, and surface flow) across the three study watersheds. TA represents traditional agricultural area, IA represents intensive agricultural area, and UR represents urban area. Gray shaded areas indicate wet seasons.
-
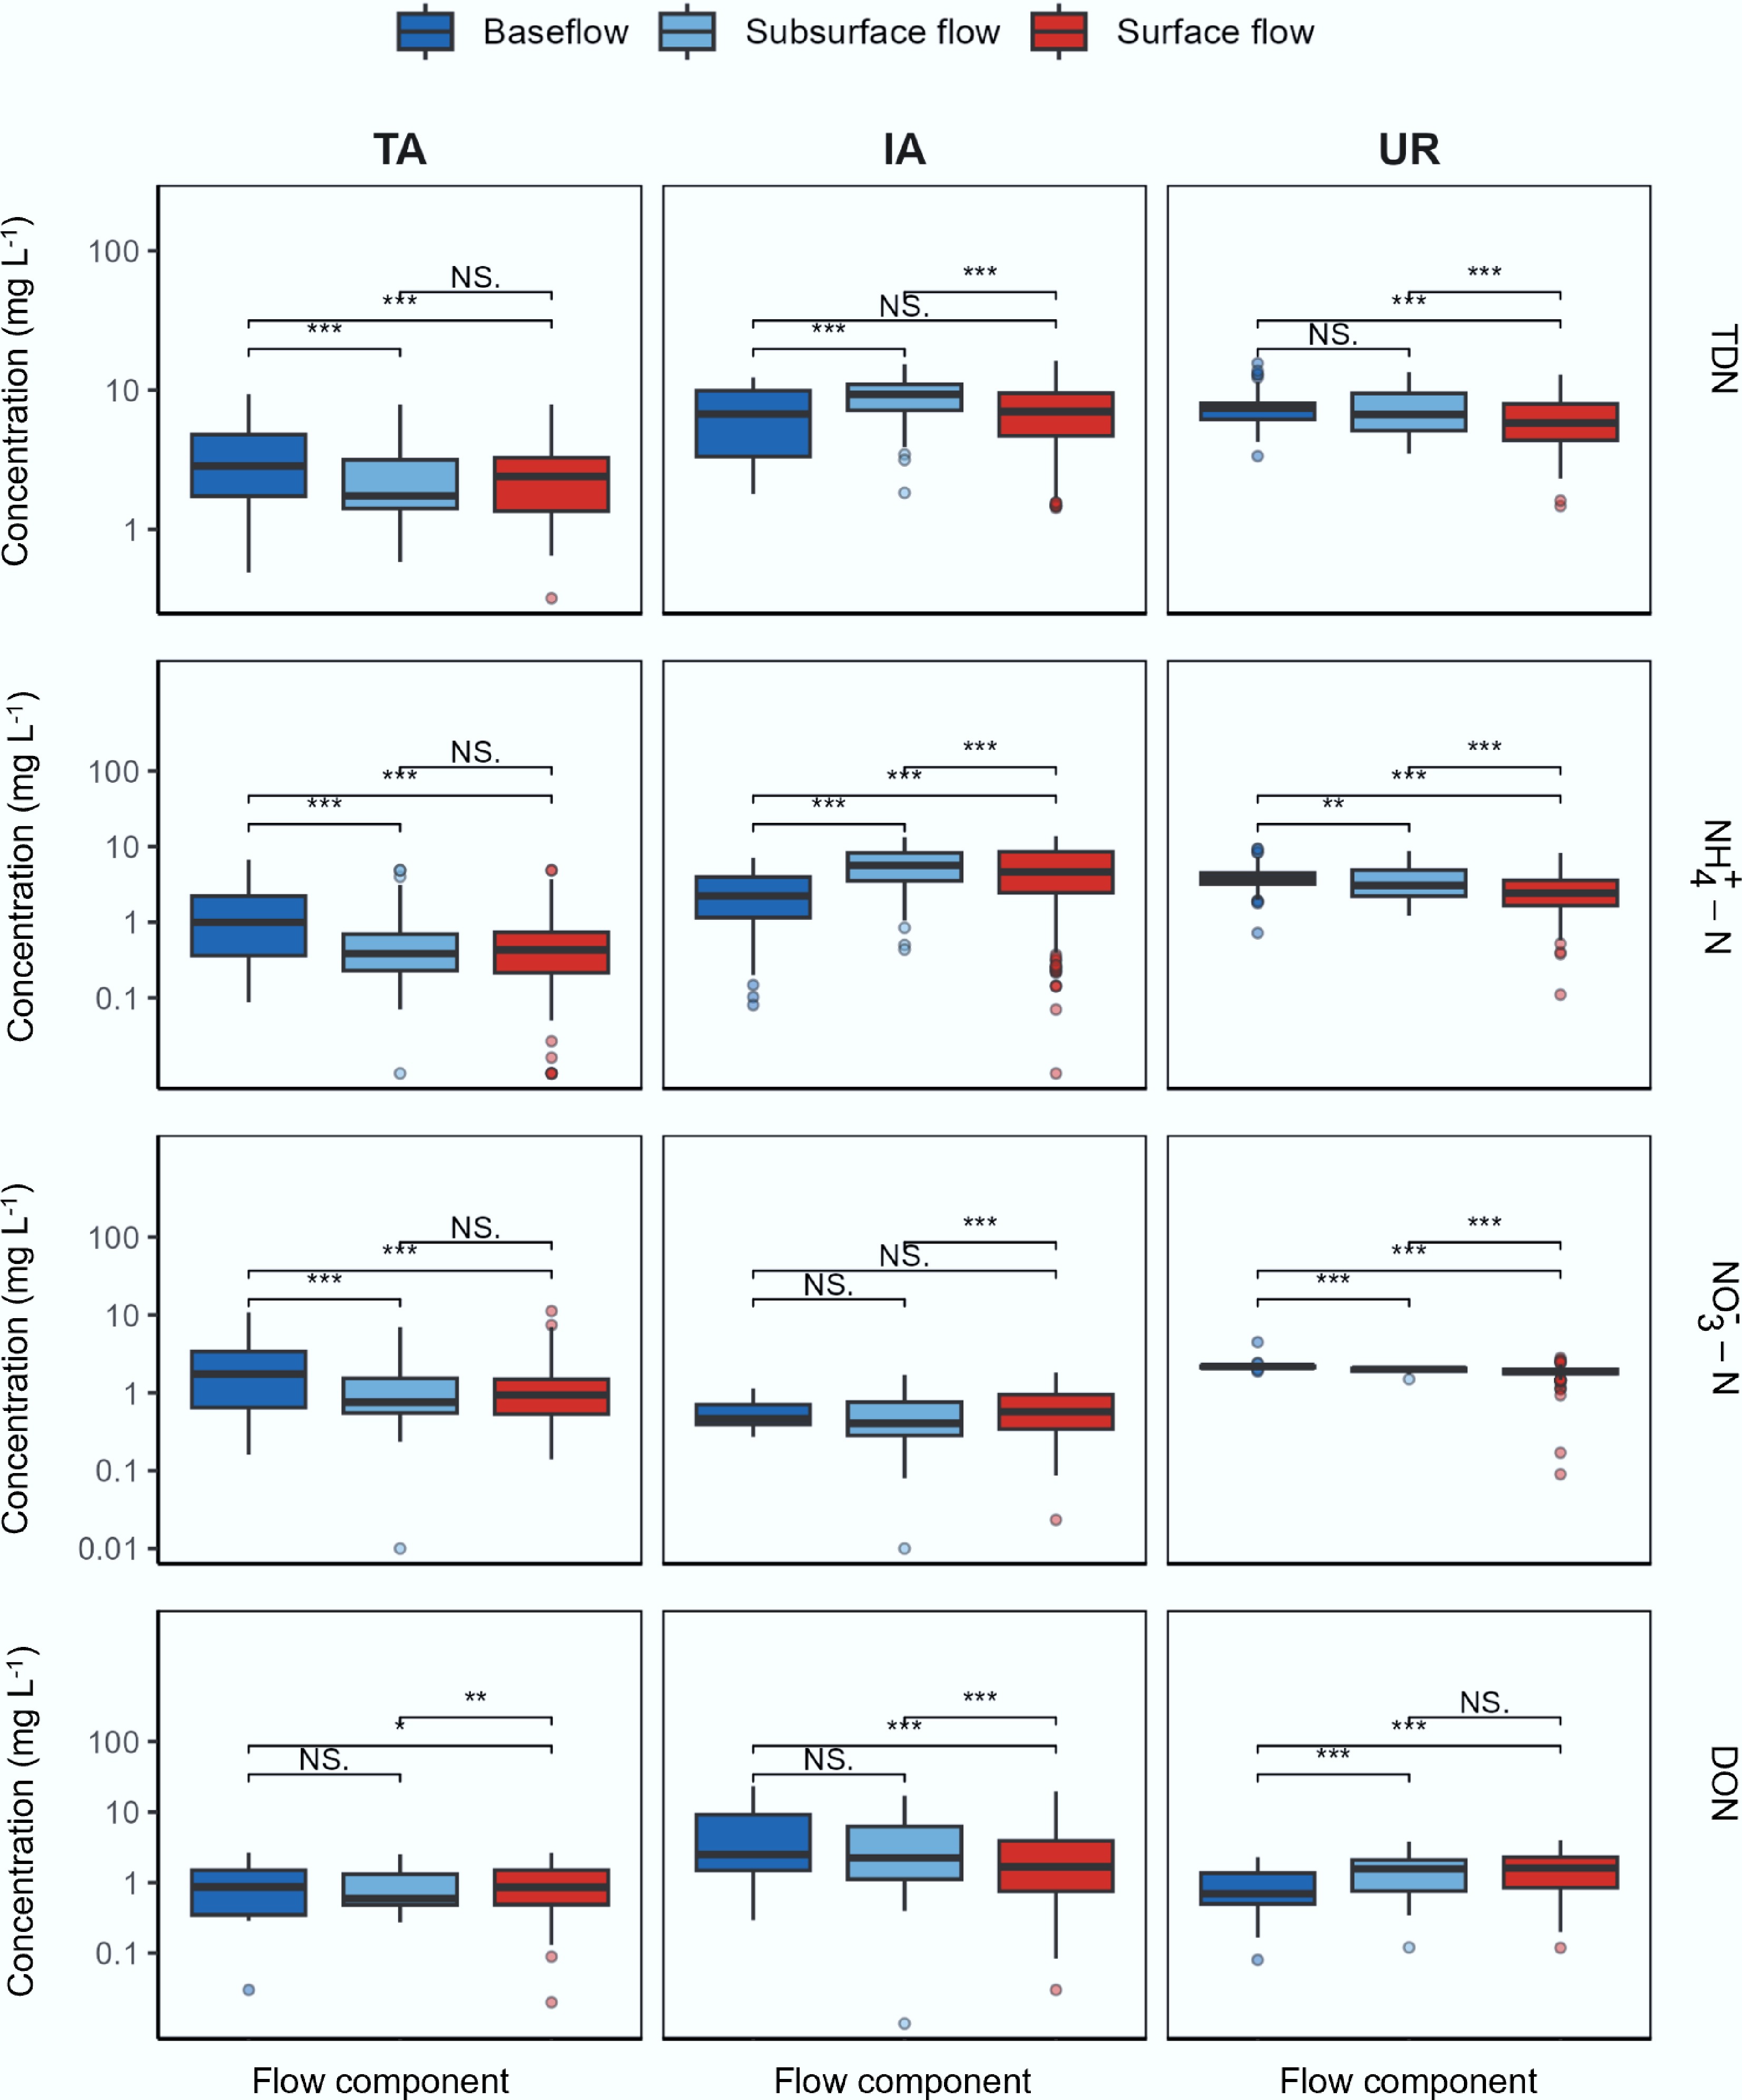
Figure 4.
Concentration distributions of N species (TDN, NH4+−N, NO3−−N, and DON) across flow components in the three study watersheds. ( NS. : p > 0.05; * p < 0.05; ** p < 0.01; *** p < 0.001).
-
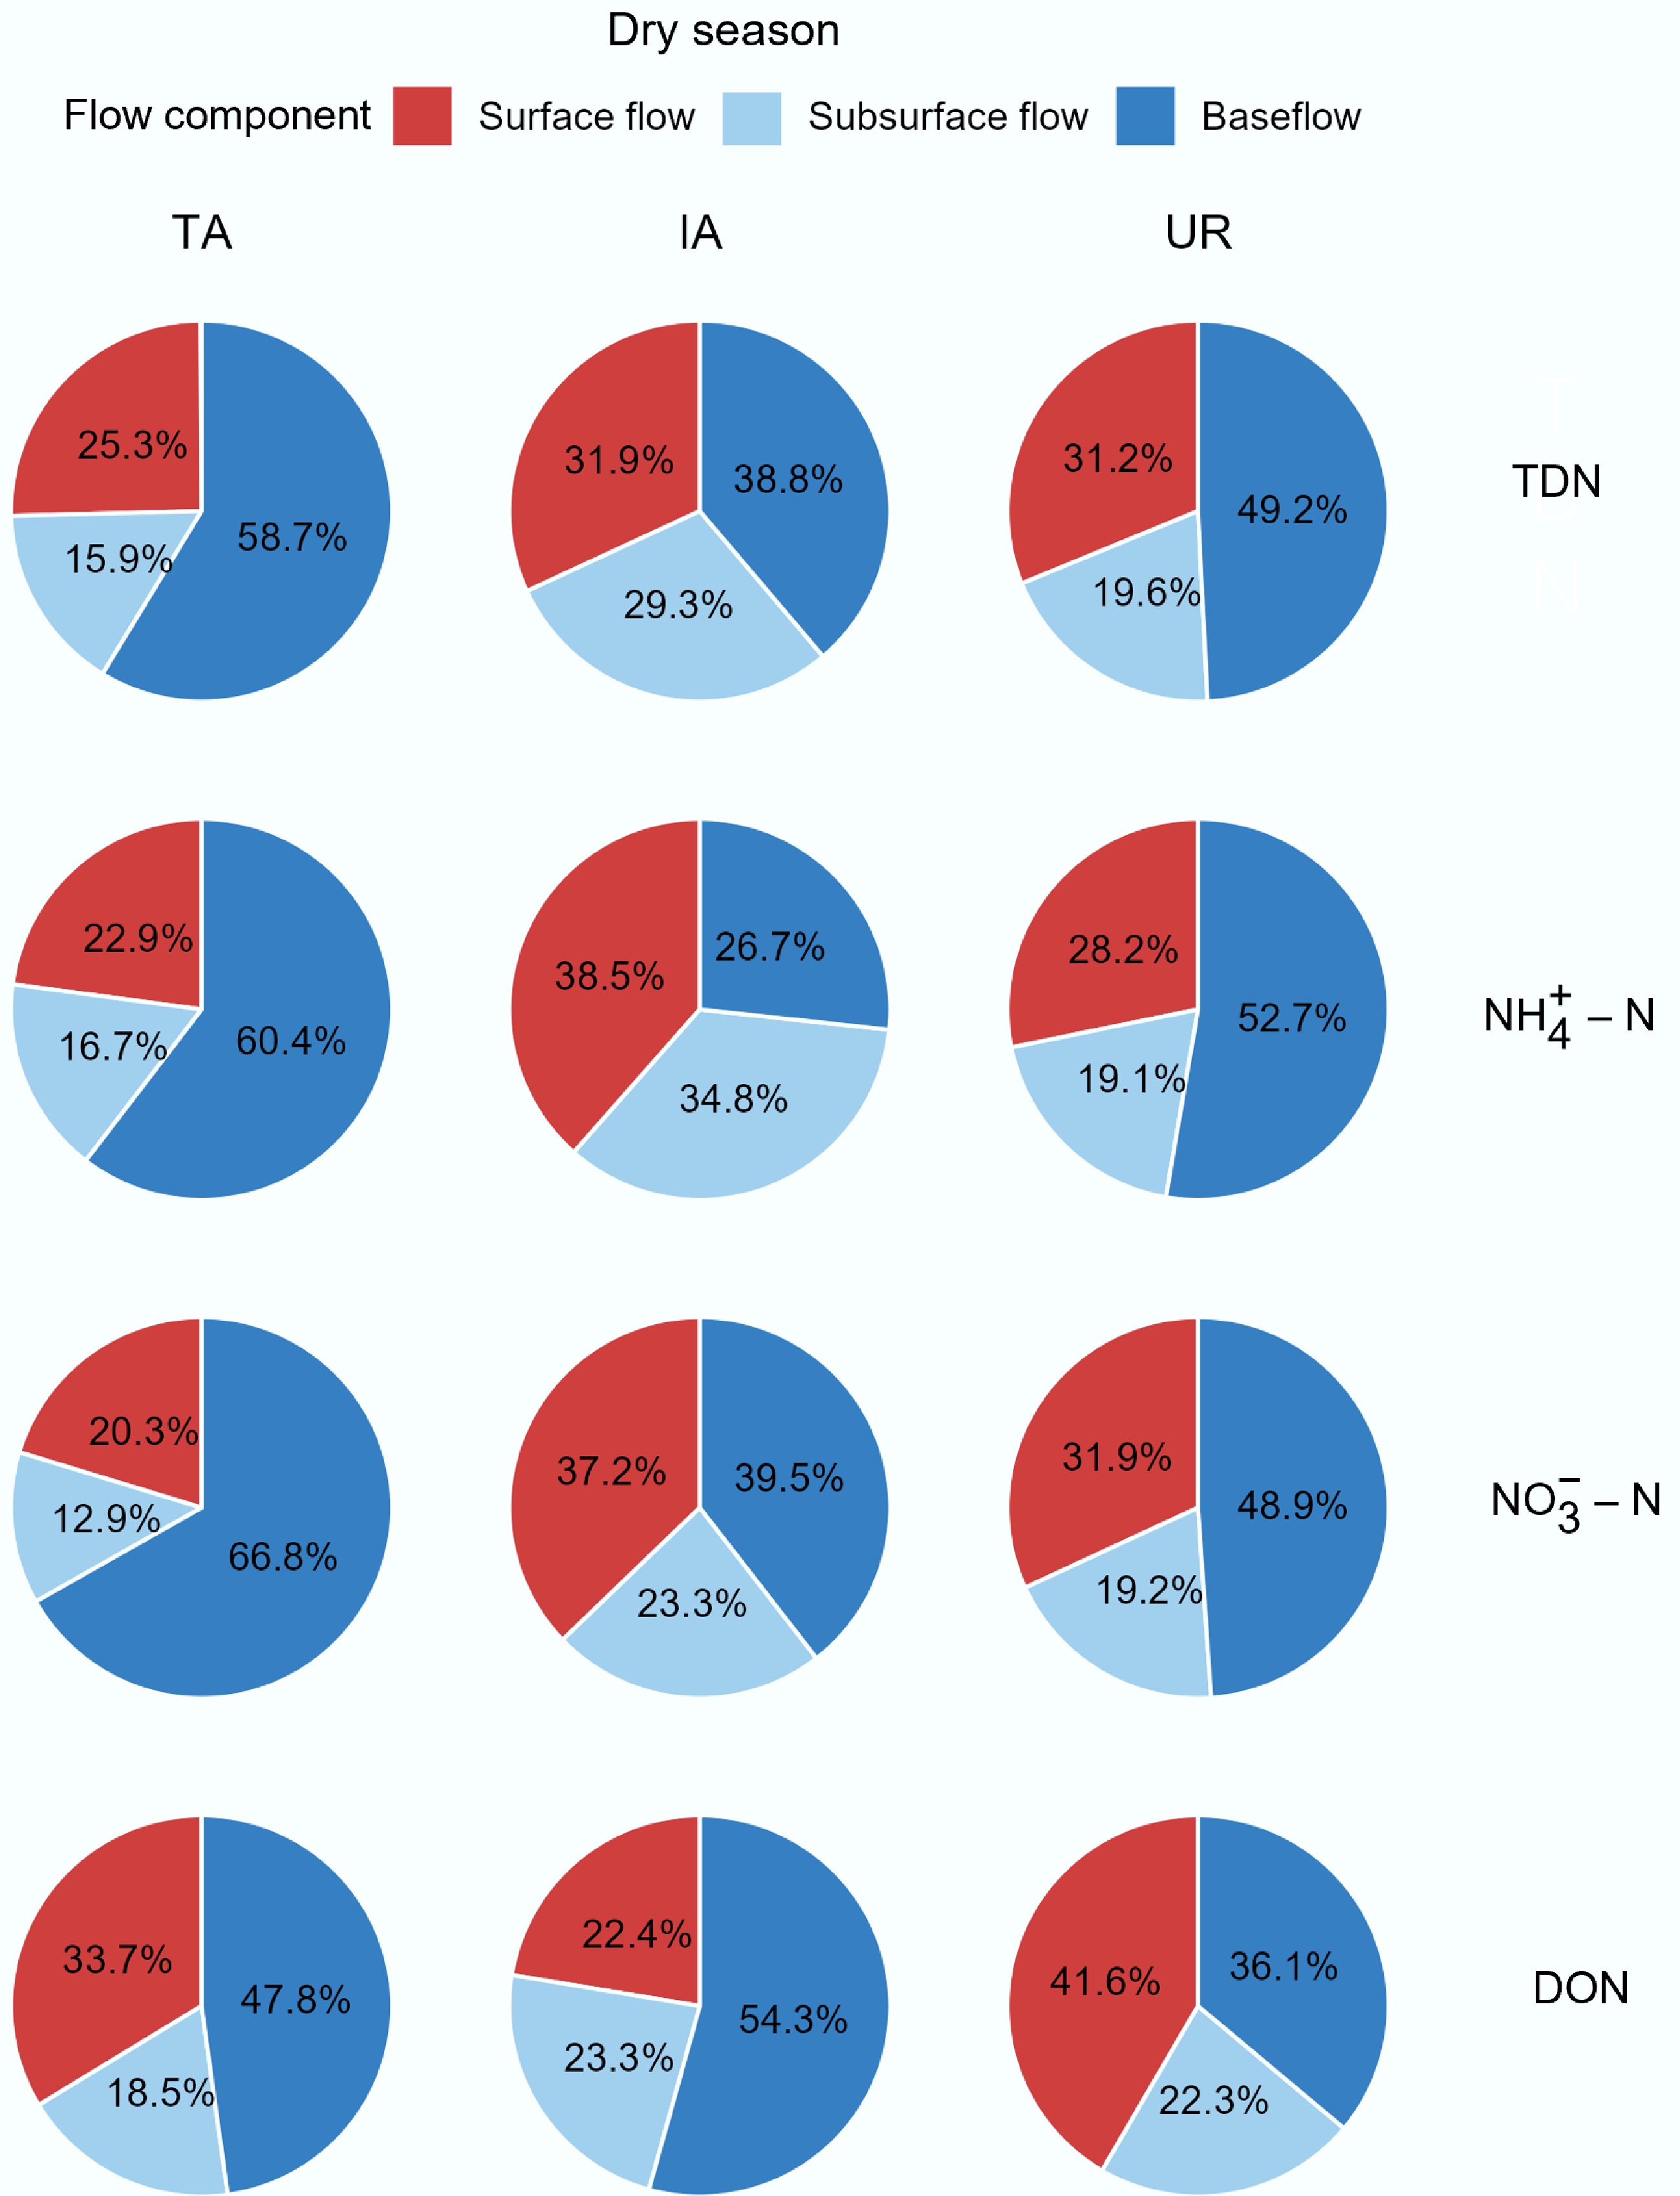
Figure 5.
Seasonal pathway contributions to N loads during dry season across the three study watersheds.
-
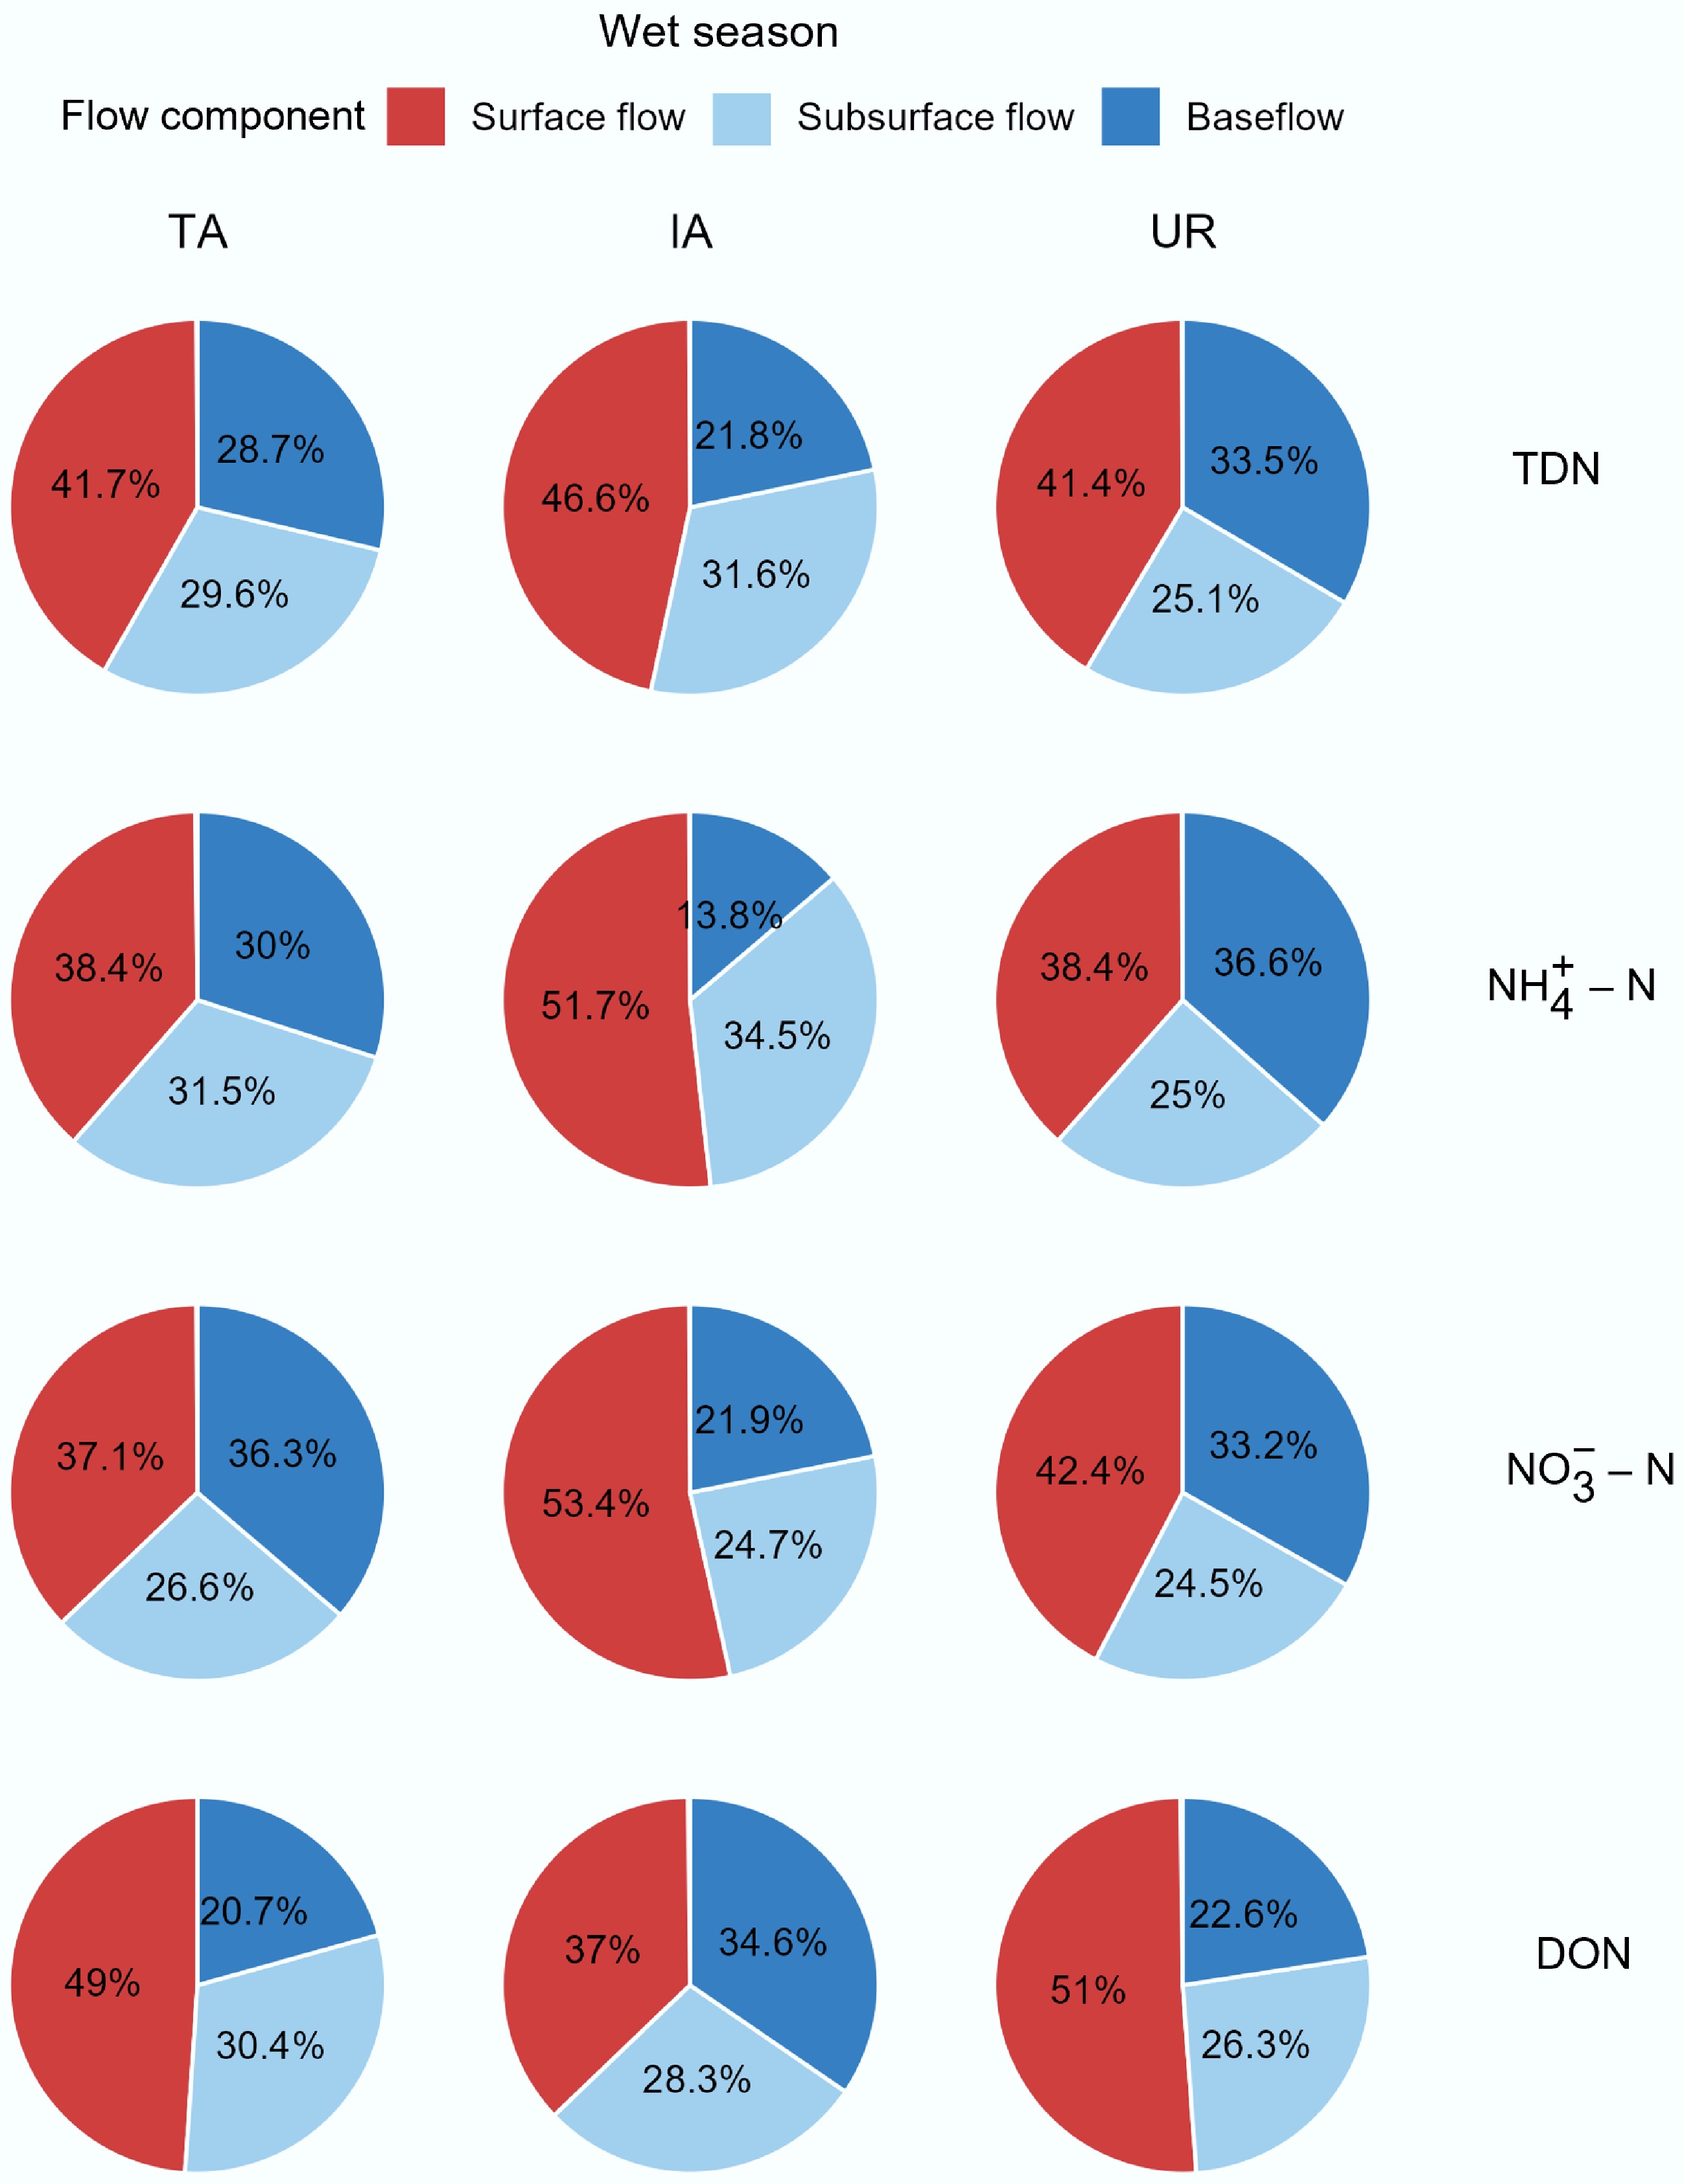
Figure 6.
Seasonal pathway contributions to N loads during wet season across the three study watersheds.
-
Watershed Flow component TDN load
(t yr−1)TDN contrib.
(%)NH4+−N load
(t yr−1)NH4+−N contrib.
(%)NO3−−N load
(t yr−1)NO3−−N contrib.
(%)DON load
(t yr−1)DON contrib.
(%)TA Baseflow 486.3 41.6 167.1 43.2 289.4 50.2 139.6 31.5 Subsurface flow 277.9 23.8 96.9 25.1 117.2 20.4 113.1 25.6 Surface flow 405.3 34.6 122.5 31.7 169.7 29.4 189.5 42.9 IA Baseflow 214.7 32.9 79.9 22.0 17.0 33.4 109.9 48.1 Subsurface flow 196.3 30.1 126.1 34.7 12.2 23.8 56.9 24.9 Surface flow 241.4 37.0 157.3 43.3 21.9 42.8 62.0 27.1 UR Baseflow 14,294.6 42.9 7,505.4 46.4 4,230.1 42.6 1,787.0 30.5 Subsurface flow 7256.3 21.8 3,458.7 21.4 2,112.5 21.3 1,405.9 24.0 Surface flow 11,736.2 35.3 5,202.4 32.2 3,582.4 36.1 2,668.6 45.5 Table 1.
Annual nutrient loads and pathway contributions for the three study watersheds
Figures
(6)
Tables
(1)