


-
Anthropogenic nitrogen (N) enrichment has, since the mid-20th century, profoundly altered global biogeochemical cycles, driving widespread eutrophication of aquatic systems[1,2]. Effective management of this issue requires a precise understanding of the hydrological pathways through which N is transported from terrestrial landscapes to receiving streams[3,4]. Traditionally, research and management have focused primarily on surface runoff associated with storm-driven events[5−7]. However, a growing body of evidence confirms that subsurface flow and baseflow represent critical, and in some cases dominant, conduits for N transport, with studies demonstrating that they can account for over 60% of the total annual N load in some watersheds[8].
The contribution of these pathways varies substantially with land use, development intensity, and hydrological regimes[5,9]. In traditional agricultural watersheds, non-point source pollution dominates, primarily driven by fertilizer application, N-fixing crops, and atmospheric deposition[10]. Nitrogen is subsequently transported via surface runoff and vertical leaching into surface waters and groundwater aquifers. With the intensification of agricultural practices, including increased fertilizer use, pesticide application, and large-scale livestock operations, so-called intensive agricultural watersheds exhibit more complex hydrological and biogeochemical behaviors[11]. Artificial drainage systems, hardened soil surfaces, and modified hydrological connectivity in these landscapes enhance both surface and subsurface flow paths, increasing the risk of rapid N export during storm events[12,13]. In urban watersheds, pollution sources and pathways become even more complex, characterized by both point and non-point sources[8]. Leaking sewer systems and aging septic infrastructure continuously release high N concentrations into subsurface environments, contributing substantially to baseflow N loads[14], while non-point inputs from urban green space fertilization and atmospheric deposition persist[15]. This gradient in source complexity, spanning traditional agriculture, intensive agriculture, and urbanized watersheds, fundamentally decouples water fluxes from pollutant loads at watershed outlets, complicating efforts to accurately quantify N export.
To resolve these complexities, hydrograph separation and chemical tracer approaches have been widely applied to partition hydrological flow paths[16,17], while End-Member Mixing Analysis (EMMA) has been used to quantify pollutant contributions from different sources based on their chemical signatures[18]. However, both approaches have critical limitations when applied independently. Hydrograph separation methods assume that hydrological flow partitioning directly reflects pollutant load contributions[19], overlooking the fact that different pathways exhibit distinct pollutant concentrations. For example, slow-moving groundwater typically carries higher nitrate concentrations than rapid surface runoff[20]. Conversely, traditional EMMA applications often lack a robust hydrological foundation for quantifying pathway contributions, relying on subjective end-member identification without explicit consideration of flow dynamics. The integration of these two approaches is therefore essential: hydrograph separation provides the quantitative hydrological framework for pathway partitioning, while EMMA enables explicit accounting for concentration differences among pathways. This combination allows for the separation of water fluxes from pollutant loads by quantifying differences in solute mobilization, transport, and transformation across pathways through pathway-specific concentration-discharge relationships.
In this study, this integrated framework was applied to three representative watersheds along a rural-urban gradient in the Qinhuai River Basin, China. A novel analytical approach was developed that combines three-component hydrograph separation with pathway-specific End-Member Mixing Analysis (EMMA), explicitly treating surface flow, subsurface flow, and baseflow as distinct transport mechanisms characterized by unique concentration-discharge relationships, and biogeochemical environments. The selected sites represent a clear gradient from traditional agricultural, through intensive agricultural, to urbanized landscapes. The specific objectives were to: (1) establish a hydrograph separation method to quantitatively partition the contributions of surface flow, subsurface flow, and baseflow to total streamflow; (2) develop pathway-specific end-member characterization techniques to identify the N concentration signatures of each hydrological pathway; and (3) quantify the relative contributions of each pathway to the total N load across the rural-urban gradient and compare the contribution patterns between dry and wet seasons. The findings provide new insights into how hydrological pathways control N export across contrasting land uses and hydrological conditions, highlighting the need for targeted, pathway-specific management strategies to reduce N pollution.
-
This study was conducted in the Qinhuai River Basin (31°35′ N–32°07′ N, 118°43′ E–119°18′ E, located in southeastern China, within the lower Yangtze River region. The region has a subtropical monsoon climate, with an average annual temperature of approximately 15 °C and a mean annual precipitation of 1,050 mm, primarily concentrated between July and September, resulting in distinct wet and dry seasons that strongly influence hydrological processes and nutrient transport dynamics.
The Qinhuai River Basin exhibits a clear rural-urban land use gradient, providing an ideal setting for examining the effects of land use intensification on N export pathways. Three representative watersheds were selected along this gradient to represent distinct land use categories and anthropogenic disturbance levels (Fig. 1). The Traditional Agriculture watershed (TA) is characterized by a rotation of paddy rice and wheat, with agricultural land comprising approximately 75%, and impervious surfaces being minimal at about 5%. The Intensive Agriculture watershed (IA) features aquaculture practices, such as the rearing of hairy crabs and fish, with agricultural surfaces at approximately 55%, and an increased impervious surface of about 20%. Finally, the Urban watershed (UR) represents the urbanized end of the gradient and is characterized by a predominantly impervious surface of approximately 60%. The main soil types are Anthrosols (rice paddy), and Ferric/Haplic Luvisols (upland) (FAO classification), and their spatial distribution across the watershed is shown in Supplementary Fig. S1. The soil texture across the three sub-watersheds is similar, characterized as loam to silty loam. Specifically, the soil in the TA watershed contains 26.5% clay, 41.6% silt, and 31.8% sand, with a soil organic carbon (SOC) content of 1.25%. The IA watershed has a soil composition of 26.3% clay, 41.6% silt, and 32.0% sand, with an SOC of 1.23%. The UR watershed contains 26.2% clay, 43.0% silt, and 30.8% sand, with the highest SOC at 1.29%[5]. These sub-catchments represent contrasting hydrological and anthropogenic disturbance regimes, enabling a systematic comparison of how land use influences hydrological pathways and associated N transport mechanisms. Daily streamflow data (m3 s−1) were continuously monitored at the outlet of each watershed using automated gauging stations equipped with pressure transducers and data loggers.
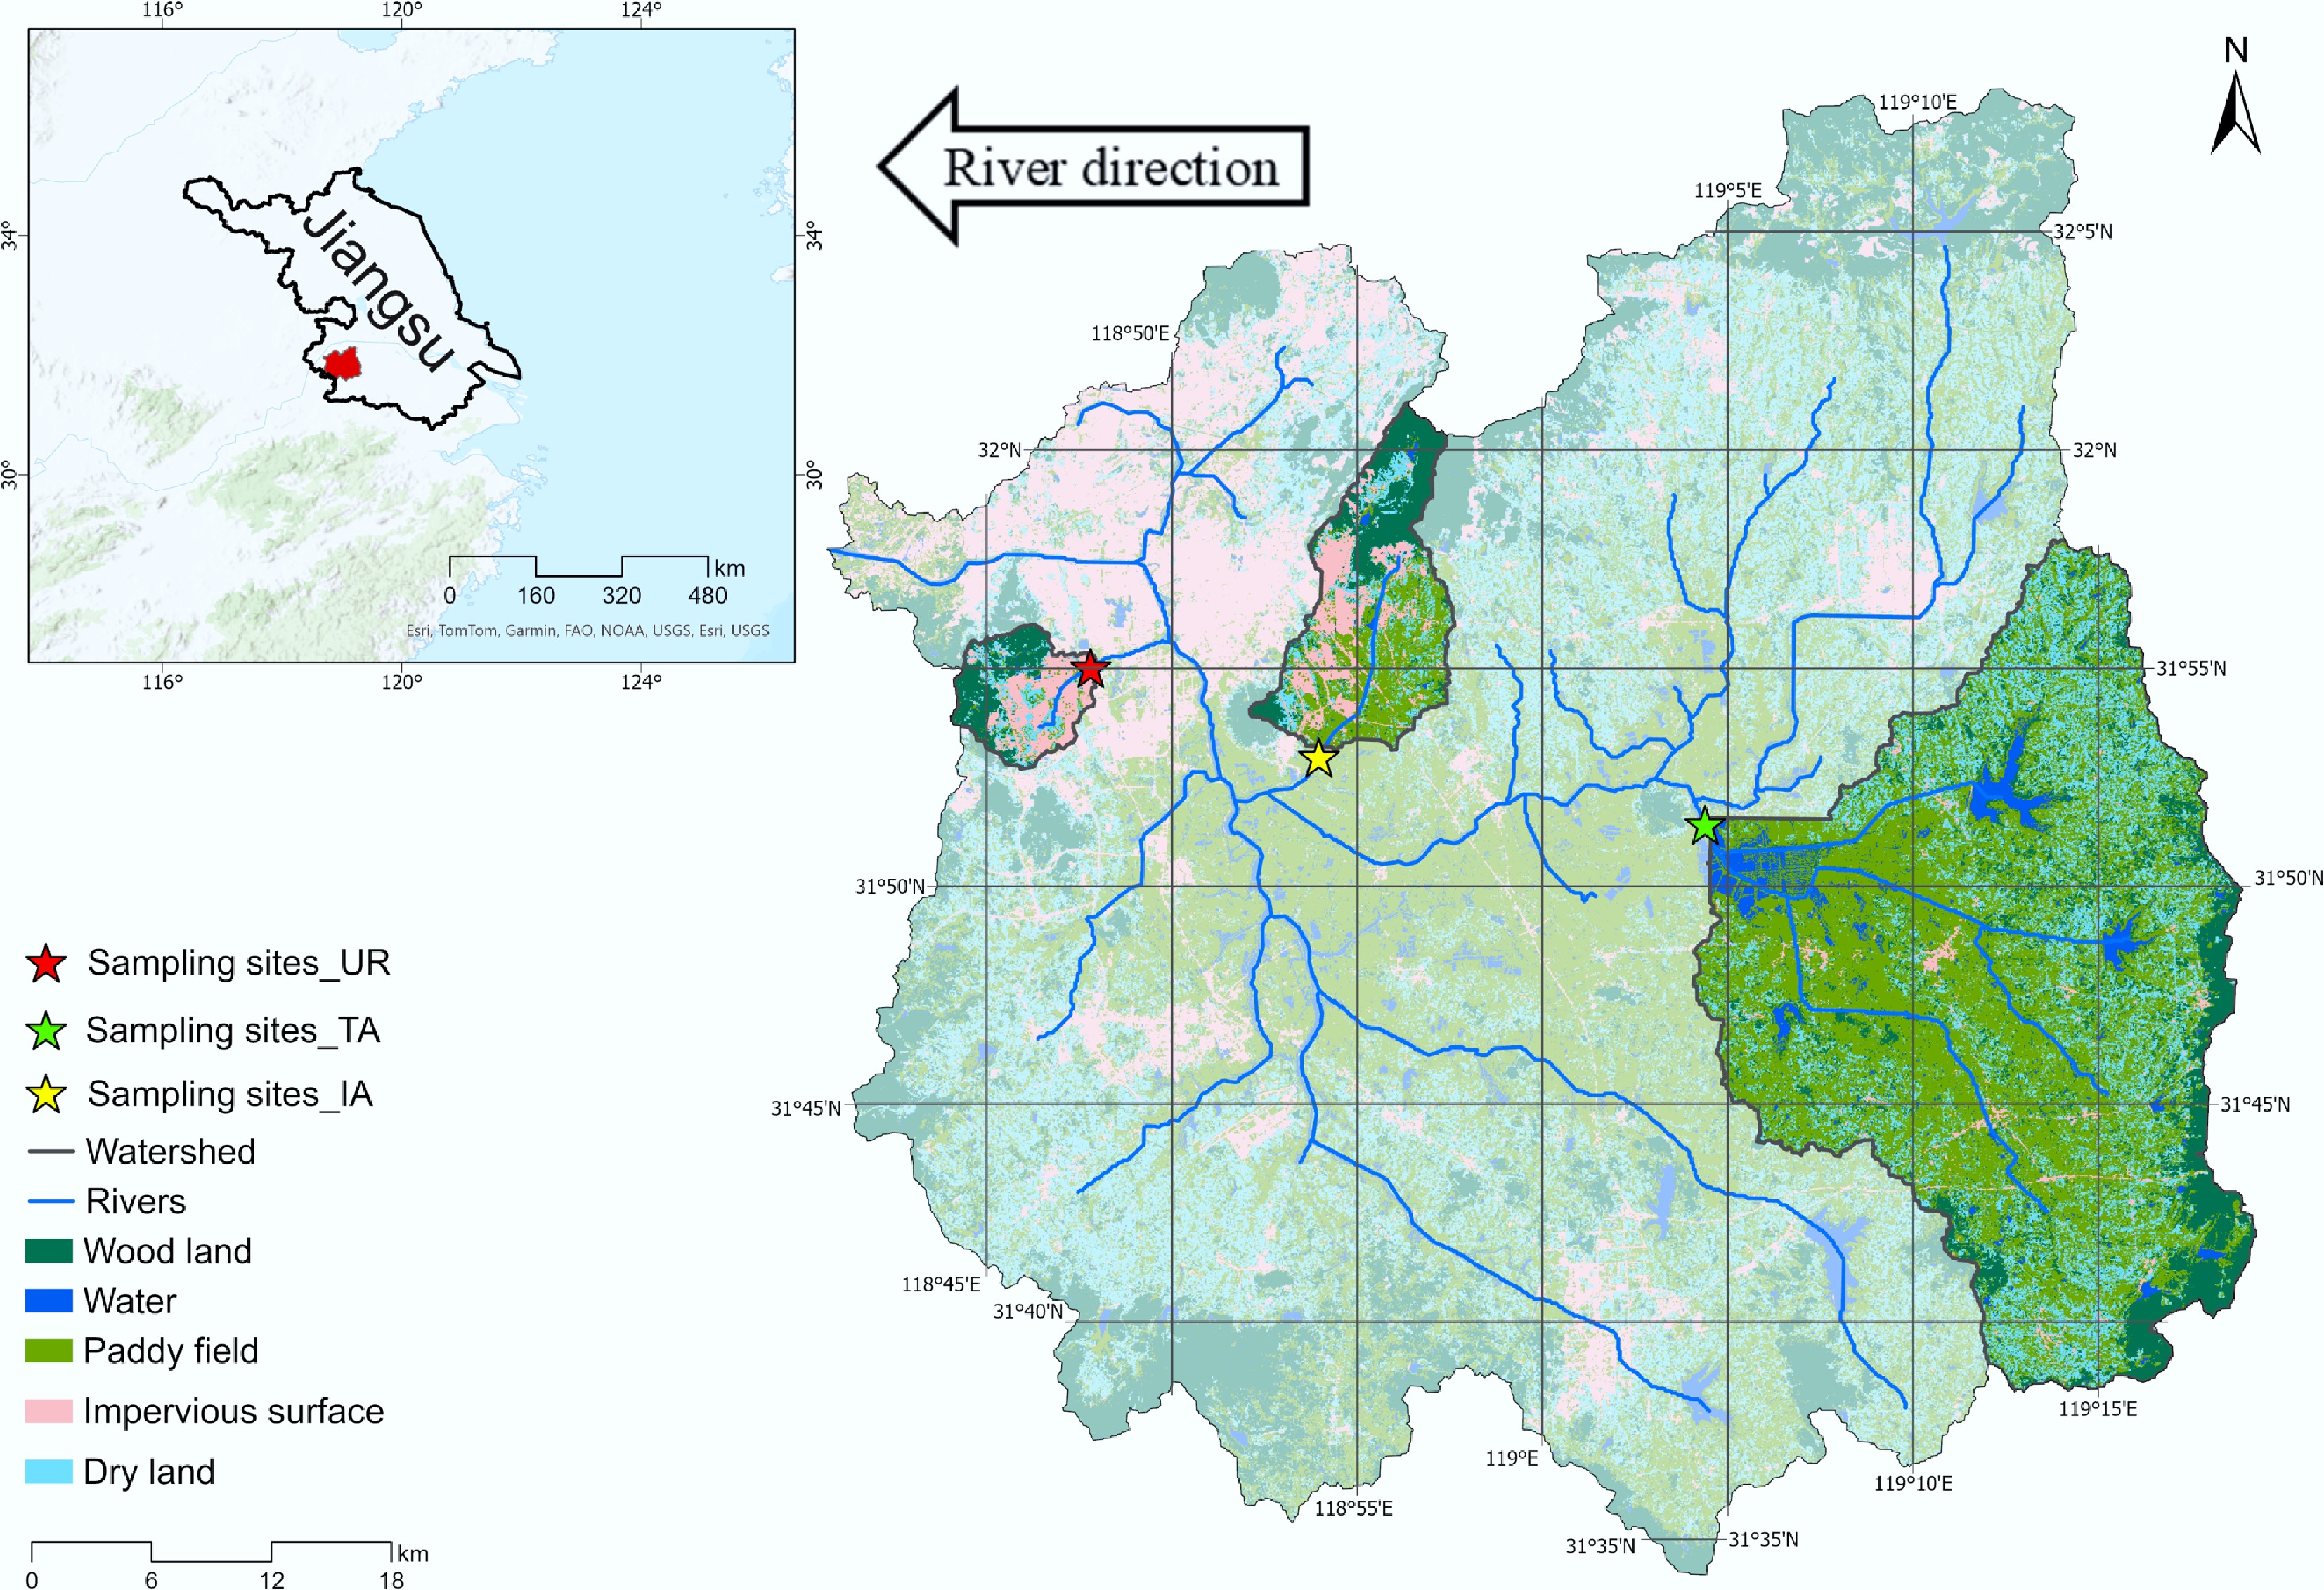
Figure 1.
Map of the study area and the distribution of monitoring stations.
Water sample collection and laboratory analysis
-
To capture both seasonal and event-driven variability in N concentrations, water sampling was conducted year-round between January 2010 and December 2013. The sampling strategy was adapted to the distinct seasonal characteristics of the subtropical monsoon climate, with monthly collection during the dry season (October–June) and biweekly collection during the wet season (July–September). This approach ensured comprehensive coverage of diverse hydrological conditions while maintaining sufficient temporal resolution for robust load estimation and pathway analysis. Grab samples were obtained at a depth of approximately 0.3 m from the thalweg of each stream using pre-cleaned high-density polyethylene bottles, following standardized protocols for nutrient sampling. Samples were immediately placed on ice and transported to the laboratory within 6 h of collection to minimize bacterial activity and maintain sample integrity. Upon arrival at the laboratory, samples were refrigerated at 4 °C and processed within 24 h.
Total dissolved N (TDN) concentrations were determined using the alkaline persulfate digestion method. Ammonia N (NH3+–N) was analyzed using the indophenol blue method, while nitrate N (NO3−–N) was measured using the cadmium reduction method. Dissolved organic N (DON) was calculated as the difference between TDN, and the sum of inorganic N.
Continuous concentration and load estimation
-
The reconstruction of continuous daily nutrient concentrations and loads from intermittent measurements was accomplished using the Load Estimator (LOADEST) model, which has been extensively validated for nutrient flux estimation in diverse aquatic systems[21]. This approach integrates high-frequency streamflow data with sparse concentration measurements to provide robust estimates of nutrient fluxes essential for mass balance calculations and source attribution analyses. Daily nutrient loads were initially calculated for sampling dates using the fundamental relationship:
$ Load=Concentration\,\times\, Flow\,\times\, 86.4 $ (1) where, the conversion factor accounts for units (kg day−1).
To address the typically nonlinear and heteroscedastic nature of concentration-discharge relationships, both load and flow variables were log-transformed prior to regression analysis. Eleven candidate regression models of varying complexity were systematically evaluated, incorporating different combinations of streamflow (log Q), its quadratic term (log Q)2, seasonal components (sine and cosine of Julian day), and long-term temporal trends (decimal time). The general model structure followed established protocols:
$ \begin{split} log\, \left(Load\right)=\; & a0+a1\, log\left(Q\right)+a2\, log\left(Q\right)^2+a3\, sin\left(2\pi T\right) \\ &+a4\, cos\left(2\pi T\right)+a5\, T+\varepsilon \end{split} $ (2) where, T represents decimal time, αᵢ are regression coefficients, and ε represents residual error.
Model selection employed a comprehensive approach prioritizing statistical significance, goodness-of-fit, and parsimony. The optimal model for each pollutant-watershed combination was selected based on minimizing Akaike's Information Criterion (AIC), and Bayesian Information Criterion (BIC). To address retransformation bias inherent in converting log-transformed predictions back to the arithmetic scale, Duan's smearing estimator was systematically applied to all load predictions. The resulting bias-corrected daily load estimates were then used to derive continuous time series of nutrient concentrations, providing the foundation for subsequent hydrological partitioning, and source apportionment analyses.
Three-component hydrograph separation
-
To provide the hydrological foundation for the load partitioning framework, a three-component hydrograph separation fwas implemented or each watershed using a recursive digital filtering algorithm. Following established protocols[16], a two-stage filtering approach was employed to distinguish surface flow, subsurface flow, and baseflow components. The first separation distinguished rapid surface flow (Qsurfaceflow) from the combined slow flow component (Qslowflow) using a filter parameter of α1 = 0.970 for all watersheds. This parameter was selected based on previous studies in mixed agricultural-urban watersheds with similar climatic conditions[8], and represents a reasonable separation between quick-moving surface flow and slower-moving subsurface flow. The second stage separated the slow flow component into subsurface flow (Qsubsurfaceflow) and baseflow (Qbaseflow) using α2 = 0.997, designed to capture only the most stable, seasonally-driven groundwater discharge. The intermediate subsurface flow (Qsubsurfaceflow = Qslowflow − Qbaseflow) represents shallow interflow, and delayed storm response.
The selection of these filter parameters was based on several considerations specific to the hydrogeological characteristics of the Qinhuai River Basin. The α1 = 0.970 parameter for surface flow separation reflects the rapid response typical of mixed agricultural-urban watersheds with moderate slope gradients, and the presence of both natural channels and artificial drainage systems. The α2 = 0.997 parameter for baseflow separation was chosen to capture the sustained groundwater discharge characteristics of the regional aquifer system, which consists primarily of shallow alluvial deposits with moderate permeability. These values are consistent with filter parameters used in similar subtropical watersheds reported in the literature[22].
Pathway-based end-member mixing analysis for load apportionment
-
To attribute total nutrient loads to their constituent hydrological pathways, a novel analytical framework was developed and applied: the Pathway-based End-Member Mixing Analysis (EMMA). The integrated structure of this framework is illustrated in Fig. 2, which outlines the sequential steps from the initial hydrograph separation, through the characterization of pathway end-members using concentration-discharge (C-Q) relationships, to the final load apportionment. Conceptually, this framework treats the three distinct flow paths as independent 'end-members' that mix to produce the total load observed at the watershed outlet.
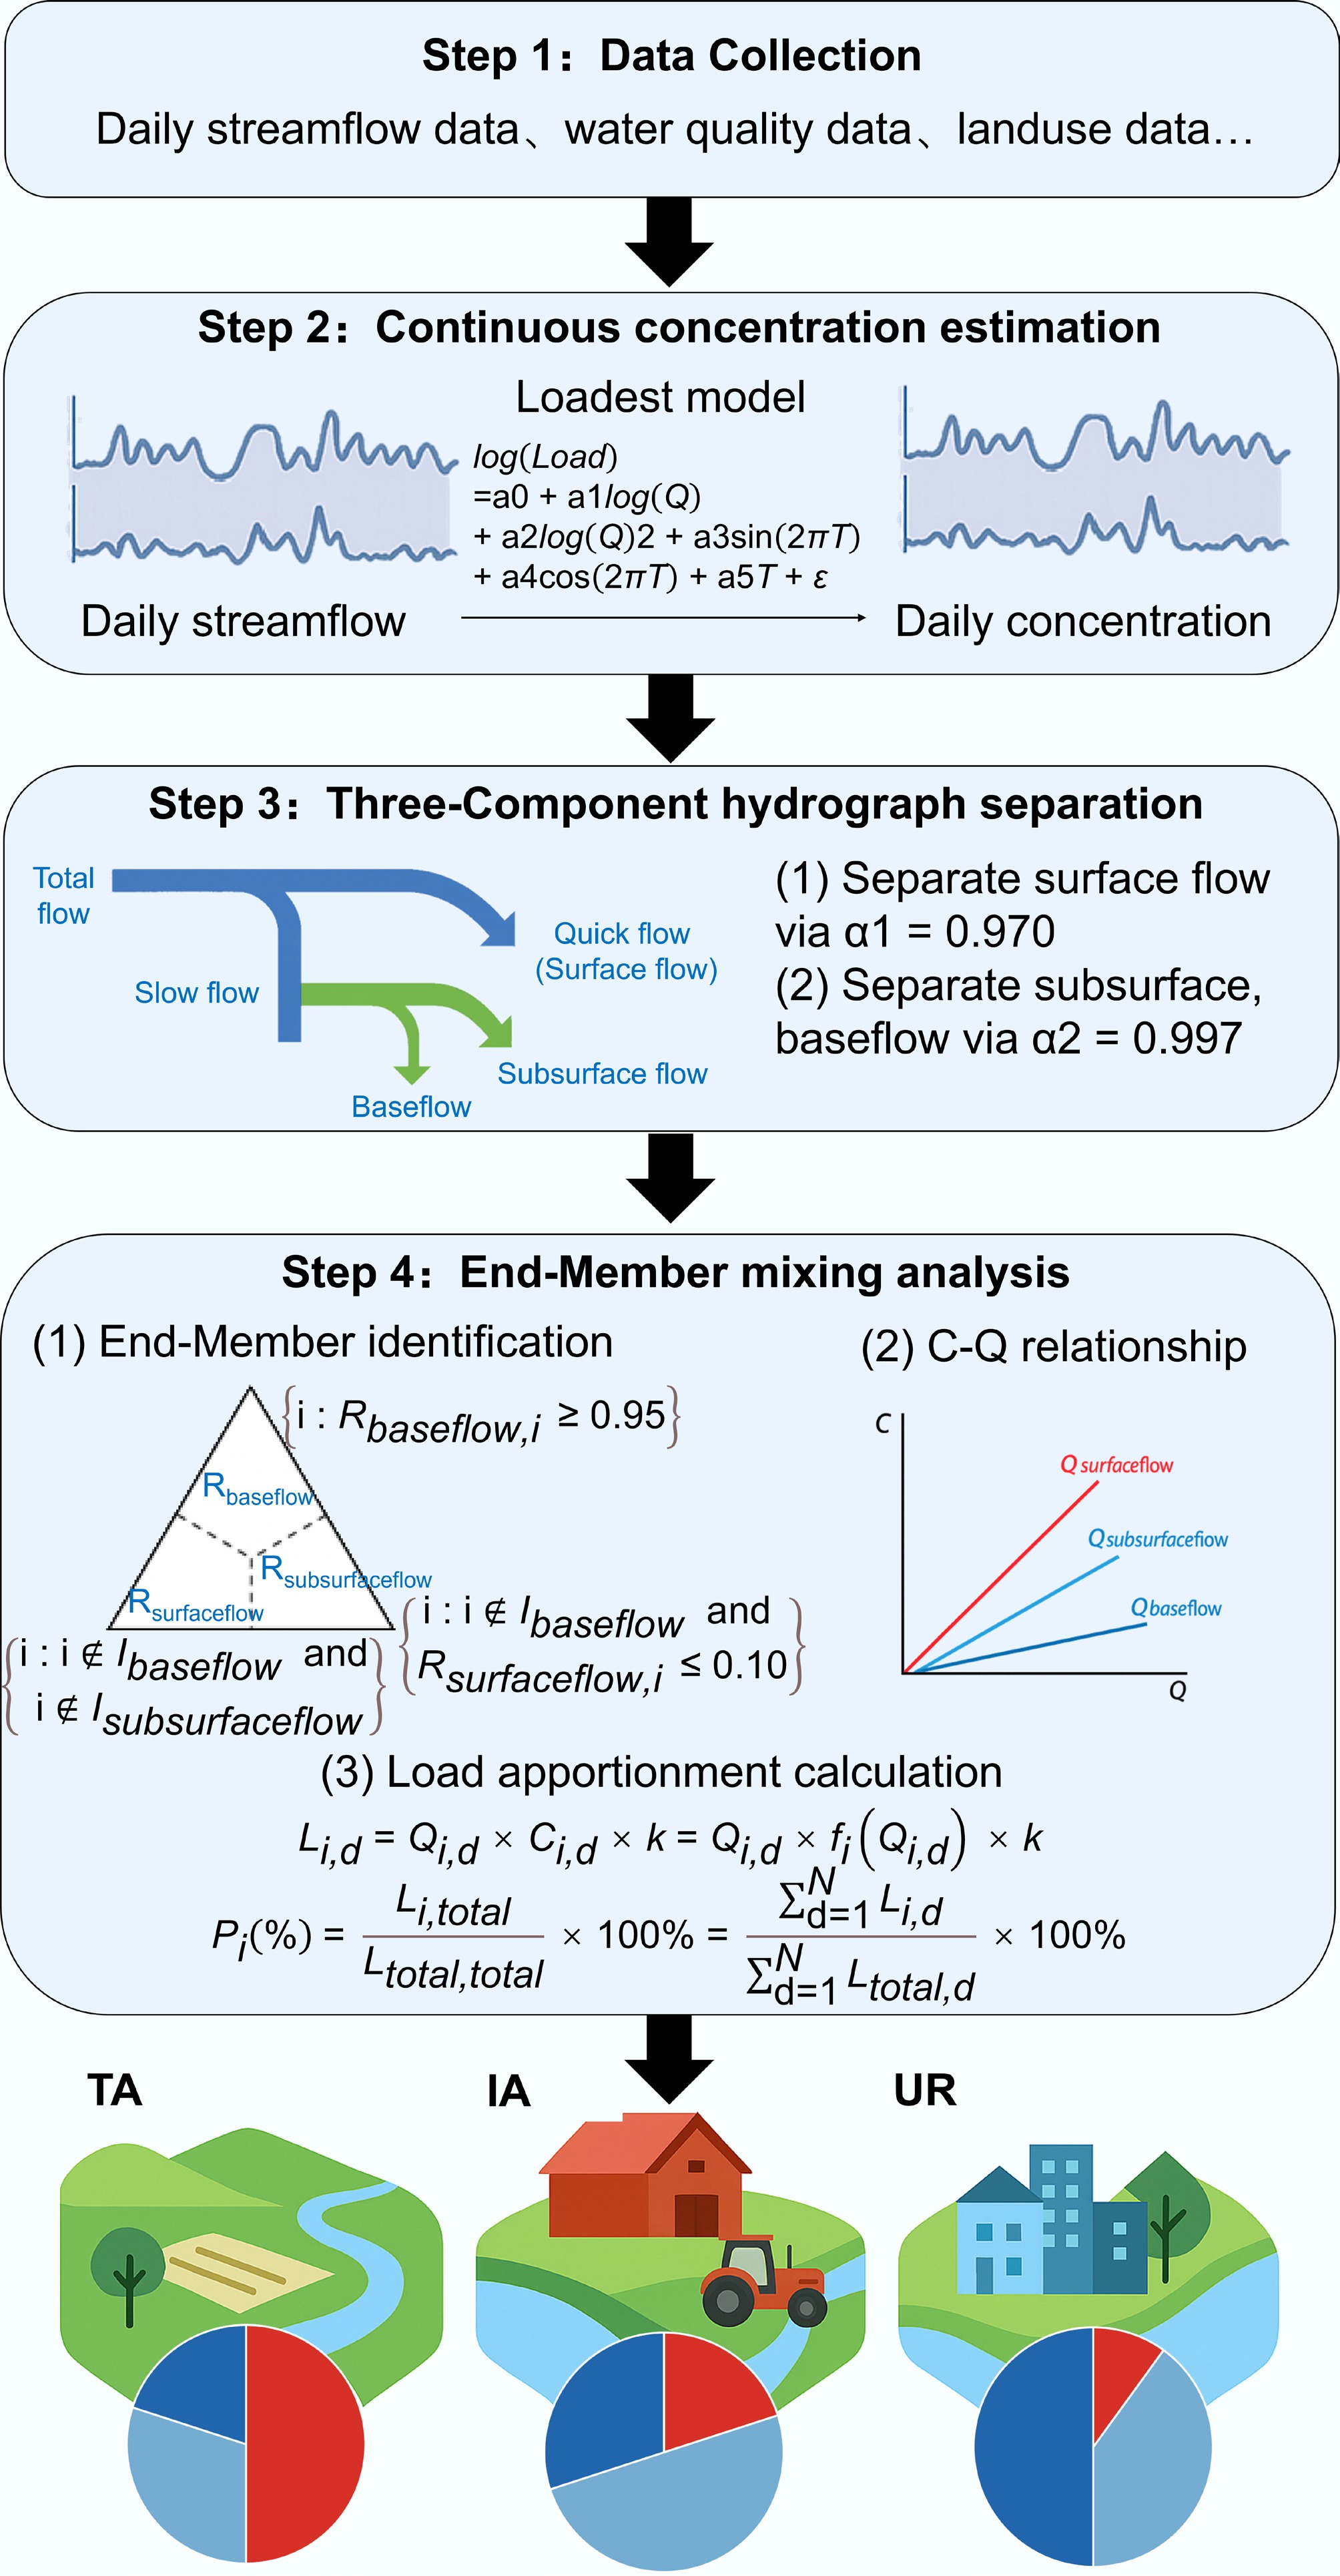
Figure 2.
Integrated analytical framework.
The total daily load (Ltotal) is the sum of the loads from each of the n = 3 pathway end-members:
$ {L}_{total,d}=\textstyle\sum _{i=1}^{n}{L}_{i,d}={L}_{surfaceflow,d}+{L}_{subsurfaceflow,d}+{L}_{baseflow,d} $ (3) where, Li,d is the load from pathway i on a given day d. The load from each pathway is the product of its daily water discharge (Qi,d), and its characteristic nutrient concentration (Ci,d). Therefore, the total load can also be expressed as:
$ \begin{split}{L}_{total,d}=\;&{Q}_{surfaceflow,d}\,\times\, {C}_{surfaceflow,d}\,+\,{Q}_{subsurfaceflow,d}\\&{\times \,C}_{subsurfaceflow,d}+{Q}_{baseflow,d}\,{\times\, C}_{baseflow,d}\end{split} $ (4) Solving this model requires robustly defining the discharge and concentration terms for each end-member.
Three-step stratified end-member identification
-
The identification of representative water samples for each hydrological pathway employed a novel three-step stratified filtering logic, specifically designed to ensure mutual exclusivity among end-member groups and minimize cross-contamination of chemical signatures. This approach fundamentally differs from traditional methods by implementing a hierarchical classification system that sequentially isolates the unique geochemical characteristics of each pathway.
Step 1: baseflow end-member identification
Baseflow end-member samples were identified first using a strict threshold criterion to capture the most chemically stable groundwater-dominated periods[23]:
$ {I}_{baseflow}=\left\{i:{R}_{baseflow,i}\ge 0.95\right\} $ (5) where, Ibaseflow represents the set of indices for the baseflow end-member samples, and Rbaseflow,i is the baseflow ratio on day i, calculated as:
$ {R}_{baseflow,i}=\dfrac{{Q}_{baseflow,i}}{{Q}_{total,i}} $ (6) This threshold of ≥ 95% ensures minimal contamination from storm-driven sources and captures periods when groundwater discharge dominates the stream chemistry.
Step 2: subsurface flow end-member identification
From the remaining data points (excluding those already classified as baseflow), subsurface flow end-member samples were identified using a dual criterion that emphasizes intermediate flow conditions:
$ {I}_{subsurfaceflow}=\left\{i:i\notin {I}_{baseflow}\;and\;{R}_{surfaceflow,i}\le 0.10\right\} $ (7) where, Rsurfaceflow,i is the surface flow ratio:
$ {R}_{surfaceflow,i}=\dfrac{{Q}_{surfaceflow,i}}{{Q}_{total,i}} $ (8) This criterion captures periods when subsurface flow (including interflow and delayed storm response) dominates the hydrological response while minimizing direct surface flow influence (≤ 10%).
Step 3: surface flow end-member identification
All remaining data points were classified as surface flow end-members:
$ {I}_{surfaceflow}=\left\{i:i\notin {I}_{baseflow}\;andi\;\notin {I}_{subsurfaceflow}\right\} $ (9) This residual approach ensures that storm-dominated periods with significant surface runoff contributions are captured without overlap with the other two end-members.
Concentration-discharge relationship
-
The daily discharge for each pathway end-member (Qsurface,d, Qsubsurface,d, and Qbaseflow,d) was directly obtained from the three-component hydrograph separation described above. Characterizing the concentration of each pathway end-member (Ci) is more complex. This was achieved by establishing pathway-specific C-Q relationships, which describe how the chemical signature of each pathway changes with its flow[24].
The development involved two steps: first, representative water samples for each end-member were described in the three-step stratified filtering logic above. Baseflow end-member samples were collected on days when baseflow ratio constituted ≥ 95% of the total streamflow, minimizing contamination from storm-driven sources. Subsurface flow end-member samples were identified from remaining data points where the surface flow ratio was ≤ 10%, capturing periods when subsurface flow dominates the hydrological response. Surface flow end-member samples comprised all remaining data points, ensuring storm-dominated periods were captured.
Second, optimal C-Q relationships were developed for each pollutant-pathway combination by evaluating multiple mathematical formulations, including linear, log-linear, and polynomial relationships. The optimal model was selected based on statistical significance, prioritizing the relationship with the lowest p-value (p < 0.05), and highest coefficient of determination (R2). This approach ensures robust concentration estimates for pathway-specific load apportionment, with uncertainty considerations addressed through the model performance evaluation and uncertainty analysis framework described above. This approach ensures that the selected C-Q relationships provide the best statistical representation of the observed concentration patterns for each pathway end-member.
Load apportionment calculation
-
With all components defined, the daily load contributed by each pathway end-member (Li,d) was calculated as:
$ {L}_{i,d}={Q}_{i,d}\times {C}_{i,d}\times k={Q}_{i,d}\times {f}_{i}\left({Q}_{i,d}\right)\times k $ (10) where, k is the unit conversion factor (86.4) to yield loads in kg day−1. The total load for each pathway (Li,total) was then computed by summing the daily loads over the entire study period:
$ {L}_{i,total}=\textstyle\sum _{d=1}^{N}{L}_{i,d} $ (11) where, N represents the total number of days in the study period. Finally, the proportional contribution (Pi) of each pathway to the total load was determined, which is a key output of this study:
$ {P}_{i}\left({\text{%}}\right)=\dfrac{{L}_{i,total}}{{L}_{total,total}}\times 100{\text{%}}=\dfrac{{\sum }_{d=1}^{N}{L}_{i,d}}{{\sum }_{d=1}^{N}{L}_{total,d}}\times 100{\text{%}} $ (12) Model performance evaluation and uncertainty analysis
-
To ensure robust load apportionment results, a comprehensive framework for model performance evaluation and uncertainty quantification was implemented. C-Q relationship fitting quality was evaluated using the coefficient of determination (R2). Ensemble modeling strategies were employed to enhance prediction robustness, including the evaluation of multiple functional forms (linear, logarithmic, and power functions), weighted averaging to integrate predictions from candidate models with weights determined based on AIC criteria, and bootstrap resampling (n = 1,000) to quantify prediction intervals and capture model structural uncertainty. Systematic uncertainty propagation analysis was implemented using Monte Carlo methods (n = 1,000), comprehensively considering concentration estimation uncertainty based on C-Q relationship prediction intervals, hydrograph separation parameter uncertainty with filter coefficients varied within literature-recommended ranges (α1: 0.96–0.99; α2: 0.995–0.999), and end-member identification criteria uncertainty with thresholds adjusted within reasonable ranges (baseflow ratio: 90%–98%; surface flow exclusion ratio: 5%–15%). Model diagnostics included time series analysis of residuals to examine systematic bias, seasonal fitting performance evaluation to identify model applicability under different hydrological conditions, and outlier detection and influence analysis to ensure robustness. This comprehensive approach ensures that load apportionment conclusions account for methodological uncertainties while maintaining scientific rigor. All data processing, statistical modeling, and visualization were conducted using version 4.5.2 of the statistical software package R[25].
-
Hydrograph separation revealed distinct differences in the contributions of hydrological pathways among the three study watersheds (Fig. 3). At the annual scale, baseflow accounted for 40.2% of total runoff in the Urban (UR) watershed, reflecting a larger proportion of groundwater contributions. In contrast, surface flow was the dominant pathway in the Traditional Agriculture (TA, 39.1%) and Intensive Agriculture (IA, 39.9%) watersheds. Subsurface flow maintained a relatively consistent contribution across watersheds, ranging from 21.6% to 28.4%. Seasonal variations were also apparent (Fig. 3). During the dry season, baseflow contributed 58.7%, 38.8%, and 49.2% of total runoff in TA, IA, and UR, respectively. In the wet season, surface and subsurface flow contributions increased substantially across all watersheds, corresponding to enhanced rainfall-driven runoff. In TA and IA, surface flow became the primary pathway during the wet season, contributing over 40% of total runoff. These results reflect the dynamic responses of hydrological pathways to seasonal precipitation patterns across land uses.
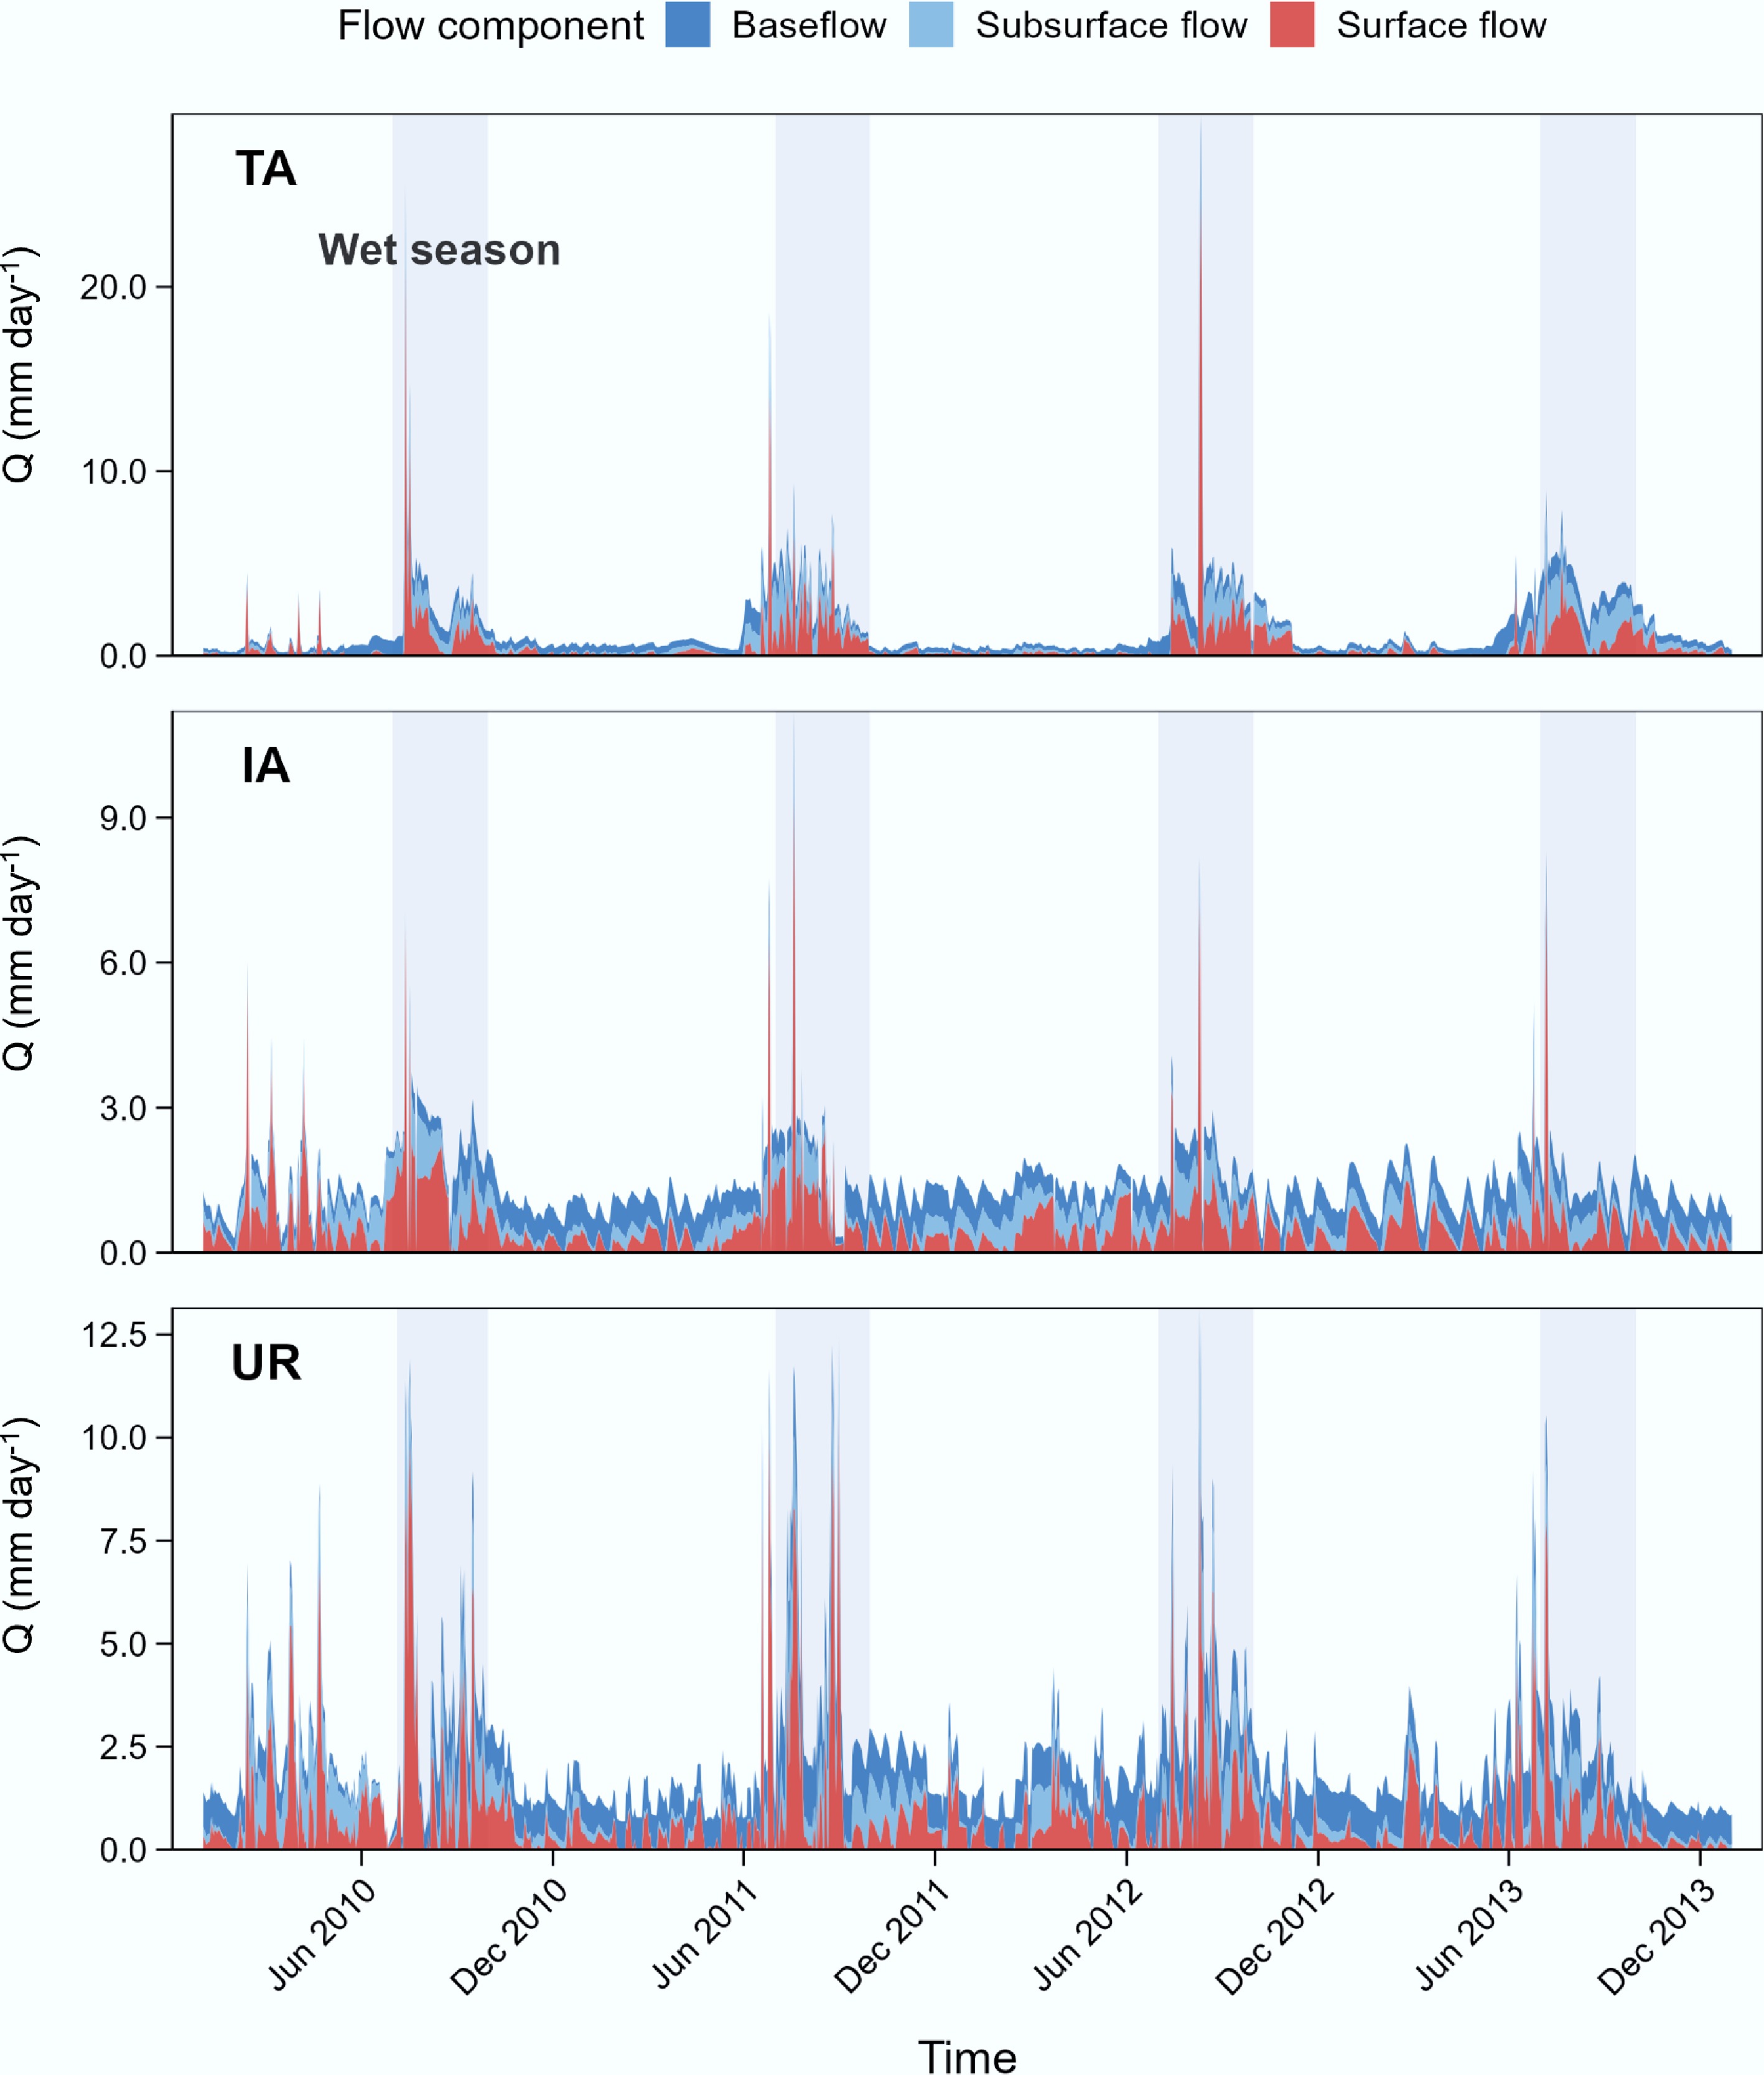
Figure 3.
Hydrological pathway separation showing flow components (baseflow, subsurface flow, and surface flow) across the three study watersheds. TA represents traditional agricultural area, IA represents intensive agricultural area, and UR represents urban area. Gray shaded areas indicate wet seasons.
End-member characteristics and N load partitioning
-
Continuous N concentrations simulated by the LOADEST model (Supplementary Fig. S2) provided the basis for pathway-specific N load estimation. End-member samples for constructing C-Q relationships were identified through a stratified and mutually exclusive approach based on hydrological pathway separation. The performance of these C-Q relationships varied across flow components and watersheds (Supplementary Table S1), reflecting differences in hydrological dynamics and N transport processes. Generally, baseflow and subsurface flow pathways demonstrated robust fitting performance, with coefficients of determination mostly ranging from 0.20 to 0.77. Notably, DON in surface flow pathways exhibited relatively lower fitting performance, reflecting the complex source-sink dynamics and transformation mechanisms of organic N during surface runoff processes.
Analysis revealed that the end-members of different pathways have distinctly different geochemical characteristics (Fig. 4). The IA watershed exhibited the highest N concentrations across pathways and species. Median NH4+−N concentrations in IA were 2.50 mg L−1 (baseflow), 5.45 mg L−1 (subsurface flow), and 4.29 mg L−1 (surface flow), with subsurface flow also exhibiting the highest TDN (median 9.07 mg L−1). In TA, baseflow NO3−−N concentrations were elevated (median 1.87 mg L−1), while surface flow showed higher variability in DON concentrations. In UR, N concentrations followed the gradient baseflow > subsurface flow > surface flow for TDN and NH4+-N, with baseflow TDN reaching 4.21 mg L−1, and NH4+−N 1.71 mg L−1.
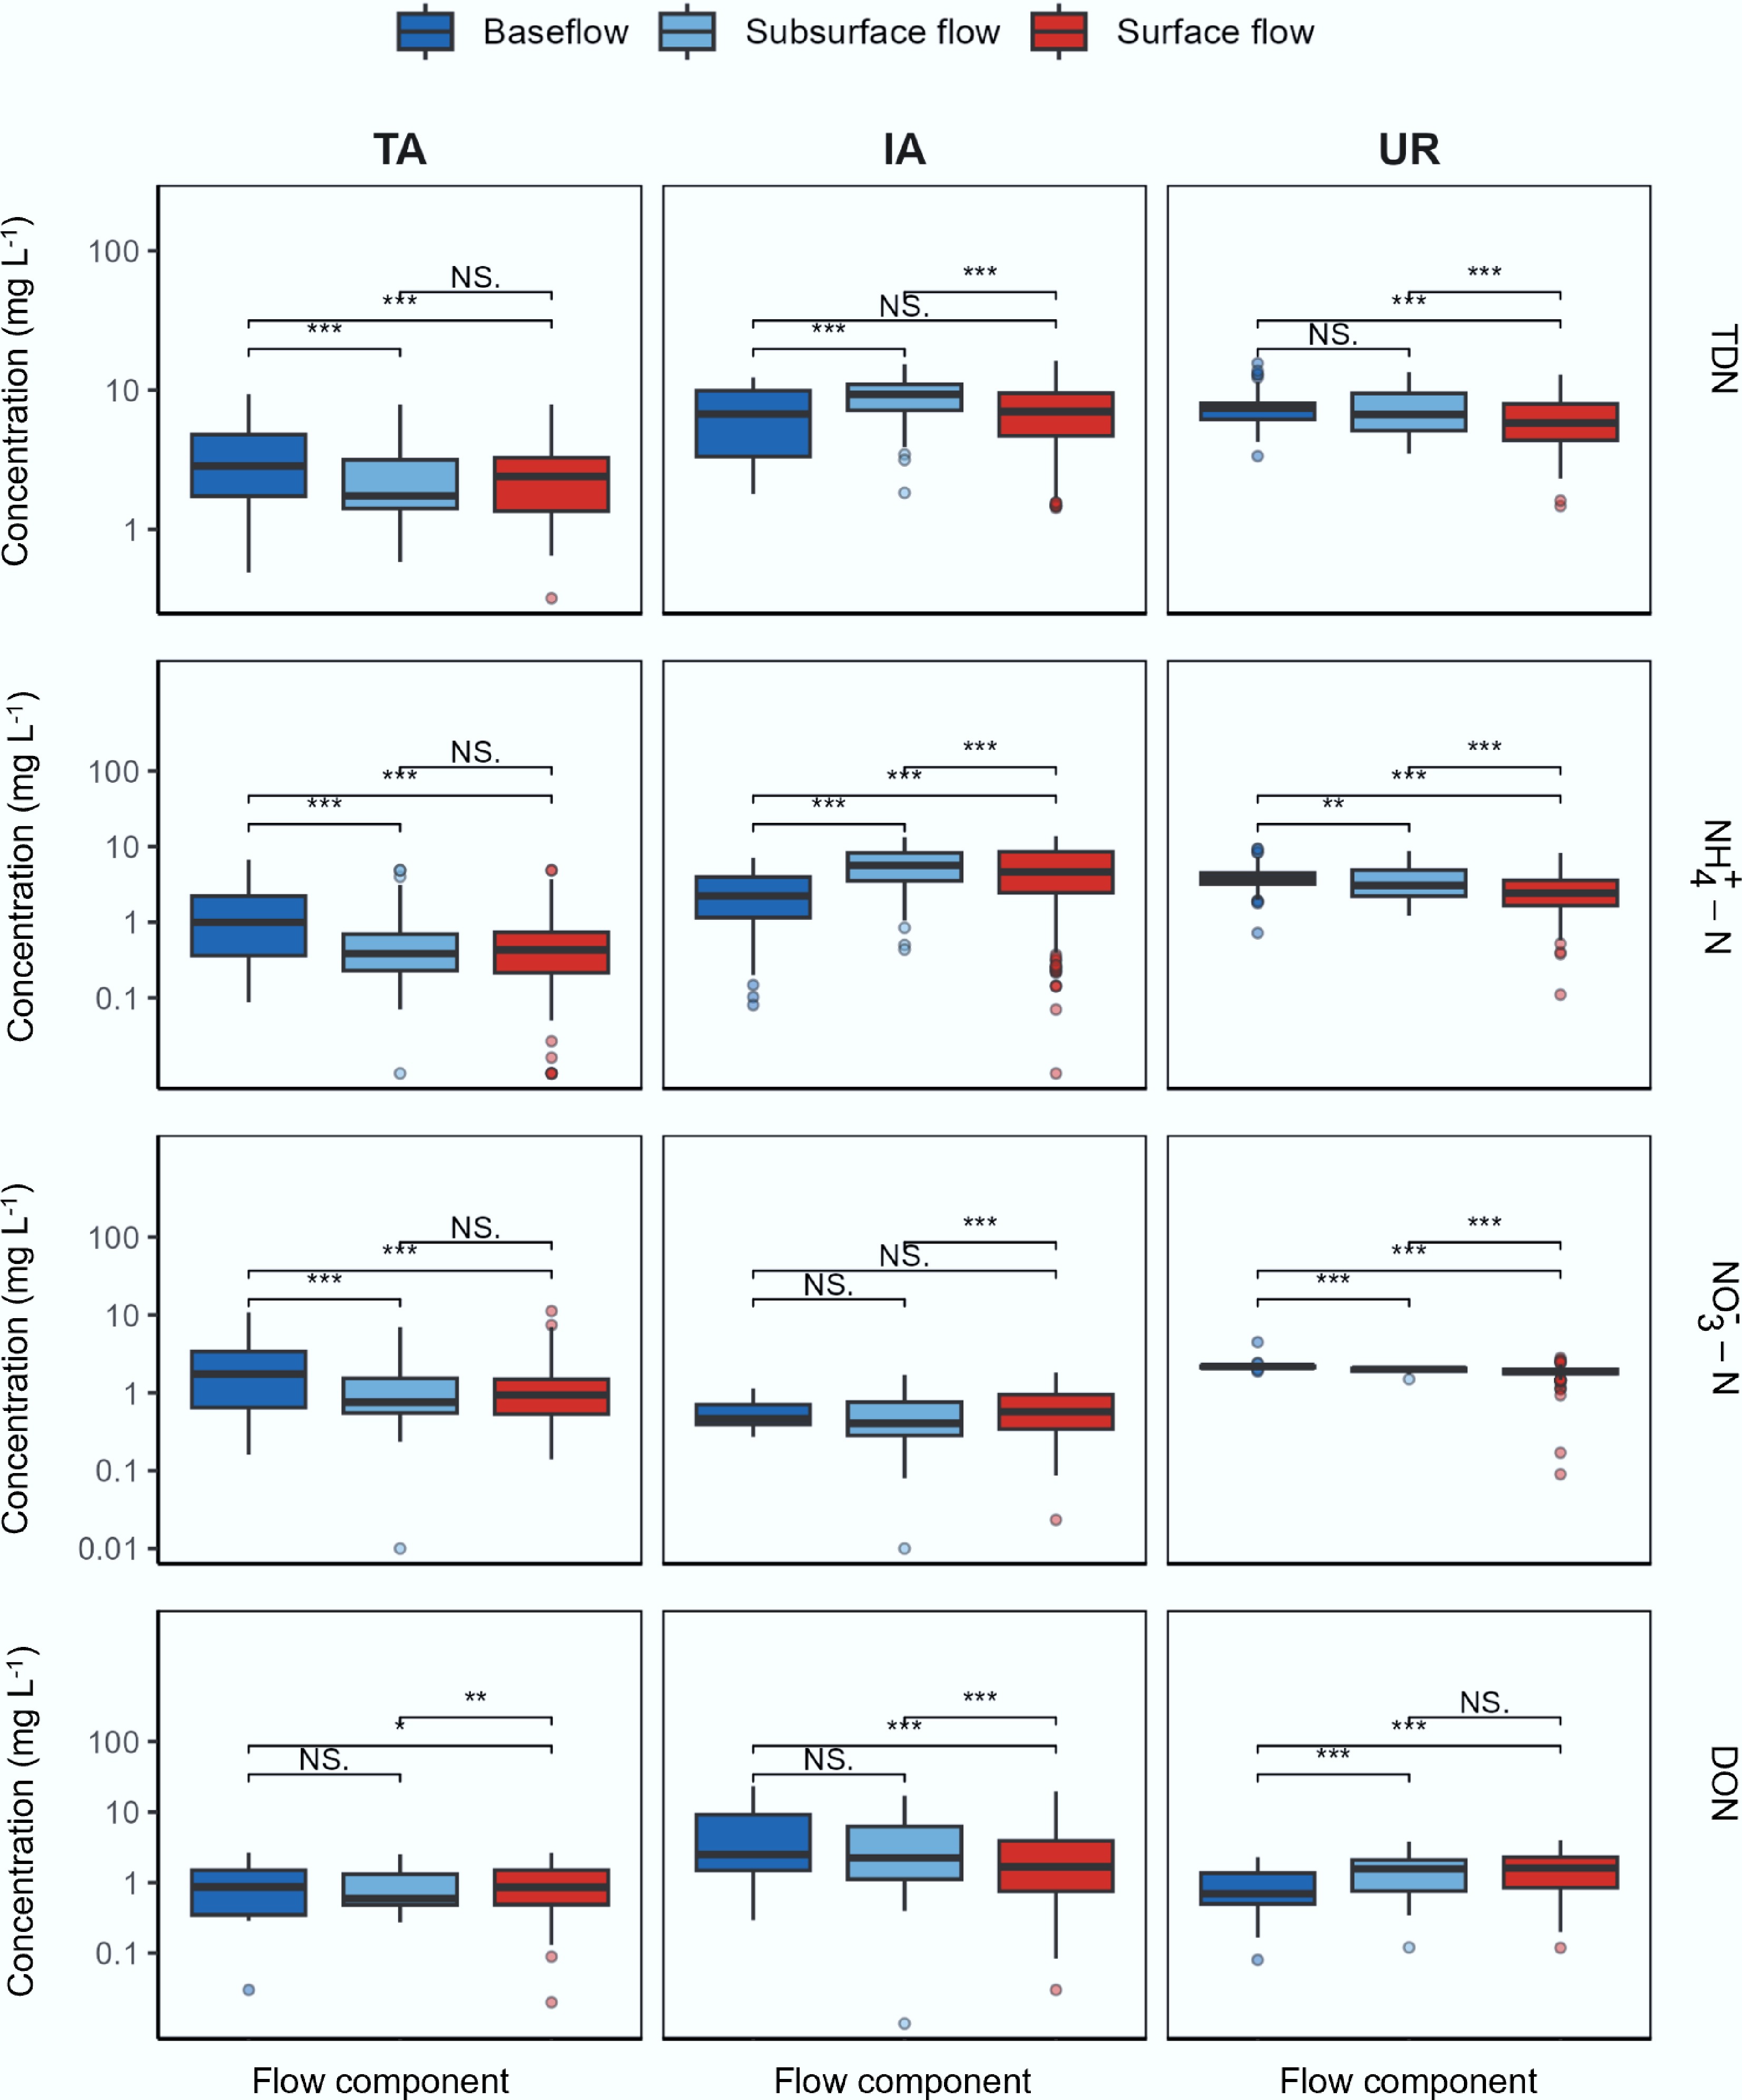
Figure 4.
Concentration distributions of N species (TDN, NH4+−N, NO3−−N, and DON) across flow components in the three study watersheds. ( NS. : p > 0.05; * p < 0.05; ** p < 0.01; *** p < 0.001).
Across all watersheds, surface flow exhibited the highest DON concentrations, with medians of 1.58 mg L−1 (TA), 1.87 mg L−1 (IA), and 2.09 mg L−1 (UR). Annual N load estimation showed substantial differences among the three watersheds (Table 1). The UR watershed exported the highest total TDN load (33,287.1 t), followed by TA (1,169.5 t), and IA (652.4 t). Despite higher concentrations in IA, smaller discharge volumes resulted in lower total loads compared to UR. Pathway contributions to N loads varied among watersheds and N species. In UR, baseflow contributed 42.9% of TDN and 46.4% of NH4+−N exports. In TA, baseflow accounted for 50.2% of NO3−−N exports. Surface flow was the principal pathway for DON export in TA (42.9%), and UR (45.5%). Subsurface flow contributed consistently across watersheds, ranging from 21.8% to 30.1%.
Table 1. Annual nutrient loads and pathway contributions for the three study watersheds
Watershed Flow component TDN load
(t yr−1)TDN contrib.
(%)NH4+−N load
(t yr−1)NH4+−N contrib.
(%)NO3−−N load
(t yr−1)NO3−−N contrib.
(%)DON load
(t yr−1)DON contrib.
(%)TA Baseflow 486.3 41.6 167.1 43.2 289.4 50.2 139.6 31.5 Subsurface flow 277.9 23.8 96.9 25.1 117.2 20.4 113.1 25.6 Surface flow 405.3 34.6 122.5 31.7 169.7 29.4 189.5 42.9 IA Baseflow 214.7 32.9 79.9 22.0 17.0 33.4 109.9 48.1 Subsurface flow 196.3 30.1 126.1 34.7 12.2 23.8 56.9 24.9 Surface flow 241.4 37.0 157.3 43.3 21.9 42.8 62.0 27.1 UR Baseflow 14,294.6 42.9 7,505.4 46.4 4,230.1 42.6 1,787.0 30.5 Subsurface flow 7256.3 21.8 3,458.7 21.4 2,112.5 21.3 1,405.9 24.0 Surface flow 11,736.2 35.3 5,202.4 32.2 3,582.4 36.1 2,668.6 45.5 To evaluate the impact of model uncertainty on load estimation, Monte Carlo uncertainty analysis was conducted for all pathway contributions. Results showed that even in the worst-fitting case (TA watershed DON surface flow, R2 = 0.20), the 95% confidence interval for annual load estimation was ± 32%, with uncertainty ranges for relative pathway contributions to total loads between ± 8%–15%. Importantly, major conclusions (such as urban baseflow dominance for NH4+-N, traditional agricultural NO3−−N baseflow advantage) were all based on relationships with acceptable fitting quality, ensuring the reliability of core findings. Integrated uncertainty analysis demonstrated that despite fitting challenges in individual C-Q relationships, the relative importance patterns among pathways remained robust, and the differential N export mechanisms among watersheds were statistically significant (p < 0.05).
Seasonal load dynamics and pathway contributions
-
Seasonal N export patterns differed across watersheds and hydrological pathways (Supplementary Table S2). In TA, TDN export was higher during the wet season (666.5 t) than the dry season (502.0 t). In IA and UR, N exports were higher during the dry season, with IA exporting 427.3 t (dry) compared to 225.7 t (wet), and UR showing consistent dry-season dominance.
This seasonal load reversal is tightly coupled with the dramatic shifts in hydrological transport pathways (Figs 5 and 6). During the dry season, N export in all watersheds was dominated by baseflow, which accounted for 58.7%, 38.8%, and 49.2% of the TDN loads in the TA, IA, and UR watersheds, respectively. Upon transitioning to the wet season, the transport mechanism fundamentally changed as surface runoff volumes surged. Baseflow contributions generally decreased, while surface runoff contributions rose sharply, becoming the primary pathway for TDN export in the TA and IA watersheds during the wet season (contributing 41.7% and 46.6%, respectively). This seasonal pathway switching varied among N species. The baseflow contribution to NO3−−N in the TA watershed dropped from 66.8% in the dry season to 36.3% in the wet season. DON was most sensitive to changes in surface runoff, with its export via this pathway in the UR watershed increasing from 41.6% in the dry season to 51.0% in the wet season. The seasonal pattern in the IA watershed was particularly unique, as its surface runoff maintained a high contribution even during the dry season (38.5% for NH4+-N) and increased further in the wet season (51.7%), suggesting the influence of persistent point sources or high-intensity agricultural sources.
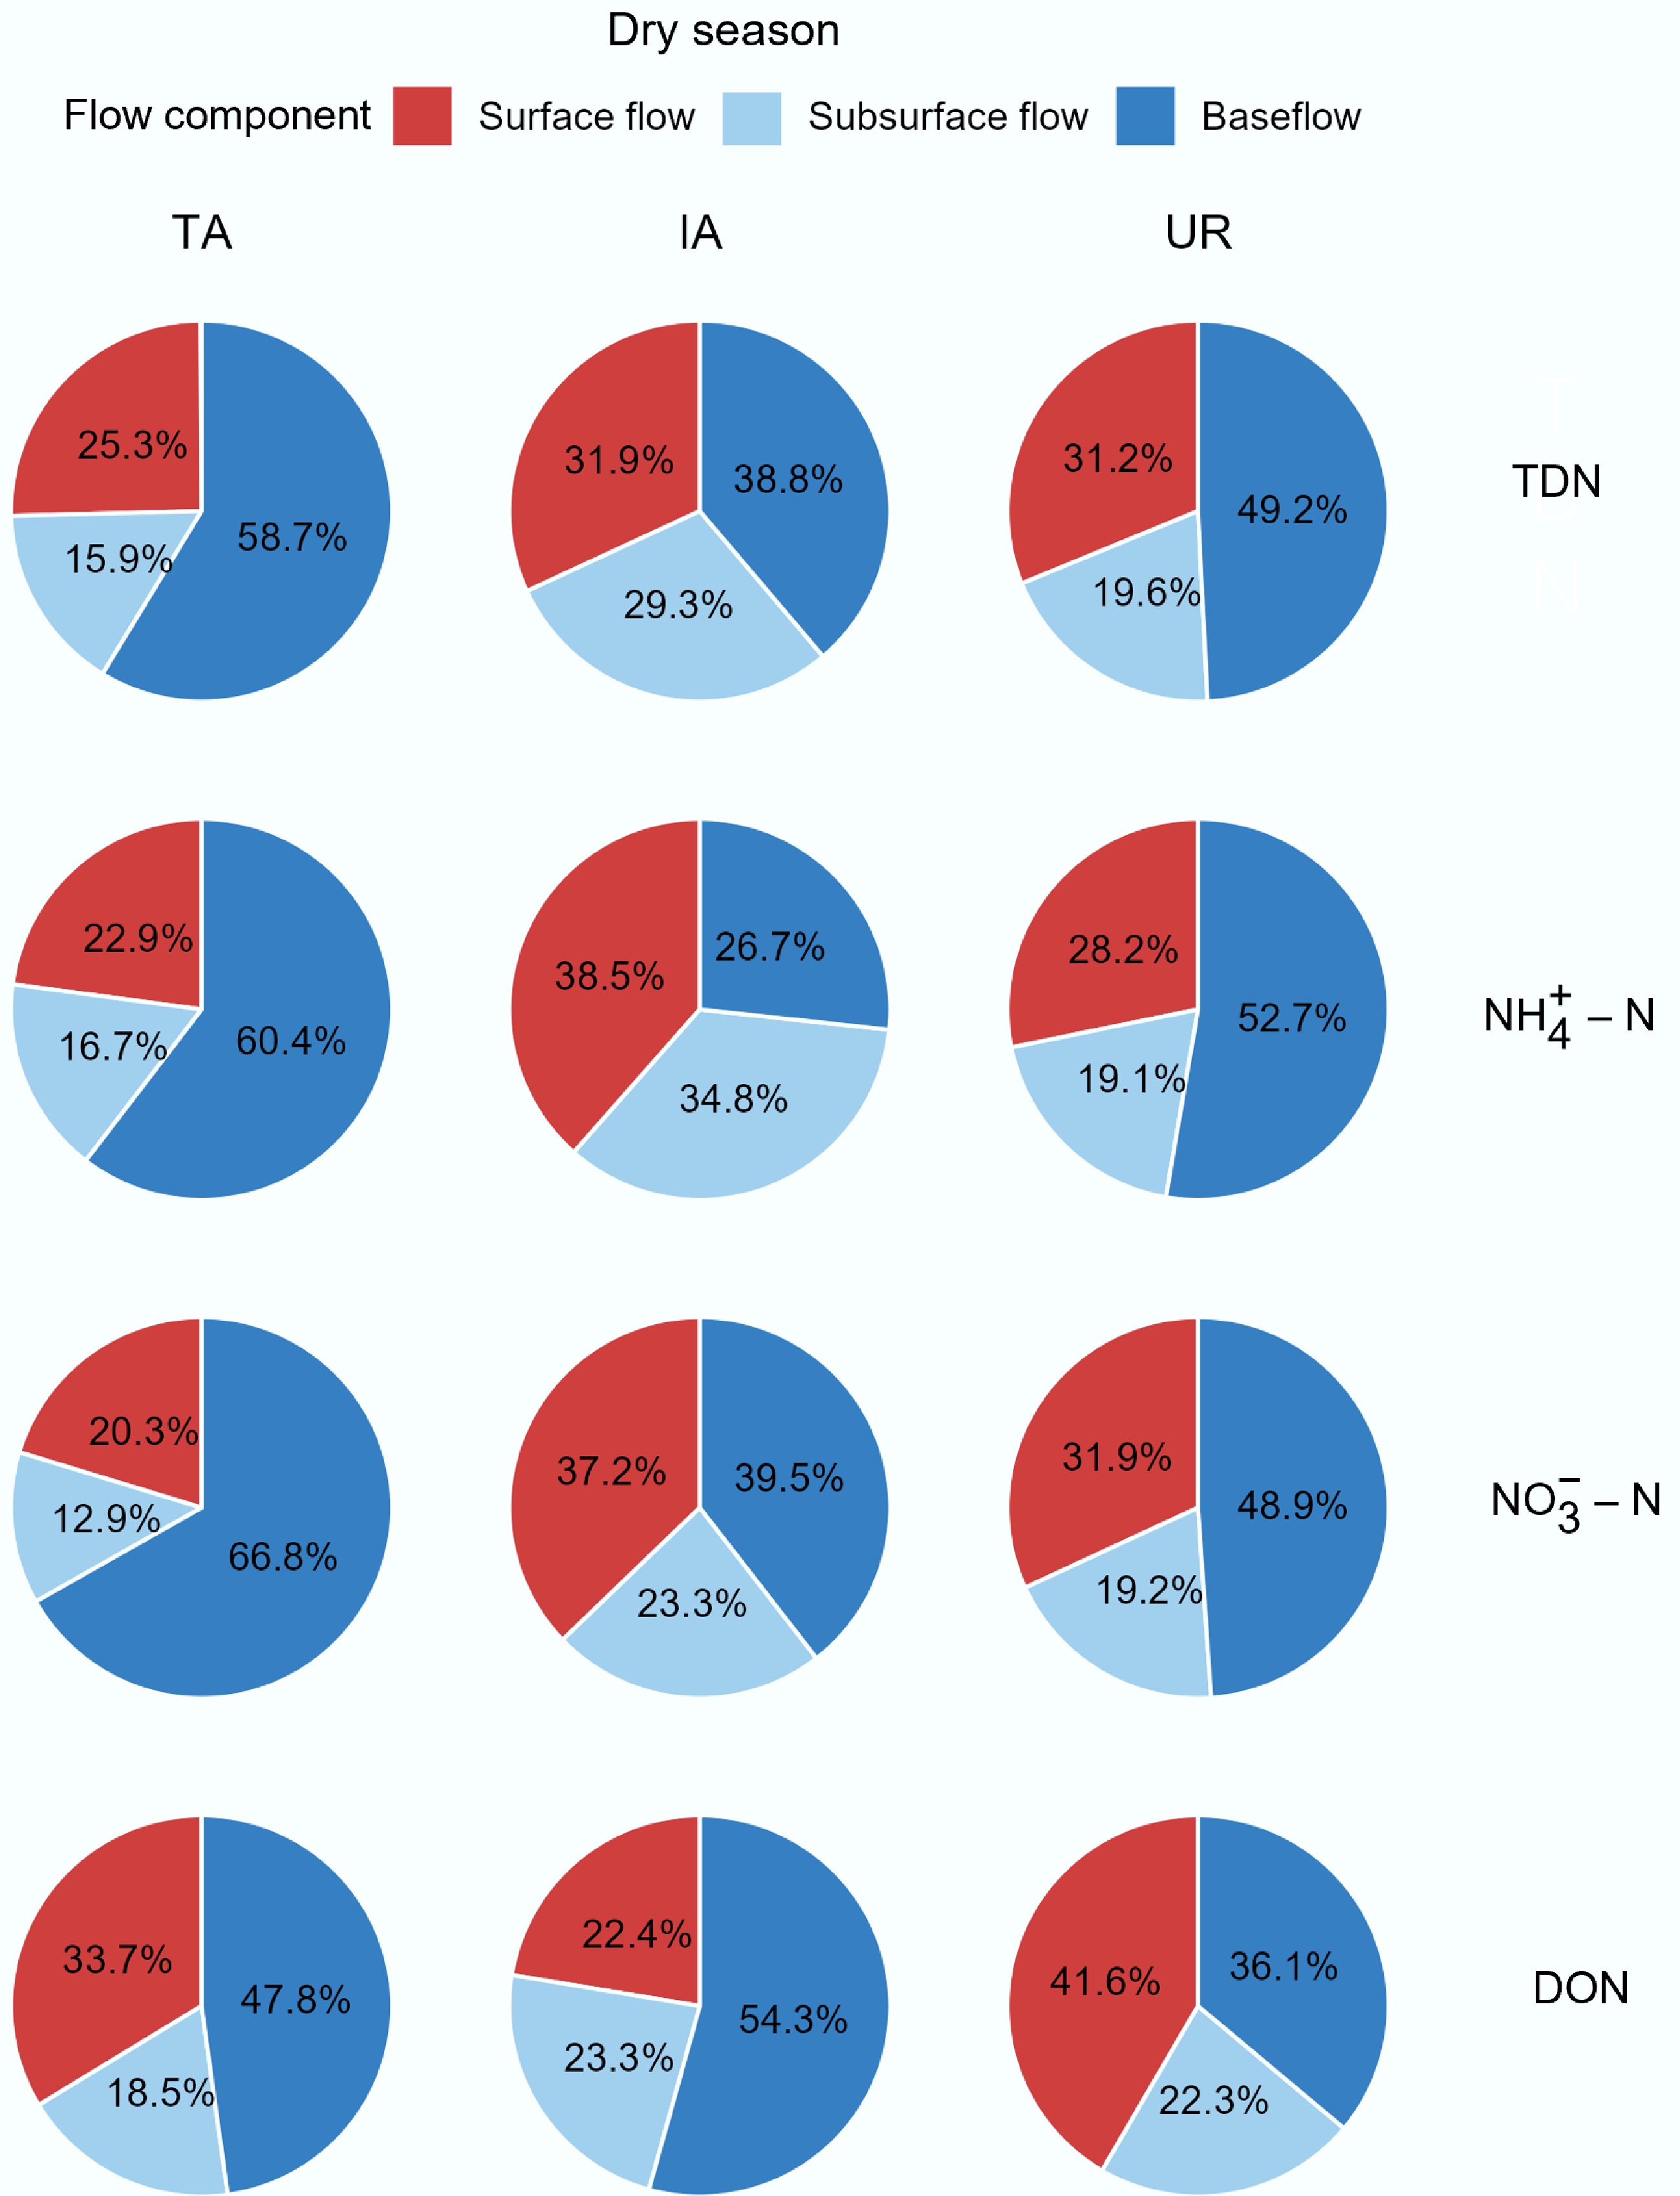
Figure 5.
Seasonal pathway contributions to N loads during dry season across the three study watersheds.
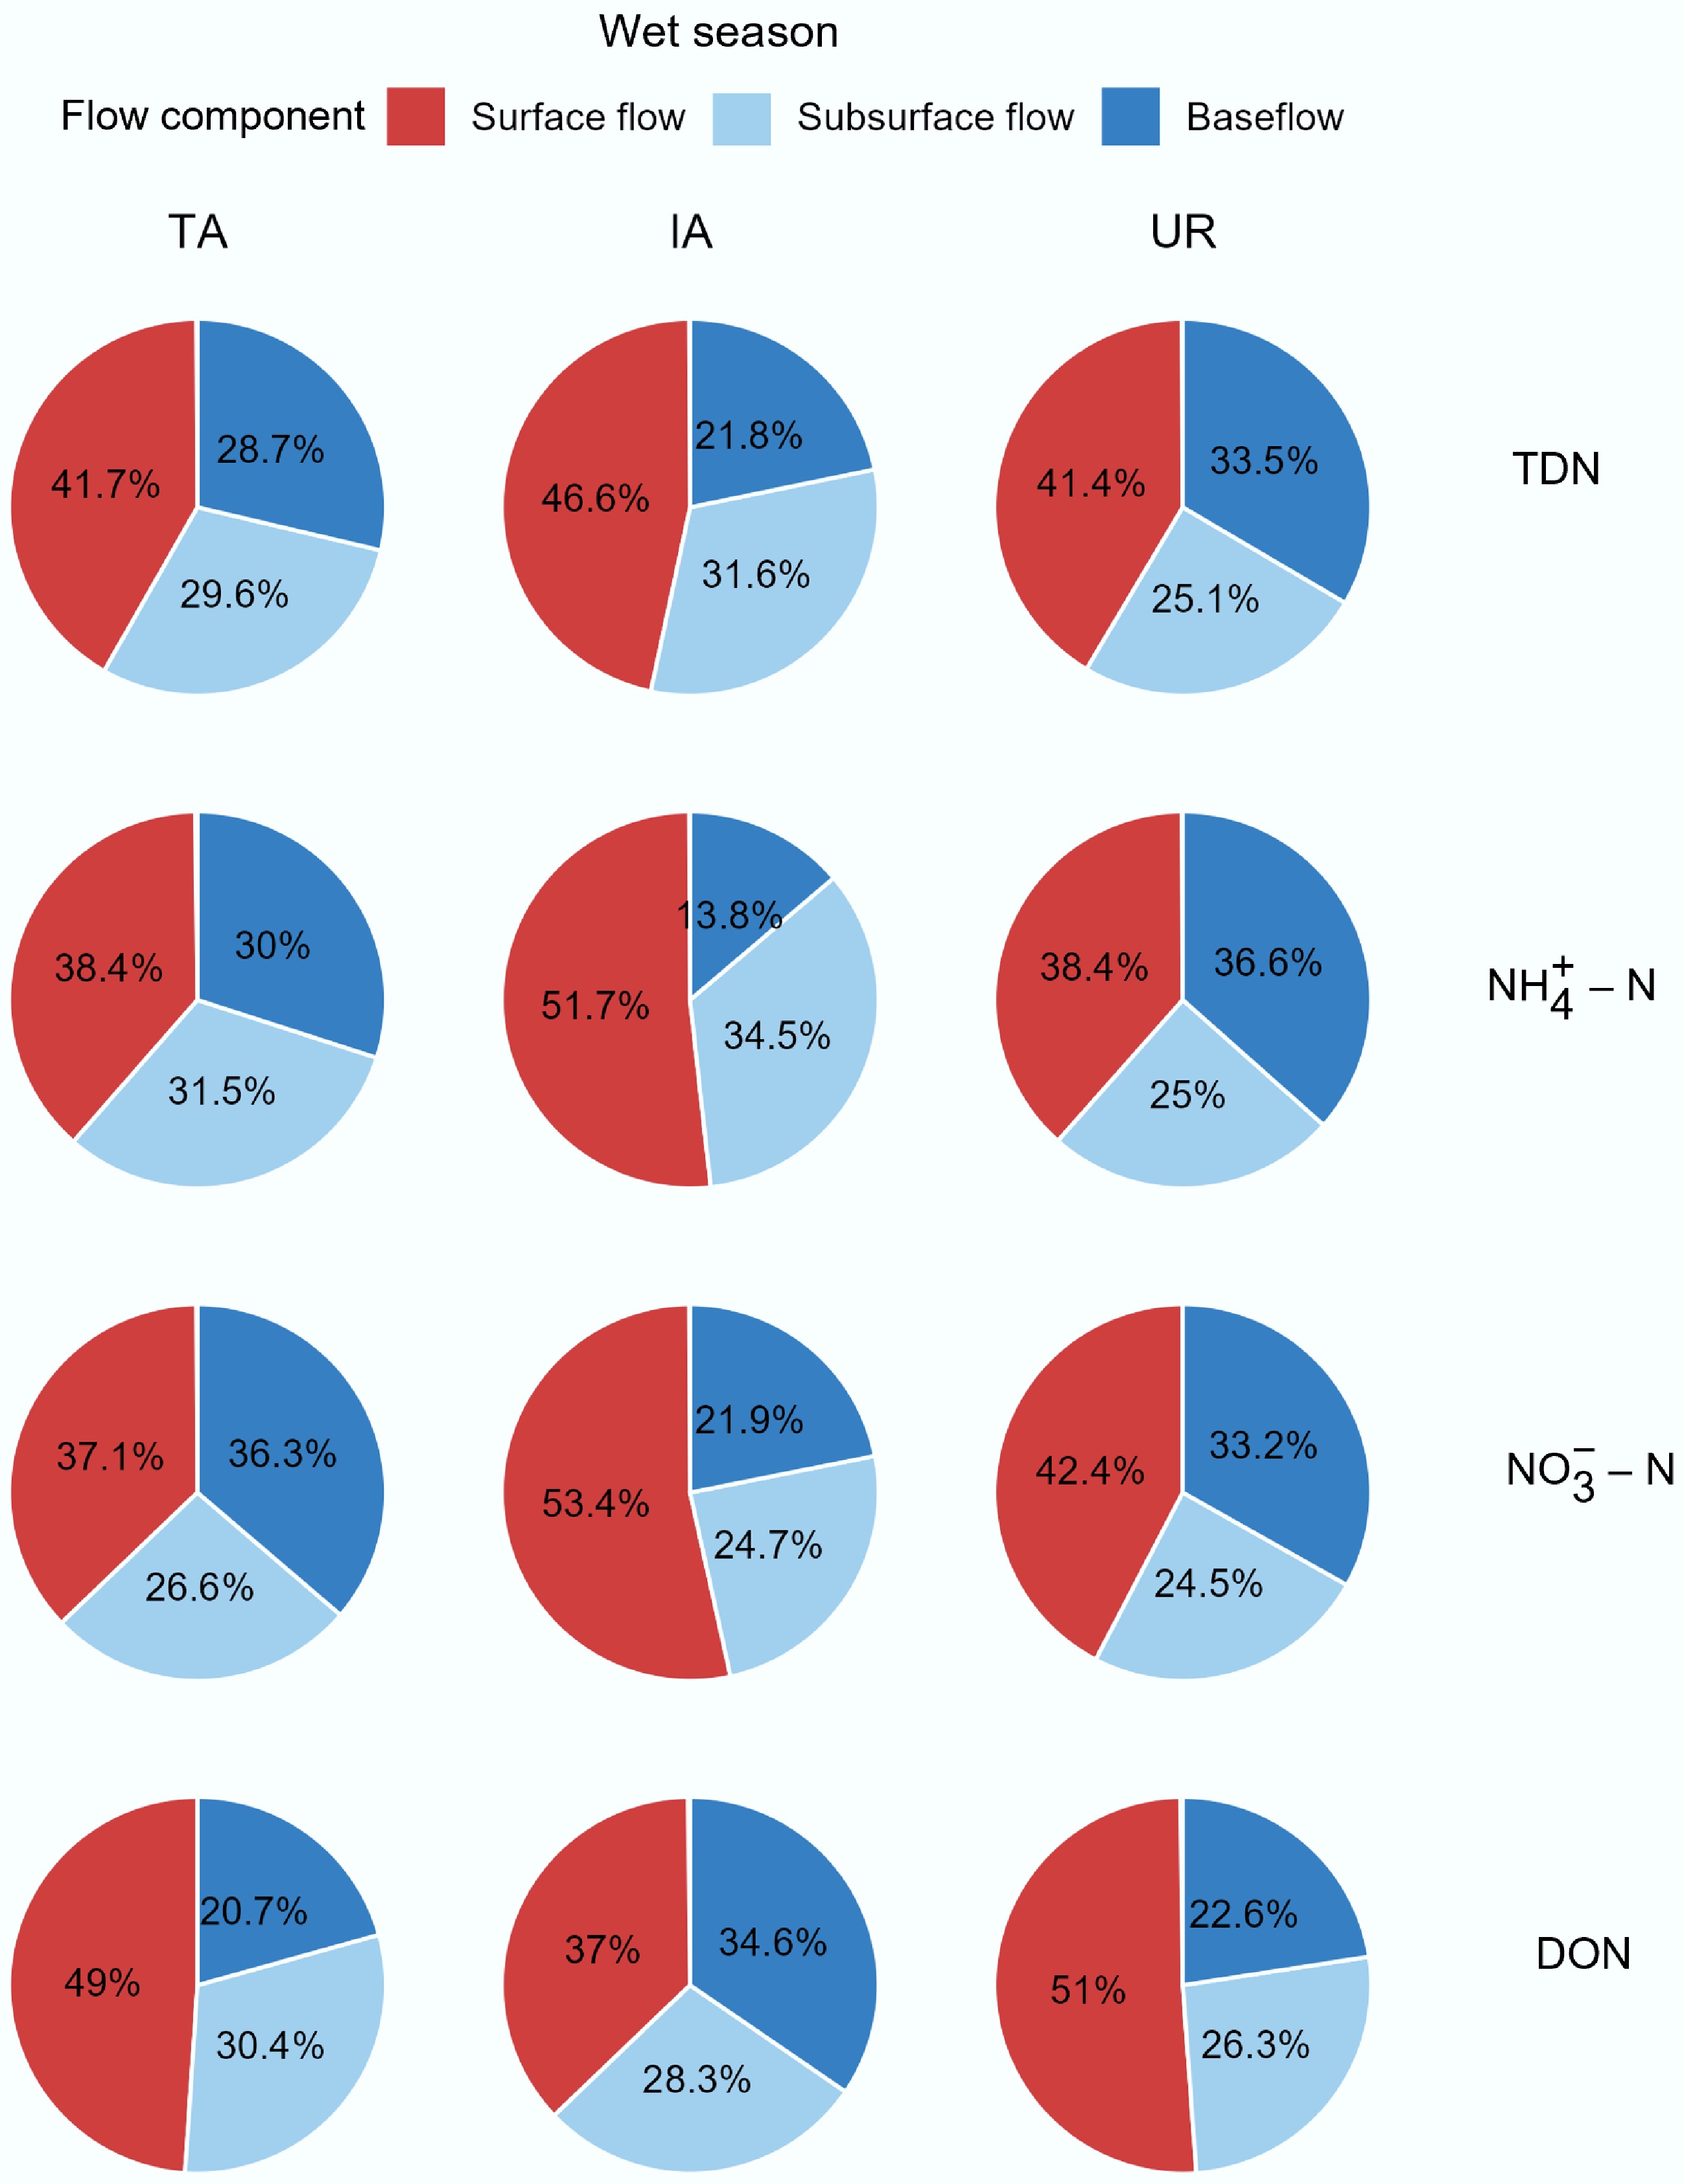
Figure 6.
Seasonal pathway contributions to N loads during wet season across the three study watersheds.
-
A primary challenge in watershed N research has been the fundamental disconnect between hydrological flow partitioning and pollutant load partitioning, where traditional hydrograph separation assumes flow proportions directly reflect pollutant contributions, while conventional End-Member Mixing Analysis (EMMA) often lacks a robust hydrological foundation for quantifying pathway contributions. This study introduces an integrated framework that synergizes three-component hydrograph separation with pathway-specific EMMA, establishing quantitative hydrological partitioning while capturing the unique biogeochemical signatures of each transport mechanism. This integration enables explicit separation of water fluxes from pollutant loads by quantifying differences in solute mobilization across surface flow, subsurface flow, and baseflow pathways. The present results confirm that N export represents a complex interplay between discharge volumes and pathway-specific concentration-discharge relationships, where a pathway contributing 40% of water flow may contribute only 25% of N load, or vice versa. This framework thus provides a mechanistic basis for coupling hydrology with pollutant transport, moving beyond oversimplified paradigms that either equate flow with load or rely on subjective end-member identification. While the framework quantifies transport pathways rather than sources directly, it enables robust source inference when combined with watershed characteristics. For instance, the finding that urban baseflow is the primary pathway for NH4+−N export provides strong evidence that leaking sewer systems are the dominant source. This type of source-pathway linkage is a key advantage of the framework that would be overlooked by other approaches.
To demonstrate the advantages of this approach, its findings can be directly compared with a conventional method. For the UR watershed, baseflow accounted for 40.2% of the total annual runoff. A conventional approach would therefore assume its contribution to the N load is also 40.2%. However, the integrated framework reveals that baseflow transports 46.4% of the NH4+−N load, a significant difference that correctly identifies leaking sewer infrastructure as a dominant pollution driver. While the framework quantifies transport pathways rather than sources directly, this example shows how it enables robust source inference. This critical insight, essential for accurate diagnosis and targeted management, would be missed by conventional methods.
The decoupling of hydrological flow and N load was particularly stark when comparing watersheds with different dominant land uses. The IA watershed, for instance, exhibited persistently high TDN concentrations across all pathways; however, the total N load was constrained by low discharge volumes. Conversely, the UR watershed, characterized by only moderate TDN concentrations, produced significantly higher TDN loads. This amplification was driven by substantial discharge and sustained contributions from subsurface flow. These findings emphasize the inadequacy of using hydrological separation alone to infer pollutant transport processes, and highlight the necessity of explicitly integrating concentration dynamics[26].
A key advancement of this framework is its ability to quantify subsurface flow as an independent and stable N export pathway, which is often obscured in traditional two-component (surface-baseflow) models. In the present study, subsurface flow was a consistent and significant contributor to the annual TDN load across all land uses, accounting for 21.8%–30.1% of the total. This highlights its critical role as a unique hydrological and biogeochemical transition zone with distinct solute transport characteristics. Neglecting this pathway can lead to a systematic misrepresentation of N export dynamics, particularly in landscapes where shallow interflow mobilizes pollutants differently than rapid surface runoff or deeper groundwater[27]. By establishing pathway-specific C-Q relationships, the present framework delivers a more robust and mechanistically sound understanding of how hydrological partitioning regulates N export, thereby creating a solid analytical foundation for developing targeted and effective management strategies[28].
Mechanistic shifts across a rural-urban gradient and seasonal variation
-
N export mechanisms undergo a distinct transformation along the rural-to-urban gradient, a shift fundamentally driven by land use intensity, pollution source complexity, and altered hydrological connectivity[9]. In traditional agricultural watersheds, N export is primarily regulated by natural hydrological cycles. Longer residence times facilitate processes like nitrification and leaching, leading to a gradual release of nitrate that is predominantly transported via baseflow, which can contribute over half of the TDN export (50.2%)[29]. In contrast, surface runoff in these systems is characterized by strong, event-driven dynamics, mainly mobilizing DON during rainfall[30]. With the transition to intensive agriculture, these mechanisms reflect a systematic breakdown of the natural buffering capacity[31]. Elevated N concentrations across all flow paths indicate diminished hydrological and biogeochemical retention[5]. The overuse of fertilizers, combined with waste from livestock and aquaculture, results in sustained N enrichment. The notable proportion of ammonium in surface flow (43.3%) further signals the rapid mobilization of reactive N from fresh sources with limited time for in-situ transformation[15].
In urban watersheds, the dominant N export mechanisms shift from natural hydrological regulation to being controlled by aging or inadequate infrastructure. Leaking sewer systems and stormwater drainage networks continuously feed N into subsurface and baseflow pathways. This transforms these pathways from potential dilution mechanisms into persistent pollution conduits[32,33]. In the urban areas studied, baseflow alone contributed 46.4% of the total NH4+−N load, illustrating a fundamental transition from nitrate-dominated export governed by biogeochemical processing time in rural landscapes to continuous ammonium leakage driven by urban infrastructure[27].
Seasonal variations driven by the intense monsoonal precipitation in the region further modulate these N export mechanisms, especially in agricultural systems where changing hydrological conditions alter the dominance of different flow paths. During wet seasons, high-volume precipitation events dramatically alter the hydrological regime, with enhanced surface runoff becoming the primary N transport pathway in agricultural watersheds and contributing 41.7% and 46.6% of the TDN load in the TA and IA watersheds, respectively (Fig. 6). This enhanced hydrological connectivity amplifies the event-driven mobilization and flushing of DON from topsoil, with surface flow contributing the majority of DON export during the wet season. Conversely, dry seasons favor baseflow-dominated nitrate export due to more sustained subsurface connectivity. For instance, the contribution of baseflow to NO3−−N export in the TA watershed rose to 66.8% during the dry season (Fig. 5), which aligns with prior findings on hydrological controls of N transport[34]. In urban areas, however, these seasonal hydrological patterns are largely overshadowed by continuous subsurface pollution. N loads remain high regardless of the season, a direct consequence of persistent, infrastructure-related sources that are decoupled from natural precipitation and flow regimes[35].
Potential implications, limitations, and prospects
-
This study reveals that management strategies based solely on land use are insufficient, as they often neglect the distinct roles of different hydrological pathways in N transport. In traditional agricultural watersheds, a dual-focus approach is required. To mitigate DON export during wet seasons, interventions must reduce surface runoff connectivity through measures like buffer strips and vegetated ditches. Simultaneously, managing the baseflow-driven export of nitrate necessitates practices that enhance soil N retention, such as optimizing fertilizer timing and promoting cover crops to limit leaching. In intensive agricultural watersheds, where elevated N concentrations were observed across all pathways, the priority must be source control. This includes stricter fertilizer management and improved handling of waste from livestock and aquaculture, supplemented by integrated measures like constructed wetlands or denitrifying bioreactors to treat both surface and subsurface flows.
In urban watersheds, N management must pivot from a singular focus on surface runoff to addressing the now-dominant subsurface and baseflow pathways, which together contributed 64.7% of the TDN load in this study. Conventional stormwater management is inadequate for mitigating N export via these slower, persistent routes. Therefore, priority actions must include the systematic inspection and rehabilitation of aging sewer infrastructure and the implementation of green infrastructure, such as riparian buffers and infiltration basins, to enhance N removal in shallow subsurface zones[27]. Further mitigation can be achieved by reducing fertilizer application in urban green spaces and separating combined sewer systems to limit N entry into subsurface pathways.
The primary source of uncertainty within this framework is the variability in C-Q relationships, particularly for DON during high-flow events where greater dispersion was observed. This variability reflects the inherent complexity of hydrological-biogeochemical interactions during storms, where surface-derived organic N exhibits pulsed and non-linear mobilization. Furthermore, intermittent sampling protocols limit our ability to resolve short-term concentration fluctuations within subsurface and baseflow pathways. Despite these limitations—which are pervasive challenges in N export studies[20,24], Monte Carlo simulations confirmed the robustness of our core findings. The relative contributions of each pathway remained stable across uncertainty scenarios, validating the reliability of the framework in identifying dominant transport mechanisms.
More importantly, this study provides novel quantitative evidence for the importance of subsurface flow as a stable N export pathway. This challenges the conventional surface-baseflow dichotomy and establishes its broad relevance for other temperate agricultural and urbanized regions[8]. Future research should therefore focus on integrating high-frequency monitoring to improve the accuracy of C-Q relationships and better capture seasonal dynamics. The use of stable isotope tracing and machine learning models that combine multi-parameter datasets (e.g., temperature, conductivity) will further refine source attribution. The modular design of this framework ensures adaptability across diverse climatic and hydrological settings, providing a robust tool to support N management under increasing anthropogenic pressures.
-
This study applied an integrated framework combining hydrograph separation and End-Member Mixing Analysis (EMMA) to quantify pathway-specific N export across a rural-urban gradient. The results reveal a fundamental difference in N export processes across land uses, challenging conventional management paradigms. In urban environments, subsurface and baseflow pathways dominate N transport due to persistent infrastructure-driven inputs, while surface flow remains critical for event-driven N mobilization in agricultural landscapes. These findings demonstrate the need for differentiated, pathway-specific strategies: urban management must focus on mitigating chronic subsurface N fluxes, while agricultural areas require measures for both runoff and subsurface pathways. By explicitly quantifying the role of subsurface flow as a stable N export pathway, this framework advances current understanding and offers a tool to support more effective N management in human-impacted watersheds.
-
It accompanies this paper at: https://doi.org/10.48130/nc-0025-0006.
-
Not applicable.
-
The authors confirm their contributions to the paper as follows: study conception and design, writing − manuscript revision: all authors; material preparation, data collection and laboratory analysis: Huang X, Yang X, Xia Y; hydrological data processing, statistical modeling: Xie Y, Yang X; the integrated analytical framework development: Huang X (lead), Zhang H (lead), Xia Y (supervision); the geospatial analysis and watershed characterization: Lu N; expertise in biogeochemical processes and nitrogen cycling mechanisms: She D; writing − draft manuscript preparation: Huang X. All authors reviewed the results and approved the final version of the manuscript.
-
The datasets generated during and/or analyzed during the current study are available from the corresponding author upon reasonable request.
-
Financial support for this research was provided by the National Natural Science Foundation of China (42477448, 42430706).
-
The authors declare that they have no conflict of interest.
-
Full list of author information is available at the end of the article.
- Supplementary Table S1 Number of end-member samples (n) and goodness-of-fit (R2) for the Q−C relationships of different flow components across the study watersheds
- Supplementary Table S2 Seasonal nutrient loads during dry season (October−June) and wet season (July−September) across the three study watersheds.
- Supplementary Fig. S1 Soil distribution map of the Qinhuai River watershed.
- Supplementary Fig. S2 Daily simulated concentrations of nitrogen species across the three study watersheds generated using LOADEST models.
- Copyright: © 2025 by the author(s). Published by Maximum Academic Press, Fayetteville, GA. This article is an open access article distributed under Creative Commons Attribution License (CC BY 4.0), visit https://creativecommons.org/licenses/by/4.0/.
-
About this article
Cite this article
Huang X, Yang X, Xie Y, Zhang H, Lu N, et al. 2025. Pathway-specific nitrogen export across a rural-urban gradient: integrating hydrograph separation and end-member mixing analysis. Nitrogen Cycling 1: e006 doi: 10.48130/nc-0025-0006 

Pathway-specific nitrogen export across a rural-urban gradient: integrating hydrograph separation and end-member mixing analysis
- Received: 17 July 2025
- Revised: 02 August 2025
- Accepted: 04 September 2025
- Published online: 17 October 2025
Abstract: Nitrogen (N) export pathways vary significantly across rural-urban gradients due to differences in land use intensity and hydrological processes. However, conventional approaches often assume that hydrological flow separation directly reflects pollutant load partitioning, overlooking that different pathways contribute unequally to N export. This gap limits pathway-specific N management strategies across landscapes with varying human impacts. To address this issue, an integrated framework combining three-component hydrograph separation with End-Member Mixing Analysis (EMMA) was developed, explicitly treating surface flow, subsurface flow, and baseflow as distinct end-members with unique concentration-discharge characteristics. This approach quantifies N loads through each hydrological pathway. This framework was applied to three representative watersheds along a rural-urban gradient in the Qinhuai River Basin, China. Results revealed clear differences in dominant N pathways related to land use. In urban watersheds, baseflow carried the majority of total dissolved N (42.9%), and ammonium (46.4%). In traditional agricultural areas, nitrate export was dominated by baseflow (50.2%), while surface flow contributed most to dissolved organic nitrogen (42.9%). Intensive agricultural watersheds exhibited more complex patterns, with ammonium export shifting from baseflow dominance in urban areas to surface flow (43.3%). Subsurface flow contributed consistently across all land uses (21.8%–30.1%). Seasonal variation further showed transitions from baseflow dominance during dry periods to surface flow dominance during wet seasons. These findings demonstrate the need for N management strategies that explicitly consider hydrological pathways and their variability across rural-urban gradients and hydrological seasons, rather than relying solely on pollutant sources or total flow.