-
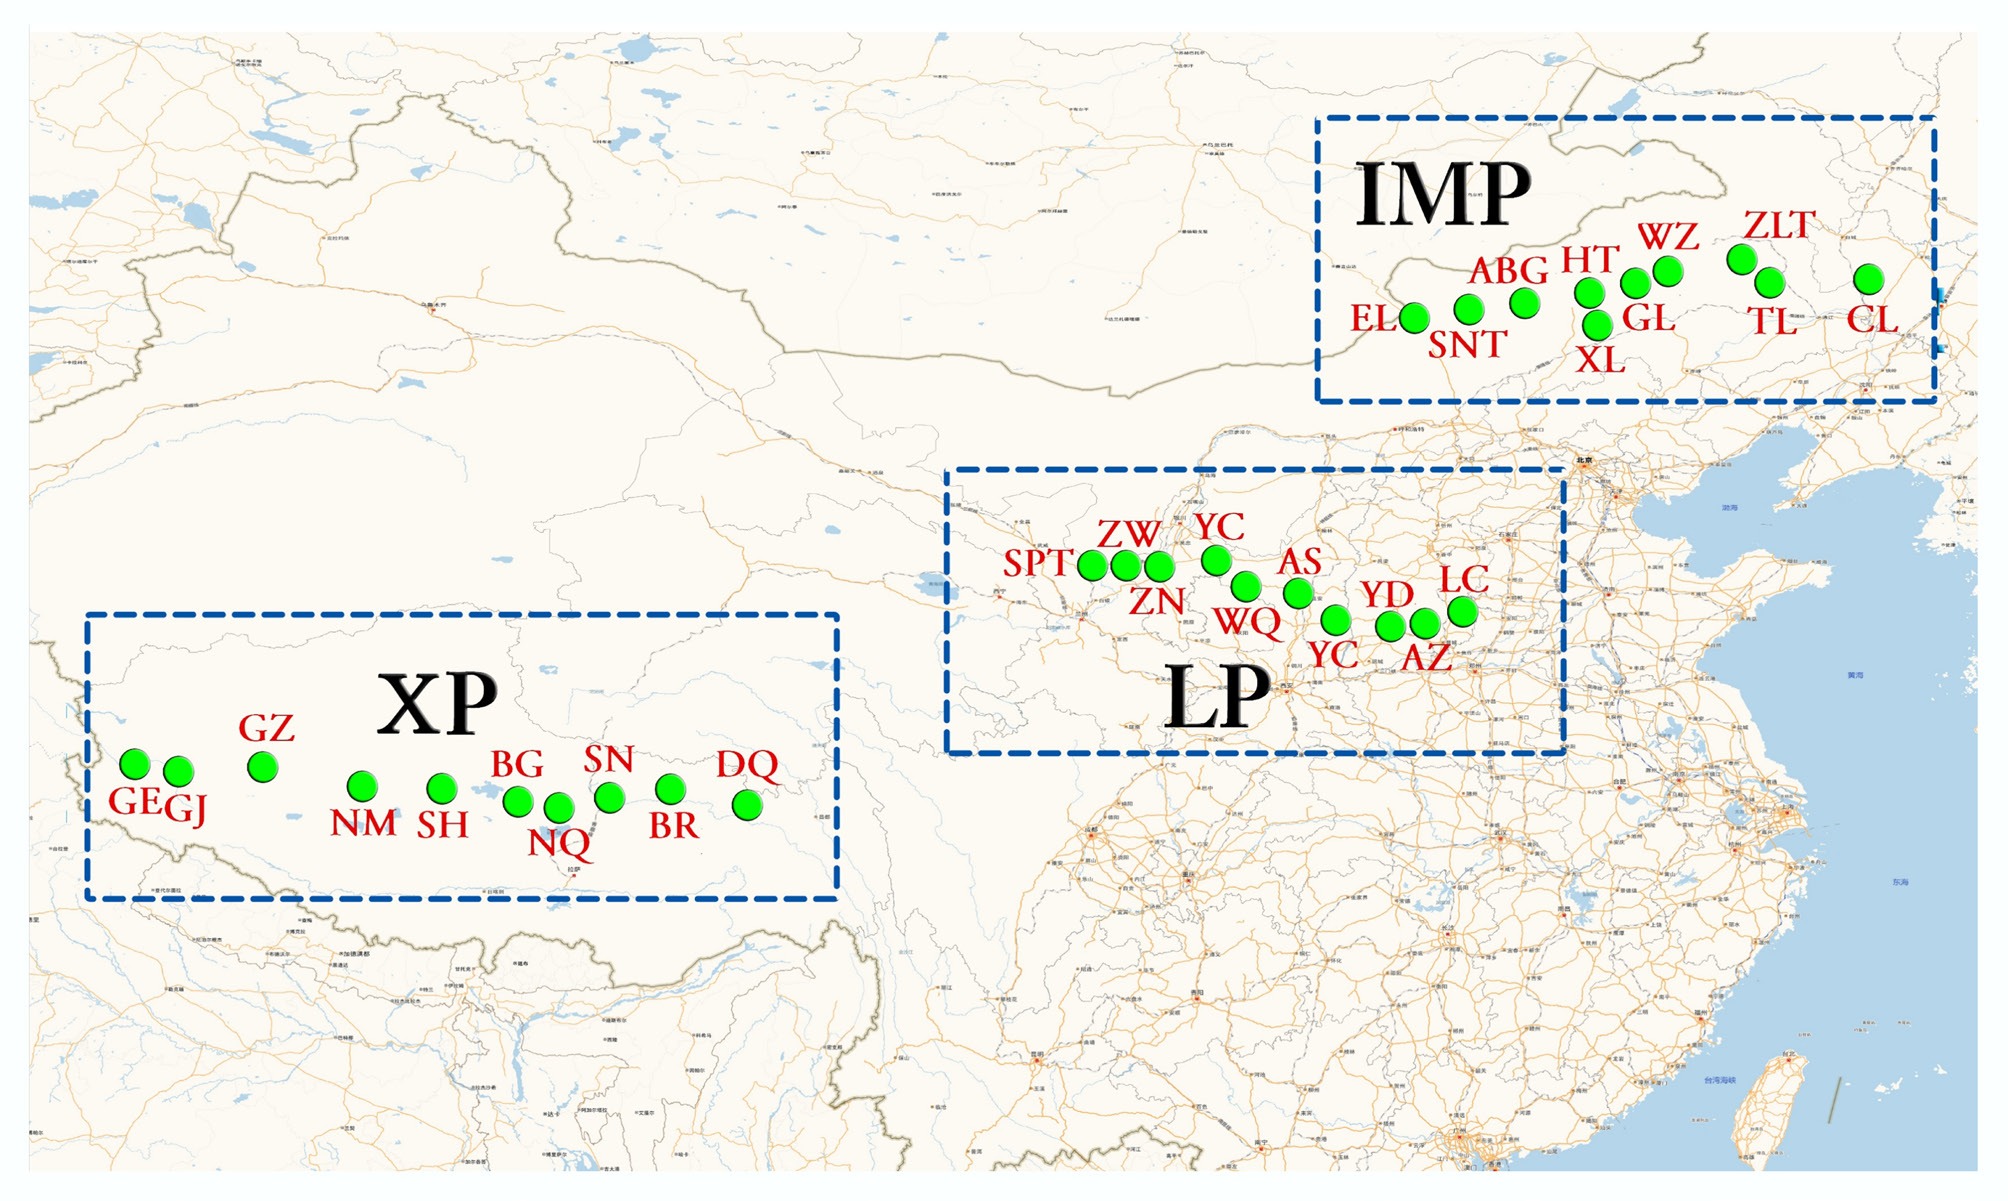
Figure 1.
Sampling sites distributed in LP, IMP, and TP steppe soils of China. The full site names of the abbreviated sample sites are listed in Table 1. LP, Loess Plateau; IMP, Inner Mongolia Plateau; XP, Xizang Plateau.
-
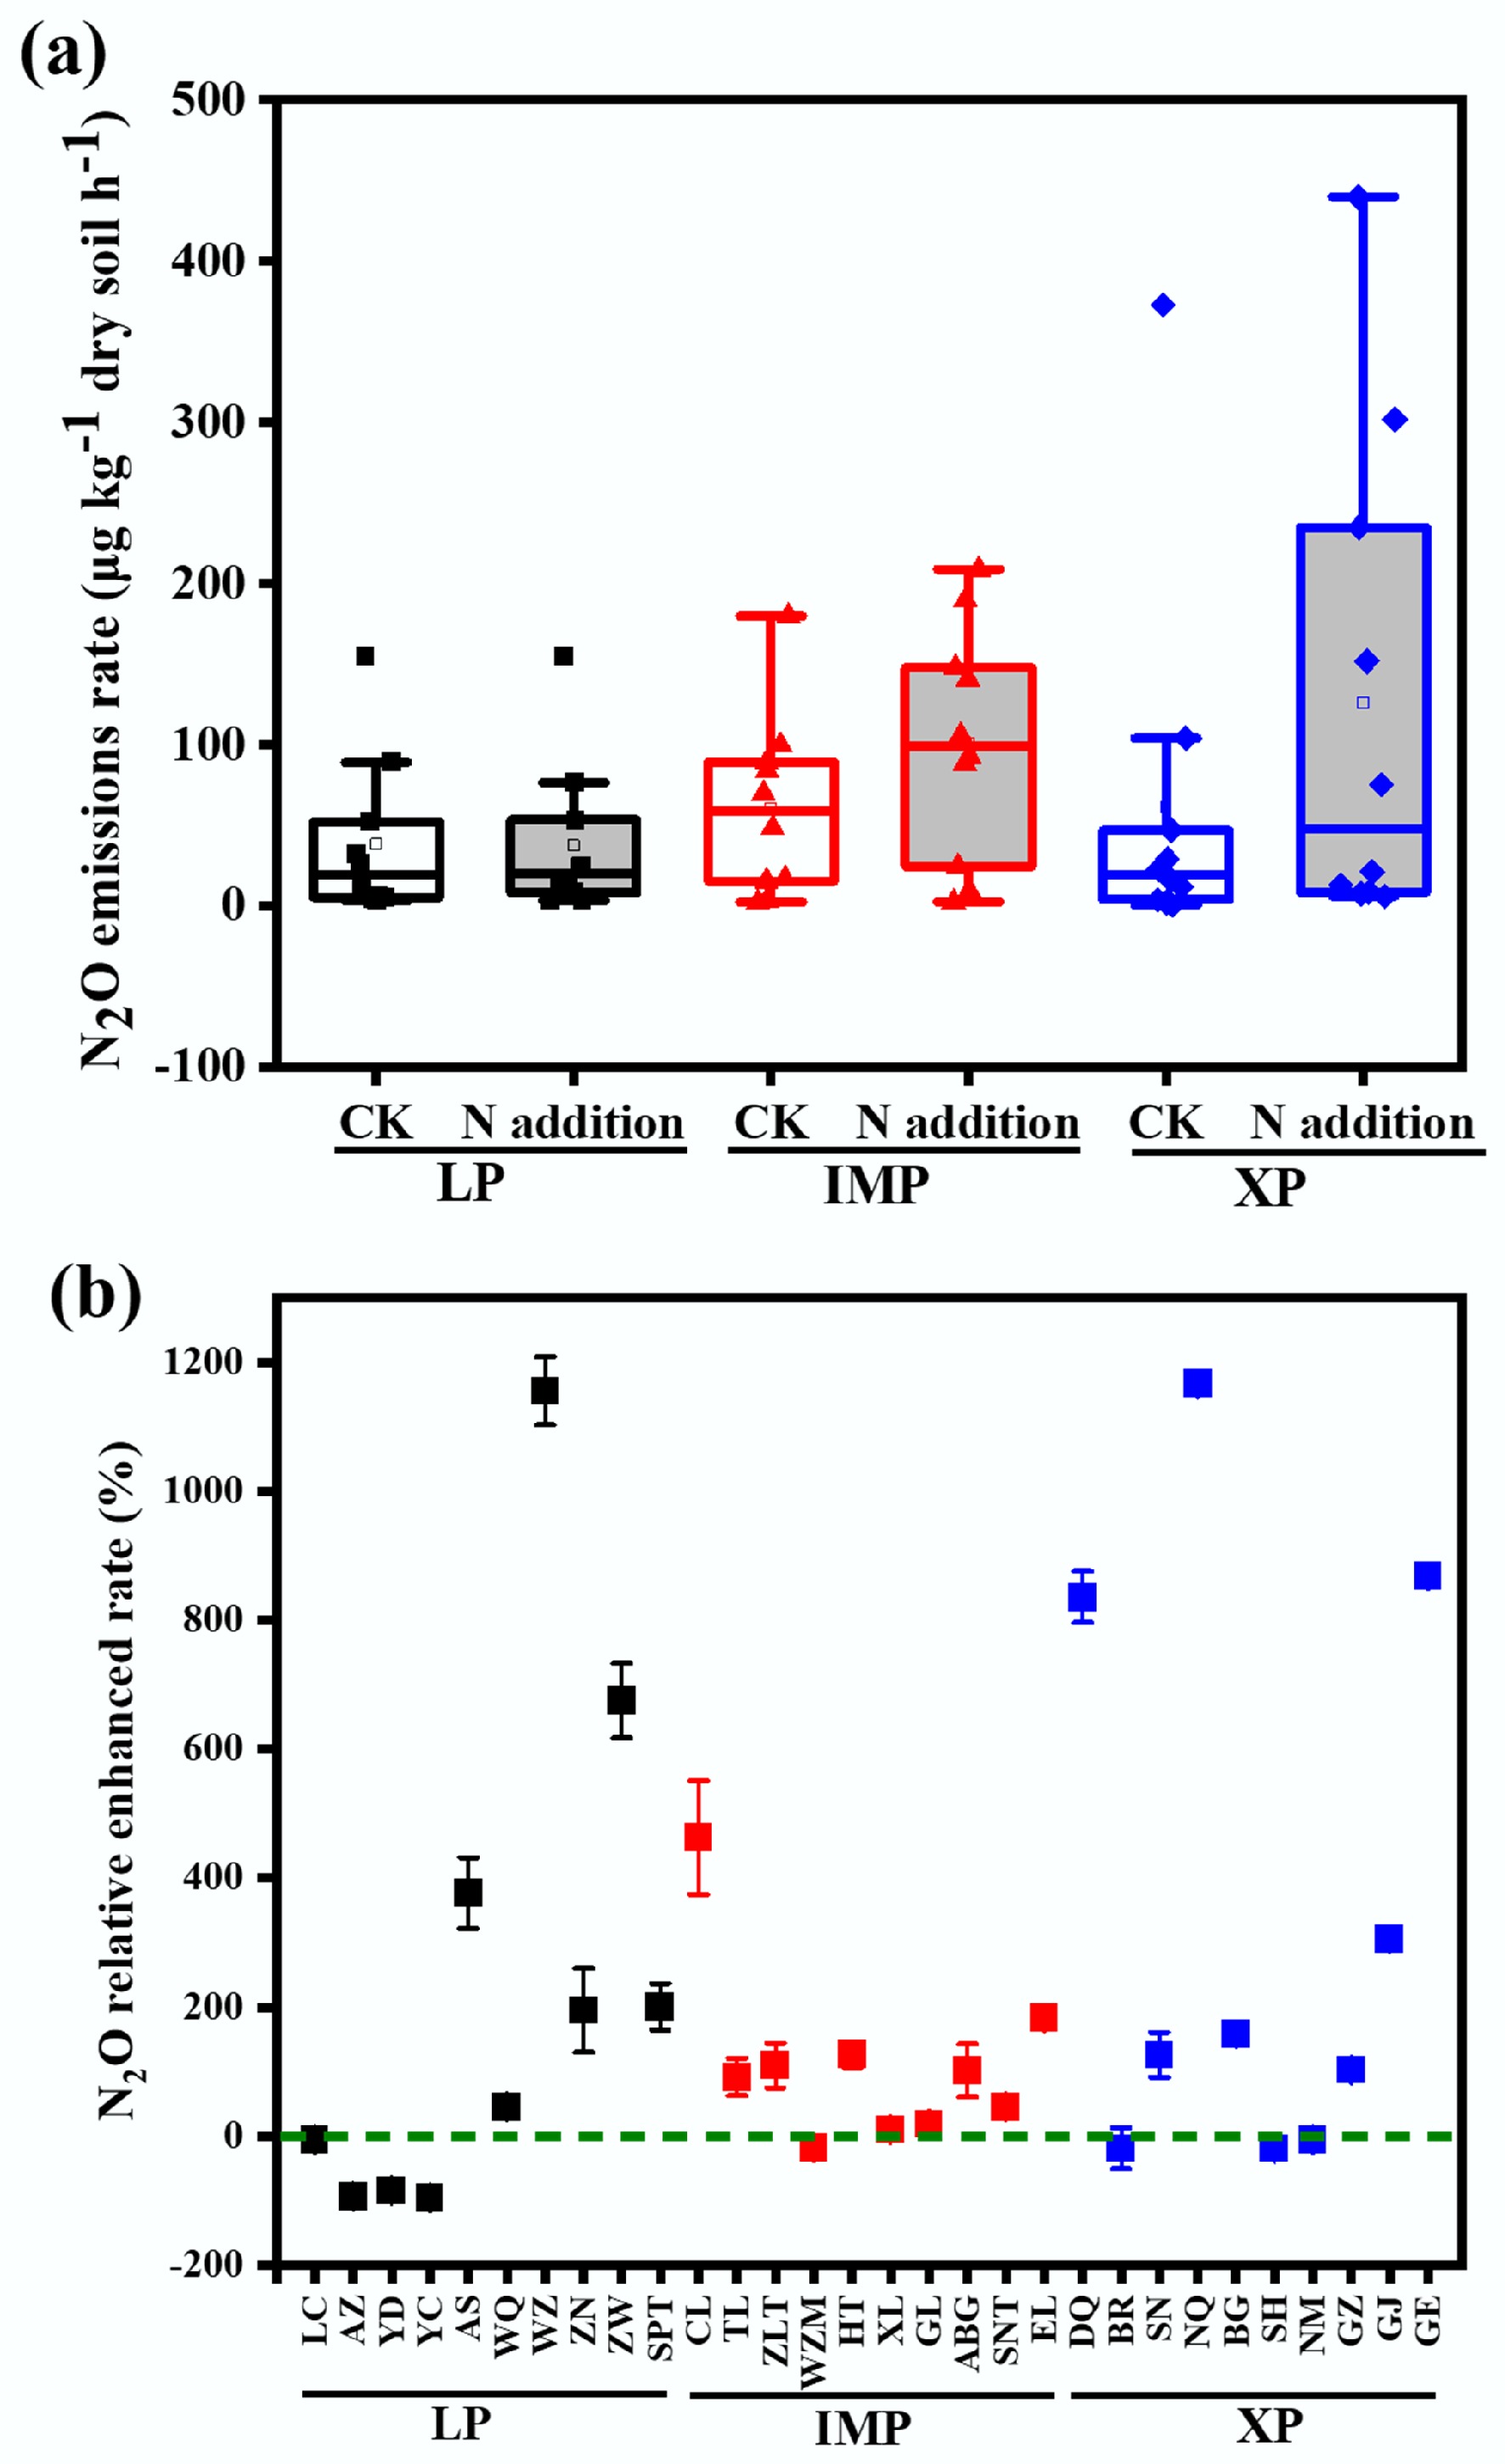
Figure 2.
(a) N2O emission rates of steppe soils at different sites for the Loess Plateau (LP), Inner Mongolia Plateau (IMP), and Xizang Plateau (XP) steppes without and with N addition, and (b) the relative enhancement of emission rates after N addition, compared to the scenario without N addition. The concentration of N addition is 10 kg N ha−1.
-
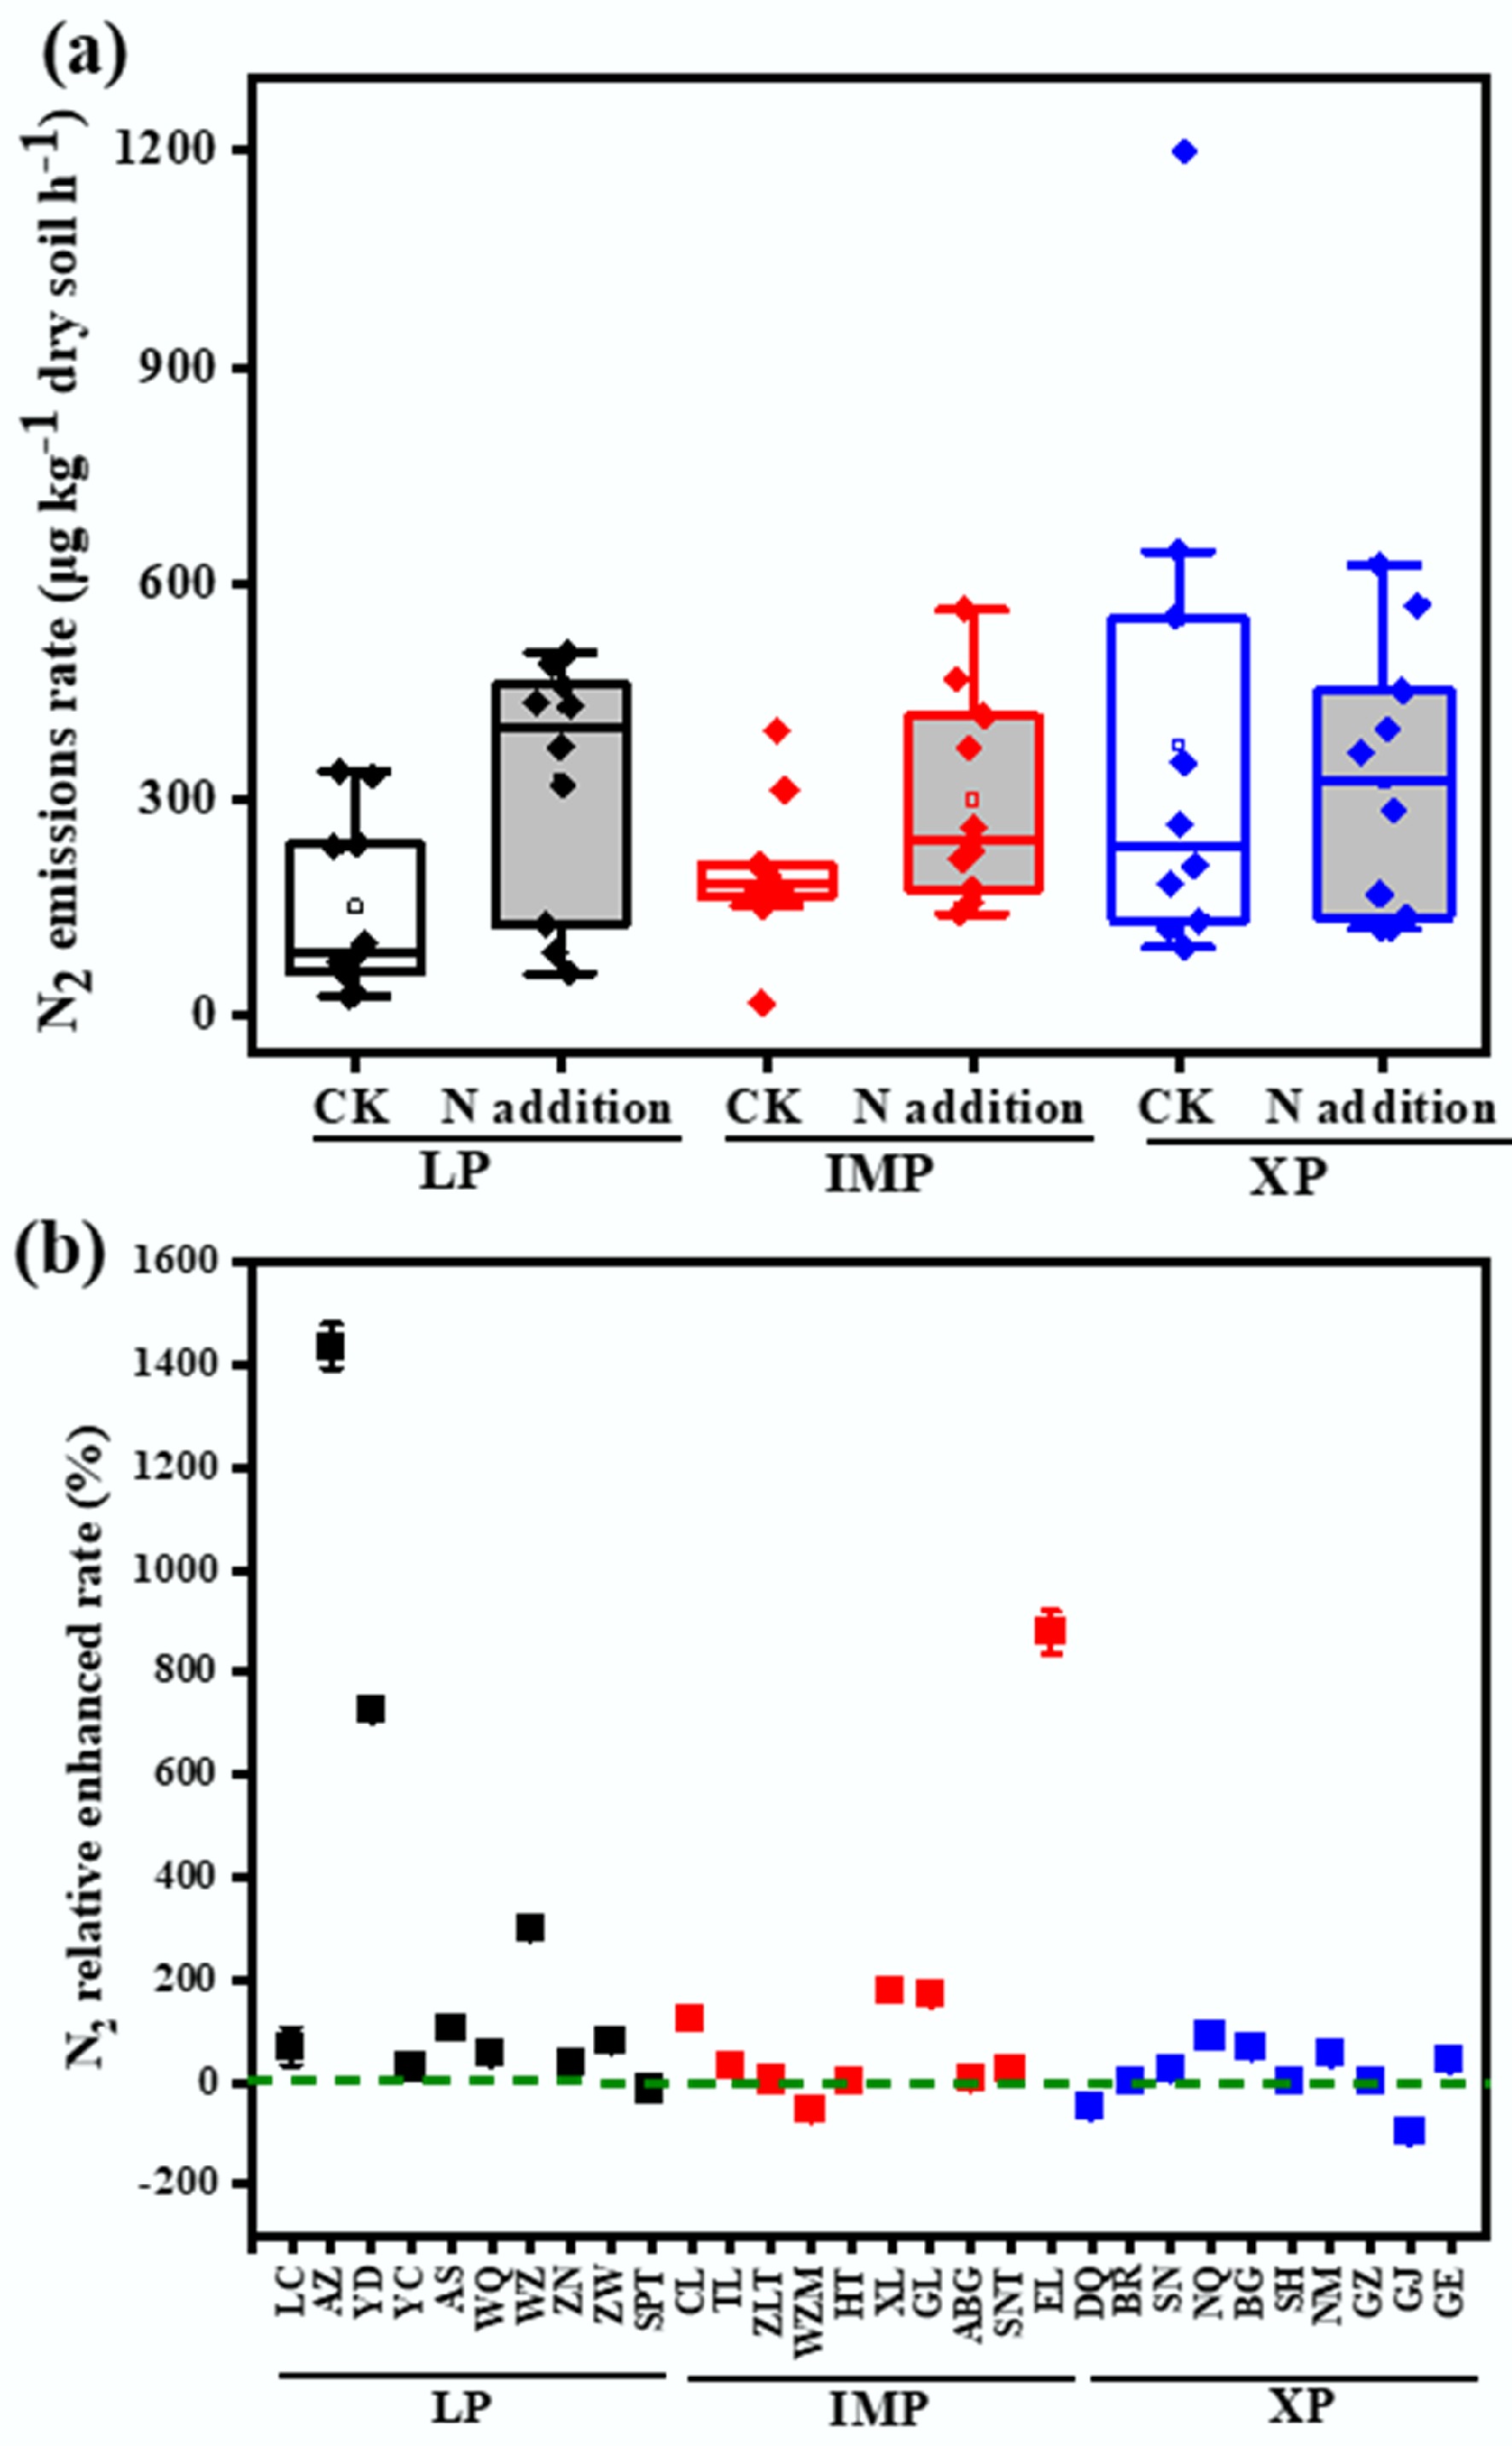
Figure 3.
N2 emission rates of steppe soils at different sites: (a) without (CK), and (b) with N addition (N-addition), and the relative enhancement in N2 emission rates after N addition compared to the scenario without N addition (right y axis in plane (b)). Loess Plateau (LP), Inner Mongolia Plateau (IMP) and Xizang Plateau (XP) steppes. The concentration of N addition is 10 kg N ha−1.
-
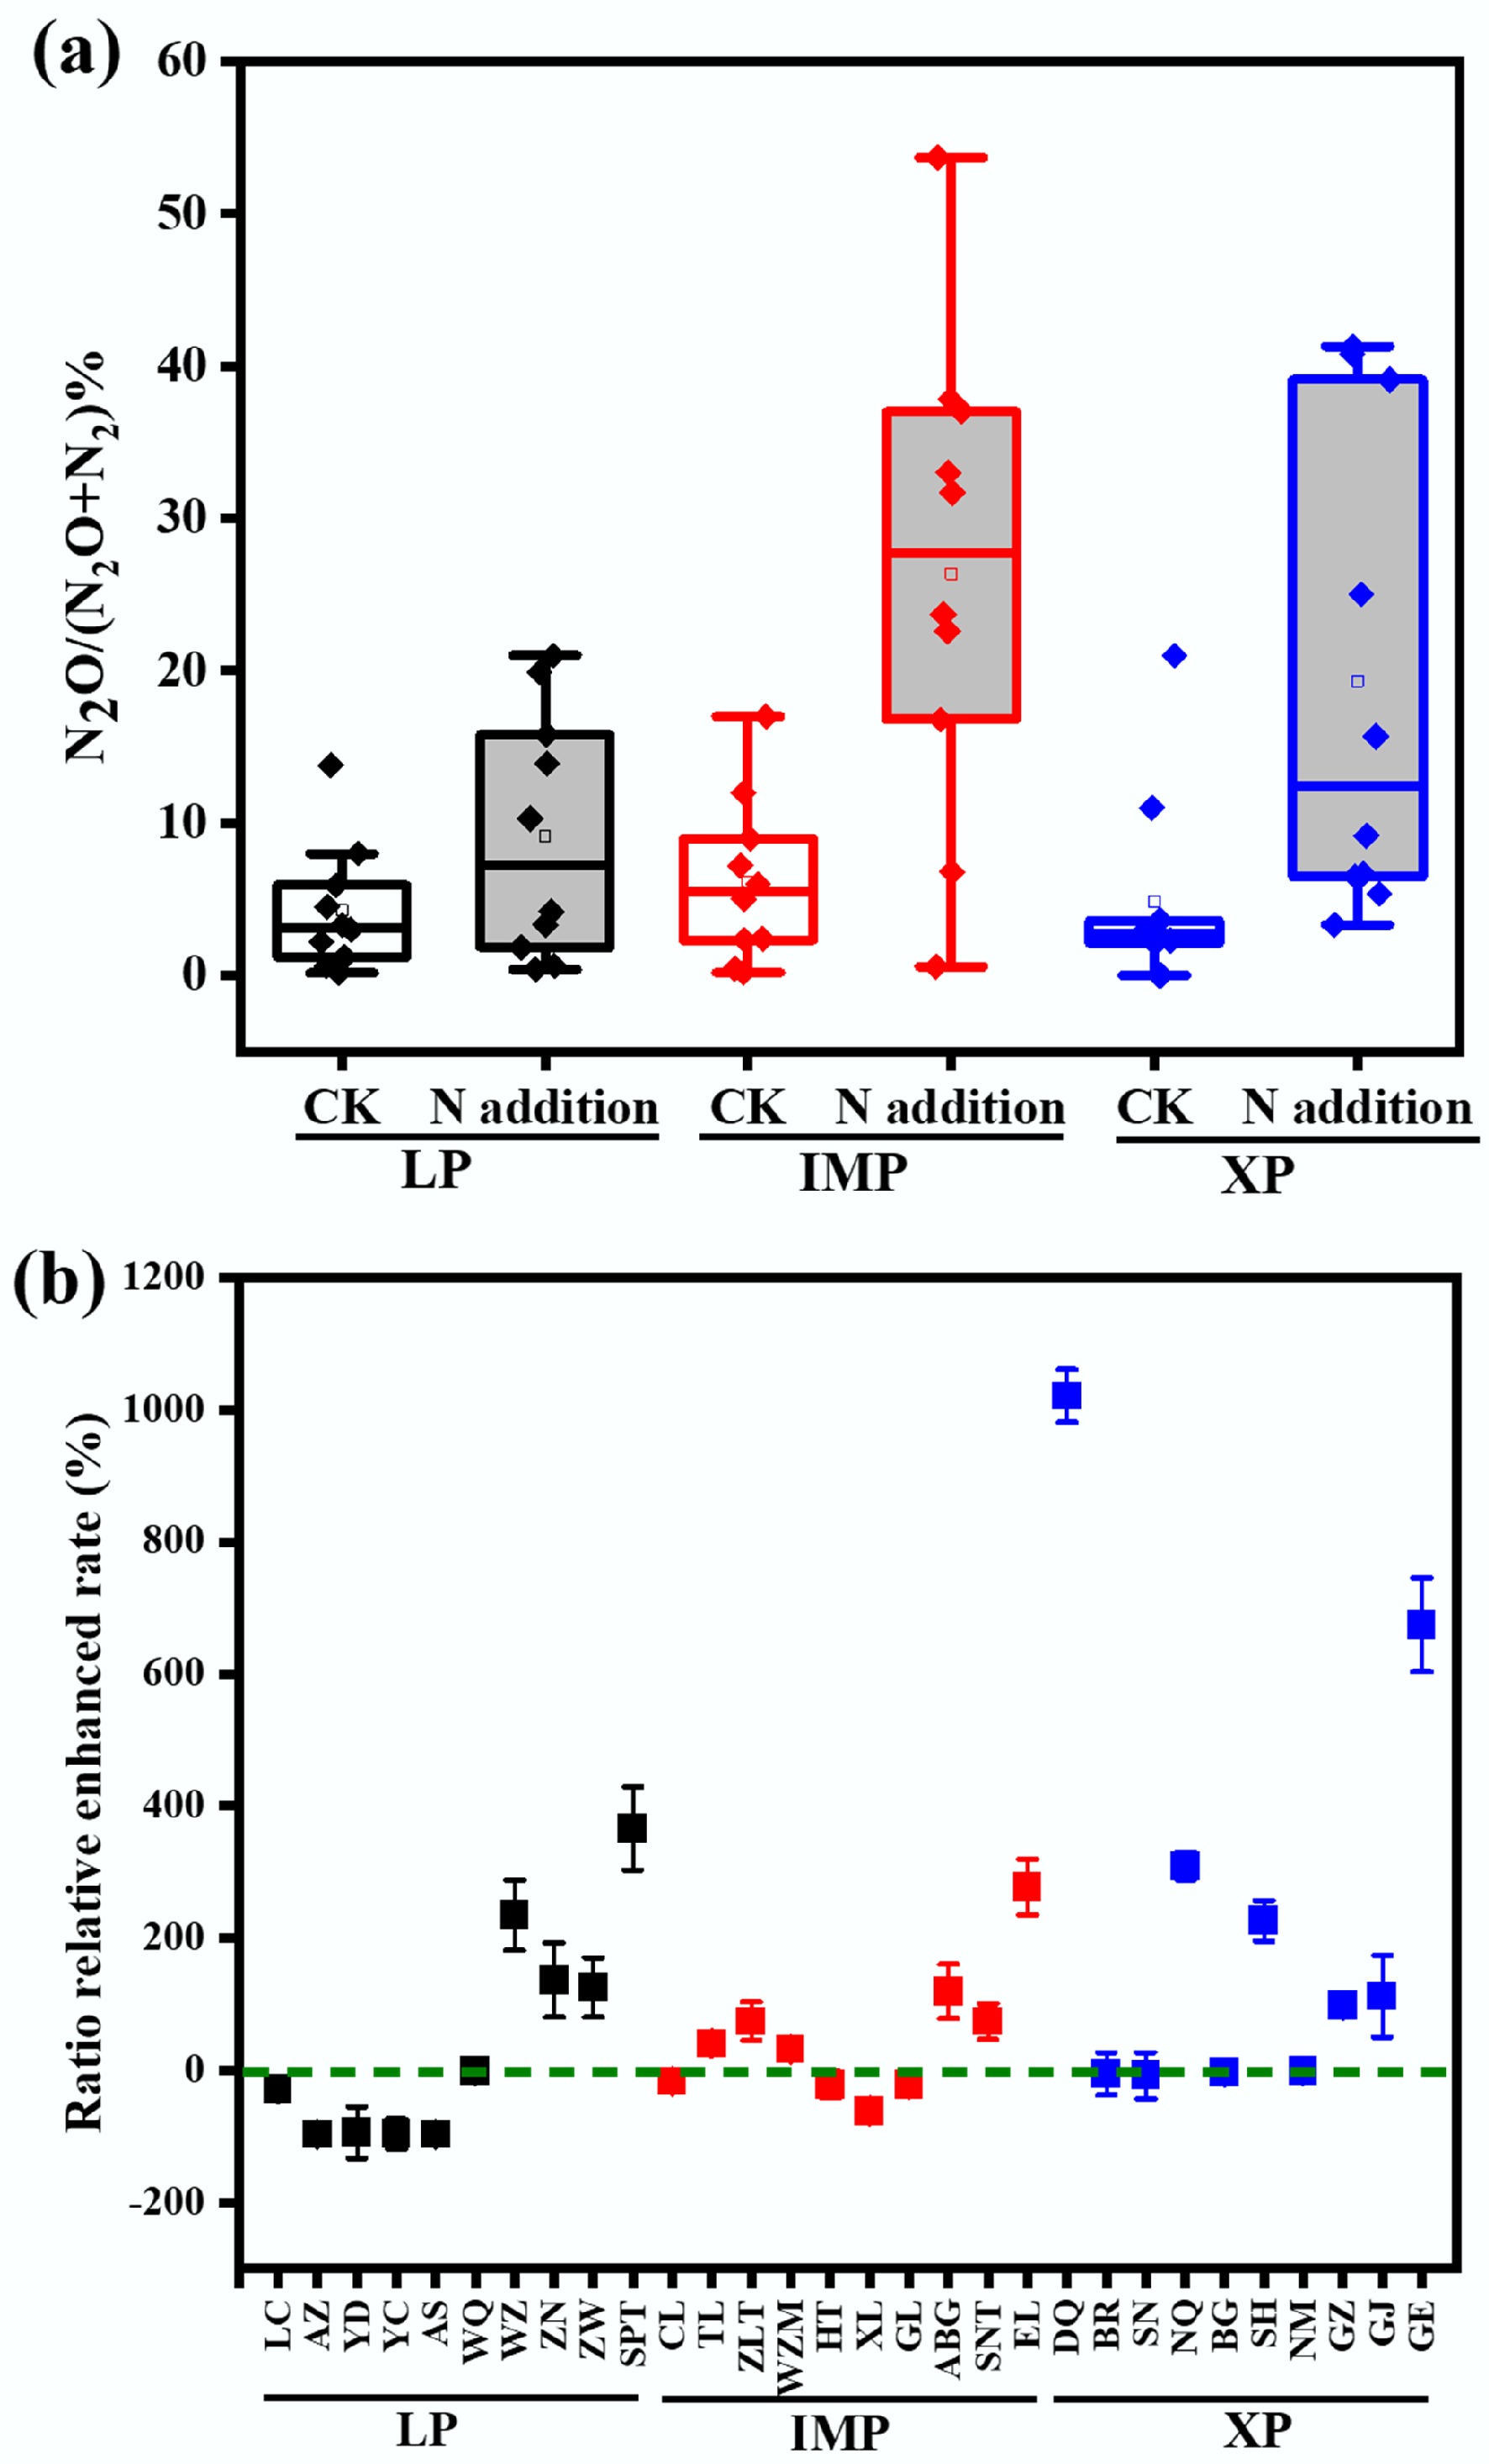
Figure 4.
Ratio of N2O/(N2O + N2) at different sites for the Loess Plateau (LP), Inner Mongolia Plateau (IMP), and Xizang Plateau (XP) steppes: (a) without (CK) and (b) with N addition (N-addition), and the relative enhancement in ratios after N addition compared to the scenario without N addition (right y axis in plane (b)). The concentration of N addition is 10 kg N ha−1.
-
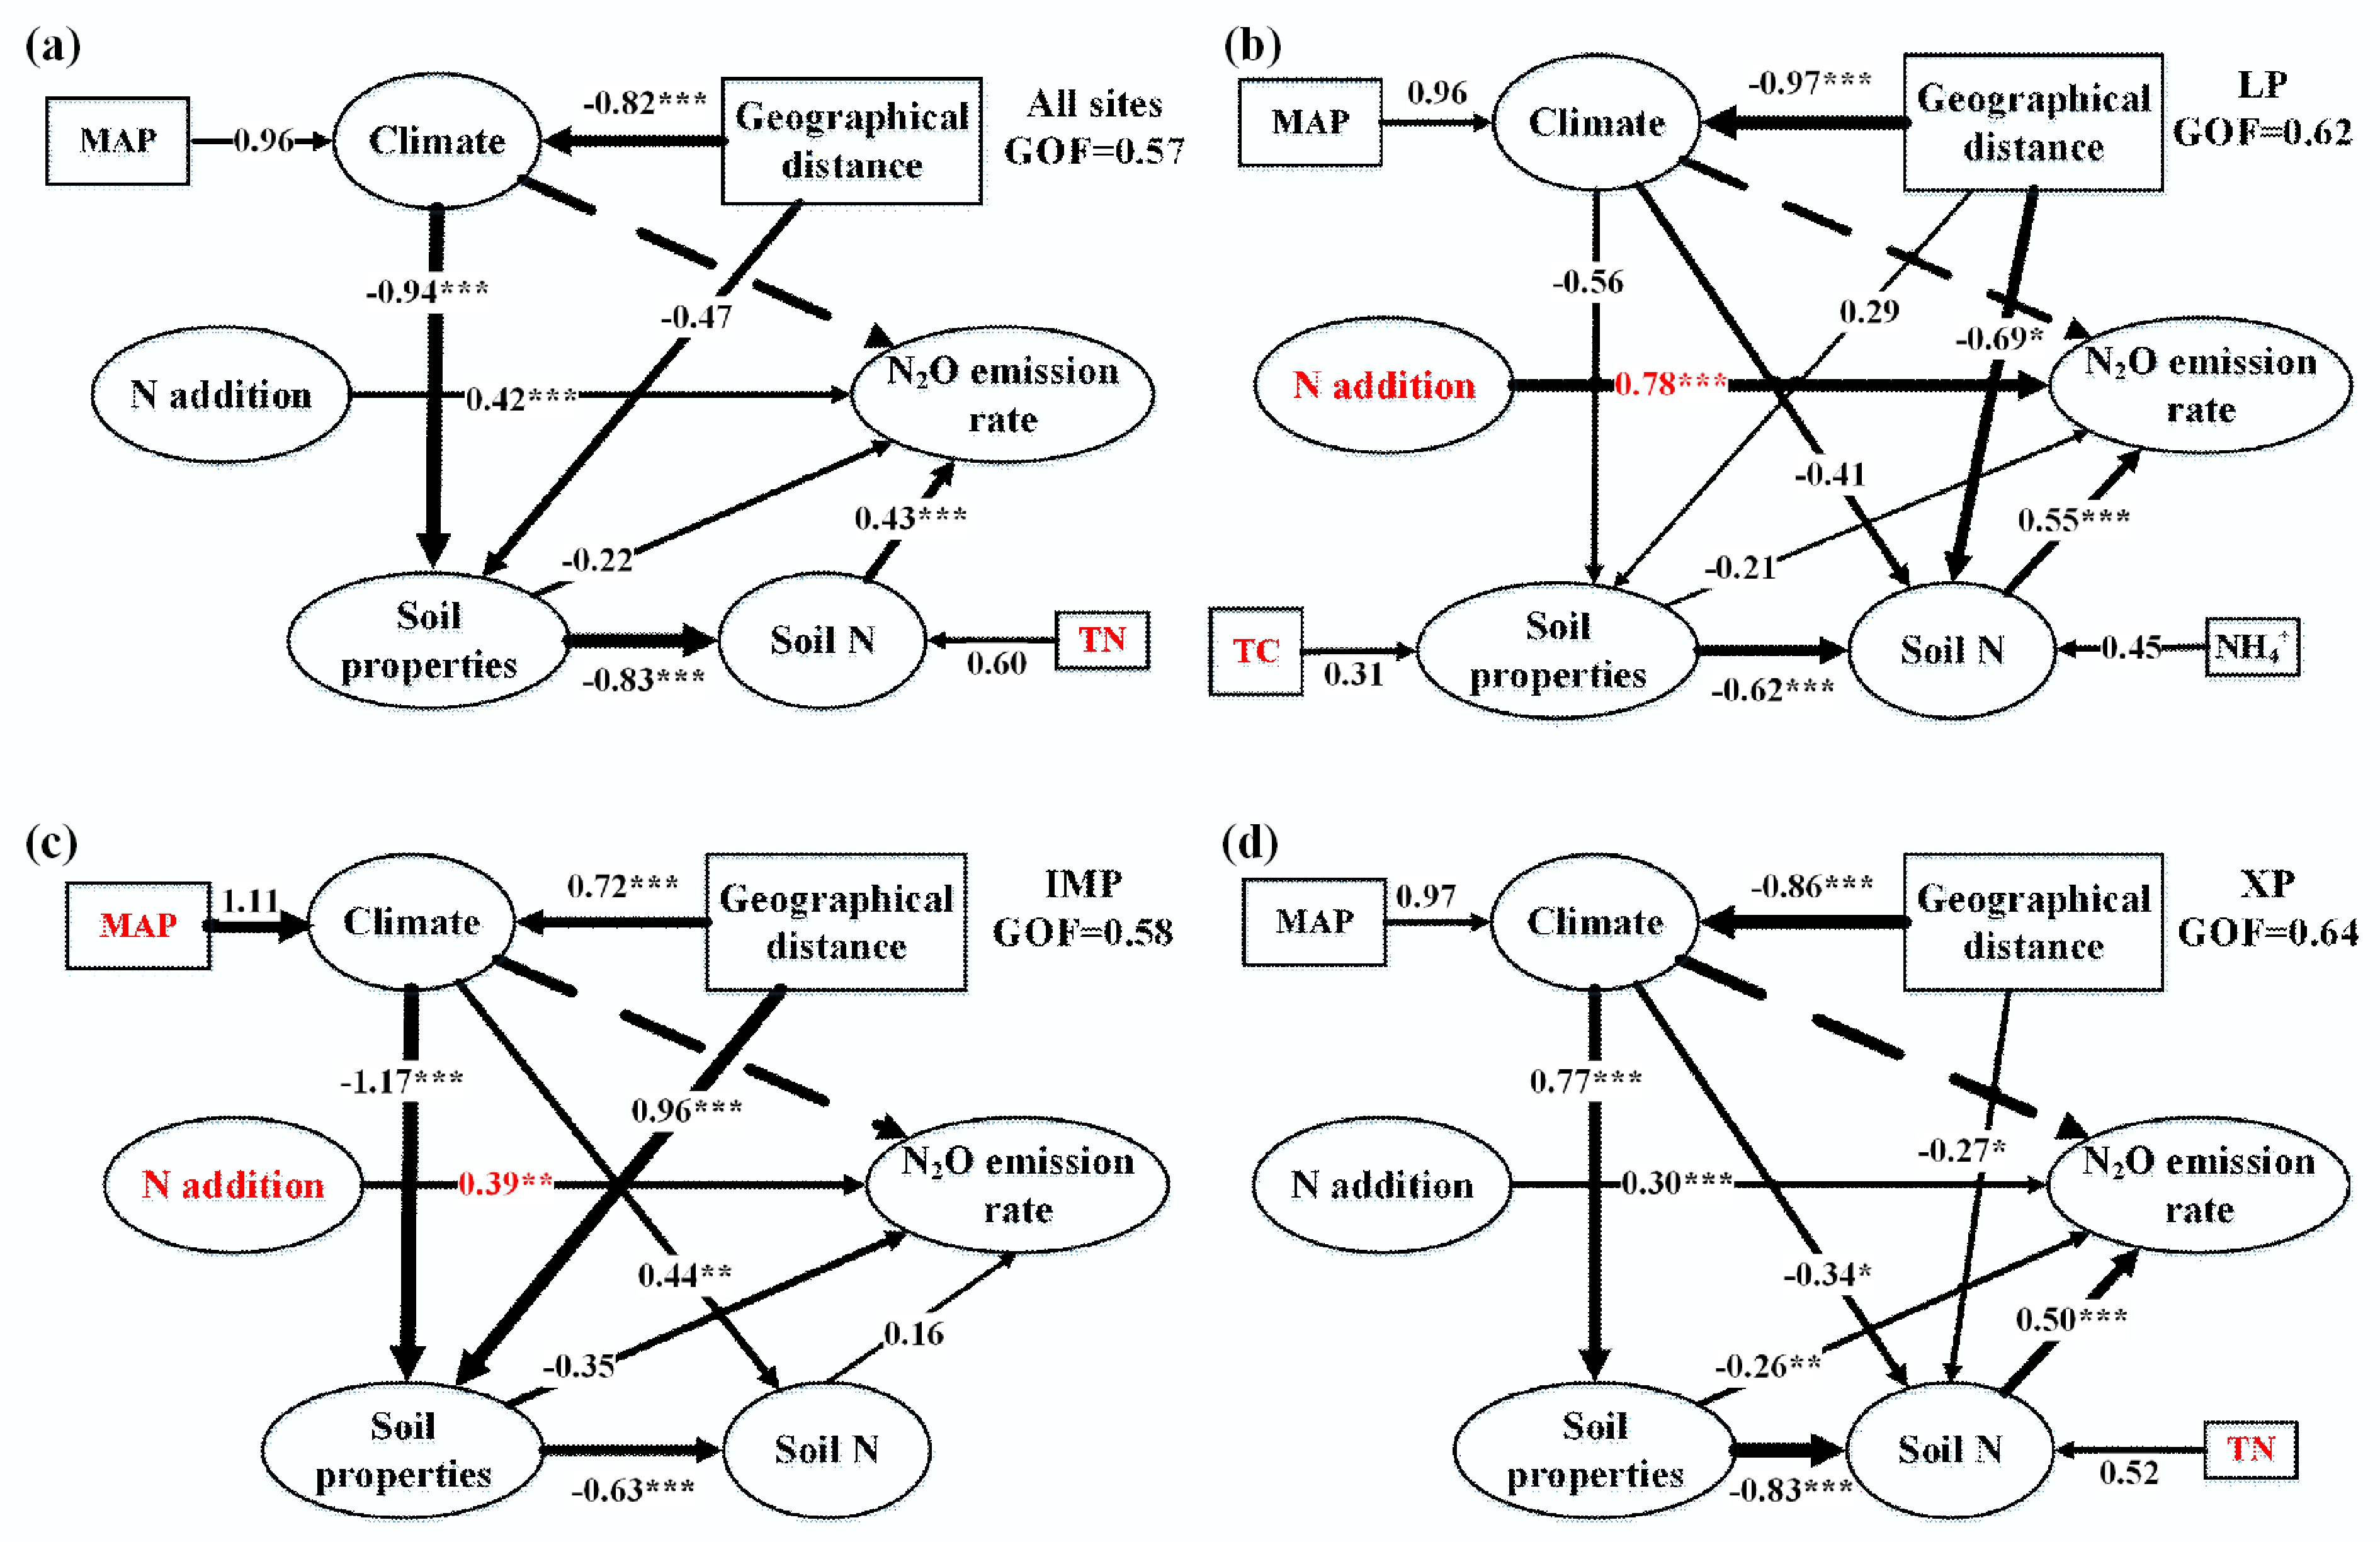
Figure 5.
Path analysis diagrams for N2O emission rate in all sampling sites on (a) regional scale, and sub-regional scale (b) LP, (c) IMP, and (d) XP. LP, Loess Plateau; IMP, Inner Mongolia Plateau; XP, Xizang Plateau; TN, total nitrogen; MAP, mean annual precipitation; TOC, total organic carbon; NH4+- NH4+–N. Standardized coefficients are shown in Supplementary Fig. S1. Full lines and broken lines indicate that the path coefficients between latent variables are significant and not significant, respectively.
-

Figure 6.
Path analysis diagrams for N2O reduction rate in all sampling sites on (a) regional scale, and sub-regional scale (b) LP, (c) IMP, and (d) XP. LP, Loess Plateau; IMP, Inner Mongolia Plateau; XP, Xizang Plateau; TN, total nitrogen; MAP, mean annual precipitation; MAT, mean annual temperature; TOC, total organic carbon; TC, total carbon. Standardized coefficient is showed in Supplementary Fig. S2. Full lines and broken lines indicate that the path coefficients between latent variables are significant, and not significant, respectively.
-

Figure 7.
Path analysis diagrams for N2O/(N2O + N2) rate ratio in all sampling sites on (a) regional scale, and sub-regional scale (b) LP, (c) IMP, and (d) XP. LP, Loess Plateau; IMP, Inner Mongolia Plateau; XP, Xizang Plateau; TN, total nitrogen; MAP, mean annual precipitation; TOC, total organic carbon; DN, Dissolved nitrogen; MAT, mean annual temperature. Standardized coefficient is shown in Supplementary Fig. S3. Full lines and broken lines indicate that the path coefficients between latent variables are significant, and not significant, respectively.
-
All LP IMP XP Altitude 0.007 0.218 −0.033 −0.016 MAT −0.259** −0.157 −0.07 −0.136 MAP 0.313** −0.362** 0.340* 0.894** pH −0.450** 0.360* −0.392** −0.648** Moisture −0.001 −0.576** 0.454** 0.486** EC 0.047 0.376** −0.106 0.12 Bulk density −0.231** −0.113 −0.484** −0.548** TOC 0.491** −0.269 0.601** 0.808** TC 0.306** −0.155 0.556** 0.818** TN 0.512** −0.367** 0.536** 0.900** TP −0.076 −0.175 0.365** 0.137 TK 0.029 0.049 −0.423** −0.359* C/N −0.237** 0.481** 0.455** −0.23 DOC 0.274** −0.266 0.183 0.893** DC 0.027 −0.162 −0.013 0.749** DIC −0.404** 0.227 −0.271 −0.335* NO2− −0.247** −0.223 −0.033 −0.436** NH4+ 0.526** 0.411** 0.148 0.791** NO3− 0.075 −0.397** 0.361* 0.134 DN 0.240** −0.378** 0.361* 0.469** N addition 0.611** 0.613** 0.522** 0.461** Table 1.
The relationships between N2O emission rate and environmental factors on a regional (all sites), and sub-regional scale (LP, IMP, and XP) evaluated by Spearman correlation analysis
-
Sites Explanatory variable Standardization coefficient p Full model (Adj. R2) All TN 0.538 0.000 0.81 N addition 0.373 0.000 Geographical distance 0.207 0.000 MAP 0.208 0.001 LP N addition 0.894 0.000 0.71 TC 0.55 0.000 NO3−–N −0.307 0.002 NH4+–N 0.202 0.045 IMP MAP 0.413 0.000 0.59 N addition 0.366 0.001 TP −0.385 0.008 XP TN 0.618 0.000 0.62 N addition 0.268 0.000 MAP 0.186 0.029 Table 2.
The roles of all factors (including geographical distance, environmental variables, and N-addition) on the ratio of N2O emission rate evaluated by stepwise multiple regression modeling on a regional (all regions), and sub-regional scale (LP, IMP, and XP)
Figures
(7)
Tables
(2)