


-
Nitrous oxide (N2O) is a long-lived greenhouse gas that has a global warming potential of 298 times greater than that of CO2 over a 100-year period[1,2], and is the primary contributor to stratospheric ozone depletion[2]. Atmospheric concentrations of N2O have increased since pre-industrial times due to anthropogenic activities, with terrestrial ecosystems serving as the primary source of N2O emissions, derived via denitrification[3,4].
Grasslands comprise approximately 20% of the Earth's terrestrial surface[5,6]. The Eurasian steppe is the largest steppe region in the world, covering an area of about 150 million hectares, and is an important part of the global grassland ecosystem. The North Chinese steppes are located in the central part of the Eurasian steppe, include the Loess Plateau (LP) steppe, the Inner Mongolian Plateau (IMP) steppe, and the Xizang Plateau (XP) steppe. The estimated total annual N2O emissions from temperate grassland ecosystems in China amount to 112.13 Gg N yr−1[7]. Nitrous oxide emissions derived from soil denitrification are a significant contributor to global N2O emissions, and these emissions may, in turn, be affected by changes in climate.
Previous research on denitrification rates within grassland soils has mostly focused on N2O emissions influenced by grazing, climatic factors, microorganisms, and fertilization[8−11]. Grazing has been shown to increase total N2O emissions by up to 68%, relative to ungrazed soil[10]. On the contrary, Zhong et al.[12] found that as grazing intensity increased, there was a significant reduction in the potential rate of denitrification. Fluxes of N2O from grassland steppe soils have been shown to be positively correlated with soil water-filled pore space (WFPS), soil temperature, dissolved organic carbon (DOC), and soil NO3−–N concentration[11,13]. Moreover, grassland steppe soil denitrification potentials were able to be explained by microbial factors, like nirS gene expression level, and nitrifier/denitrifier abundances[11]. The application of nitrogen fertilizers is a crucial management strategy in grassland ecosystems[14], and it contributes significantly to the denitrification rate[15]. In addition to the aforementioned factors, nitrogen input or deposition is also closely associated with denitrification potential in grassland soils. Based on the assessment in 2000, the N deposition rates in most parts of the world are greater than 10 kg N ha−1 yr−1, and showed an increasing trend. By 2030, the rate of N deposition is projected to exceed 15 kg N ha−1 yr−1 in most areas of the world, including the Xizang Plateau steppe[16]. Geng et al.[17] demonstrated that the potential of denitrification in an alpine grassland steppe was significantly enhanced by high levels of nitrogen input (≥ 30 kg N ha−1 yr−1).
Regional climate, including mean annual precipitation (MAP), and mean annual temperature (MAT), also significantly affects the N2O emissions of grassland soil. A meta-analysis showed that annual N2O fluxes ranged from −0.33 to 2.14 kg N2O–N ha−1 yr−1, of which their spatial distribution across ecosystems were mainly reflected by MAP and warming over the XP region[18]. The intra- and inter-annual variations in N2O emissions were mainly triggered by temporal dynamics of soil temperature and moisture conditions[19]. A soil laboratory experiment, sampled at the Inner Mongolia grasslands, revealed that N2O fluxes were significantly correlated with soil temperature[20].
Global grasslands potentially contribute 30% of total N2O flux to the atmosphere. N2O mainly originates from microbial denitrification processes[21]. The end-product of denitrification is dinitrogen (N2), which results from the reduction of soil N2O. However, to date, most research on denitrification in steppe soils has focused solely on N2O emissions and has not considered N2 emissions. Currently, the majority of research on denitrification rates from steppe soils has been performed on the Inner Mongolian or Xizang Plateau soils. However, it is worth noting that there is heterogeneity in denitrification responses across different steppe types. Previous studies have found that the typical steppe may hold the lowest N2O emission[22]. Thus, to gain a deeper understanding of the soil denitrification potential (N2O and N2 emissions) within steppe ecosystems, a mesocosm experiment was performed using soils taken from three sites within the Eurasian steppe: Xizang Plateau, Loess Plateau, and the Inner Mongolian Plateau. Environmental variables influencing denitrification potential were also investigated, taking into account the variations in geography, climate, and soil physicochemical properties among sampling sites. Additionally, the study examined nitrogen addition as a crucial factor affecting grassland soil denitrification potential.
-
The three steppe sites were located in China on the Loess Plateau (LP), the Inner Mongolia Plateau (IMP), and the Xizang Plateau (XP), respectively (Fig. 1). The LP steppe is situated in a climatic zone characterized by semi-aridity and semi-humidity[23]. The sampling site spans from 35.99° N to 37.58° N, and from 104.44° E to 113.36° E, with an elevation range of 804–1,714 m. Mean annual temperature (MAT) ranges from 7.7 to 11.3 °C, while mean annual precipitation (MAP) varies between 188 and 599 mm. The grassland types present include meadow grassland, typical grassland, and desert grassland. The main representative plants in this study area include white grass, Lespedeza japonicum, and artemisia annua. Soil types found in this steppe region include brown, black, and gray calcium soils, as based on the FAO classification system[24]. The IMP steppe is situated in a mid-temperate monsoon climate that is semi-arid and humid. The sampling site spans from 43.55° N to 45.11° N, and from 112.15° E to 123.51° E, with an extensive altitude range of 144 to 1,272 m. MAT varies between 1.0 and 6.7 °C, while MAP ranges from 183 to 425 mm. The grassland types encompass meadow grassland, typical grassland, and desert grassland, and the surface vegetation is mainly reed and setaria ephedra. The IMP soils are categorized as chernozem, chestnut, and brown soils, according to the FAO classification system[24]. The XP steppe is situated in a plateau mountain climate, with sampling sites ranging from 31.38° N to 32.48° N and between 80.15° E to 95.45° E at altitudes of 4,104 to 4,617 m. The MAT varies from −0.3 to 0.9 °C, while the MAP ranges from 75 to 606 mm annually. Grassland types include alpine meadow grassland, alpine grassland, and alpine desert grassland. Representative plants include Stegwoet, Kobresia, and Mountain Velingia. All soil types are classified as alpine soil according to the FAO system[24]. Sampling site locations are shown in Fig. 1.
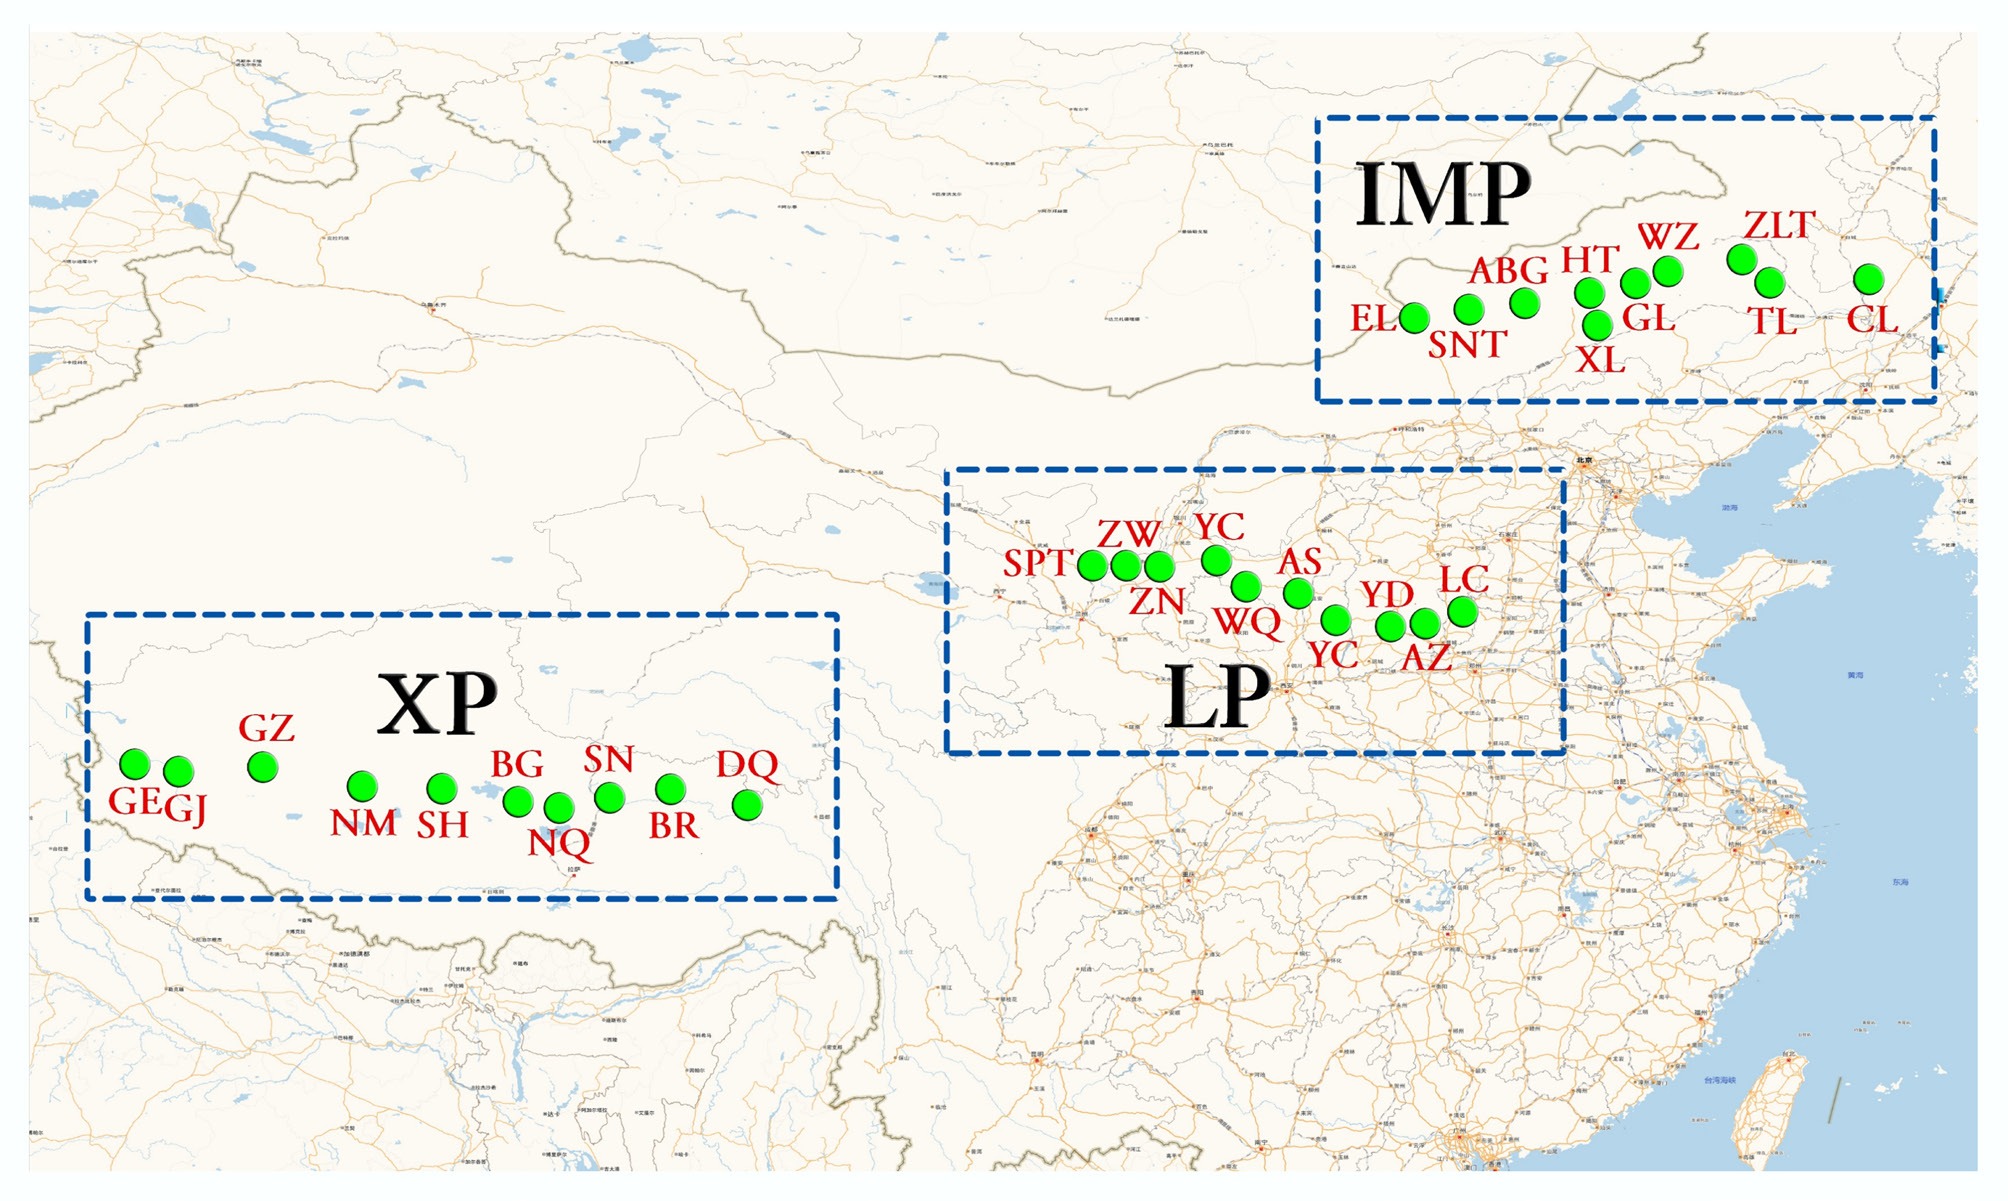
Figure 1.
Sampling sites distributed in LP, IMP, and TP steppe soils of China. The full site names of the abbreviated sample sites are listed in Table 1. LP, Loess Plateau; IMP, Inner Mongolia Plateau; XP, Xizang Plateau.
Soil samples were collected from 10 sites in each steppe in the growing season from July to August 2018. Ten sampling sites that were not subject to human disturbance were set up in each transect. Each steppe area comprised three meadow regions, four typical regions, and three desert regions, totaling 30 sampling sites. These sites had minimal human or cattle disturbances: five plots were selected at each site, with a distance of 100 m between each site. In each 1 m × 1 m plot, a composite sample was created by pooling together five soil cores (10 cm deep and 5 cm in diameter). Thus, a total of 150 soil samples were collected from three steppes at 30 different sites. Soil samples were placed in sterile plastic bags, surrounded by ice packs, and transported to the laboratory as soon as possible. The soil samples were passed through a 2.0 mm mesh and subsequently stored at 4 °C for the determination of soil physiochemical properties, denitrification potential (N2O and N2 emissions), and nitrogen addition experiments.
Measurement method
-
Soil nitrate (NO3−–N), nitrite (NO2−–N), ammonium (NH4+–N), and dissolved organic carbon (DOC) were extracted using 1 M KCl solution with a soil/water weight ratio of 1/5. The concentrations of NO3−–N, NO2−–N, and NH4+–N were determined by dual-wavelength spectrophotometry, the ethylenediamine dihydrochloride colorimetry method, and the indophenol blue colorimetry method, respectively[25−27]. The concentrations of DOC, dissolved inorganic carbon (DIC), and total inorganic carbon (TIC) were determined using a TOC analyzer (TOC-L CPH, Shimadzu, Japan). The water content was measured gravimetrically using the constant weight drying method.
Methods to determine the pH, electrical conductivity (EC), total nitrogen (TN), total phosphorus (TP), total potassium (TK), total carbon (TC), total organic carbon (TOC) of soil, MAT, and the MAP are described in detail by Xu et al.[24]. Briefly, soil pH was determined in a 1:2.5 (w/v) soil water suspension using the Ultrameter II 6PFCE (MYRON, USA). Soil TN was analyzed with an elemental analyzer (Elementar, Germany), while soil TP was quantified by ICP-OES (Optima 5300 DV, PerkinElmer, Waltham, MA, USA) after HNO3 and HF digestion. Soil total organic matter was measured using the K2CrO7-H2SO4 oxidation method. MAT and MAP were obtained from the National Meteorological Information Center of China. Soil physicochemical properties are shown in Supplementary Table S1.
Microcosm experimental design
-
All soil samples, with and without added nitrogen source (NO3−–N, 10 kg N ha−1, as KNO3, approximately 1/10 of soil TN), and a water content of 20% (gravimetric), were placed into 120 ml flasks. Three biological replicates were prepared per treatment. The flasks were sealed with air-tight butyl rubber septa and aluminum caps, then made anoxic by alternately evacuating (0.1 kPa), and filling with high-purity helium (99.999%, 120 kPa) five times. All flasks were incubated in a thermostat water bath at 25 °C for 168 h. The N2O and N2 concentrations in the headspace were measured using an automated system as previously described[28].
Statistical analyses
-
Spearman correlation was employed to examine the relationship between each influencing factor and the rates of N2O and N2 emission, and the N2O/(N2O + N2) ratio. The 'SoDA' package in R was utilized to transform the longitude and latitude into Cartesian coordinates. Subsequently, the 'Vegan' package (REF) was employed to convert these Cartesian coordinates into PCNM parameters, which were subsequently utilized as spatial variables. Using the 'PLSPM' package in R (REF), a partial least squares (PLS) path analysis was conducted to investigate the relationships between N2O and N2 production rates with geographical distance (PCNM, altitude), environmental parameters (soil physical and chemical properties: pH, TOC, TC, DOC, DC, C/N, TP, TK, BD, EC, TN, NO3−, NH4+, and NO2−; climatic factors: MAP and MAT), and nitrogen addition. Finally, a stepwise multiple linear regression analysis was conducted in R ('olsrr' package) to identify the optimal model for determining the primary factors influencing denitrification potential in the steppe soils.
-
As shown in Fig. 2a, the N2O emission rates varied between 0.6 ± 0.03 and 372.7 ± 32.5 μg N kg−1 dry soil h−1 across all 30 sampling sites. In the IMP steppe sites, N2O emission rates varied from 2.4 ± 0.2 to 179.9 ± 14.8 μg N kg−1 dry soil h−1, while for the LP steppe sites, they ranged from 3.2 ± 0.1 to 154.7 ± 20.3 μg N kg−1 dry soil h−1. The mean N2O emission rates in XP soils (61.0 μg N kg−1 dry soil h−1), and IMP soils (60.9 μg N kg−1 dry soil h−1) were significantly higher than those in LP soils (38.6 μg N kg−1 dry soil h−1), indicating that XP and IMP are relative hotspots for N2O emissions. The N2 emission rates (Fig. 3a) ranged from 18.1 ± 2.7 to 1,230 ± 14.1 μg N kg−1 dry soil h−1 across all sampling sites. Consistent with the soil N2O emission rates, the average level of soil N2 emission rate in the XP sites (318.1 μg N kg−1 dry soil h−1) was significantly higher than that of both the IMP (200.3 μg N kg−1 dry soil h−1), and LP sites (142.5 μg N kg−1 dry soil h−1). The N2O/(N2O + N2) ratio (Fig. 4a) exhibited a wide range of variation across all sampling sites, ranging from 0.7% to 73.8%. Specifically in LP sites, the N2O/(N2O + N2) rate ratios ranged from 3.4% to 73.8%, which were significantly higher than those observed in IMP sites (ranging from 1.5% to 42.3%) and XP sites (ranging from 0.7% to 44.7%).
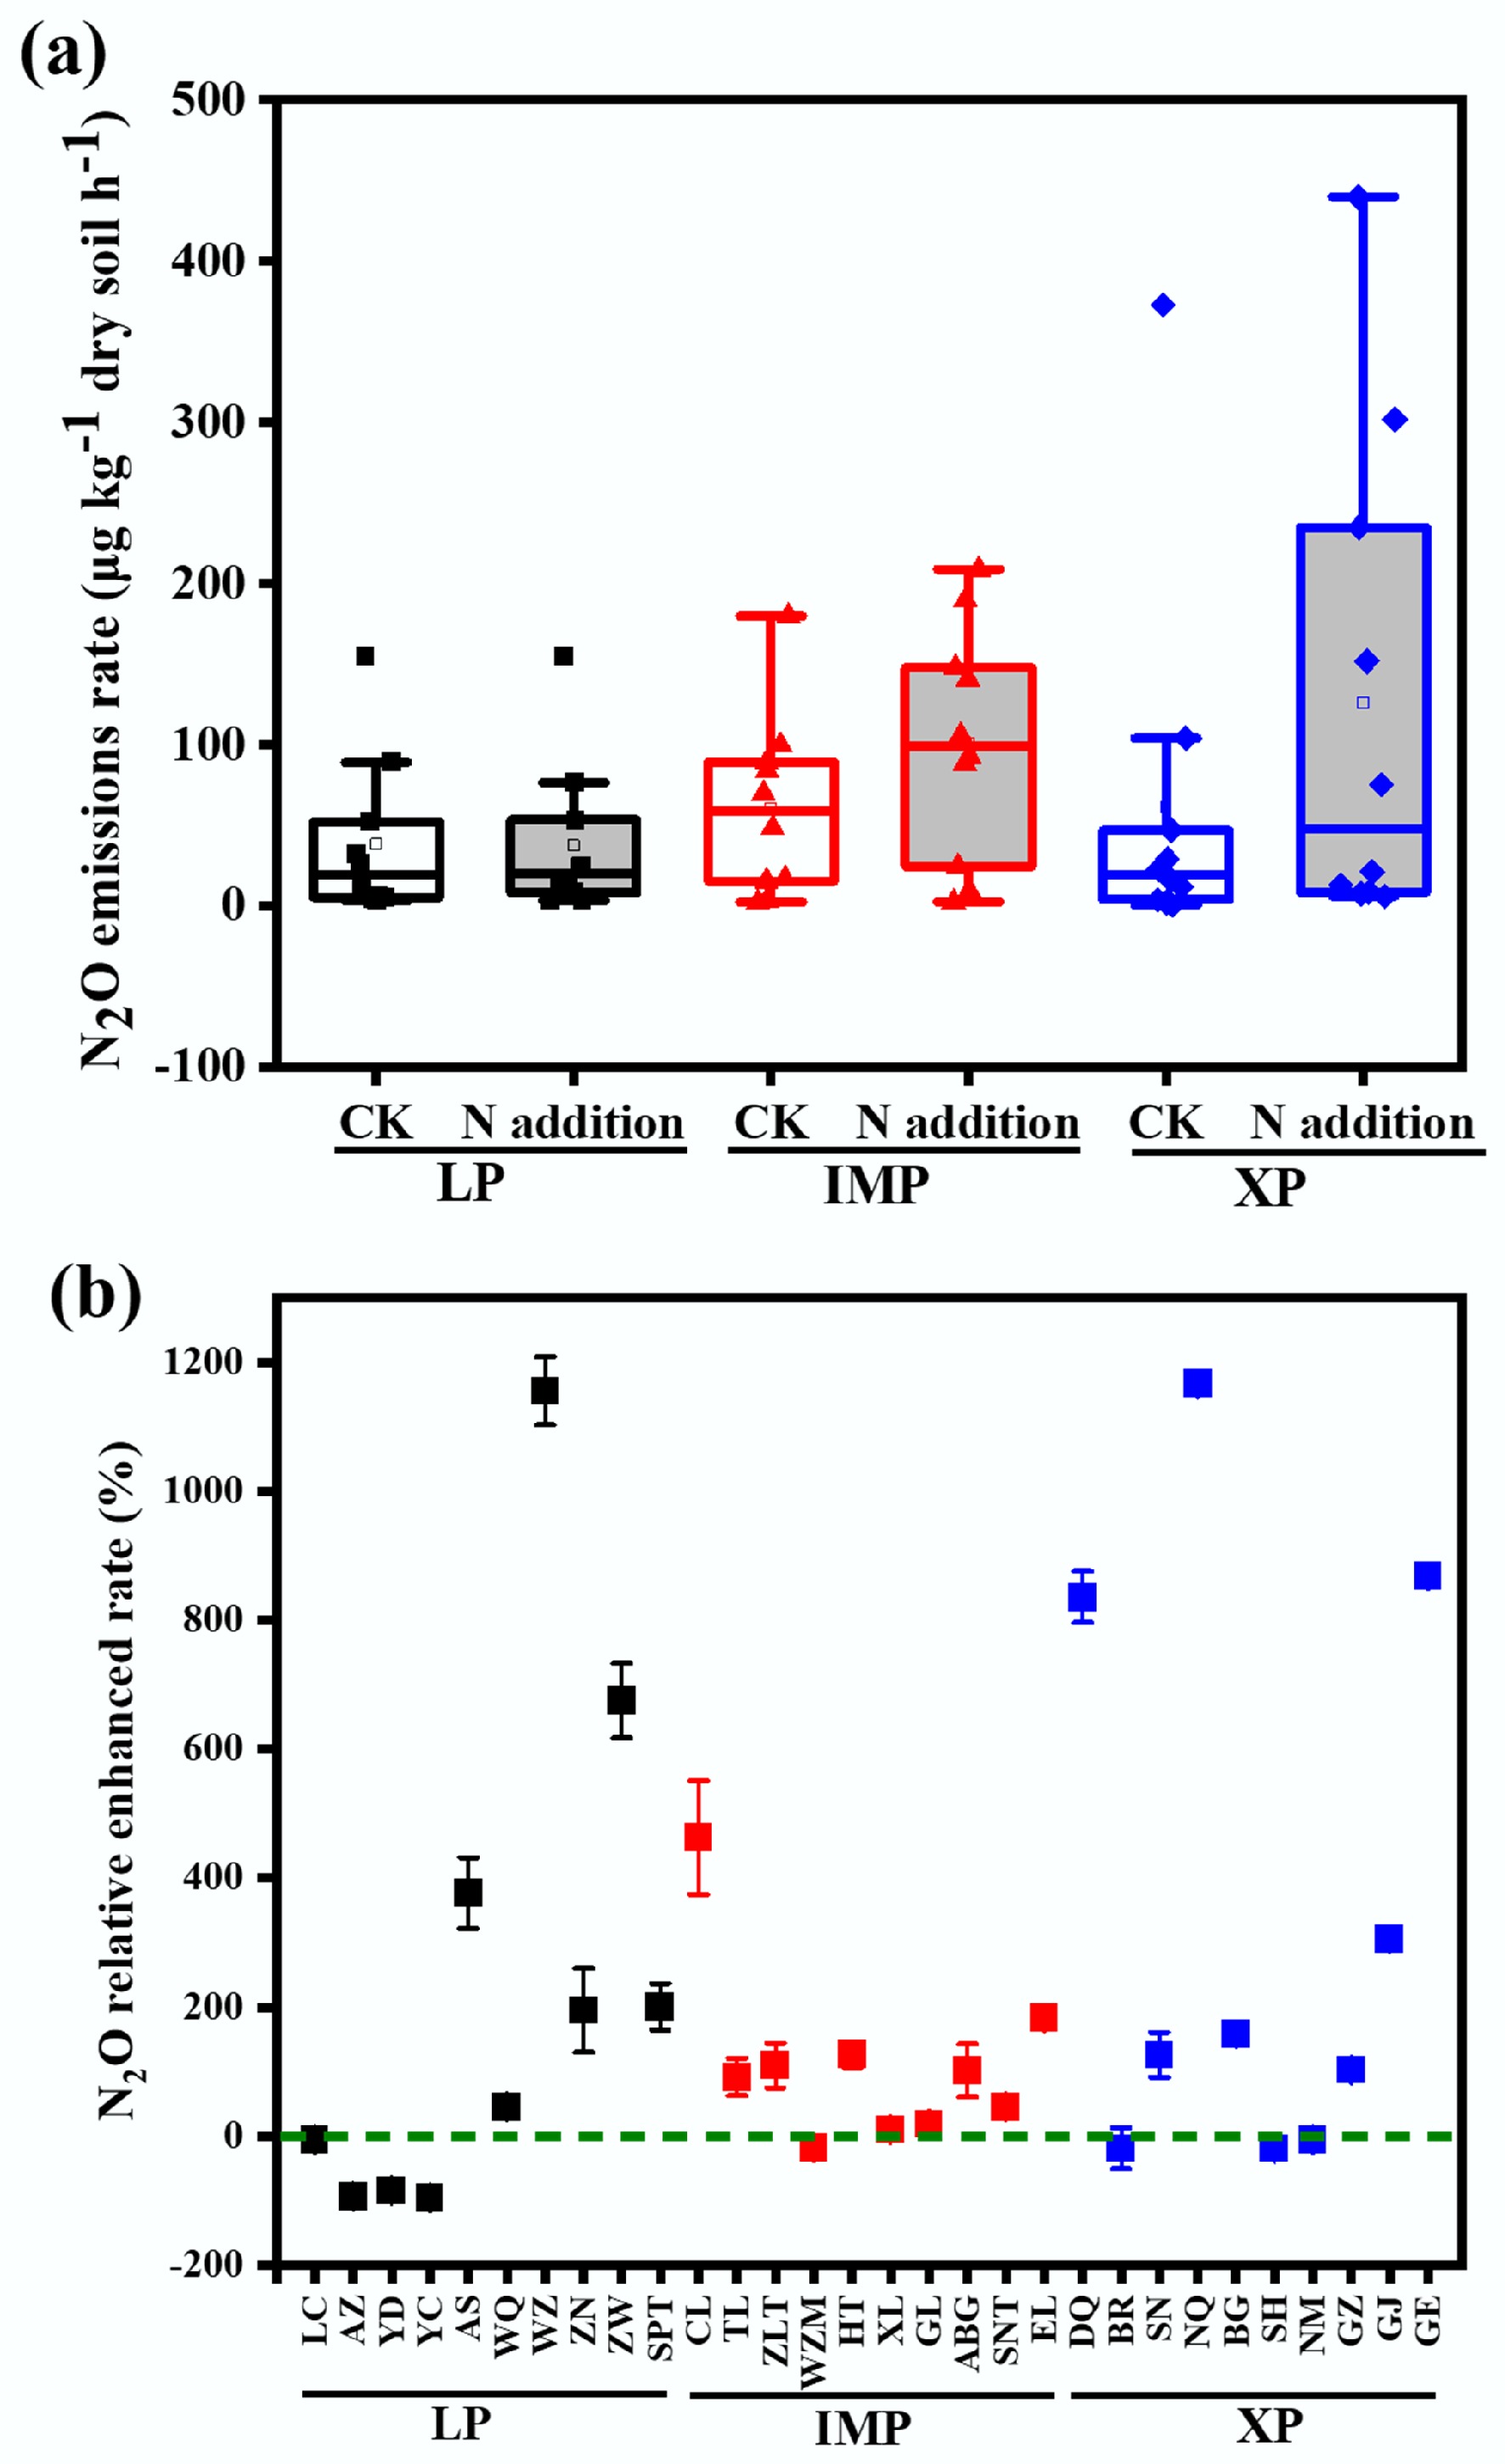
Figure 2.
(a) N2O emission rates of steppe soils at different sites for the Loess Plateau (LP), Inner Mongolia Plateau (IMP), and Xizang Plateau (XP) steppes without and with N addition, and (b) the relative enhancement of emission rates after N addition, compared to the scenario without N addition. The concentration of N addition is 10 kg N ha−1.
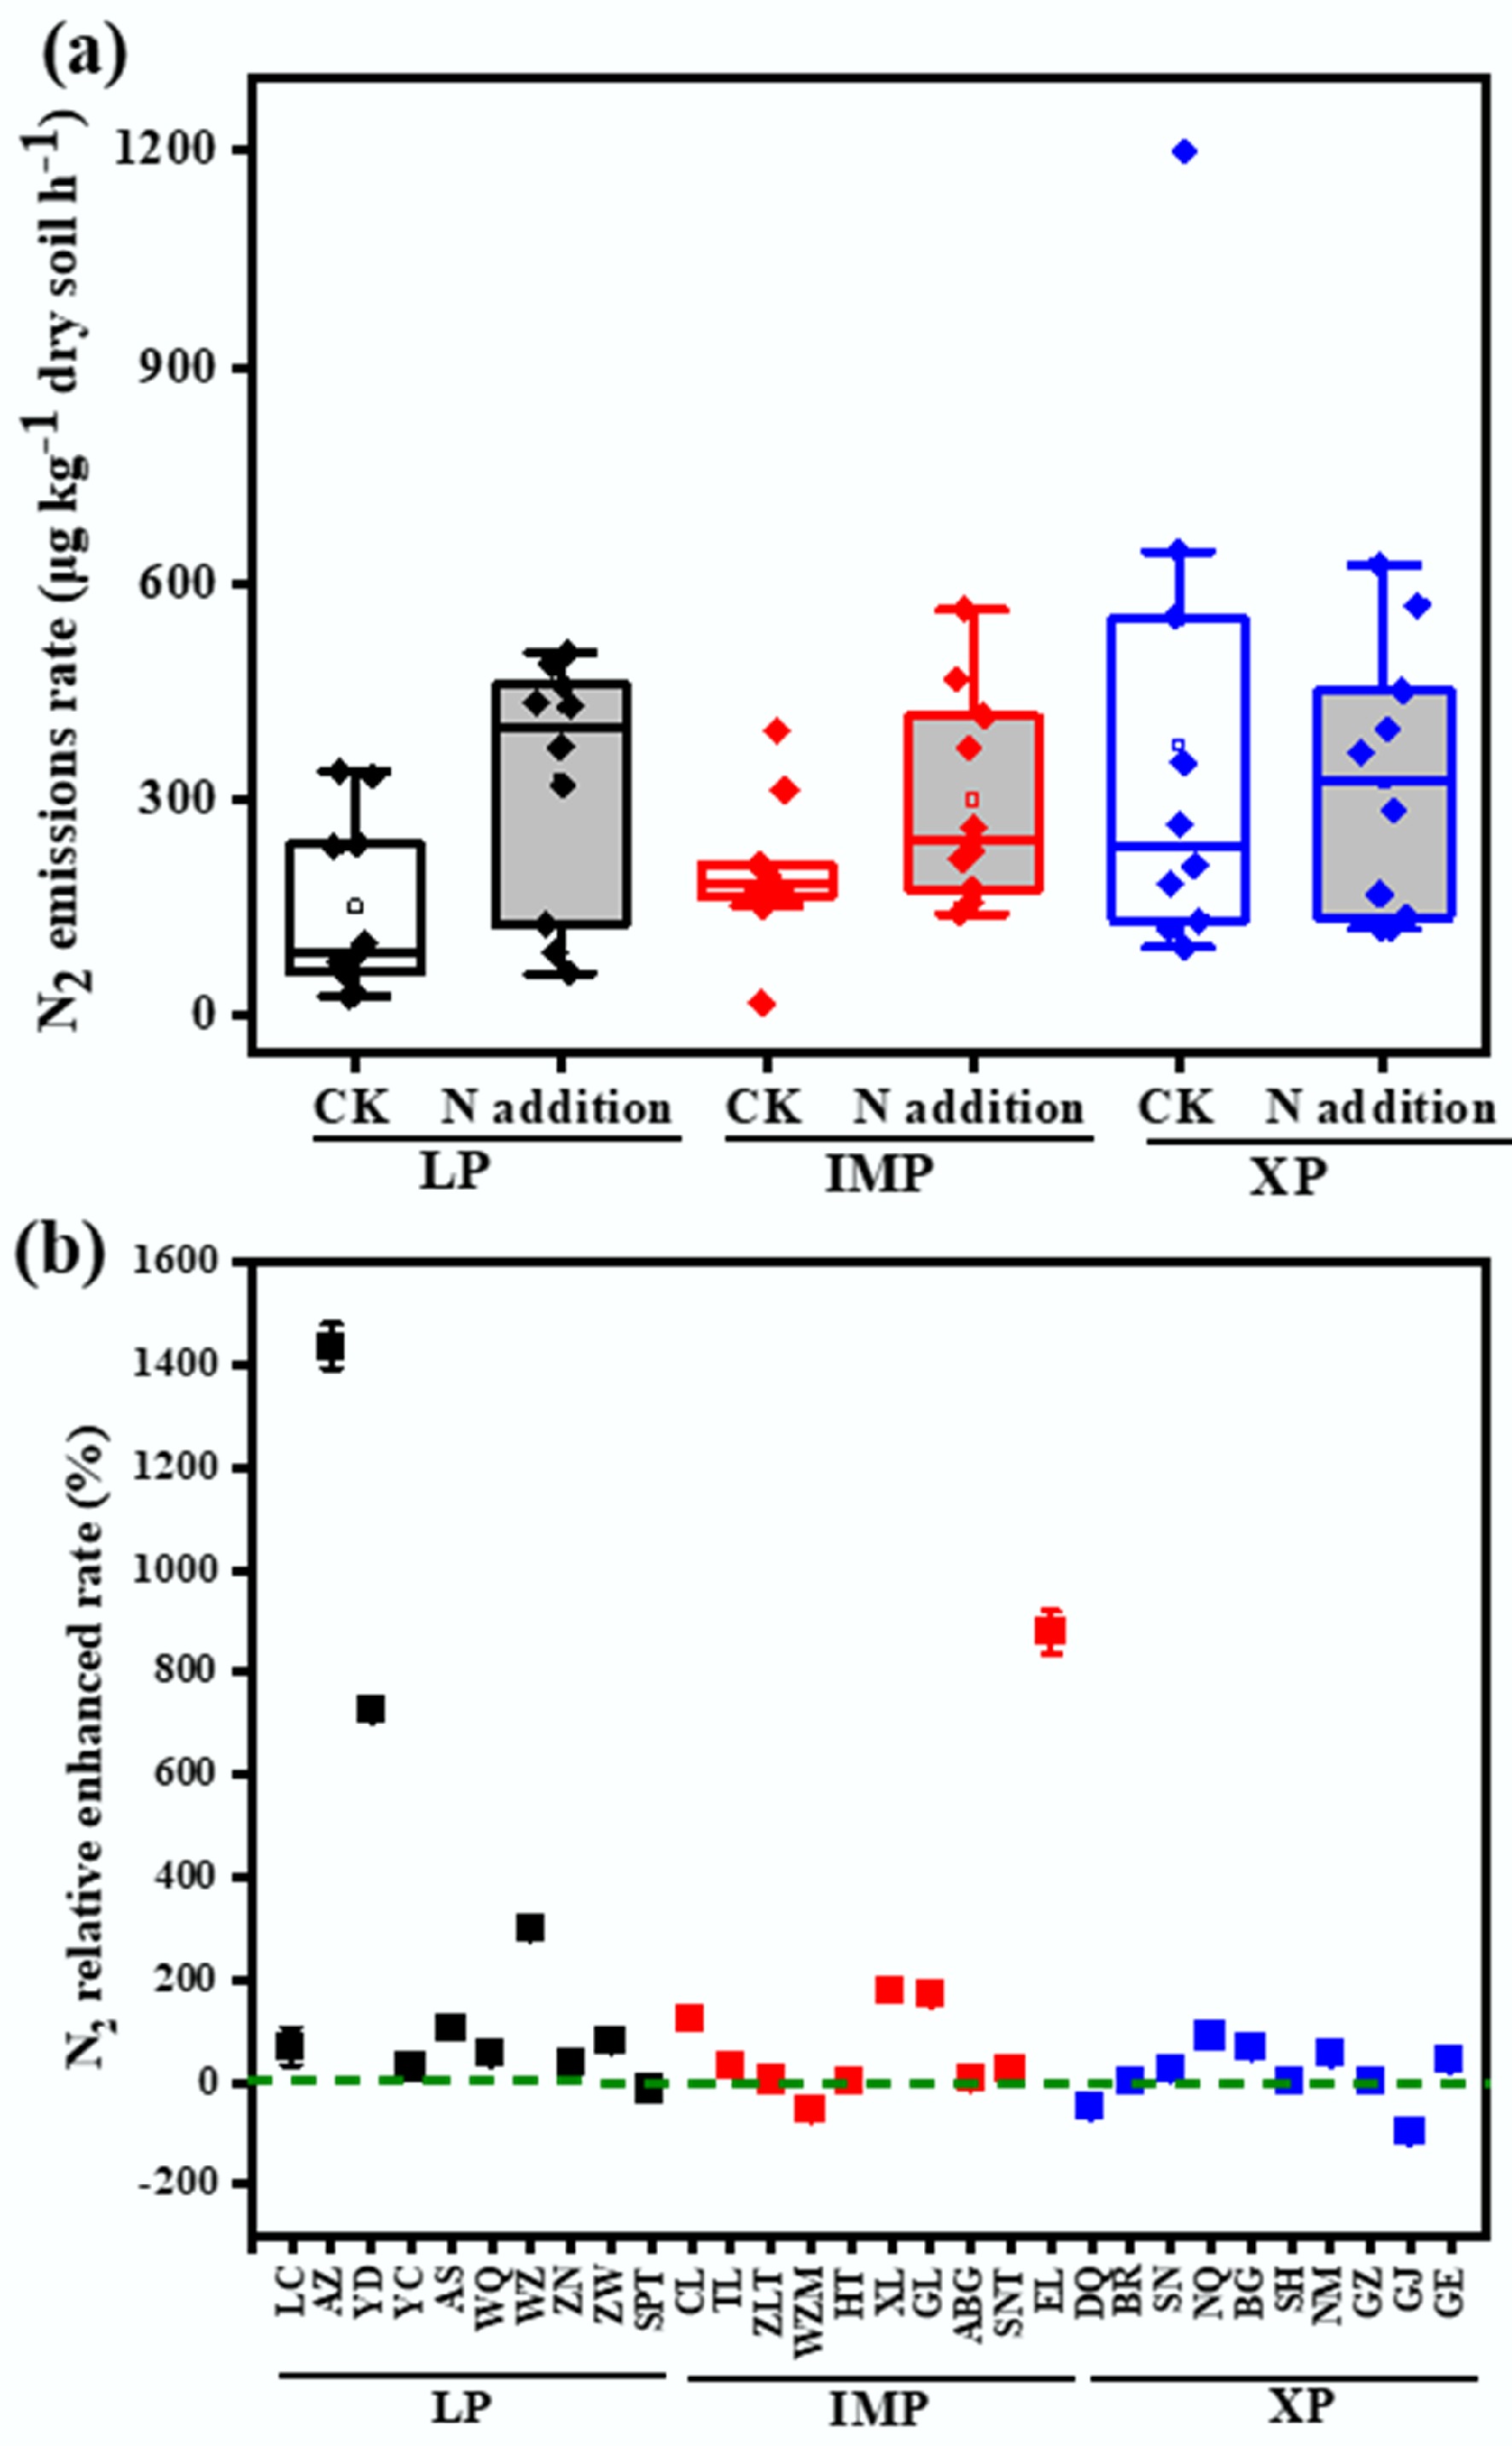
Figure 3.
N2 emission rates of steppe soils at different sites: (a) without (CK), and (b) with N addition (N-addition), and the relative enhancement in N2 emission rates after N addition compared to the scenario without N addition (right y axis in plane (b)). Loess Plateau (LP), Inner Mongolia Plateau (IMP) and Xizang Plateau (XP) steppes. The concentration of N addition is 10 kg N ha−1.
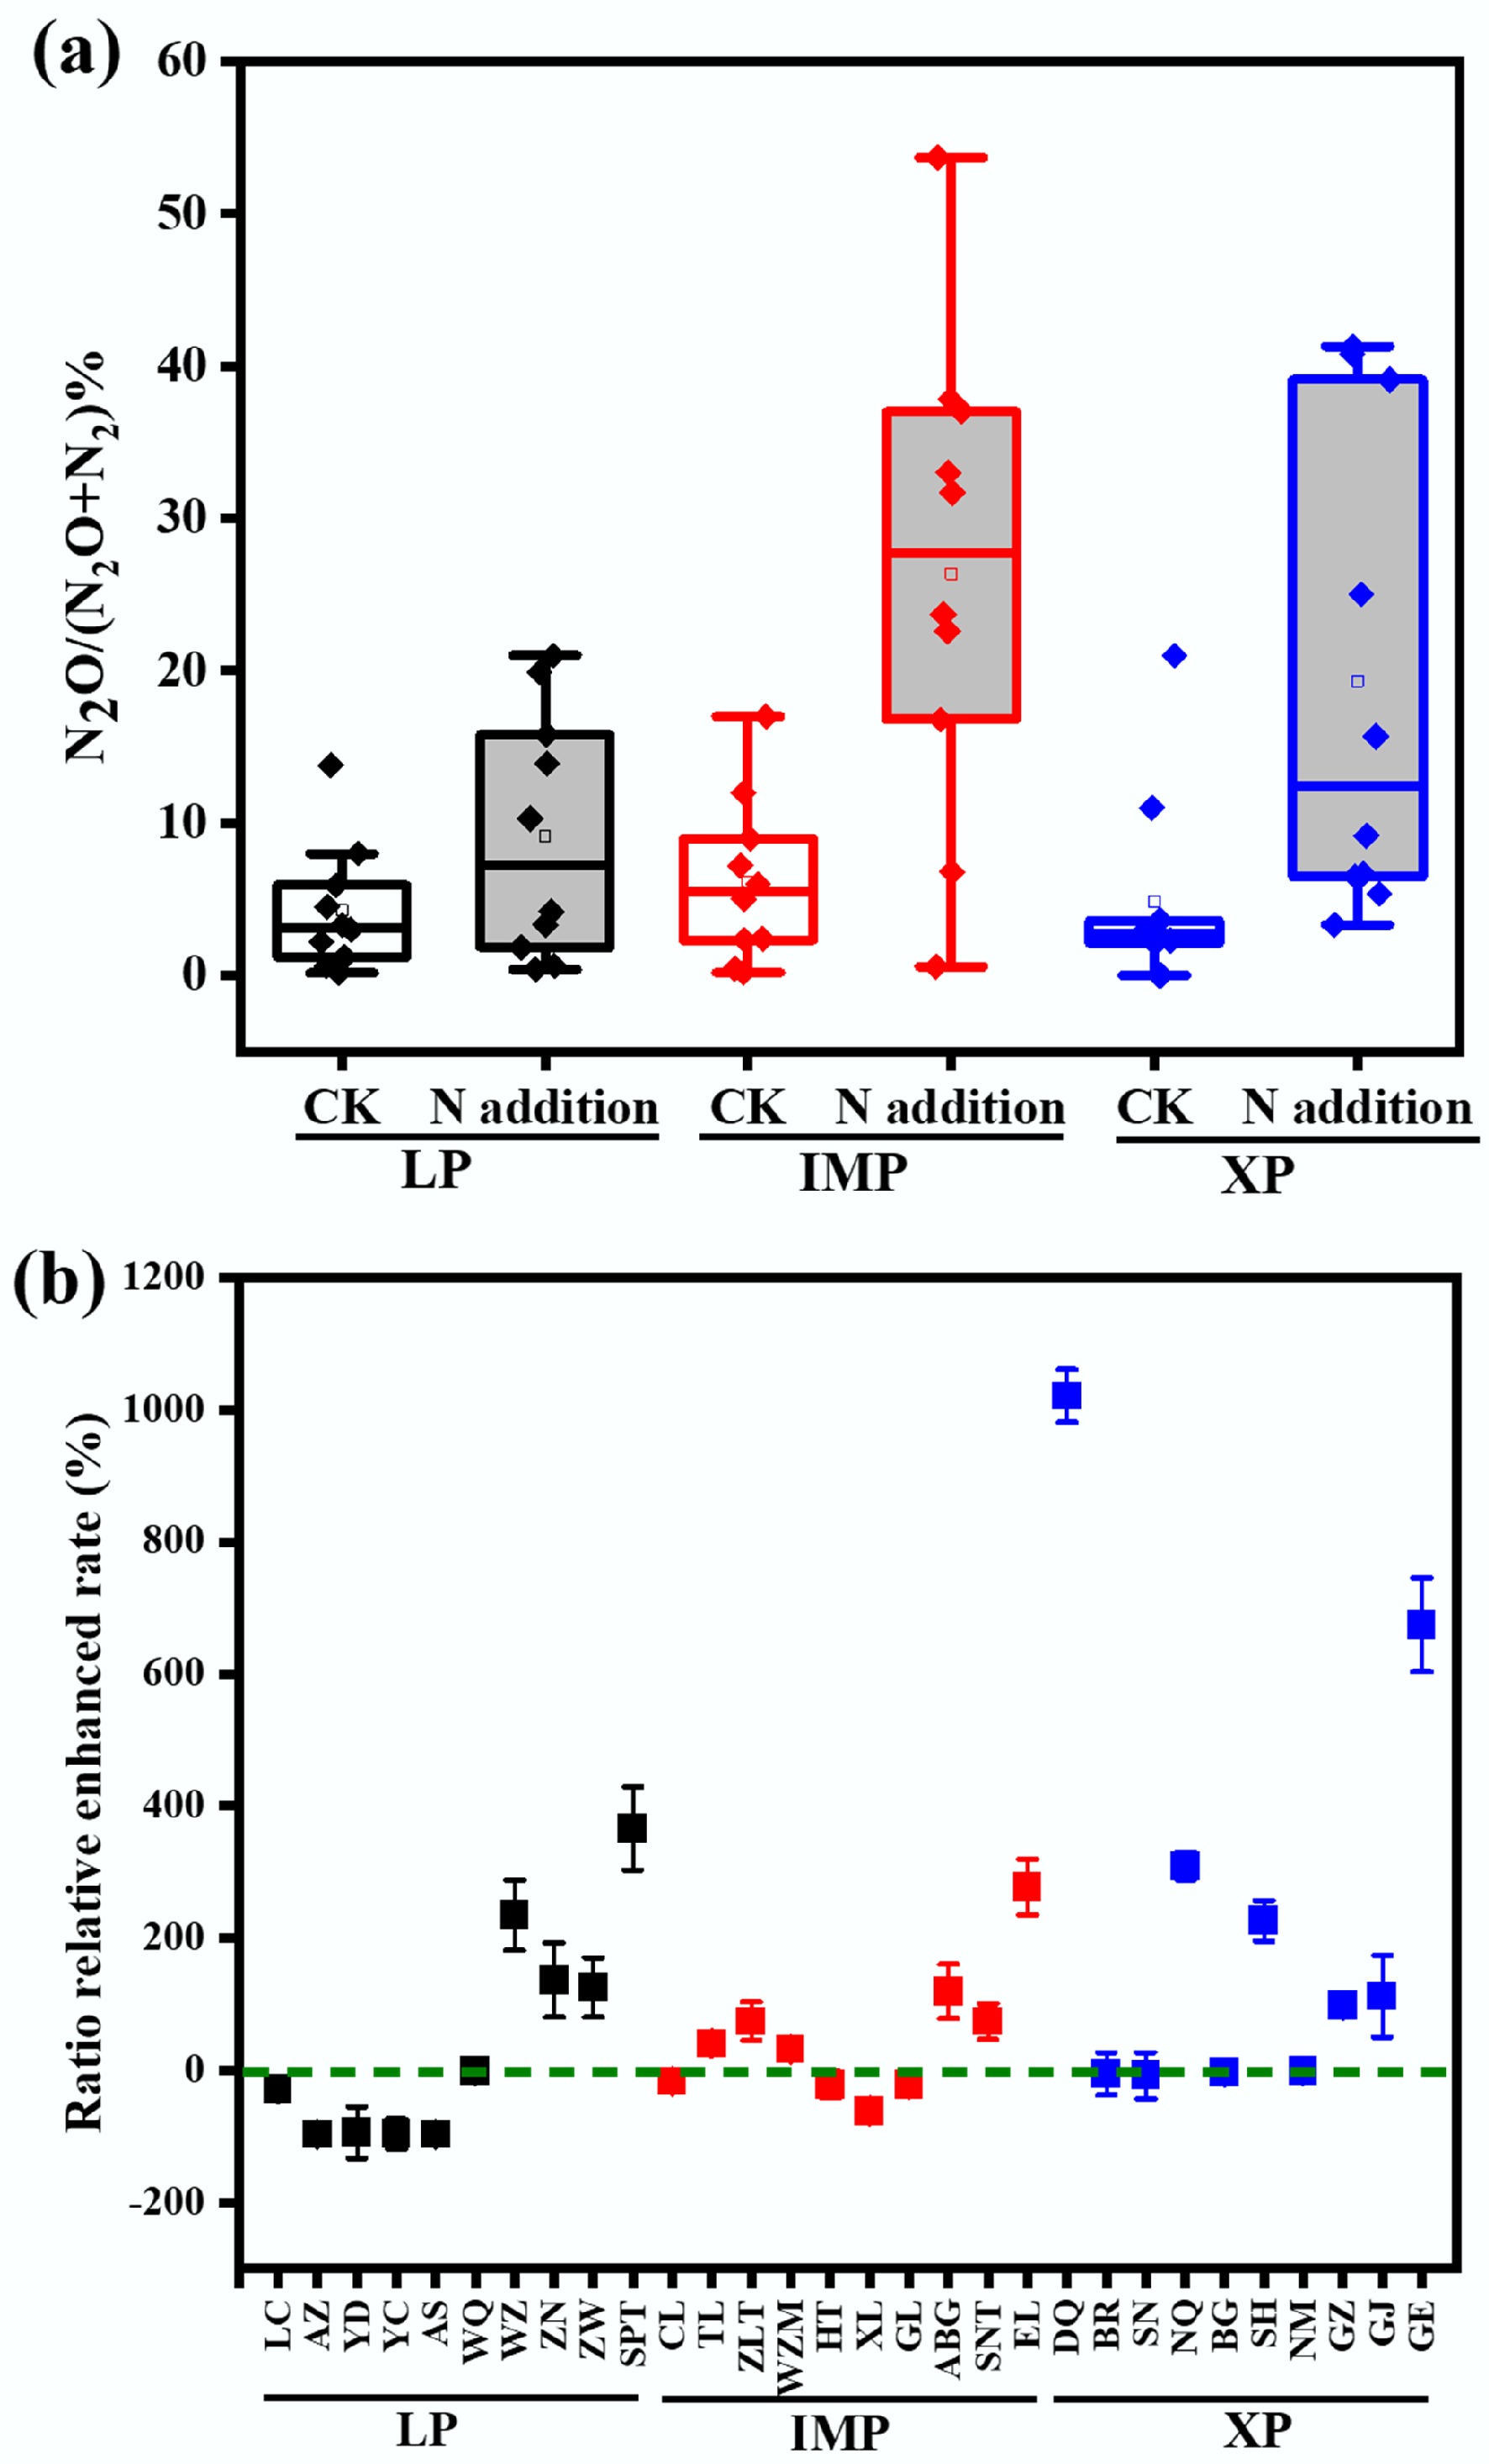
Figure 4.
Ratio of N2O/(N2O + N2) at different sites for the Loess Plateau (LP), Inner Mongolia Plateau (IMP), and Xizang Plateau (XP) steppes: (a) without (CK) and (b) with N addition (N-addition), and the relative enhancement in ratios after N addition compared to the scenario without N addition (right y axis in plane (b)). The concentration of N addition is 10 kg N ha−1.
Denitrification potential response to nitrogen addition
-
Nitrogen addition enhanced soil denitrification potential by 65%, on average, compared to the control (Fig. 2b). The mean N2O emission rate across all 30 sampling sites with and without N-addition was 88.4 ± 14.6 and 53.5 ± 19.8 μg N kg−1 dry soil h−1, respectively. At steppe scales, the average N2O emission rates in the XP, IMP, and LP steppes were 121.3 ± 14.9, 101.3 ± 12.4, and 37.7 ± 5.6 μg N kg−1 dry soil h−1, respectively. After nitrogen addition relative to the sampling sites without nitrogen addition, the mean N2O emission rates increased by 98.8% and 66.3% in the XP and IMP steppes, respectively, while there was no significant effect on the mean N2O emission rate in the LP steppe (Fig. 2a).
Addition of nitrogen also enhanced N2 emission rates across most sampling sites, ranging from 59.2 ± 4.4 to 625.7 ± 194.8 μg N kg−1 dry soil h−1 (Fig. 3a) with an average 44.3% increment across all steppes (Fig. 3b). In the LP steppe sites, the soil N2 emission rates increased by 185.9 μg N kg−1 dry soil h−1 (130.5%), while in the IMP steppe sites, N2 emission rates increased by an average of 100.3 μg N kg−1 dry soil h−1 (50.1%). In XP steppe sites, the N2 emission rates were less responsive to nitrogen addition, with an average increase of only 2.1%. Nitrogen addition altered the N2O/(N2O + N2) ratio. This ratio decreased by an average of 11.3% in the LP sites, but increased by an average of 5.0% and 6.1% in the IMP and TP sites, respectively (Fig. 4b).
Relationships between denitrification potential, environmental variables, and N addition
-
Spearman correlation analysis revealed that the relationship between environmental factors and denitrification potential varied between steppe and between sites within a steppe (Table 1). Combining data from all steppes, the denitrification potential for N2O showed a positive correlation with MAP, TOC, TC, TN, DOC, NH4+–N, DN, and N-addition, and a negative correlation with MAT, pH, bulk density, DIC, and NO2−–N. In the LP steppe, the N2O emission rates from sites were positively correlated with EC, C/N, NH4+–N, and N-addition, while negatively correlated with MAP, moisture content, TN, NO3−–N, and DN. In the IMP steppe sites, N2O emission rates were positively correlated with MAP, moisture content, TOC, TC, TN, C/N, NO3−–N, and N-addition; while negatively correlated with pH, bulk density, and TK. The N2O emission rates in XP sites were correlated with all factors except for altitude, MAT, EC, TP, and NO3−–N. Importantly, significantly positive correlations were observed between nitrogen addition and N2O emission rates at all sampling sites, both regionally and sub-regionally.
Table 1. The relationships between N2O emission rate and environmental factors on a regional (all sites), and sub-regional scale (LP, IMP, and XP) evaluated by Spearman correlation analysis
All LP IMP XP Altitude 0.007 0.218 −0.033 −0.016 MAT −0.259** −0.157 −0.07 −0.136 MAP 0.313** −0.362** 0.340* 0.894** pH −0.450** 0.360* −0.392** −0.648** Moisture −0.001 −0.576** 0.454** 0.486** EC 0.047 0.376** −0.106 0.12 Bulk density −0.231** −0.113 −0.484** −0.548** TOC 0.491** −0.269 0.601** 0.808** TC 0.306** −0.155 0.556** 0.818** TN 0.512** −0.367** 0.536** 0.900** TP −0.076 −0.175 0.365** 0.137 TK 0.029 0.049 −0.423** −0.359* C/N −0.237** 0.481** 0.455** −0.23 DOC 0.274** −0.266 0.183 0.893** DC 0.027 −0.162 −0.013 0.749** DIC −0.404** 0.227 −0.271 −0.335* NO2− −0.247** −0.223 −0.033 −0.436** NH4+ 0.526** 0.411** 0.148 0.791** NO3− 0.075 −0.397** 0.361* 0.134 DN 0.240** −0.378** 0.361* 0.469** N addition 0.611** 0.613** 0.522** 0.461** The correlation analysis showed that the relationships between environmental variables and N2 emission rates varied between steppes and sites (Supplementary Table S2). Within steppes, significant correlations were observed between soil N2 emission rates and MAP, EC, bulk density, TK, soil carbon, and soil N (not including NO3−–N, and DN). In the LP steppe, the N2 emission rate correlated with MAT, MAP, pH, bulk density, OC, TC, TN, DOC, DTC, and NH4+. While in the IMP steppe, the N2 emission rate correlated with EC, bulk density, TN, TP, and soil C. In the XP steppe, the N2 emission rate was correlated with MAP, pH, TK, TN, TOC, TC, DOC, DC, NO2−, and NH4+. Nitrogen addition exhibited a significant positive correlation with the N2 emission rate within the LP and IMP steppe but not in the XP steppes.
Soil and environmental factors were also correlated with the N2O/(N2O + N2) ratio (Supplementary Table S3). Across all steppes, TOC and soil N elements (TN, NH4+, and DN) were positively correlated with the soil N2O/(N2O + N2) ratio, while MAT, pH, C/N, and DIC showed negative correlations. In the LP steppe, the N2O/(N2O + N2) ratio was correlated positively with altitude, pH, and C/N, but negatively with MAP, TN, and soil C (excluding DIC). The N2O/(N2O + N2) ratio was correlated positively with NO3−, but negatively correlated with pH and DIC. In the XP steppe, all variables except altitude, moisture, TP, TK, C/N, and NO3− were observed to be positively correlated with the N2O/(N2O + N2) ratio. Nitrogen addition was found to be positively correlated with the N2O/(N2O + N2) ratio across steppes and within steppes, similar to the N2O emission rate.
Factors controlling denitrification potential at a regional and sub-regional scale
-
At the regional scale, geographical distance had a direct and significant influence on environmental variables (climate and soil physiochemical properties), while these same factors significantly influenced N2O emission rates either directly or indirectly through their effects on soil N. The direct effect of soil N (path coefficient = 0.43) on N2O emission rate was greater than those of soil physiochemical properties (path coefficient = −0.22) or N addition (path coefficient = 0.42) (Fig. 5a). Among the soil N components, TN showed the highest standardized coefficient (0.54) as revealed by the stepwise multiple regression analysis (Table 2), indicating that TN was a key factor explaining N2O emission rate. At the LP sites, geographical distance had a direct and significant influence on climate, soil properties, and soil N. In addition, soil properties and soil N directly affected N2O emission rate. The direct effect of N addition (path coefficient = 0.78) on N2O emission rate was greater than that of soil N (path coefficient = 0.55) (Fig. 5b). Further, stepwise multiple regression analysis indicated that N addition had the highest standardized coefficient (0.89). Among environmental factors, stepwise multiple regression analysis suggested that TC had the highest standardized coefficient (Table 2). At the IMP sites, geographical distance exerted a direct and significant influence on climate and soil properties, which directly or indirectly affected N2O emission rates. Among environmental factors, stepwise multiple regression analysis indicated that MAP had the highest standardization coefficient of 0.413 (Table 2). Moreover, the N addition (path coefficient = 0.39) also showed a direct and positively significant influence on N2O emission rates (Fig. 5c). At the XP sites, soil N elements (path coefficient = 0.50) significantly directly affected N2O emission rate (Fig. 5d). Among measured environmental variables, TN explained the highest standardized coefficient (0.618) by stepwise multiple regression analysis (Table 2).
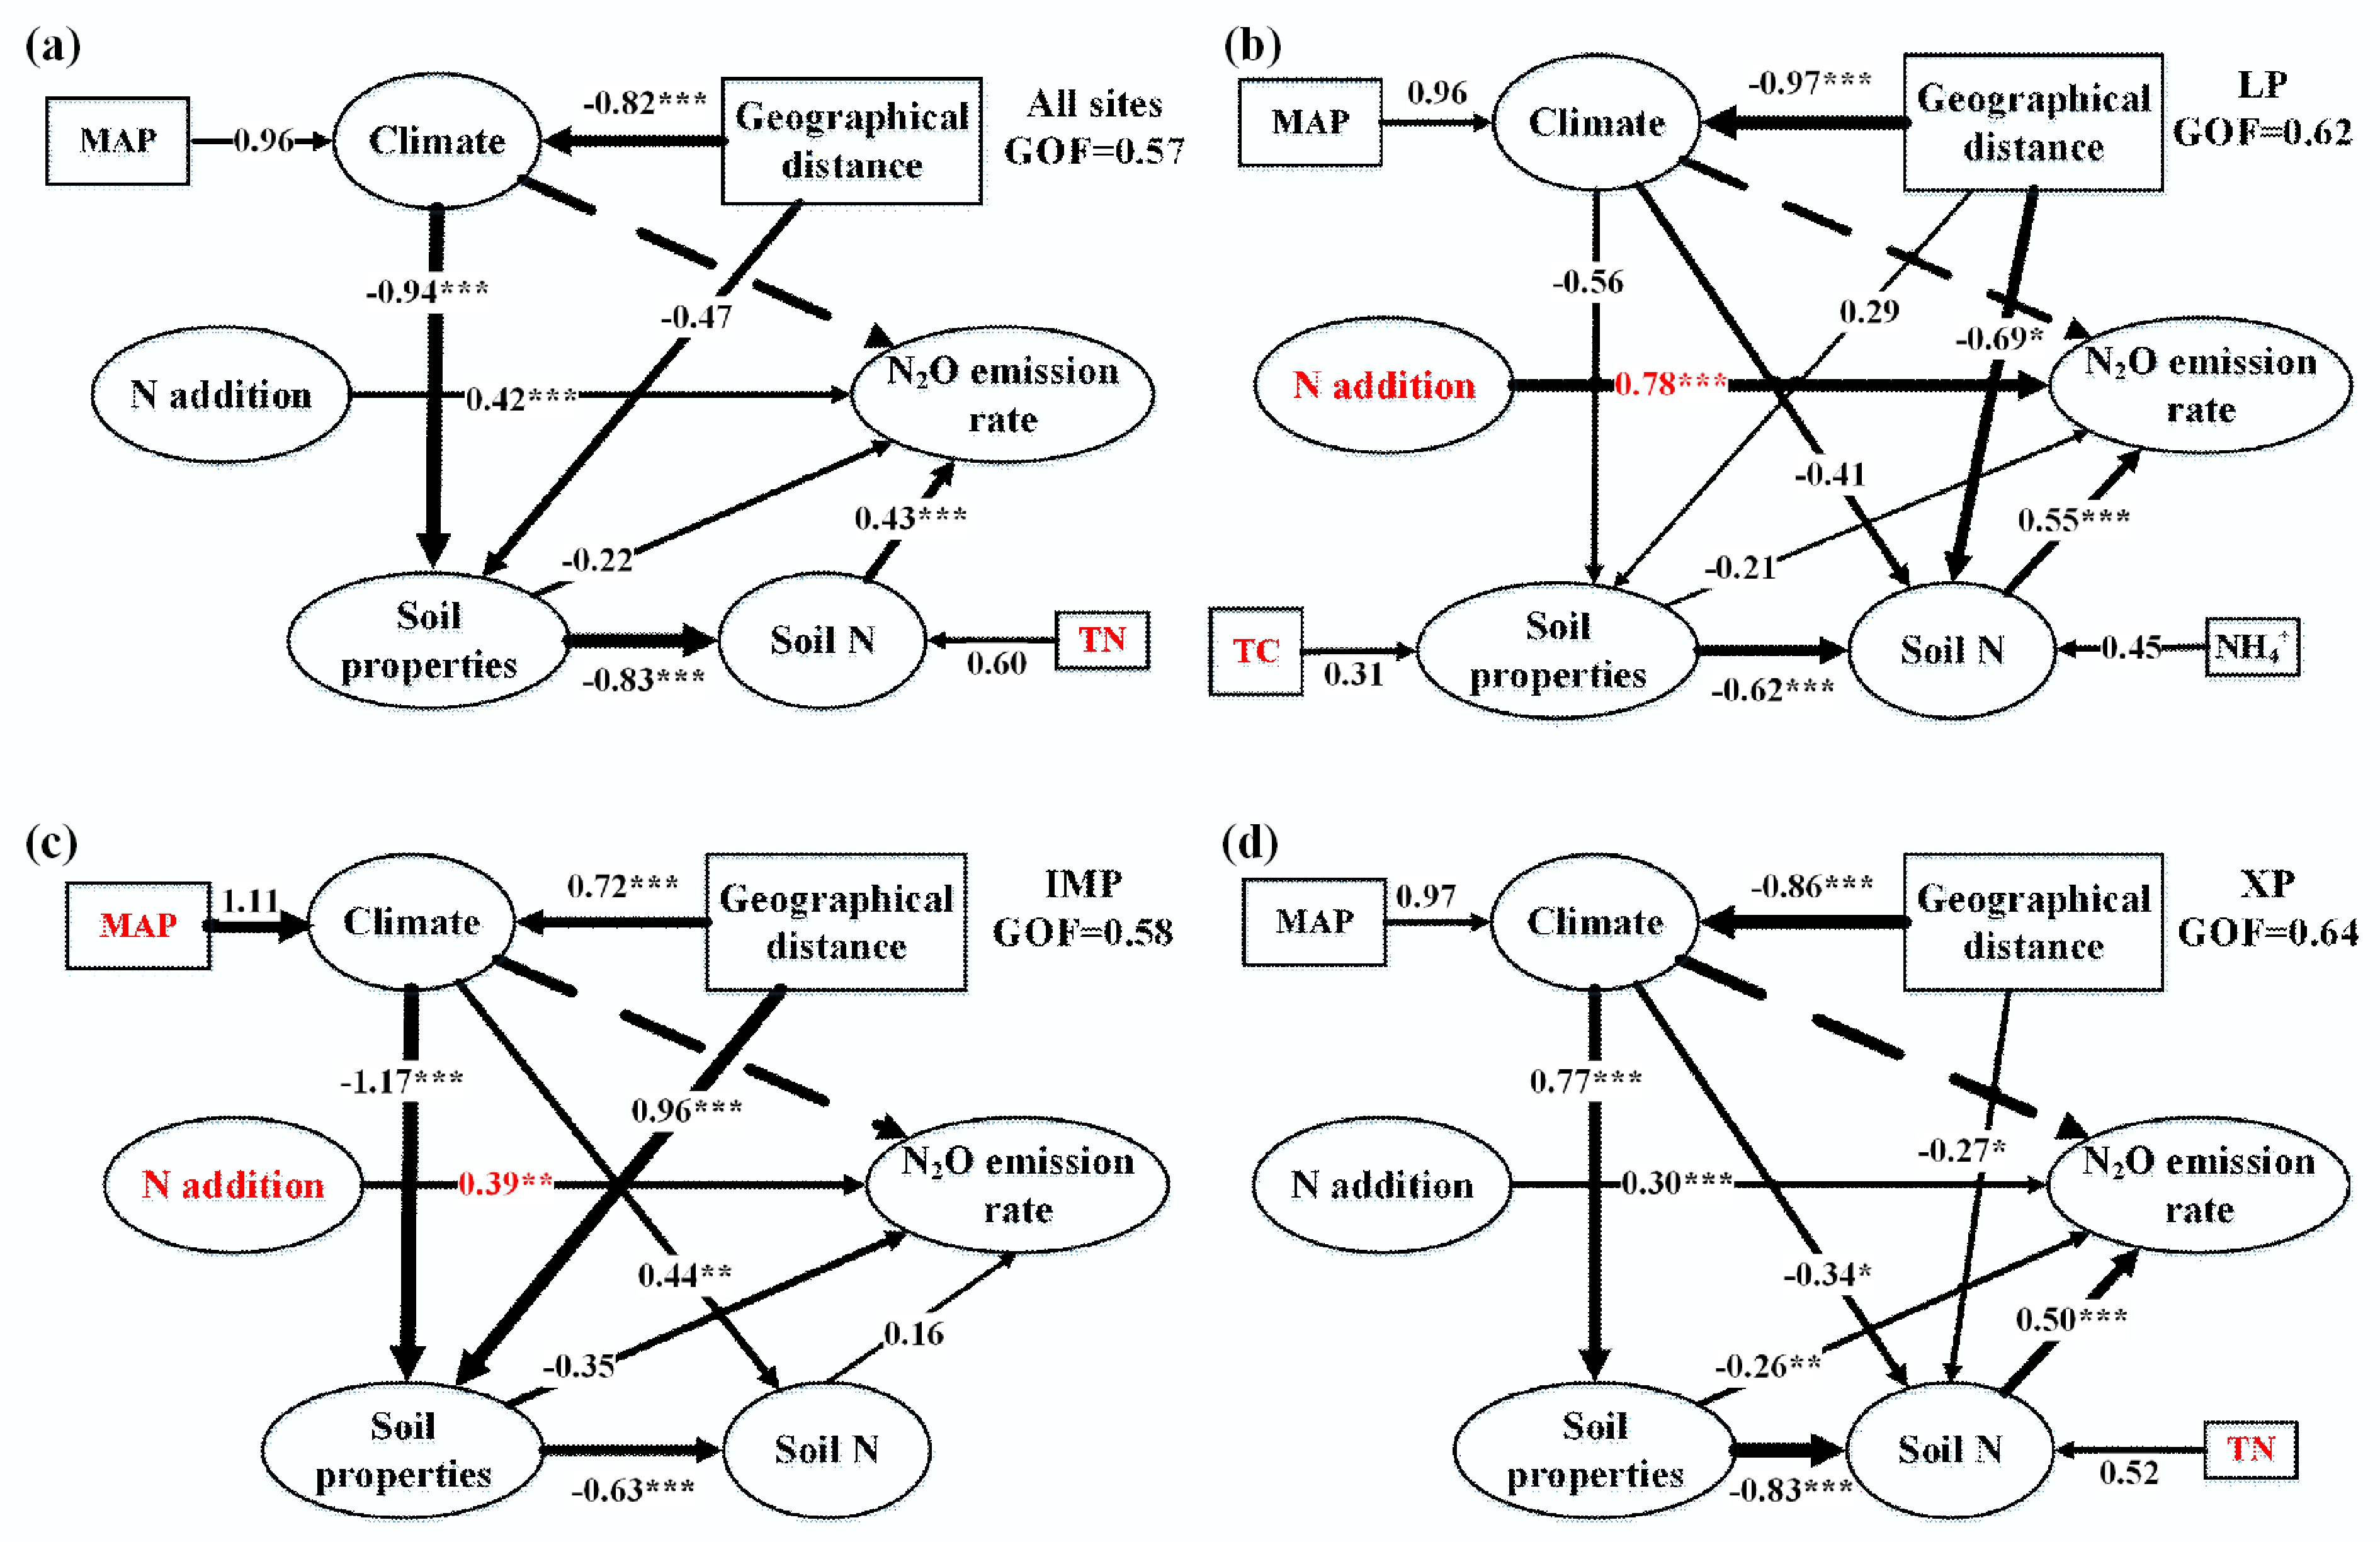
Figure 5.
Path analysis diagrams for N2O emission rate in all sampling sites on (a) regional scale, and sub-regional scale (b) LP, (c) IMP, and (d) XP. LP, Loess Plateau; IMP, Inner Mongolia Plateau; XP, Xizang Plateau; TN, total nitrogen; MAP, mean annual precipitation; TOC, total organic carbon; NH4+- NH4+–N. Standardized coefficients are shown in Supplementary Fig. S1. Full lines and broken lines indicate that the path coefficients between latent variables are significant and not significant, respectively.
Table 2. The roles of all factors (including geographical distance, environmental variables, and N-addition) on the ratio of N2O emission rate evaluated by stepwise multiple regression modeling on a regional (all regions), and sub-regional scale (LP, IMP, and XP)
Sites Explanatory variable Standardization coefficient p Full model (Adj. R2) All TN 0.538 0.000 0.81 N addition 0.373 0.000 Geographical distance 0.207 0.000 MAP 0.208 0.001 LP N addition 0.894 0.000 0.71 TC 0.55 0.000 NO3−–N −0.307 0.002 NH4+–N 0.202 0.045 IMP MAP 0.413 0.000 0.59 N addition 0.366 0.001 TP −0.385 0.008 XP TN 0.618 0.000 0.62 N addition 0.268 0.000 MAP 0.186 0.029 In terms of the N2O reduction rate (N2 emission rate), PLS-PM demonstrated the optimal fit to the present data based on respective indices of model fit (GOF = 0.55, 0.66, 0.56, and 0.63). The PLS analysis revealed that N addition and environmental variables, which are embedded in different geographical regions, can influence the rate of N2O reduction. On a regional scale, N addition (path coefficient = 0.52) had a significant direct effect on the N2O reduction rate, while climate (total effect coefficient = 0.49) had a significant indirect effect on N2O reduction rate through its impact on MAP. Additionally, soil nitrogen as a substrate for N2O production exerted considerable influence on N2O reduction rate, particularly with respect to TN (Fig. 6a). Stepwise multiple regression modeling analysis revealed that TN (standardization coefficient = 0.49) was the most dominant factor affecting N2O reduction rate (Supplementary Table S4). At the LP sites, N addition has a significant positive effect on soil N2O reduction rate (Fig. 6b). Stepwise multiple regression analysis revealed that MAP (−0.49), and MAT (0.34) were key factors in explaining the N2O reduction rate among environmental factors (Supplementary Table S4). At the IMP sites, soil physicochemical properties (path coefficient = 0.44) significantly influenced the N2O reduction rate, followed by N addition, and soil N (Fig. 6c). Stepwise multiple regression analysis indicated that TC (0.70) and pH (0.80) dominated soil N2O reduction rate among the soil physicochemical properties (Supplementary Table S4). At the XP sites, the contribution of N addition to N2O reduction was relatively slight (Fig. 6d), while soil properties showed a significant directly or indirectly influence on N2O reduction rate. And MAP showed the highest explained standardized coefficient (0.836) in the stepwise multiple regression analysis (Supplementary Table S4).

Figure 6.
Path analysis diagrams for N2O reduction rate in all sampling sites on (a) regional scale, and sub-regional scale (b) LP, (c) IMP, and (d) XP. LP, Loess Plateau; IMP, Inner Mongolia Plateau; XP, Xizang Plateau; TN, total nitrogen; MAP, mean annual precipitation; MAT, mean annual temperature; TOC, total organic carbon; TC, total carbon. Standardized coefficient is showed in Supplementary Fig. S2. Full lines and broken lines indicate that the path coefficients between latent variables are significant, and not significant, respectively.
Similarly, PLS-PM analysis indicated that N addition and soil N had a significant influence on N2O/(N2O + N2) rate ratio (Fig. 7a), and stepwise multiple regression analysis showed that TN (0.61) was the environmental factor of the N2O/(N2O + N2) rate ratio on a regional scale (Supplementary Table S5). At the LP sites, geographical distance influenced N2O/(N2O + N2) rate ratio indirectly by its effect on soil properties and soil N (Fig. 7b), soil nitrogen, as a substrate (path coefficient = −0.21) and nitrogen addition (path coefficient = 0.21) directly but not significantly affected the N2O/(N2O + N2) rate ratio. Among environmental variables, TN (−0.50) dominated N2O/(N2O + N2) rate ratio explained by stepwise multiple regression analysis (Supplementary Table S5). At the IMP sites, soil properties influenced N2O/(N2O + N2) rate ratio, directly or indirectly by their effect on soil N, and N addition (path coefficient = 0.46) significantly positively influenced N2O/(N2O + N2) rate ratio directly (Fig. 7c). Further stepwise multiple regression analysis showed that pH (−1.05) was the most dominant factor of N2O/(N2O + N2) rate ratio among environmental factors (Supplementary Table S5). At the XP sites, soil properties (path coefficient = 0.61), and N addition (path coefficient = 0.46) have significant effects on N2O/(N2O + N2) rate ratio, directly or indirectly (Fig. 7d), and stepwise multiple regression analysis explained that N addition (0.48), and TC (0.46) had the highest standardized coefficient (Supplementary Table S5), indicating that TC dominated N2O/(N2O + N2) rate ratio among the environmental factors.

Figure 7.
Path analysis diagrams for N2O/(N2O + N2) rate ratio in all sampling sites on (a) regional scale, and sub-regional scale (b) LP, (c) IMP, and (d) XP. LP, Loess Plateau; IMP, Inner Mongolia Plateau; XP, Xizang Plateau; TN, total nitrogen; MAP, mean annual precipitation; TOC, total organic carbon; DN, Dissolved nitrogen; MAT, mean annual temperature. Standardized coefficient is shown in Supplementary Fig. S3. Full lines and broken lines indicate that the path coefficients between latent variables are significant, and not significant, respectively.
-
In this study, the pathways and key determinants governing the denitrification potential variation across different sub-regions of the Chinese grassland biome over larger spatial scales have been uncovered. The present findings indicate that environmental factors controlling denitrification potential exhibit scale-dependent characteristics, and the effects were mainly realized through their influences on soil N elements, and/or by affecting soil physicochemical properties.
PLS modeling revealed that nitrogen (N) addition exerts a strong, scale-independent influence on denitrification rates across grassland ecosystems. This contrasts with patterns in forests and wetlands: forests experience high denitrification potential from elevated N deposition and persistent moisture, yet soil acidification inhibits sensitive denitrifiers and limits N2O reduction[29]. Wetlands, conversely, are primarily controlled by total organic carbon (TOC)[30]. In this study, the presence of nitrate-N, as a direct substrate for denitrification, can directly impact the production and reduction of soil N2O, thus effectively regulating soil N2O emissions[13]. Prior studies report linear or exponential increases in N2O emissions with increasing N addition in temperate grasslands[31,32]. However, this relationship varies by ecosystem. Specifically, alpine grasslands exhibit a saturating response (initial increase followed by stabilization) to increasing N inputs[33]. Another possible reason could be its influence on microbial communities. N addition could induce shifts in microbial community composition and activities involved in denitrification, ultimately fostering an increase in denitrifier abundance, thereby intensifying soil N2O emissions[34,35]. Additionally, the enzyme activities associated with denitrification, and the abundance of denitrification functional genes also demonstrate a significant increase under nitrogen-enriched conditions, consequently enhancing the potential denitrification rate[36,37].
While the denitrification potential exhibited an association with soil nitrogen addition at both the regional and sub-regional scales, scale-dependent patterns were also discerned in terms of the influence of key environmental drivers on denitrification potential. At the regional scale, total nitrogen (TN) emerged as the primary determinant governing the denitrification rate. The impact of TN content on denitrification potential is multifaceted: firstly, nitrogen functions as the substrate for soil denitrification, directly impacting soil N2O emission[38]. Secondly, elevated soil nitrogen content can directly stimulate the growth and proliferation of soil microorganisms[39]. Furthermore, it can serve as a nutrient source for surface vegetation. Flourishing vegetation, characterized by extensive exudates from well-developed roots, fosters the multiplication and activity of soil microorganisms, including denitrifying bacteria[40,41]. Wang et al.[42] have also reported that heightened TN content can bolster the activities of the soil microbial community. In essence, the augmentation in microbial abundance and activities leads to a subsequent increase in N2O emissions.
In the LP steppe, NH4+ and TC emerged as primary contributors to the N2O emission rate, while MAT and MAP stood out as key drivers for the N2O reduction rate. Additionally, TN was identified as the pivotal environmental variable governing the N2O/(N2O + N2) ratio. Soil NH4+ played a crucial role in N2O emission via nitrification, particularly prevalent in drier conditions, with NH4+ also readily assimilated into microbial biomass, nurturing microorganisms[43]. In a temperate grassland, NH4+ application led to elevated N2O fluxes, significantly amplifying soil N2O emissions by an average of 98.2% in a meadow steppe[44]. Soil carbon (TC) served as an essential energy source for various microbial activities. Denitrifiers required easily available C before reducing NO3- to N2O[45]. Enhanced soil C availability generally correlated with increased denitrification rates across various soils[46].
In the IMP steppe, MAP assumed the role of the most influential environmental variable shaping the N2O emission rate, while TC and pH played significant roles in the N2O reduction rate. Notably, pH also stood out as the primary determinant of the N2O/(N2O + N2) ratio. Terrestrial N2O fluxes were markedly affected by MAP, with PLS path modeling demonstrating its direct and indirect influence on N2O emission rate through soil property effects[47]. Soil moisture, primarily governed by MAP, emerged as a key factor influencing denitrification potential[48]. MAP also affected N2O emissions indirectly through a negative effect on soil pH[47]. Soil pH held a significant role in determining denitrification rates and N2/N2O emission ratios in grassland soils of Northeast China. Generally, N2O fluxes exhibited an increase with rising soil pH in grasslands[49], while a year-long field study established a negative linear correlation between soil pH and cumulative N2O emissions in an intensively managed temperate grassland[50]. The N2O reductase (nosZ) enzyme, crucial in microbial denitrification and N2O consumption, was notably sensitive to soil pH. A higher abundance of the nosZ gene was observed under relatively elevated soil pH values, leading to increased N2O conversion to N2 and thus mitigating N2O emissions[51,52].
In the XP steppe, TN was the most important environmental driver explaining N2O emission and reduction rate; TC was the key environmental driver affecting the ratio of N2O/(N2O + N2). Research indicates that TC plays a key role in controlling denitrification potential. Correlations were observed between daily N2O flux rates and TC in an alpine grassland[10]. The nature and quantity of soil organic carbon likely exert strong effects on the composition and activity of soil microorganisms. Kou et al.[53] also found that TOC may influence denitrifier activity through its effects on nirK-type denitrifier abundance at the TP alpine steppe soils, and the denitrifier abundance directly determines the denitrification potential in the soil N-related cycles.
-
In summary, this study sheds light on the scale-dependent drivers that govern denitrification potential within Chinese grassland ecosystems. These identified environmental factors can serve as singular or limited variables for estimating denitrification potential across diverse grassland ecosystems on a larger scale. Notably, in the XP, the significance of TN and TOC as controlling factors could warrant their greater emphasis within denitrification rate prediction models. However, to enhance predictive accuracy, it is advisable to devise intricate models tailored to specific sub-regions, encompassing a broader spectrum of variables and their temporal dynamics, including factors such as precipitation and temperature. In addition, the present results provide important information for the assessment of the consequences of global changes on denitrification potential in specific ecosystems or sub-regions. For instance, within the IMP steppe, MAP emerged as the pivotal controlling variable for denitrification potential, indicating a heightened sensitivity of this sub-region to climate fluctuations. Meanwhile, TN demonstrated superior explanatory power for denitrification potential within the LP. This insight suggests that Loess Plateau soils might display heightened vulnerability to nitrogen deposition compared to other sub-regions. While this study focuses on environmental drivers, microbial functional gene dynamics were not explicitly analyzed. Future work will examine how microbial activity and functional genes shape denitrification potential in China's grassland ecosystems. Overall, this study advances our comprehension of denitrification potential prediction and the intricate interplay between global changes and N2O emissions.
-
It accompanies this paper at: https://doi.org/10.48130/ebp-0025-0007.
-
Not applicable.
-
The authors confirm contributions to the paper as follows: study conception and design: Qin S, Yuan D; data collection, analysis and interpretation of results: He X, Yuan D; draft manuscript preparation: Yuan D, He X, Clough TJ, Hu C, Li X, Yao M. All authors reviewed the results and approved the final version of the manuscript.
-
All data generated or analyzed during this study are included in this published article and its supplementary information files.
-
This work was supported by the Natural Science Foundation of Hebei Province (D2022503014), the Hebei Province Central Guide Local Science and Technology Development Fund Project (246Z4206G), the China Postdoctoral Science Foundation (2025M772517), the Postdoctoral Fellowship Program of CPSF (GZC20251630), and the Backbone Talent Project of the Yanzhao Golden Platform for Talent Attraction in Hebei Province (Postdoctoral Platform) (B2025005034).
-
The authors declare that they have no conflict of interest.
-
# Authors contributed equally: Dan Yuan, Xiaodong He
Full list of author information is available at the end of the article. - Supplementary Table S1 Physical and chemical properties of steppe soil.
- Supplementary Table S2 The correlation of environmental factors on the emission rate of N2 by Spearman correlation analysis at both regional scale (all regions) and sub-regional scale (LP, IMP and XP).
- Supplementary Table S3 The correlation of environmental factors on the ratio of N2O/(N2O + N2) rate by Spearman correlation analysis at both regional scale (all regions) and subregional scale (Loess Plateau steppe, Inner Mongolia Plateau and Xizang Plateau).
- Supplementary Table S4 The roles of all factors (including geographical distance, environmental variables and Naddition) on the ratio of N2O reduction rate evaluated by stepwise multiple regression modeling at the regional scale (all regions) and sub-regional scales (LP, IMP and XP).
- Supplementary Table S5 The roles of all factors (including geographical distance, environmental variables and Naddition) on the ratio of N2O/( N2O+ N2) rate evaluated by stepwise multiple regression modeling at the regional scale (all regions) and sub-regional scales (LP, IMP and XP).
- Supplementary Fig. S1 Standardized coefficient direct, indirect and total effects derived from the PLS-PMs of soil N2O emission rates in all sampling sites at regional scale (a), and at sub-regional scale LP (b), IMP (c) and TP (d). LP-Loess Plateau, IMP- Inner Mongolia Plateau, XP - Xizang Plateau.
- Supplementary Fig. S2 Standardized coefficient direct, indirect and total effects derived from the PLS-PMs of soil N2O reduction rates in all sampling sites at regional scale (a), and at sub-regional scale LP (b), IMP (c) and TP (d). LP-Loess Plateau, IMP- Inner Mongolia Plateau, XP - Xizang Plateau.
- Supplementary Fig. S3 Standardized coefficient direct, indirect and total effects derived from the PLS-PMs of soil N2O/(N2O+N2) ratio in all sampling sites at regional scale (a), and at sub-regional scale LP (b), IMP (c) and TP (d). LP-Loess Plateau, IMP- Inner Mongolia Plateau, XP - Xizang Plateau.
- Copyright: © 2025 by the author(s). Published by Maximum Academic Press, Fayetteville, GA. This article is an open access article distributed under Creative Commons Attribution License (CC BY 4.0), visit https://creativecommons.org/licenses/by/4.0/.
-
About this article
Cite this article
Yuan D, He X, Clough TJ, Hu C, Li X, et al. 2025. Patterns and drivers of soil denitrification and its responses to nitrogen addition in steppe ecosystems. Environmental and Biogeochemical Processes 1: e008 doi: 10.48130/ebp-0025-0007 

Patterns and drivers of soil denitrification and its responses to nitrogen addition in steppe ecosystems
- Received: 27 June 2025
- Revised: 14 August 2025
- Accepted: 08 September 2025
- Published online: 21 October 2025
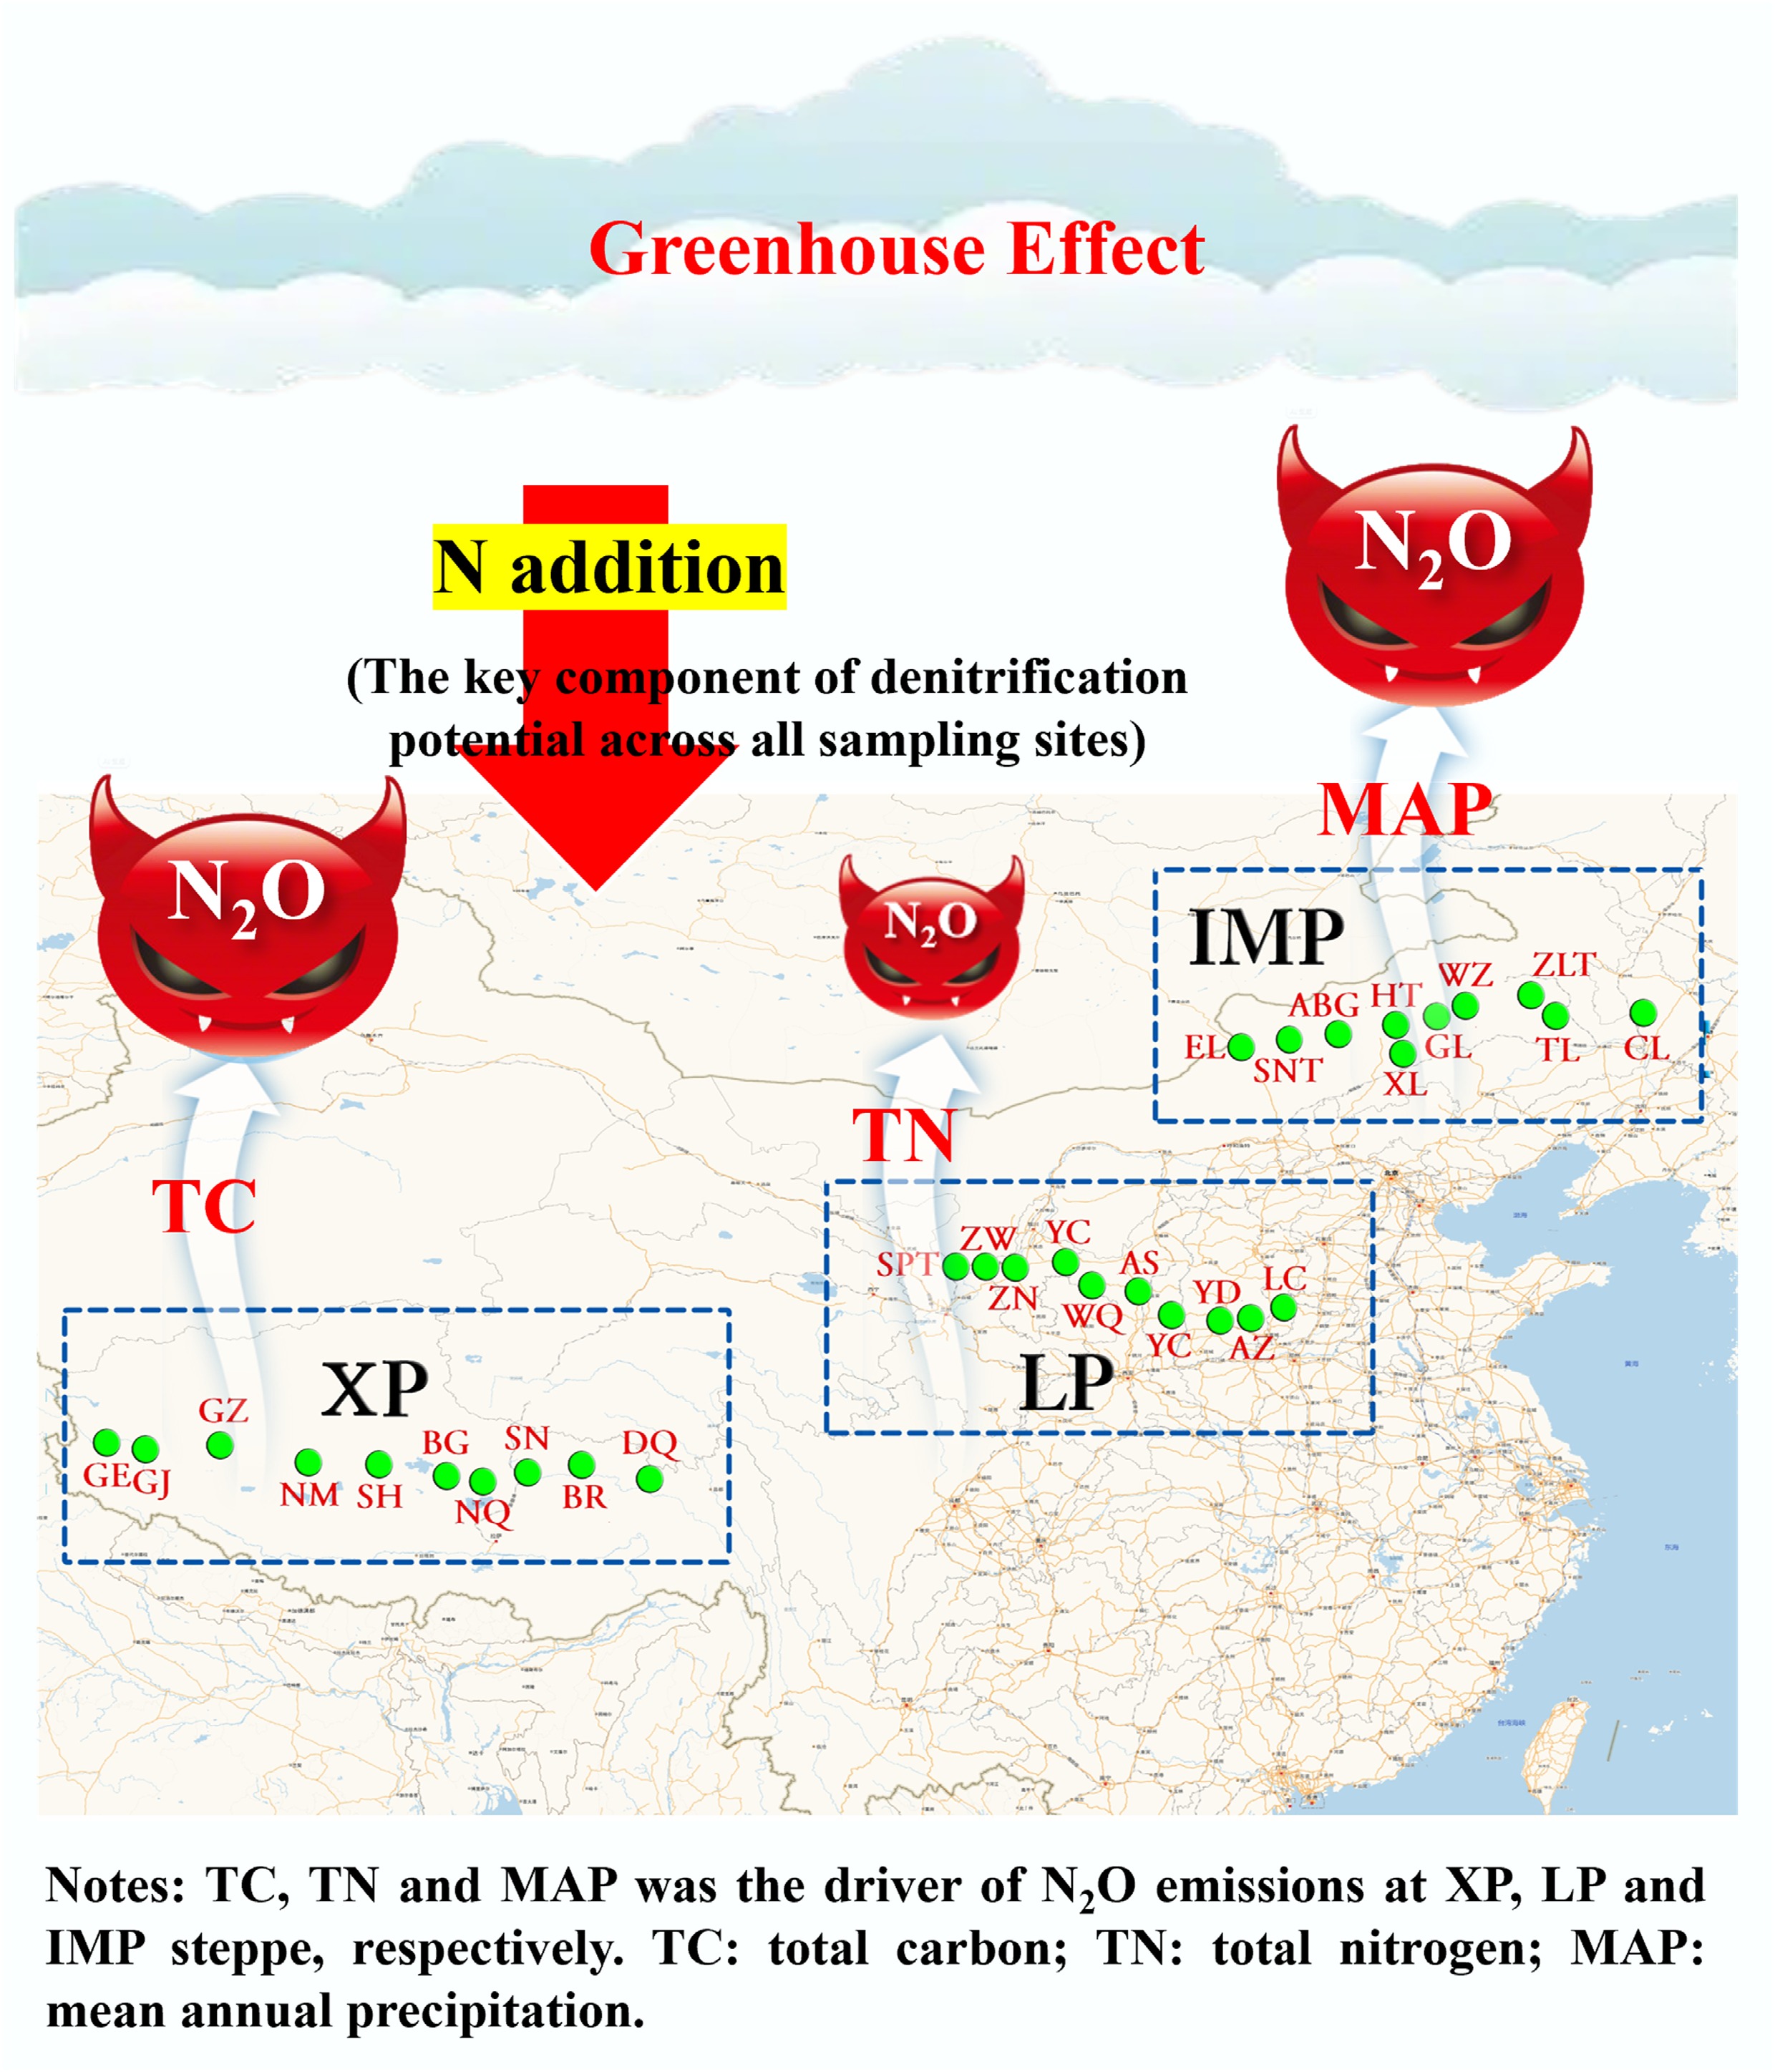
Abstract: Soil denitrification, a pivotal microbial process responsible for ecosystem nitrogen loss and the emission of the greenhouse gas nitrous oxide (N2O), is intricately influenced by climate conditions and inherent soil properties. Despite the importance of denitrification, there is a lack of information regarding the dominant environmental factors driving denitrification rates in steppe ecosystems, especially at regional and sub-regional geographical scales. The Eurasian steppe is the largest steppe region in the world and is a crucial component of the global grassland ecosystem. To address this gap, a comprehensive examination was conducted across three regions of the Eurasian steppe: the Loess Plateau (LP), the Inner Mongolian Plateau (IMP), and the Xizang Plateau (XP). The denitrification potential (encompassing N2O and N2 emissions) of sampled soils was evaluated. This denitrification potential was delineated based on regional and sub-regional attributes. While total nitrogen (TN) was the overarching determinant of denitrification potential at the regional scale, a more granular assessment revealed soil total carbon (TC), mean annual precipitation (MAP), and TN as pivotal contributors to the observed variance in denitrification potential across the steppe regions. Notably, N addition directly significantly regulates N2O emissions, a key component of denitrification potential across all sampling sites. This study enhances our understanding of factors governing denitrification potential and, consequently, N2O emissions in steppe soils: as the world experiences climatic shifts characterized by warming and increased humidity, these insights assume heightened relevance. The results indicate that steppes are poised to amplify denitrification processes and consequential N2O emissions. Importantly, as nitrogen deposition increases globally, regions with intrinsic nitrogen sensitivities, exemplified by areas like the XP, may experience a disproportionate surge in N2O emissions. This underscores the pressing need for targeted interventions and mitigation strategies in such vulnerable regions.
-
Key words:
- N2O emission /
- N2O/(N2O + N2) /
- Environmental factor /
- Chinese steppe /
- PLS path modeling